Global Financial Crisis and Recession: Impact on Africa ... · Africa and the Global Macroeconomic...
50
Global Financial Crisis and Recession: Impact on Africa and Development Prospects By Jean-Claude Maswana JICA-Research Institute Task Force on Africa Meeting, Pretoria, South Africa Jul 9-10, 2009
Transcript of Global Financial Crisis and Recession: Impact on Africa ... · Africa and the Global Macroeconomic...
Global Financial Crisis and Recession: Impact on Africa and
Development Prospects
ByJean-Claude Maswana
JICA-Research Institute
Task Force on Africa Meeting, Pretoria, South Africa
Jul 9-10, 2009

Photo Icons with motivesAims & Scope
(1) Investigating the likely impact of the global financial and economic crisis on African economic development; (2) Exploring the likely consequences on Africa of
recovery packages and adjustment measures put in place by developed countries; (3) Providing a set of options and policy
recommendations to African policymakers as well as international donors. Focus: Botswana, Cameroon, Cote d’Ivoire, DRC, Ghana,
Kenya, Mauritius, Nigeria, Senegal, South-Africa,Tanzania, Zambia).

Aims
Our investigation is based on two premises:-Foundations of the pre-crisis growth is likely to be different than the post-crisis one as the result of de-leveraging processand global re-balancing efforts. -Stimulus packages adopted by developed economies may impart unintended effect son Africa’s fragile economic growth.
Early assessments indicate that the crisis could undermine decades of progress.

Africa and the Global Macroeconomic Imbalances
The pace of the downturn has been confounding the forecasters.
Initially it was hoped that African economies, immune as they were from the direct fallout of the subprime meltdown, would sail through the crisis.
African economies implicitly participated and benefited from key features of the global imbalances such as excess liquidity, US frugality, China’s excess foreign reserve and its hunger for raw materials which led to soaring commodityprices.

1
2
3
Underlying causes of the global financial crisis
Implications on African economic growth
Transmission Channel Empirics
Outline
4 Unintended macroeconomic Effects
5 Way forward

1
Underlying Causes of the Global Financial Crisis
1234
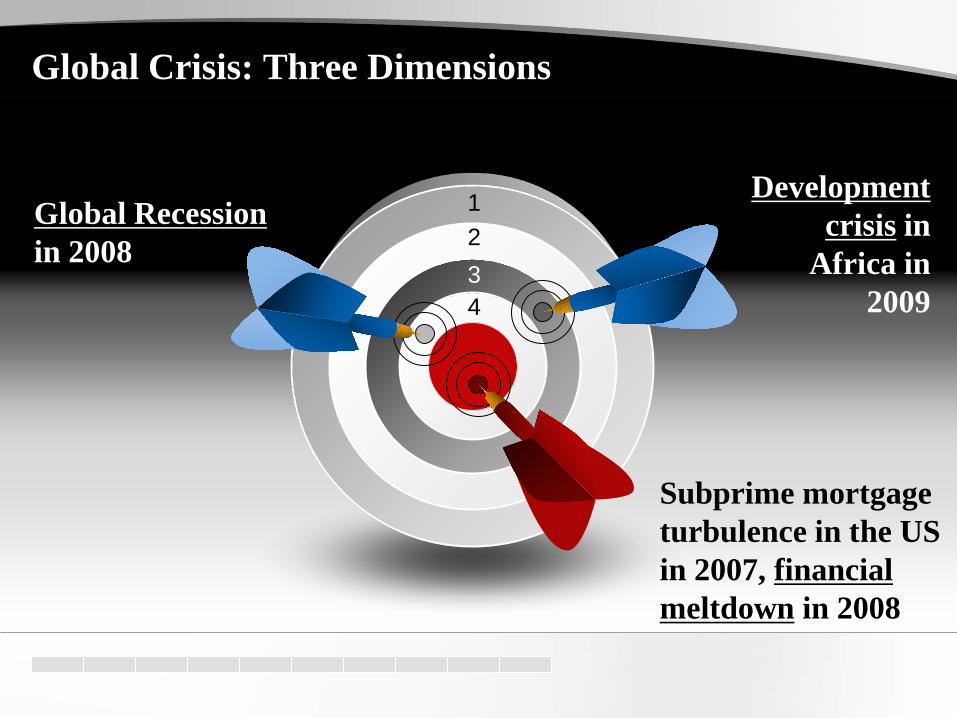
Global Recessionin 2008
Development crisis in
Africa in 2009
Subprime mortgage turbulence in the US in 2007, financial meltdown in 2008
Global Crisis: Three Dimensions

Global saving imbalances– U.S. current account deficit recently as high as 6% of U.S. GDP!
Financing provided by capital inflows from Asian countries and oil exporters;
– Implication: infusion of liquidity into international financial system, searching for yield.
Low interest rates– Lowest interest rates on 30-year record due to agressive U.S. monetary policy;– Implicaton: incentives to borrow for those who would normally never be able
to afford it.Triggers & Transmission
– The bubble bursts (2007): Subprime borrowers begin defaulting on their mortgages, when the oil price started to increase;
– Credit crunch (2008): Lenders stop lending, afraid of losses; borrowers with good credit start defaulting on mortgages;
– Contagion effect – a lack of confidence spread from the narrow MBS (mortgage-backed securities) segment to the wider ABS (asset-backed securities) segment.
Structural Vulnerabilities and TriggersC
ause
s
9
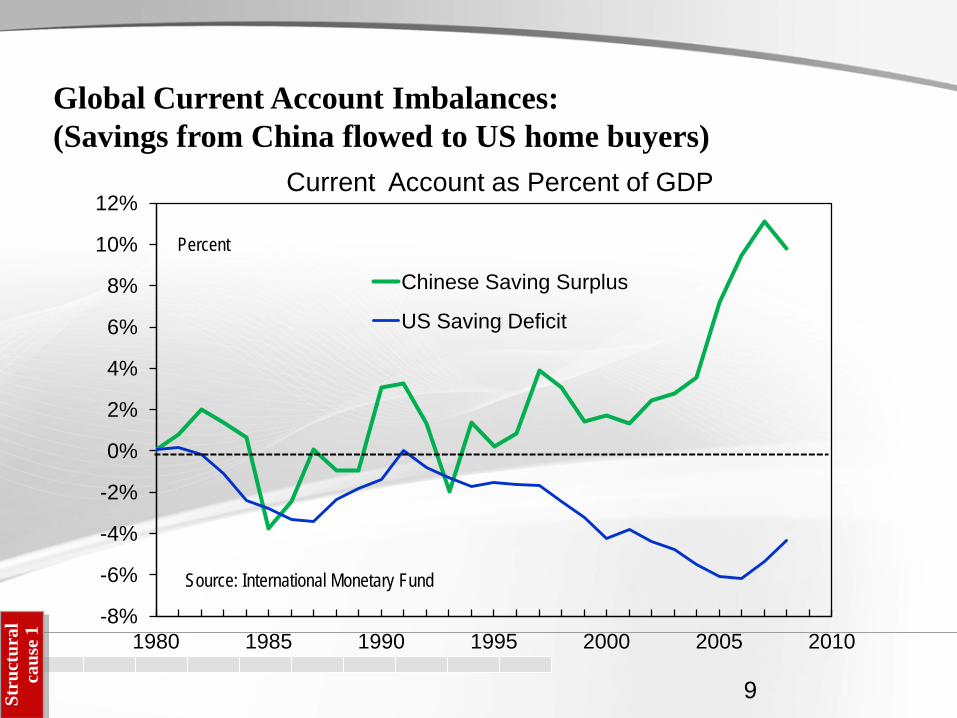
Global Current Account Imbalances: (Savings from China flowed to US home buyers)
-8%
-6%
-4%
-2%
0%
2%
4%
6%
8%
10%
12%
1980 1985 1990 1995 2000 2005 2010
Current Account as Percent of GDP
Chinese Saving Surplus
US Saving Deficit
Percent
Source: International Monetary Fund
Stru
ctur
al
caus
e 1

Frenetic increase in the trading of currencies, equities, bonds, debtsecurities, financial derivatives and other complex financialinstruments.In recent years, 44% of firm profits in the US come from financialsector with only 10% from manufacturing.
Financialization
Stru
ctur
al
caus
e 2
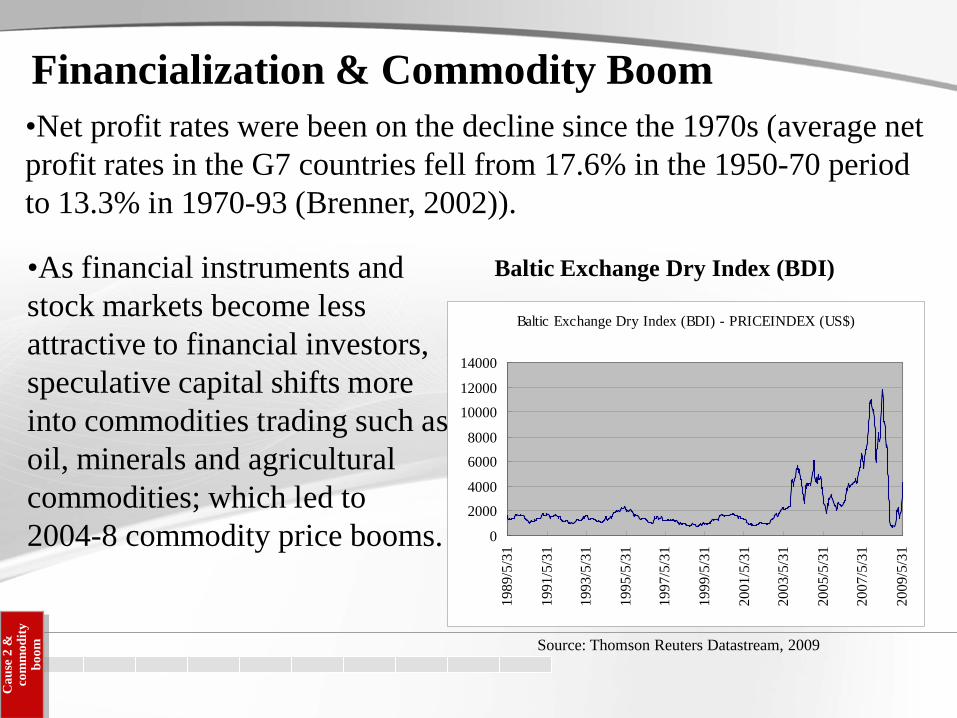
Baltic Exchange Dry Index (BDI)
Baltic Exchange Dry Index (BDI) - PRICEINDEX (US$)
0
2000
4000
6000
8000
10000
12000
14000
1989
/5/3
1
1991
/5/3
1
1993
/5/3
1
1995
/5/3
1
1997
/5/3
1
1999
/5/3
1
2001
/5/3
1
2003
/5/3
1
2005
/5/3
1
2007
/5/3
1
2009
/5/3
1
Source: Thomson Reuters Datastream, 2009
•As financial instruments and stock markets become less attractive to financial investors, speculative capital shifts more into commodities trading such as oil, minerals and agricultural commodities; which led to 2004-8 commodity price booms.
Financialization & Commodity Boom•Net profit rates were been on the decline since the 1970s (average net profit rates in the G7 countries fell from 17.6% in the 1950-70 period to 13.3% in 1970-93 (Brenner, 2002)).
Cau
se 2
&
com
mod
ity
boom
Implications on African
Economic Growth
2

Change in S&P BMI – Price IndexFi
nanc
e
0
0.5
1
1.5
2
2.5
3
1995
/7/6
1996
/1/6
1996
/7/6
1997
/1/6
1997
/7/6
1998
/1/6
1998
/7/6
1999
/1/6
1999
/7/6
2000
/1/6
2000
/7/6
2001
/1/6
2001
/7/6
2002
/1/6
2002
/7/6
2003
/1/6
2003
/7/6
2004
/1/6
2004
/7/6
2005
/1/6
2005
/7/6
2006
/1/6
2006
/7/6
2007
/1/6
2007
/7/6
2008
/1/6
2008
/7/6
2009
/1/6
S&P BOTSWA BMI - PRICE INDEX ("2007/1/4"=1) S&P COTE D'IVOIRE BMI - PRICE INDEX ("2007/1/4"=1)
S&P KENYA BMI - PRICE INDEX ("2007/1/4"=1) S&P MAURITIUS BMI - PRICE INDEX ("2007/1/4"=1)
S&P NIGERIA BMI - PRICE INDEX ("2007/1/4"=1) S&P SOUTH AFRICA BMI - PRICE INDEX ("2007/1/4"=1)
Source: Thomson Reuters Datastream, 2009
In South Africa the financial sector experienced a collapse of asset prices, Between May 2008 and March 2009, South Africa’s JALSH index has fallen by about 46 percent.

Stock Market Trend
Lagos SEM
0200400600800
10001200
2001
M01
2001
M07
2002
M01
2002
M07
2003
M01
2003
M07
2004
M01
2004
M07
2005
M01
2005
M07
2006
M01
2006
M07
2007
M01
2007
M07
2008
M01
2008
M07
2009
M01
Stock market index
Fina
nce
Banking Sector
African banks have primarily felt the impact of the global financial crisis indirectly through higher funding costs. Beyond the specific of crisis transmission, African banks are still
allowing credit to flow, although much stricter lending criteria are being applied by banks. Unlike in Europe and the US, interbank market has been working
normally in South Africa, the capital adequacy ratios are strong, and no bank has had to approach the South African Reserve Bank for any extraordinary assistance.
Bna
ks
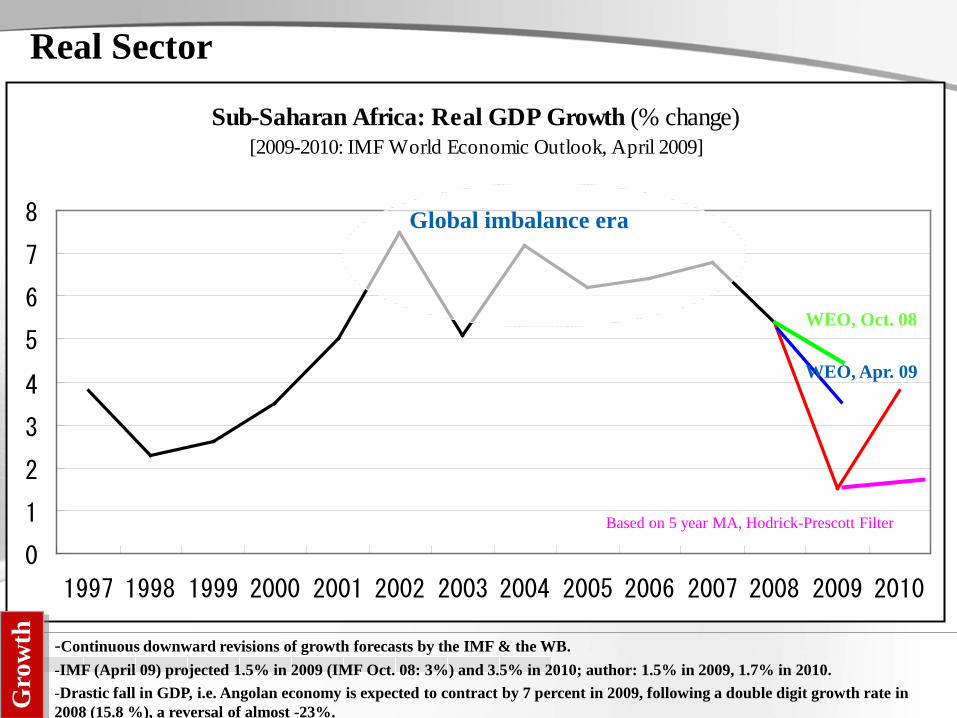
Sub-Saharan Africa: Real GDP Growth (% change)[2009-2010: IMF World Economic Outlook, April 2009]
0
1
2
3
4
5
6
7
8
1997 1998 1999 2000 2001 2002 2003 2004 2005 2006 2007 2008 2009 2010
Global imbalance era
-Continuous downward revisions of growth forecasts by the IMF & the WB.-IMF (April 09) projected 1.5% in 2009 (IMF Oct. 08: 3%) and 3.5% in 2010; author: 1.5% in 2009, 1.7% in 2010.-Drastic fall in GDP, i.e. Angolan economy is expected to contract by 7 percent in 2009, following a double digit growth rate in 2008 (15.8 %), a reversal of almost -23%.
WEO, Oct. 08
WEO, Apr. 09
Gro
wth
Based on 5 year MA, Hodrick-Prescott Filter
Real Sector

Sub-Saharan Africa Forecast Summary (annual % change)
One of the major impacts of the crisis for Africa is the expected drastic reduction in fixed investment (see Table 01) of 2.6% in 2009. Another source of concern is the pattern of import-export which shows that the growth in imports has been consistently higher than that of exports (a pattern which is a big contrast with Asian emerging economies) and the two aggregates are expected to uniformly growth in 2009.
1995–2005*a 2006 2007 2008 2009*b 2010*b 2011*b
GDP per capita (in $) 1.3 3.5 3.8 2.8 -0.9 1.8 3.2
PPP GDP*d 3.9 6.3 6.6 5.1 1.1 3.9 5.4
Private consumption 2.7 6.5 7.1 3.3 0.8 3.5 4.7
Public consumption 5.3 6.0 6.2 5.8 5.5 6.1 5.8
Fixed investment 7.4 18.7 20.5 12.4 -2.6 3.9 7.7
Exports, GNFS*e 4.8 5.1 4.1 4.7 -3.2 4.2 6.4
Imports, GNFS*e 6.2 12.7 11.9 6.6 -3.0 4.7 7.3
CFA countries 4.1 2.2 3.5 4.2 2.3 3.6 4.8
Source: Global Development Finance 2009, World BankGro
wth

Africa-East-Asia-US Trade Chains (% change from previous year)
1999 2000 2001 2002 2003 2004 2005 2006 2007African exports
to China 95% 144% -18% 17% 93% 54% 52% 50% 30%Chinese exports
to USA 10% 24% -4% 28% 32% 35% 30% 24% 16%
Gro
wth
African Exports and Global Trade Chains
•African economic growth driven by and coupled with China’s via exports.
•With China acting as a middle-man in the Global Value Chains leading to the US market, African exports to China remain dependent on the Chinese exports to the US.
•A fall in Chinese exports to the US likely to worsen African exports and economic growth prospects.
Balance of Payments Balance of Payments have deteriorated with export growth rate expected
to drop by 7% and import growth rate to decline by 5%. F following a sharp contraction in mineral and primary commodity demand
in the US, EU, Japan and China, exports and tourism receipts are falling; leaving many countries facing twin deficits (current account and budget deficits). With exports declining faster than imports, the trade balance has
deteriorated in most countries. In many countries, exports for 2009 and 2010 have been revised downwards by about 40 percent. From a comfortable overall current account surplus of 2.7 per cent of GDP for both 2008 and 2007, African region will record an overall deficit of 4.3 per cent of GDP in 2009, according to the OECD (2009) projections.
Ext
erna
l
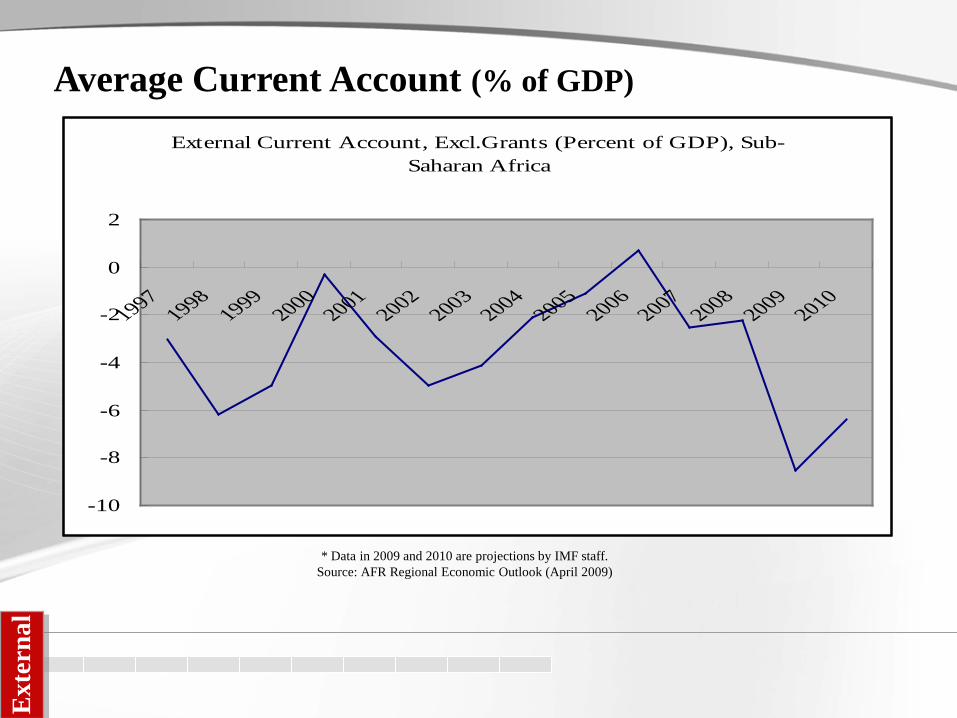
External Current Account, Excl.Grants (Percent of GDP), Sub-Saharan Africa
-10
-8
-6
-4
-2
0
2
19971998
19992000
20012002
20032004
20052006
20072008
20092010
Average Current Account (% of GDP)
* Data in 2009 and 2010 are projections by IMF staff.Source: AFR Regional Economic Outlook (April 2009)
Ext
erna
l

External AccountExternal Current Account (% of GDP)
-40
-30
-20
-10
0
10
20
1997 1998 1999 2000 2001 2002 2003 2004 2005 2006 2007 2008 2009 2010
Botswana DRC Ghana Kenya Nigeria Zambia
Ext
erna
l

Average Current account balance (% of GDP)
Surplus Deficit
AverageGeometric
Mean AverageGeometric
MeanBotswana 10.66 10.43 Cameroon -3.47 -3.48
Cote d'Ivo. 2.11 2.08 Ghana -5.99 -6.18 Nigeria 12.17 11.90 Kenya -1.48 -1.50
Mauritius -2.55 -2.68 Senegal -7.15 -7.16 South Africa -3.55 -3.59 Tanzania -5.09 -5.18 Zambia -8.07 -8.24
Source: Author’s calculation based on the data from World Development Indicators Online (WDI), World Bank
Ext
erna
l
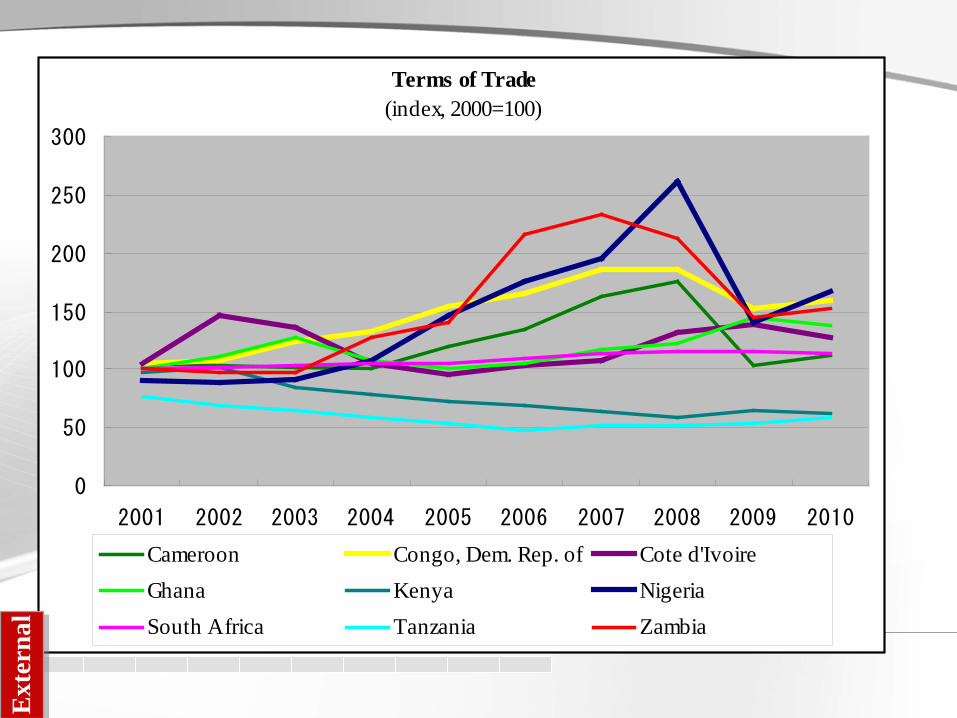
Terms of Trade(index, 2000=100)
0
50
100
150
200
250
300
2001 2002 2003 2004 2005 2006 2007 2008 2009 2010
Cameroon Congo, Dem. Rep. of Cote d'IvoireGhana Kenya NigeriaSouth Africa Tanzania Zambia
Ext
erna
l
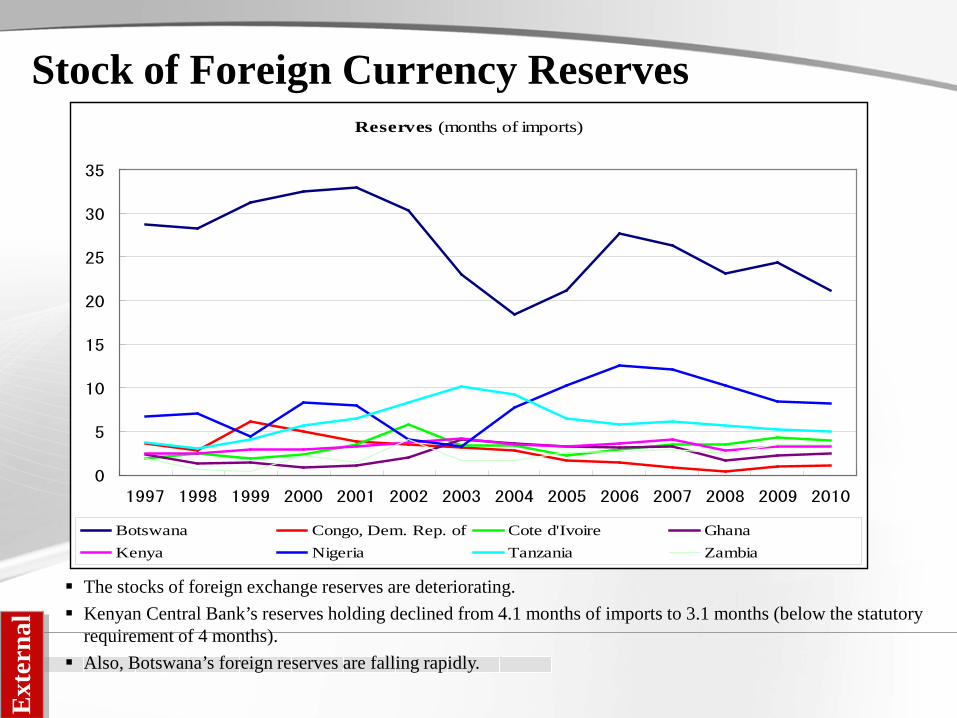
Stock of Foreign Currency ReservesReserves (months of imports)
0
5
10
15
20
25
30
35
1997 1998 1999 2000 2001 2002 2003 2004 2005 2006 2007 2008 2009 2010
Botswana Congo, Dem. Rep. of Cote d'Ivoire GhanaKenya Nigeria Tanzania Zambia
The stocks of foreign exchange reserves are deteriorating. Kenyan Central Bank’s reserves holding declined from 4.1 months of imports to 3.1 months (below the statutory
requirement of 4 months). Also, Botswana’s foreign reserves are falling rapidly.
Ext
erna
l
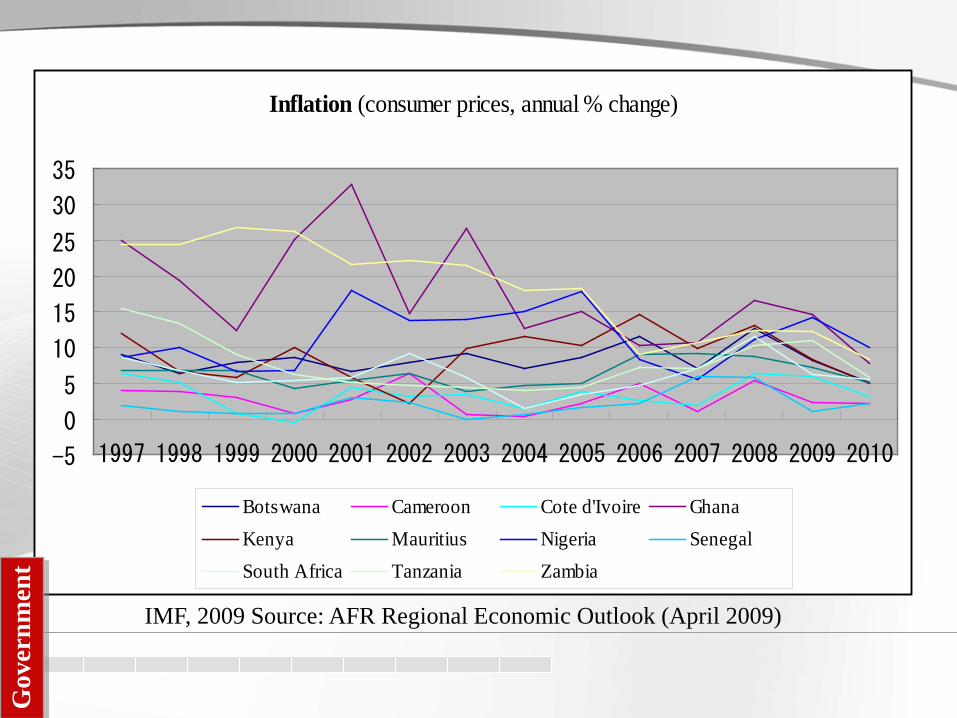
Inflation (consumer prices, annual % change)
-5
0
5
10
15
20
25
30
35
1997 1998 1999 2000 2001 2002 2003 2004 2005 2006 2007 2008 2009 2010
Botswana Cameroon Cote d'Ivoire GhanaKenya Mauritius Nigeria SenegalSouth Africa Tanzania Zambia
IMF, 2009 Source: AFR Regional Economic Outlook (April 2009)
Gov
ernm
ent

Overall External Vulnerability
Botswana
CameroonCongo, Dem. Rep.
Cote d'Ivoire
Ghana
Kenya
Mauritius
Nigeria
Senegal
South AfricaTanzania
Zambia
Current AccountDeterioration
External DebtMounting
Foreign ExchangeReserve Scarcity
Vulnerabilities remain in countries with triple rapid deterioration: current account, External debt and foreign reserve depletion.
Mauritius, Tanzania, Ghana, countries with very high, and increasing, external debt ratiosare facing a deteriorated perception of risk, e ven in the context of significant reserve accumulation.
Ext
erna
l

Other Developments
Except for the DRC and Nigeria, inflation is expected to be lower in 2009; which is consistent with the world trend.
Debt serving has become complex because of exchange rate volatility and uncertainty;
As
Deterioration in external balances results in worsening of public budget condition for an increasing number of countries;
Gov
ernm
ent
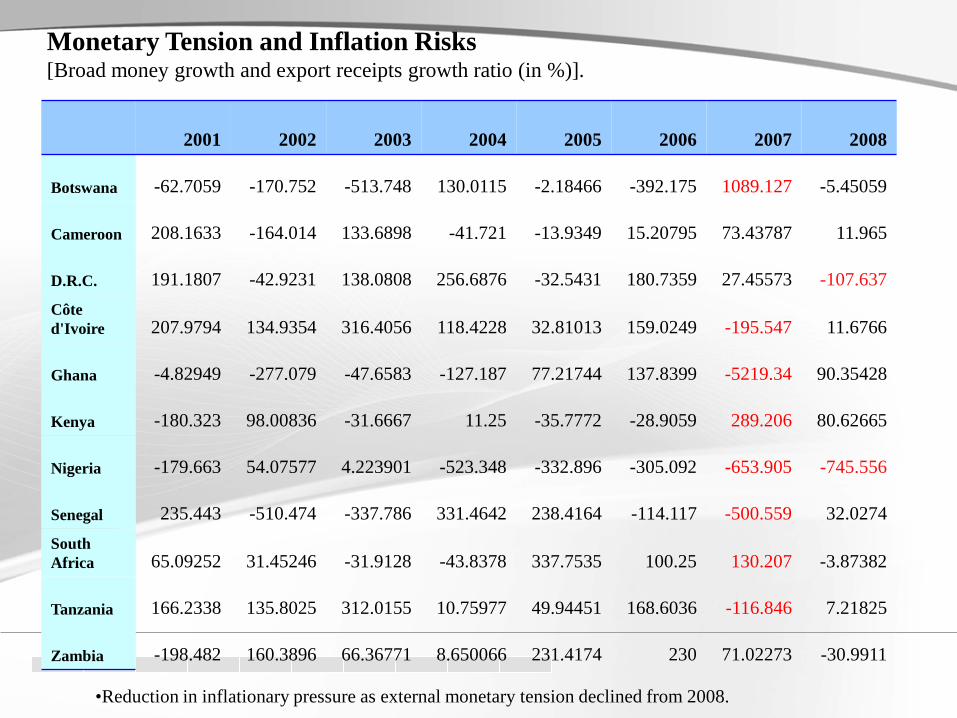
Monetary Tension and Inflation Risks[Broad money growth and export receipts growth ratio (in %)].
2001 2002 2003 2004 2005 2006 2007 2008
Botswana -62.7059 -170.752 -513.748 130.0115 -2.18466 -392.175 1089.127 -5.45059
Cameroon 208.1633 -164.014 133.6898 -41.721 -13.9349 15.20795 73.43787 11.965
D.R.C. 191.1807 -42.9231 138.0808 256.6876 -32.5431 180.7359 27.45573 -107.637Côte d'Ivoire 207.9794 134.9354 316.4056 118.4228 32.81013 159.0249 -195.547 11.6766
Ghana -4.82949 -277.079 -47.6583 -127.187 77.21744 137.8399 -5219.34 90.35428
Kenya -180.323 98.00836 -31.6667 11.25 -35.7772 -28.9059 289.206 80.62665
Nigeria -179.663 54.07577 4.223901 -523.348 -332.896 -305.092 -653.905 -745.556
Senegal 235.443 -510.474 -337.786 331.4642 238.4164 -114.117 -500.559 32.0274South Africa 65.09252 31.45246 -31.9128 -43.8378 337.7535 100.25 130.207 -3.87382
Tanzania 166.2338 135.8025 312.0155 10.75977 49.94451 168.6036 -116.846 7.21825
Zambia -198.482 160.3896 66.36771 8.650066 231.4174 230 71.02273 -30.9911
•Reduction in inflationary pressure as external monetary tension declined from 2008.

Remittance Flows & Unemployment
Rising Unemployment Falling Remittances Falling Tourism Revenues
Unemployment is rising as the result of laying off in export oriented industries. In the DRC, 100,000 workers lost jobs following mining firms leaving the country. 80,000 workers in Zambia’s copper belt.
Remittances are rapidly declining since rising unemployment in EU is compressing the demand for migrant and low skill work force. The estimated $15 billion in remittances sent to Africa each year are expected to decline in 2009.
In Kenya, remittances steadily falling since October 2008 from US$ 61 mio. to US$ 39 mi. in Jan. 2009. Tourism receipts were down 13 percent in the 4th quarter of 2008 compared to 2007.
Cap
ital F
low
s
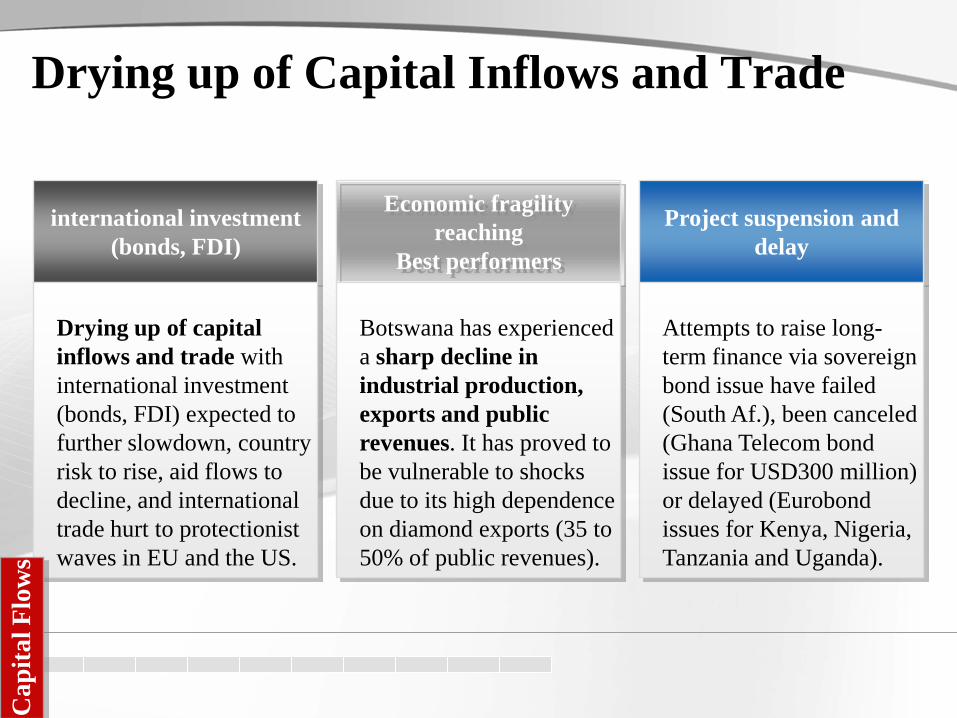
Drying up of Capital Inflows and Trade
international investment (bonds, FDI)
Economic fragility reaching
Best performers
Project suspension and delay
Drying up of capital inflows and trade with international investment (bonds, FDI) expected to further slowdown, country risk to rise, aid flows to decline, and international trade hurt to protectionist waves in EU and the US.
Botswana has experienced a sharp decline in industrial production, exports and public revenues. It has proved to be vulnerable to shocks due to its high dependence on diamond exports (35 to 50% of public revenues).
Attempts to raise long-term finance via sovereign bond issue have failed (South Af.), been canceled (Ghana Telecom bond issue for USD300 million) or delayed (Eurobond issues for Kenya, Nigeria, Tanzania and Uganda).
Cap
ital F
low
s

Capital InflowsForeign direct investment, net inflows (% of GDP)
2000 2001 2002 2003 2004 2005 2006 2007
Botswana 92.56 36.69 679.92 504.97 397.84 265.01 441.91 -23.20
Cameroon 157.62 76.35 553.09 161.33 54.25 147.31 9.12 209.37
Congo, D. R. 385.30 164.55 246.55 569.57 15.10 -107.02 -135.74 804.17
Côte d'Ivoire 225.31 258.58 185.11 120.36 182.79 190.62 183.60 215.65
Ghana 333.30 168.20 95.62 179.36 156.98 135.23 500.20 640.64
Kenya 87.39 4.08 21.00 54.84 28.62 11.30 22.54 300.84
Mauritius 594.37 -60.98 70.50 119.34 18.41 66.08 166.32 499.39
Nigeria 247.94 248.05 317.01 296.41 213.33 179.37 370.77 367.85
Senegal 134.14 65.49 146.33 76.55 95.93 51.33 237.48 69.86
South Africa 72.91 613.64 66.31 46.99 32.47 269.13 -7.14 203.03
Tanzania 510.39 411.82 397.21 299.72 291.24 349.35 421.04 399.84
Zambia 375.76 197.14 815.37 420.68 657.85 485.77 565.65 865.82
Source: World Development Indicators Online (WDI), World Bank
Transmission Channel Empirics
3

Contagion, Co-movement, Interdependence, Market Integration
Our motivation being overwhelmingly practical in nature, we skip the conceptual debate on contagion, interdependence, co-movement and so on, and use interchangeably these terms to mean market and economic integration. The present empiric investigation used output variables (i.e. GDP) rather than
industrial production. The conceptual reasoning behind using industrial production is less convincing in the case of Africa since manufacturing activity represents less than 15 percent of aggregate output while representing even lower portion of African exports; so a priori it would not seem to be representative of total output, stock market price indices, and interest rates. Candidates adverse common shocks with the potential of inflicting balance-of-
payment difficulties, particularly in African economies, are changes in global interest rates, exchange rates between major currencies, commodity prices, or recessions in major industrial countries.
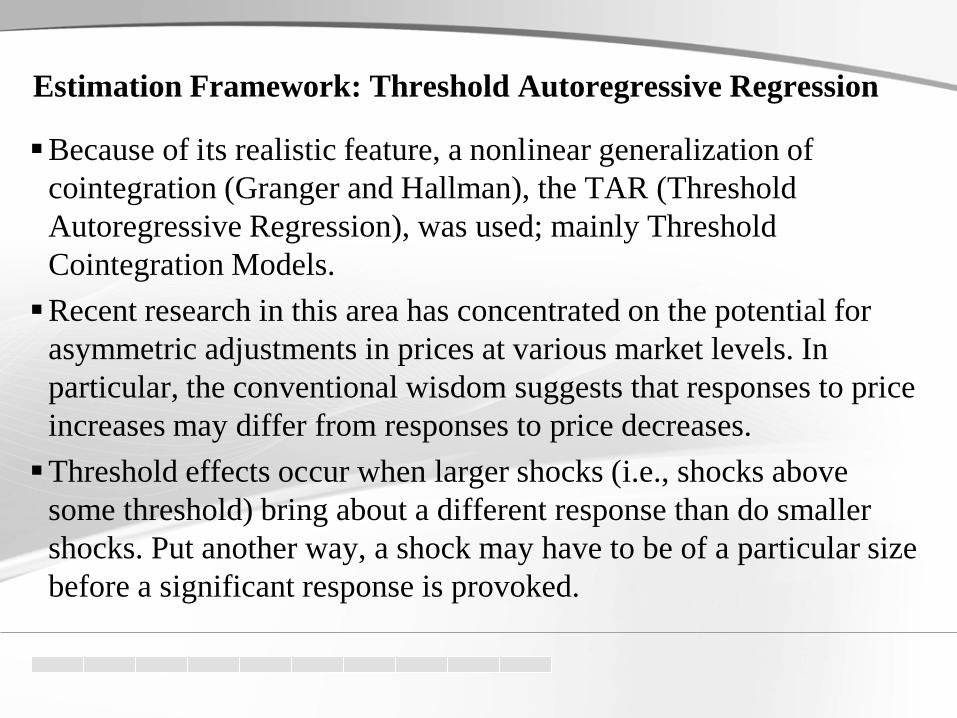
Estimation Framework: Threshold Autoregressive Regression
Because of its realistic feature, a nonlinear generalization of cointegration (Granger and Hallman), the TAR (Threshold Autoregressive Regression), was used; mainly Threshold Cointegration Models. Recent research in this area has concentrated on the potential for
asymmetric adjustments in prices at various market levels. In particular, the conventional wisdom suggests that responses to price increases may differ from responses to price decreases. Threshold effects occur when larger shocks (i.e., shocks above
some threshold) bring about a different response than do smaller shocks. Put another way, a shock may have to be of a particular size before a significant response is provoked.

The second stage focuses on the OLS estimates of (1) and in the following threshold auto-regression model (TAR): , (2) where is the white-noise disturbance and the residuals ut from (1) were substituted into (2)
to obtain better estimates. is the Heaviside indicator function such that if if , where is the threshold value. A necessary condition for to be stationary is:. In either case,
under the null hypothesis of no convergence, the F-statistic for the null hypothesis () has a nonstandard distribution (Enders and Siklos, 2001). Enders and Granger (1998) also show that if the sequence is stationary, the least-squares estimates of and have an asymptotic multivariate normal distribution. In addition, we employed the method of Chan (1993) to estimate the threshold value.
∑=
−−− +∆+−+=∆l
ititittttt uuIuIu
11211 )1( εϕρρ
τ≥−1tu
1tu τ− <
1=tI
0=tI
Estimation Framework: Threshold Autoregressive Regression
ttt ubXaY ++=

Results of TAR TestsThe co-integration results given in Tables A2(a-d) in Appendix
show that the null hypothesis is not rejected in all (but South Africa-UK) the equity equations (which implies the non-existence of a long-term asymmetric co-integration). However, the null hypothesis is rejected in most cases in the GDP relationship and moderately in the current account nexus (which indicates acceptance of the null hypothesis of symmetric adjustment). The main finding is that the different mechanisms by which the
current financial meltdown and economic recession crisis might have spread into Africa via business cycle and trade co-movement rather than financial links.
Estimation Framework: Threshold Autoregressive Regression
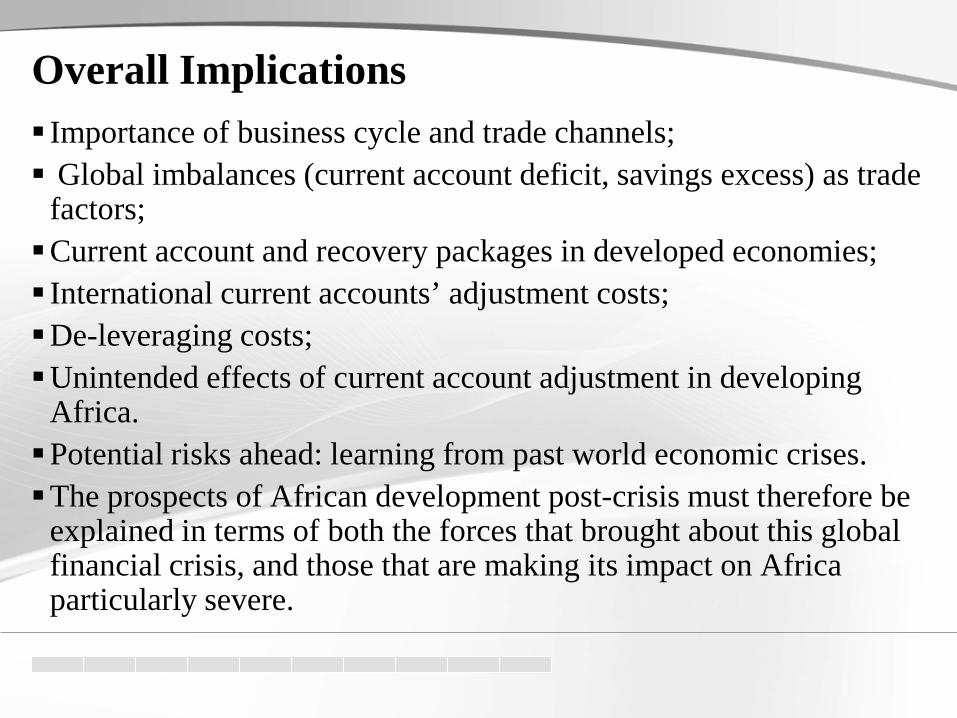
Overall Implications Importance of business cycle and trade channels; Global imbalances (current account deficit, savings excess) as trade
factors;Current account and recovery packages in developed economies; International current accounts’ adjustment costs;De-leveraging costs;Unintended effects of current account adjustment in developing
Africa.Potential risks ahead: learning from past world economic crises.The prospects of African development post-crisis must therefore be
explained in terms of both the forces that brought about this global financial crisis, and those that are making its impact on Africa particularly severe.

Post-past-crisis Performance,
Development Prospects and Risks.
4
Work in Progress
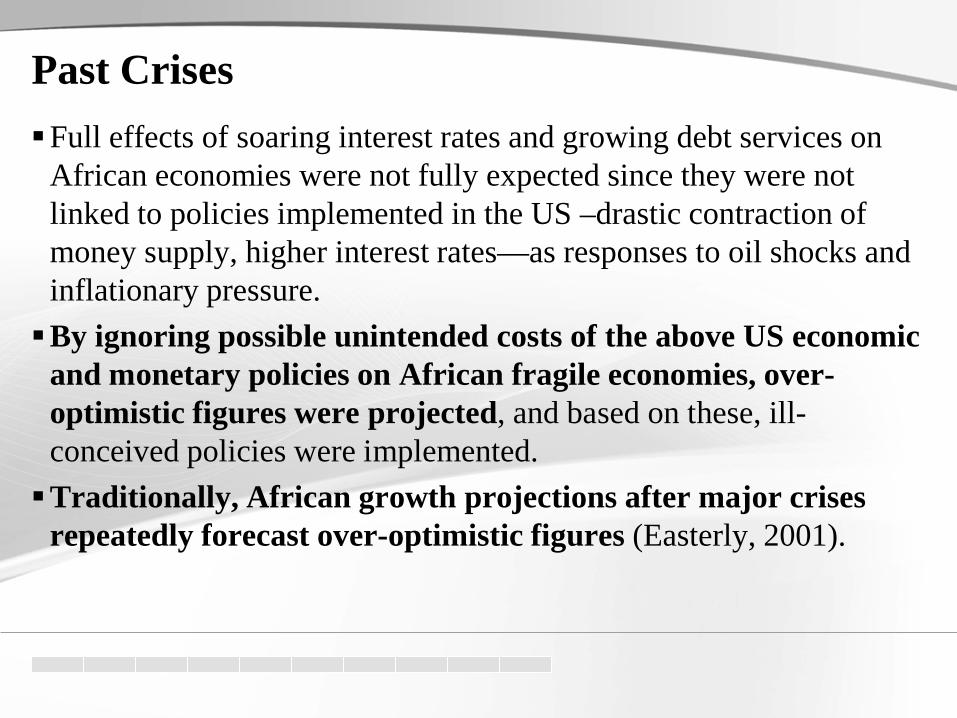
Past CrisesFull effects of soaring interest rates and growing debt services on
African economies were not fully expected since they were not linked to policies implemented in the US –drastic contraction of money supply, higher interest rates—as responses to oil shocks and inflationary pressure. By ignoring possible unintended costs of the above US economic
and monetary policies on African fragile economies, over-optimistic figures were projected, and based on these, ill-conceived policies were implemented. Traditionally, African growth projections after major crises
repeatedly forecast over-optimistic figures (Easterly, 2001).

Post-past-crisis performance, development prospects and risks.
Economic setbacks of the 1970s annihilated the progress of the 1960s and the social devastation went on for two decades. Worldwide factors like the increase in world interest rates… and skill-
biased technical change may have contributed to the developing countries’ stagnation (Easterly, 2001). When fiscal stimulus exceeds a certain level, the financing of deficits is
likely to cause a sharp increase in real longer-term interest rates.A rise in US interest rates adversely affects the funding of developing
economies not only by increasing their debt servicing costs and lowering their creditworthiness (Calvo et al. 1996), but also by exacerbating asymmetric information problems (Mishkin 1997).

Real Interest Rate of United States (%) and GDP growth of Africa (annual %)
-2
0
2
4
6
8
10
1961 1965 1969 1973 1977 1981 1985 1989 1993 1997 2001 2005
(Real
inter
est ra
te of
US)
-2
-1
0
1
2
3
4
5
6
7
8
9
(GDP
grow
th of
SSA)
Real interest rate of United States (%)
GDP growth of Sub-Saharan Africa (annual %)
Source: World Development Indicators Online (WDI), World Bank
There is an inverse correlation between the US Real Interest rates and the SS Africa’sGDP growth rates (-26.74).

Possible Unintended Macroeconomic Effects
Many countries are simultaneously expanding their fiscal deficits; A current account deficit in the fiscal deficit country must be matched by a
current account surplus elsewhere. To bring about this net increase in foreign savings, interest rates must rise to
restore a global equilibrium between world income and expenditure. The net effect will be a shift from current to future expenditure abroad that
exactly matches the shift from future expenditure to current expenditure in the country running the increased fiscal deficit. Since the required adjustment between countries running deficit and surplus
current account is never smooth, there will be some weaker countries caught in between and, unwillingly, facilitating the required adjustment (i.e. via international commodity prices). Required adjustment in countries running current account deficit can take the
form of increases in the efficiency of resource use, which may affect (ex-post) the yield of previously realized investment projects in the booming commodity exports in the current account surplus countries.
プレゼンター
プレゼンテーションのノート

0.70
0.75
0.80
0.85
0.90
0.95
1.00
1.05
1.10
1971 1973 1975 1977 1979 1981 1983 1985 1987 1989 1991 1993 1995 1997 1999 2001 2003 2005
Energy Metals Metals (w/o China) Food
Commodity intensity of GDP, index 1971 = 1
Technological Progress Increases the Efficiency of Resource Use
Source: World Bank, 2009; author estimates.
プレゼンター
プレゼンテーションのノート
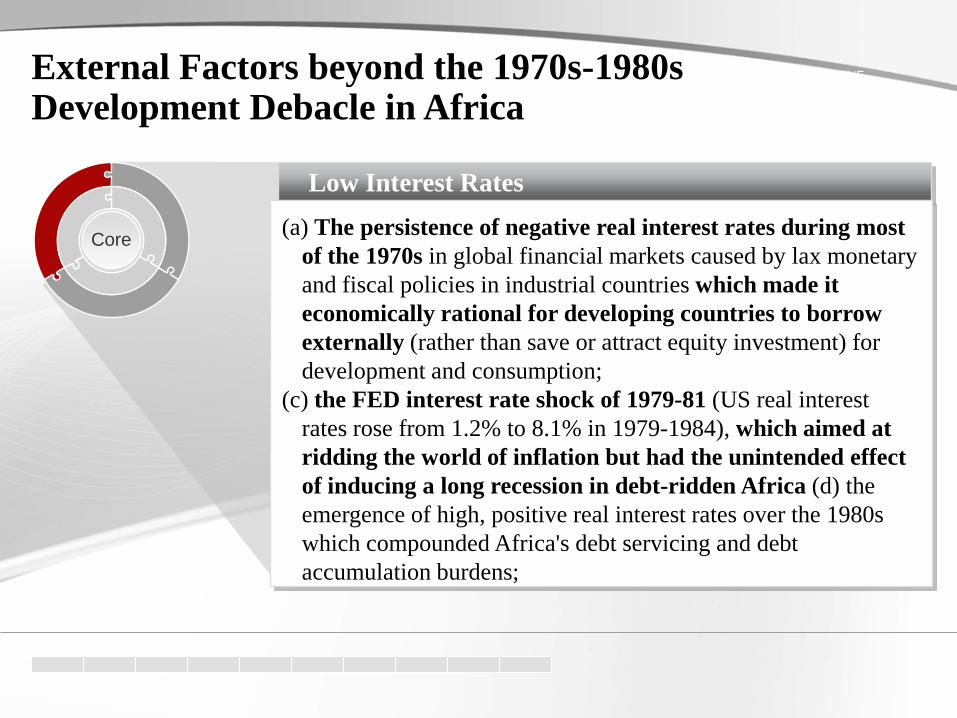
Low Interest Rates(a) The persistence of negative real interest rates during most
of the 1970s in global financial markets caused by lax monetary and fiscal policies in industrial countries which made it economically rational for developing countries to borrow externally (rather than save or attract equity investment) for development and consumption;
(c) the FED interest rate shock of 1979-81 (US real interest rates rose from 1.2% to 8.1% in 1979-1984), which aimed at ridding the world of inflation but had the unintended effect of inducing a long recession in debt-ridden Africa (d) the emergence of high, positive real interest rates over the 1980s which compounded Africa's debt servicing and debt accumulation burdens;
Core
SCENEExternal Factors beyond the 1970s-1980s Development Debacle in Africa

Consumer of last resort
The targeting of developing countries in general, and oil-exporting countries in particular, as major export markets to be provided with too-easy credit to facilitate the adjustment of industrial countries to the two oil-shocks (of 1973 and 1979); Volatile exchange rate movements throughout the 1980s
with US dollar depreciation between 1985-90 resulting in increasing the dollar value of Africa's outstanding debts, over a half of which were denominated in currencies or composites which appreciated against the US dollar;
Core
External Factors beyond the 1970s-1980s Development Debacle in Africa
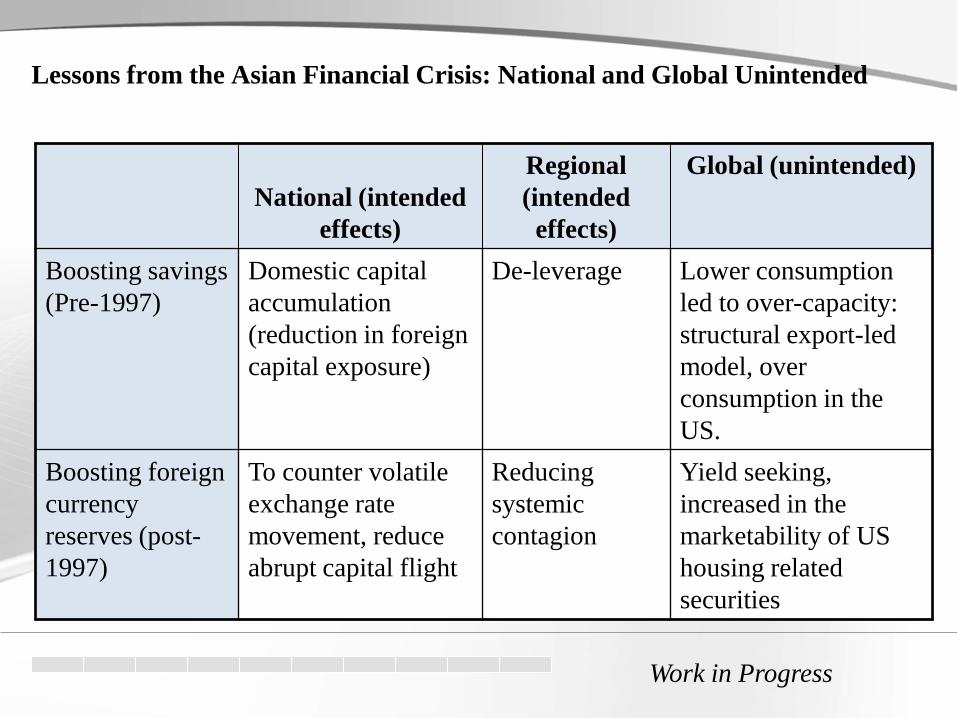
Lessons from the Asian Financial Crisis: National and Global Unintended
National (intended effects)
Regional (intended
effects)
Global (unintended)
Boosting savings(Pre-1997)
Domestic capital accumulation (reduction in foreign capital exposure)
De-leverage Lower consumption led to over-capacity: structural export-led model, over consumption in the US.
Boosting foreign currency reserves (post-1997)
To counter volatile exchange rate movement, reduce abrupt capital flight
Reducing systemic contagion
Yield seeking, increased in the marketability of US housing related securities
Work in Progress

WayForward
5

48
The highest risk for development prospects lies on unintended macroeconomic effects of stimulus measures rather than from the global financial crisis per se.
Throughout Africa poverty may well be on the increase; threatening thus the gains achieved by the MDGs
The basic challenge for Africa thus appears to center less on triggering growth and more on sustaining it.
Taken together the discussion suggests:
Looking to the Future

49
The ongoing crisis is informative in that it tells us that economic imbalances (either in terms of excess or deficit) are harmful to the global economy.
As the high level of savings relative to investment in East Asia is the principal source of global imbalances, re-investing excess savings and foreign reserves in Africa would provide genuine profit opportunities in the real sector, reducing thus the financialization of advanced economies and the inherent financial bubbles.
Solving global imbalance via support to Africa
Looking to the Future

Photo Icons with motives
Thank You Very Much