Global fate and distribution of polycyclic aromatic ... · PDF fileGlobal fate and...
15
Author's personal copy Atmospheric Environment 41 (2007) 8301–8315 Global fate and distribution of polycyclic aromatic hydrocarbons emitted from Europe and Russia Aissa M. Sehili a,b, , Gerhard Lammel b,c a Meteorological Institute, University of Hamburg, ZMAW, Bundesstrasse 55, 20146 Hamburg, Germany b Max Planck Institute for Meteorology, ZMAW, Bundesstrasse 53, 20146 Hamburg, Germany c Research Centre for Environmental Chemistry and Ecotoxicology, Masaryk University, Brno, Czech Republic Received 26 October 2006; received in revised form 12 June 2007; accepted 19 June 2007 Abstract The long-range atmospheric transport (LRT) of polycyclic aromatic hydrocarbons (PAHs) is not fully understood and has hardly been addressed by model studies. By model experiments the LRT of PAH emissions into air from Europe and Russia is studied testing several scenarios of gas–particle partitioning and degradability by reaction with ozone and the hydroxyl and nitrate radicals for two PAHs, benzo[a]pyrene (BAP) and fluoranthene (FLT). The model used is the atmosphere general circulation model ECHAM5 with a dynamic modal aerosol sub-model, HAM, ozone and sulfur species chemistry and bidirectional mass exchange on 2D marine (ocean surface mixed layer) and terrestrial surfaces (top soil layer and vegetation surfaces). After 5 years the substances are found to be mostly distributed to the soil compartment (64–97% as the global mean, varying with substance and season), which after 10 years is still filling; 1–5% are found in air and 2–33% in ocean. It is found that the lifetime and vertical distribution of the substances in the atmosphere and the LRT potential are all significantly influenced by the partitioning and degradation scenario. The total environmental burden is higher when sorption to organic matter and black carbon are considered to determine gas–particle partitioning rather than adsorption to the surface of particulate matter. The effect is þ20% for BAP but sevenfold for FLT. Concentrations in Arctic air are mostly underestimated by the model, which is partly explained by emissions not considered in the simulation. The comparison shows, however, that degradation of the sorbed BAP and FLT molecules should be significantly slower than the respective gaseous molecules and that absorptive partitioning is necessary to explain the LRT potential of FLT. r 2007 Elsevier Ltd. All rights reserved. Keywords: Polycyclic aromatic hydrocarbons; Global fate; Long-range transport potential; Gas–particle partitioning; Multicompartmental model 1. Introduction Polycyclic aromatic hydrocarbons (PAHs) are emitted as a by-product of almost every type of combustion technology or biomass burning. Due to their demonstrated carcinogenic potential and as major contributor to the mutagenic activity of ambient aerosols (Pedersen et al., 2004; EU, 2001) ARTICLE IN PRESS www.elsevier.com/locate/atmosenv 1352-2310/$ - see front matter r 2007 Elsevier Ltd. All rights reserved. doi:10.1016/j.atmosenv.2007.06.050 Corresponding author. Meteorological Institute, University of Hamburg, ZMAW, Bundesstrasse 55, 20146 Hamburg, Germany. Tel.: +49 4041173216; fax: +49 4041173391. E-mail address: [email protected] (A.M. Sehili).
Transcript of Global fate and distribution of polycyclic aromatic ... · PDF fileGlobal fate and...

Author's personal copy
Atmospheric Environment 41 (2007) 8301–8315
Global fate and distribution of polycyclic aromatichydrocarbons emitted from Europe and Russia
Aissa M. Sehilia,b,�, Gerhard Lammelb,c
aMeteorological Institute, University of Hamburg, ZMAW, Bundesstrasse 55, 20146 Hamburg, GermanybMax Planck Institute for Meteorology, ZMAW, Bundesstrasse 53, 20146 Hamburg, Germany
cResearch Centre for Environmental Chemistry and Ecotoxicology, Masaryk University, Brno, Czech Republic
Received 26 October 2006; received in revised form 12 June 2007; accepted 19 June 2007
Abstract
The long-range atmospheric transport (LRT) of polycyclic aromatic hydrocarbons (PAHs) is not fully understood and
has hardly been addressed by model studies. By model experiments the LRT of PAH emissions into air from Europe
and Russia is studied testing several scenarios of gas–particle partitioning and degradability by reaction with ozone and
the hydroxyl and nitrate radicals for two PAHs, benzo[a]pyrene (BAP) and fluoranthene (FLT). The model used is the
atmosphere general circulation model ECHAM5 with a dynamic modal aerosol sub-model, HAM, ozone and sulfur
species chemistry and bidirectional mass exchange on 2D marine (ocean surface mixed layer) and terrestrial surfaces (top
soil layer and vegetation surfaces). After 5 years the substances are found to be mostly distributed to the soil compartment
(64–97% as the global mean, varying with substance and season), which after 10 years is still filling; 1–5% are found in air
and 2–33% in ocean. It is found that the lifetime and vertical distribution of the substances in the atmosphere and the LRT
potential are all significantly influenced by the partitioning and degradation scenario. The total environmental burden is
higher when sorption to organic matter and black carbon are considered to determine gas–particle partitioning rather than
adsorption to the surface of particulate matter. The effect is þ20% for BAP but sevenfold for FLT. Concentrations in
Arctic air are mostly underestimated by the model, which is partly explained by emissions not considered in the simulation.
The comparison shows, however, that degradation of the sorbed BAP and FLT molecules should be significantly slower
than the respective gaseous molecules and that absorptive partitioning is necessary to explain the LRT potential of FLT.
r 2007 Elsevier Ltd. All rights reserved.
Keywords: Polycyclic aromatic hydrocarbons; Global fate; Long-range transport potential; Gas–particle partitioning; Multicompartmental
model
1. Introduction
Polycyclic aromatic hydrocarbons (PAHs) areemitted as a by-product of almost every type ofcombustion technology or biomass burning. Due totheir demonstrated carcinogenic potential and asmajor contributor to the mutagenic activity ofambient aerosols (Pedersen et al., 2004; EU, 2001)
ARTICLE IN PRESS
www.elsevier.com/locate/atmosenv
1352-2310/$ - see front matter r 2007 Elsevier Ltd. All rights reserved.
doi:10.1016/j.atmosenv.2007.06.050
�Corresponding author. Meteorological Institute, University
of Hamburg, ZMAW, Bundesstrasse 55, 20146 Hamburg,
Germany. Tel.: +49 4041173216; fax: +49 4041173391.
E-mail address: [email protected] (A.M. Sehili).

Author's personal copy
their occurrence is an issue of public concern.A recent directive of the European Commission(EU, 2005), uses benzo[a]pyrene (BAP) as a markerfor the carcinogenic risk of PAHs and sets a limitvalue for that substance, to be attained as far aspossible ð1 ngm�3Þ. Although PAHs have beenstudied intensively in recent decades, some severelack of understanding remains. PAHs are semivo-latile organic compounds (SOCs) that are foundin air, soil, vegetation, water and ice, i.e., multi-compartmental substances (Holoubek et al., 2000;Finlayson-Pitts and Pitts, 2000). PAHs obviouslyundergo long-range atmospheric transport such thatremote areas far from the emission are exposed(WHO, 2002). The fate and long-range transportpotential (LRTP) of PAHs is certainly stronglyinfluenced by the partitioning between the gaseousand the particulate phases. In the atmosphere, thetwo phases are differently affected by degradationand deposition processes (radical and O3 reactions,wet and dry deposition). Studies which address theLRTP and persistence of PAHs on large spatialscales are not abundant. The 0–2 D multimediamass balance models (Klopffer, 1994; Scheringer etal., 2001) and a regional multicompartment chem-istry-transport model (MCTM) (Gusev et al., 2005)have been used.
The present study aims to capture the observedlong-range transport of PAHs and to derive itscharacteristic patterns and also to assess the effectof some physico-chemical properties (mainly thepartial vapor pressure) of PAHs on their fate andglobal distribution. We use a MCTM based on a 3Dglobal chemistry-transport model with a focus onthe gas–particle partitioning parametrization.
2. Methodology
2.1. The model
The modeling effort presented in this studyconsists of the incorporation of a PAH module intothe latest version of the general circulation model,ECHAM5 (Roeckner et al., 2003, 2004) coupledwith the aerosol sub-model HAM (Stier et al.,2005).
2.1.1. The GCM ECHAM5
General circulation models are widely used forthe simulation of tracer transport. In the presentstudy we use the fifth generation atmospheric
general circulation model ECHAM5 (Roeckneret al., 2003, 2004).
The land surface parameters have been compiledfrom a global distribution of major ecosystem types(Hagemann, 2002) with soil water depth dependingon root depth of every ecosystem. The horizontalgrid resolution is 2:8� � 2:8� (so-called T42). Theatmosphere is a three phase system (gas, particle,cloud water) stratified on 19 vertical levels up to10 hPa.
2.1.2. The HAM sub-model
The sub-model considers four log-normal aerosolsize modes covering nucleation (N), Aitken (K),accumulation (A) and coarse (C) modes. Addition-ally, the modes consist either of compounds with noor low solubility (insoluble modes: KI, AI, CI), orby internally mixed soluble and insoluble com-pounds (soluble modes: NS, KS, AS, CS). Blackcarbon, particulate organic matter, sulfate, sea saltand mineral dust are considered.
The emissions of biogenic and anthropogenicblack carbon, organic carbon and SO2 are based onthe Global Emissions Inventory Activity (GEIA) ofyear 1985. Seasonality is not considered.
2.1.3. The PAHs MCTM module
The PAH tracers (in fact scenarios) use theavailable aerosols as carrier but do not contributeto the suspended particulate matter (TSP) mass.Soil, vegetation and ocean are represented as geo-referenced 2D compartments (Fig. 1). Vegetationcover is specified for continental grid cells. Theocean surface mixed layer depth is spatially andseasonally varying. The values are taken from a 3Docean general circulation model (Drijfhout et al.,1996). No river runoff is considered. In the atmo-sphere, reactions with OH, NO3 and O3 account forPAHs degradation. Oxidant concentrations areprescribed with spatial and temporal variability
ARTICLE IN PRESS
Fig. 1. Schematics of the intercompartmental exchange processes
captured by the MCTM.
A.M. Sehili, G. Lammel / Atmospheric Environment 41 (2007) 8301–83158302
Author's personal copy
(Roelofs, 1997). Degradation in soil, on vegetationsurfaces and in the ocean mixed layer are first-orderprocesses with rates assumed to double per 10Ktemperature increase. Such a dependency is justifiedby the acceleration of biodegradation in soils bytemperature and recommended in chemicals riskassessment procedures (TGD, 1996). In the ocean,part of the PAH mass is budgeted to be lost to thedeep ocean according to seasonal thinning of thesurface mixed layer (Lammel et al., 2001). The lossof gaseous substances from the soil pore space andfrom plant surfaces account for volatilization fromsoil and vegetation, respectively, and are parame-terized using an empirically derived rate (Smit et al.,1997). The air–sea exchange scheme is based on atwo-film parametrization (Mackay and Yeun, 1983;Wania and Mackay, 1995) which accounts for thetransfer velocities in air layer and water layercalculated as functions of wind speed, among otherparameters.
The scavenging ratios in HAM are size andcomposition dependent for both stratiform andconvective cloud type. In-cloud gas phase scaven-ging of PAHs in stratiform and convective clouds isbased on their Henry coefficient. This last iscalculated using the temperature dependent watersolubility and partial pressure of PAHs. Thereference values are given in the next section. Withregard to scavenging efficiency, PAHs are assumedto be associated with ultrafine particles, i.e., theAitken insoluble size mode. The gas-phase dry
deposition flux is calculated as limited by resistances(‘‘big leaf approach’’) using the ECHAM surfacecover characterization and surface parameters(Ganzeveld and Lelieveld, 1995). Particle drydeposition velocity is taken the same as the sulfateaerosol non-prescribed one (Ganzeveld et al., 1998).
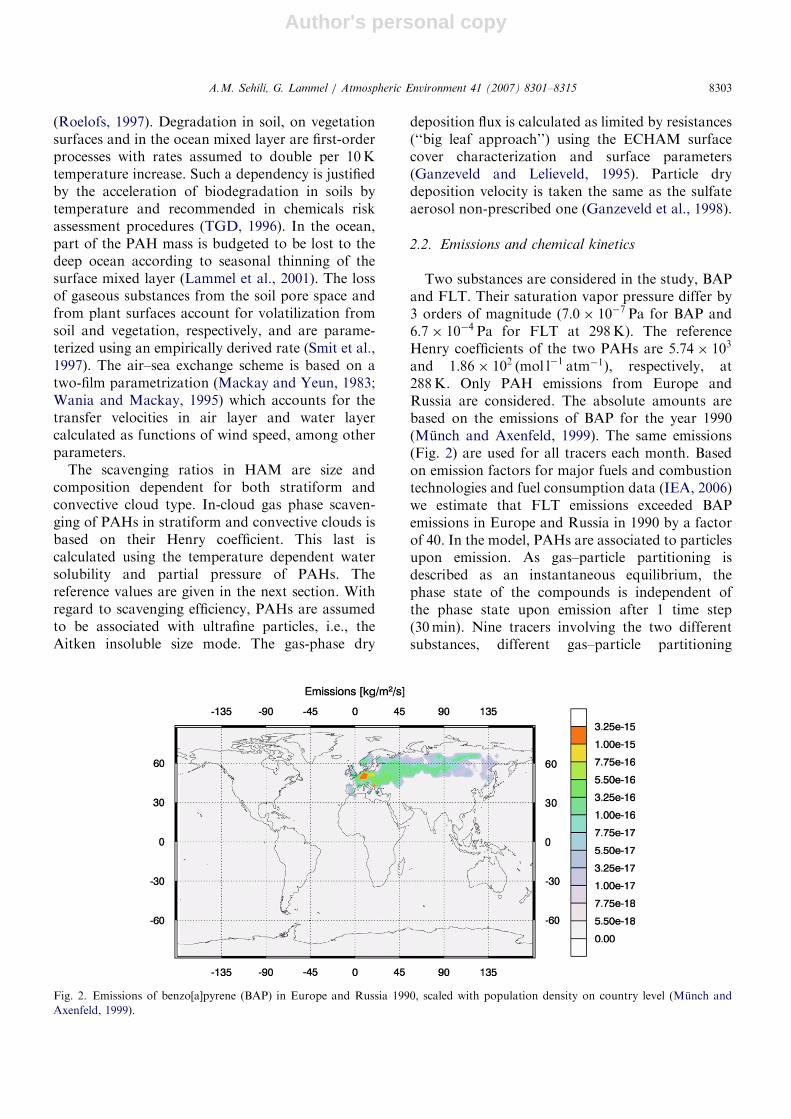
2.2. Emissions and chemical kinetics
Two substances are considered in the study, BAPand FLT. Their saturation vapor pressure differ by3 orders of magnitude (7:0� 10�7 Pa for BAP and6:7� 10�4 Pa for FLT at 298K). The referenceHenry coefficients of the two PAHs are 5:74� 103
and 1:86� 102 ðmol l�1 atm�1Þ, respectively, at288K. Only PAH emissions from Europe andRussia are considered. The absolute amounts arebased on the emissions of BAP for the year 1990(Munch and Axenfeld, 1999). The same emissions(Fig. 2) are used for all tracers each month. Basedon emission factors for major fuels and combustiontechnologies and fuel consumption data (IEA, 2006)we estimate that FLT emissions exceeded BAPemissions in Europe and Russia in 1990 by a factorof 40. In the model, PAHs are associated to particlesupon emission. As gas–particle partitioning isdescribed as an instantaneous equilibrium, thephase state of the compounds is independent ofthe phase state upon emission after 1 time step(30min). Nine tracers involving the two differentsubstances, different gas–particle partitioning
ARTICLE IN PRESS
Fig. 2. Emissions of benzo[a]pyrene (BAP) in Europe and Russia 1990, scaled with population density on country level (Munch and
Axenfeld, 1999).
A.M. Sehili, G. Lammel / Atmospheric Environment 41 (2007) 8301–8315 8303

Author's personal copy
schemes in the atmosphere and different degrada-tion reactions with OH, NO3 and O3 in the gas andparticle phases are considered (Table 1). Due to lackof data we assume the same rate coefficient forgaseous particle sorbed molecules. Degradation insoil, ocean and vegetation compartments are first-order processes using the same decay rates for alltracers (Table 1). Degradation in the groundcompartments is not well known. Only expertestimates are available. It may, however, influenceor even determine the atmospheric total environ-mental cycling of semivolatile substances. In asensitivity study we addressed the influence of theestimates of the sinks in ground compartmentson the fraction of the PAH transported in air.A dynamic (i.e., non-steady state) multimedia massbalance box model (MBM; Lammel, 2004) was usedfor this purpose. All mass exchange processesbetween compartments except atmospheric deposi-tion are parameterized the same way and theemission scenario is the same in the MBM as inthe MCTM. Partitioning of the PAHs in the boxmodel is almost exclusively to soil while the massfraction distributed to air is extremely low, up to10�7 of the total environmental burden. Thisfraction varied typically by a factor of 2 and 6 forFLT and BAP, respectively, when degradation rateshave been varied by one order of magnitude,temperatures of soil and ocean between extremes,
268–298K, and soil organic matter fraction between2% and 5%. Besides, at frost temperatures of thesoil BAP in air is predicted to be virtually zero. AsMBMs tend to overestimate sinks in air (Lammelet al., 2006), the fraction predicted to reside in soil isparticularly high and in air particularly small.Nevertheless, we conclude that the fraction ofPAHs which is cycling in air will be influenced bydegradation in soil to some extent and this addsuncertainty to the atmospheric budgets.
Additionally, a photodegradation reaction onvegetation was implemented based on measuredrates in Dalian (China) under clear sky conditions(Wang et al., 2005). To account for rates all over theglobe, the ratio of the surface radiation ðWm�2Þ ineach grid cell (under clear sky or cloudy conditions)to the measured one in Dalian was used as aweighting factor. The effect of this rate was tested ina simulation of FLT fate (FLTPV).
We present results of a 10 year simulation after aphysical spin-up of 8 years to allow soil variables toreach equilibrium.
2.3. Gas– particle partitioning schemes
The partitioning between gas and particulatephase has been described by Junge based onexperimental findings with various aerosol types(Junge, 1977; Pankow, 1987). This parametrization
ARTICLE IN PRESS
Table 1
Scenario characteristics
Scenario Gas–particle
partitioning
Aira Oceanb Soil/Veg.b
OH NO3 O3
Gas Part. Gas Part. Gas Part.
BAPO SOMc
1:5� 10�10 0.00 5:4� 10�11 0.00 2:6� 10�17 0.00
BAPB SBCd
1:5� 10�10 0.00 5:4� 10�11 0.00 2:6� 10�17 0.00
BAPOB SBC þ SOM 1:5� 10�10 0.00 5:4� 10�11 0.00 2:6� 10�17 0.00 3:1� 10�8 2:2� 10�8
BAPAS Ssurfe
1:5� 10�10 0.00 5:4� 10�11 0.00 2:6� 10�17 0.00
BAPDP SBC þ SOM 1:5� 10�10 3:7� 10�11 5:4� 10�11 5:4� 10�11 2:6� 10�17 2:6� 10�17
FLTOB SBC þ SOM 5� 10�11 0.00 2:5� 10�12 0.00 4:0� 10�19 0.00
FLTAS Ssurf 5� 10�11 0.00 2:5� 10�12 0.00 4:0� 10�19 0.00 3:1� 10�8 2:2� 10�8
FLTDP SBC þ SOM 5� 10�11 5� 10�11 2:5� 10�12 2:5� 10�12 4:0� 10�19 4:0� 10�19
FLTPV SBC þ SOM 5� 10�11 0.00 2:5� 10�12 0.00 4:0� 10�19 0.00
Reaction rate coefficients are ðcm3 mol�1 s�1Þ in air and ðs�1Þ in ocean, soil and vegetation.aFinlayson-Pitts and Pitts (2000).bEstimates (Rippen, 2000).cAbsorption into organic matter (Lohmann and Lammel, 2004).dAbsorption onto black carbon (Lohmann and Lammel, 2004).eSorption according to Junge–Pankow (Junge, 1977; Pankow, 1987).
A.M. Sehili, G. Lammel / Atmospheric Environment 41 (2007) 8301–83158304

Author's personal copy
(Ssurf in the following) assumes only adsorptiononto aerosol surfaces. The particulate sorbedfraction of a SOC y depends on the partial vaporpressure of the substance Ps (Pa), the total availableaerosol surface area per unit volume of air Stot
ðcm�1Þ and a constant c (Pa cm) which in turndepends on the adsorbate’s molecular weight andheat of condensation,
y ¼cStot
cStot þ Ps. (1)
This parametrization neglects the absorptive parti-tioning potential to organic matter relevant parti-cularly for lipophilic compounds.
In the present study, three other partitioningschemes are tested which are based on absorption ofPAHs into organic matter using the octanol–airpartitioning coefficient Koa (as suggested amongstothers by Harner and Bidleman, 1998), adsorptiononto black carbon using the soot–air partitioningcoefficient K soot2air and a combination of the twoways of sorption. The two last parametrizationapproaches were proposed by Lohmann and Lam-mel (2004). The particulate phase fraction y can bedescribed also in the form,
y ¼KpCTSP
KpCTSP þ 1, (2)
where Kp ðm3 mg�1Þ is the gas–particle partitioning
coefficient and CTSP the concentration of TSP.For absorption into organic matter, Kp is given
by (Harner and Bidleman, 1998):
log Kp ¼ log10 Koa þ log10 f OM � 11:91 (3)
with f OM being the fraction of organic matter in thetotal suspended particulate matter and Koa theoctanol–air partitioning coefficient.
For adsorption to black carbon, Kp is given by(Lohmann and Lammel, 2004):
log Kp ¼ log10 K sa þ log10 f BC � 12 (4)
with f BC being the fraction of black carbon in TSPand K sa the partitioning coefficient between dieselsoot and air (we assume that all black carbon in theatmosphere behaves as diesel soot with respect toPAH sorption).
y is temperature dependent as Koa and K sa. Koa
(T) is calculated according to Harner and Bidleman(1998) and K sa is supposed to double every 4.9-Ktemperature increase.
The combination of the two ways of sorptionmentioned above is performed at the Kp level
using (3) and (4):
Kp ¼ Koa � f OM � 1:22� 10�12 þ Ksa � f BC � 10�12.
(5)
3. Results and discussion
3.1. Gas– particle partitioning
Fig. 3 shows global distributions of y at groundlevel for the two substances, two scenarios eachduring a winter and a summer month of the secondsimulated year. The second year is representative forthe simulation period except the very first months asthe particle-bound fraction, y, does not show a long-term trend.
An analysis of the globally averaged values of yfor the last 5 years of simulation indicates that thelowest values are found for Ssurf partitioning forfluoranthene (FLTAS) having a higher partialvapor pressure (Table 4). Consequently, this speciesis mostly gaseous in air and hence strongly degradedthrough reactions with radicals. Although moreaerosol surface is available during June–August(JJA) (Table 2) for Ssurf partitioning tracers BAPASand FLTAS, their y values are lower than duringDecember–February (DJF) (Table 4). This is due tothe temperature dependence of their partial vaporpressure (higher in JJA), that is inversely propor-tional to y (Eq. (1)).
Low values, yo0:5, prevail for FLT under theadsorption (Junge–Pankow) partitioning scenario(Fig. 3). A larger aerosol surface during JJA(ca. 20%, cf. Table 2) obviously cannot compensatefor the temperature effect. The same is observed forBAP. Note that also for BAP yo0:5 is predicted forparts of the tropical ocean regions under thisscenario and for both substances under the absorp-tion scenario (Fig. 3). Low y values do not resultonly from higher temperatures (influential underthe adsorption and less under the absorptionpartitioning scenario), but also the wash-out ofparticle-associated PAHs plays a significant role.The continuous volatilization of gaseous PAHsfrom ground feeds this tendency. Under the SOM þ
SBC partitioning scenario, the ratio of BAP ad-sorbed onto black carbon (BAPB tracer) is less thanthe one absorbed into organic matter (BAPO tracer)for both summer and winter time. The respectiveamounts of BC and OC are listed in Table 2. Thecombination of both sorption ways delivers for both
ARTICLE IN PRESSA.M. Sehili, G. Lammel / Atmospheric Environment 41 (2007) 8301–8315 8305

Author's personal copy
ARTICLE IN PRESS
Fig. 3. Particle-bound fraction y at ground level according to Ssurf (BAPAS and FLTAS) and SOM þ SBC (BAPOB and FLTOB)
partitioning during January and July of the second year upon entry.
A.M. Sehili, G. Lammel / Atmospheric Environment 41 (2007) 8301–83158306
Author's personal copy
PAHs (BAPOB, BAPDP, FLTOB, FLTDP,FLTPV) higher y values (Table 4). The seasonalvariation of y is well captured by the model (lowervalues during the northern summer and higher onesduring winter on both hemispheres).
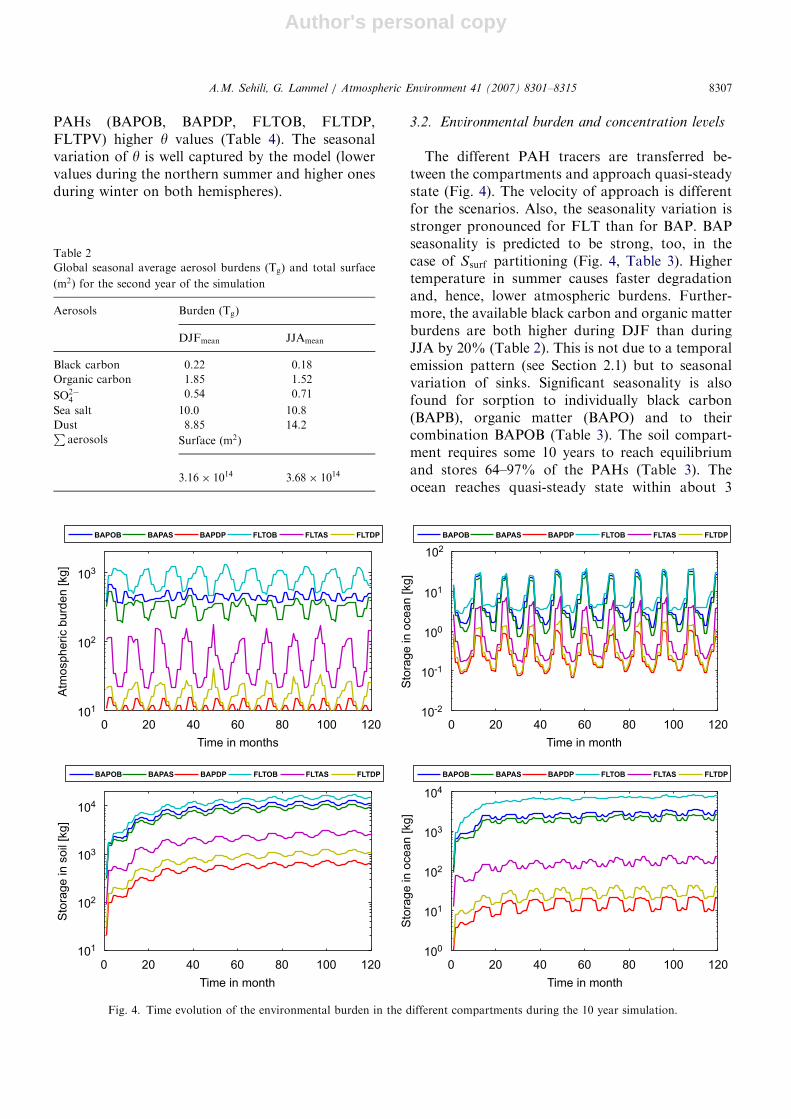
3.2. Environmental burden and concentration levels
The different PAH tracers are transferred be-tween the compartments and approach quasi-steadystate (Fig. 4). The velocity of approach is differentfor the scenarios. Also, the seasonality variation isstronger pronounced for FLT than for BAP. BAPseasonality is predicted to be strong, too, in thecase of Ssurf partitioning (Fig. 4, Table 3). Highertemperature in summer causes faster degradationand, hence, lower atmospheric burdens. Further-more, the available black carbon and organic matterburdens are both higher during DJF than duringJJA by 20% (Table 2). This is not due to a temporalemission pattern (see Section 2.1) but to seasonalvariation of sinks. Significant seasonality is alsofound for sorption to individually black carbon(BAPB), organic matter (BAPO) and to theircombination BAPOB (Table 3). The soil compart-ment requires some 10 years to reach equilibriumand stores 64–97% of the PAHs (Table 3). Theocean reaches quasi-steady state within about 3
ARTICLE IN PRESS
Table 2
Global seasonal average aerosol burdens ðTgÞ and total surface
ðm2Þ for the second year of the simulation
Aerosols Burden ðTgÞ
DJFmean JJAmean
Black carbon 0.22 0.18
Organic carbon 1.85 1.52
SO2�4
0.54 0.71
Sea salt 10.0 10.8
Dust 8.85 14.2Paerosols Surface ðm2Þ
3:16� 1014 3:68� 1014
0 20 40 60 80 100 120101
102
101
10-1
10-2
100
102
103
101
102
104
103
100
101
102
104
103
Time in months
Atm
ospheric b
urd
en [kg]
0 20 40 60 80 100 120
Time in month
200 40 60 80 100 120
Time in month
Sto
rage in s
oil
[kg]
0 20 40 60 80 100 120
Time in month
Sto
rage in o
cean [kg]
Sto
rage in o
cean [kg]
BAPOB BAPAS BAPDP FLTOB FLTAS FLTDP
BAPOB BAPAS BAPDP FLTOB FLTAS FLTDP
BAPOB BAPAS BAPDP FLTOB FLTAS FLTDP
BAPOB BAPAS BAPDP FLTOB FLTAS FLTDP
Fig. 4. Time evolution of the environmental burden in the different compartments during the 10 year simulation.
A.M. Sehili, G. Lammel / Atmospheric Environment 41 (2007) 8301–8315 8307

Author's personal copy
years and stores between 2% and 33% of the totalenvironmental burden. These findings emphasizethe multicompartmental character of PAHs. Thestorage in vegetation is negligible. A similar BAPcompartmental distribution in the European regionhas been found in a simulation carried out with theregional multicompartment model MSCE–POP(Gusev et al., 2005): The MSCE–POP modelpredicts 96% of BAP in soil, 0.2% in air, 1% insea and 2.7% in vegetation. Degradation in theparticulate phase (using the gas-phase reaction ratecoefficients due to lack of information) leads to thereduction of the total environmental burden by afactor of 20 and higher partitioning to soil (BAPDPand FLTDP). The photolysis on vegetation did notshow any significant effect (e.g. FLTOB andFLTPV tracers deliver the same values, i.e.,o10�3% discrepancy). Tracers BAPO and BAPBshow similar behavior as BAPOB but lower total
environmental levels (30% less for BAPO and 10%less for BAPB in winter, 34% less for BAPO and17% less for BAPB in summer). This emphasizes thesignificance of the adsorption to black carbon. Theburden of BAPAS is in all compartments less thanBAPOB (18% less in winter and 24% less insummer). The effect of partitioning on the compart-mental burdens is much larger for FLT. Prelimina-rily, one can affirm that the effect of the quality ofthe partitioning scheme is more pronounced in thecase of more volatile PAHs. The partitioning toorganic matter and black carbon seems to be verysensitive to the partial pressure of PAH species.Deposition is dominated by wet fluxes. Depositedamounts are higher in northern winter than insummer by a factor of 2 to 5 (Table 4). Thevolatilization flux is much smaller than the deposi-tion flux, 0.1–1.5% for BAP and 0.1–3.0% for FLT(Table 4). Despite this large contrast, however,
ARTICLE IN PRESS
Table 3
Total environmental burden and compartmental fractions in two seasons (global values, mean of years 6–10 upon entry). The fraction on
vegetation surfaces is less than 0.2% for all scenarios and seasons
Scenario DJF JJA
Total burden
(kg)
Atm. (%) Soil (%) Ocean (%) Total burden
(kg)
Atm. (%) Soil (%) Ocean (%)
BAPO 10 177 3.3 80.0 16.6 9804 2.5 85.6 11.9
BAPB 13 206 3.2 75.8 20.9 12754 2.1 80.7 17.0
BAPOB 14 770 3.0 74.7 22.2 14397 2.8 78.7 18.4
BAPAS 12 056 3.2 75.9 20.8 11742 2.0 80.4 17.5
BAPDP 639 1.7 94.8 3.4 656 1.6 96.8 1.6
FLTOB 22 854 2.6 63.8 33.5 23021 4.7 64.7 30.4
FLTAS 2787 4.9 87.6 7.4 2763 0.9 93.6 5.5
FLTDP 1078 2.5 93.7 3.7 1095 1.0 97.0 2.0
Table 4
Gas–particle partitioning coefficient y at ground level and total deposition and volatilization in two seasons. Average global values (mean
of years 6–10 upon entry)
Scenario DJF JJA
y Deposition Volatilization y Deposition Volatilization
BAPO 0.619 4784 15.00 0.624 1202 13.17
BAPB 0.712 5792 23.82 0.688 1281 20.15
BAPOB 0.781 6019 27.49 0.776 1848 23.68
BAPAS 0.685 5346 20.39 0.649 1236 19.91
BAPDP 0.781 288.1 0.20 0.776 144.9 0.13
FLTOB 0.877 7062 47.20 0.883 4391 147.90
FLTAS 0.188 1683 1.91 0.106 343.5 9.35
FLTDP 0.877 523.2 0.46 0.883 155.8 2.97
A.M. Sehili, G. Lammel / Atmospheric Environment 41 (2007) 8301–83158308

Author's personal copy
volatilization leads to net losses from continentalsurfaces in some dry regions, the northern Sahara,central Asia, Greenland and Antarctica duringnorthern summer (Fig. 5). Also in the northerntrade wind zone of the Atlantic ocean a net BAPvolatilization flux is observed during summer (aslong as emissions from America are neglected).
A concentration analysis for four tracers (BAPOB,BAPAS, FLTOB, FLTAS) covering the twokinds of partitioning parameterizations (Ssurf andSOM þ SBC) is presented below. Only the last 5 yearsof simulation are considered in order to ensure thatsteady state is established in most of the compart-ments. We compare model results using 1990emissions with measurements at three sites in theArctic, Dunay, Alert (in the early 1990s, Macdonaldet al., 2000) and Zeppelinfjell on Spitsbergen(EMEP). The locations of the measurement stationsare illustrated in Fig. 6. Pollution at Zeppelinfjell andDunay is dominated by European and Russianemissions, while American emissions are certainlysignificant for Alert. Yearly mean measured BAPconcentrations are higher than simulated ones byapproximatively a factor of 3 at Dunay, a factorof 25 at Alert and a factor of 30 at Zeppelinfjell(Table 5). Other particulate matter tracers at groundlevel at Arctic sites, e.g. sulfate, are underestimatedby approximately a factor of 3 (comparison withmonitoring data, see also Rasch et al., 2000). Thisdiscrepancy, by a factor of 3, is found for BAP atDunay. Dunay is influenced mostly by advectionfrom south-west. The large discrepancy found atAlert between measured and simulated BAP ismainly due to contributions from North-Americanemission sources. Air masses reaching Zeppelinfjellare mainly advected from south and south-east, i.e.,
Europe and Siberia.1 The measured concentrationsat the Zeppelinfjell 1994–1995 were reported to bemuch higher than the other sites (Hung et al., 2005).As a consequence of emission trends in Europe(Gusev et al., 2005) they might have been evenslightly higher in the years before. The largediscrepancy found at Zeppelinfjell remains unex-plained. Under the scenario of same emissions,higher FLT concentrations than BAP are predicted.If we adopt a FLT:BAP ratio of 40 (according toemission estimates, mentioned above), the predictedFLT concentrations in air agree with the observedwithin a factor of 2. The very low FLT concentrationat all stations using the Ssurf partitioning scheme(FLTAS) shows the limit of such parametrization for
ARTICLE IN PRESS
Fig. 5. Total net flux ðkgm�2 s�1Þ, defined as deposition minus volatilization and excluding emissions, during July (year 10 upon entry).
Fig. 6. Location of Dunay (Russia), Alert (Canada) and
Zeppelinfjell on Spitsbergen (Norway).
1http://www.nilu.no/projects/ccc/network.
A.M. Sehili, G. Lammel / Atmospheric Environment 41 (2007) 8301–8315 8309

Author's personal copy
species with high vapor pressure and advocates theuse of absorption–adsorption partitioning schemes.
For most scenarios a seasonality with highestconcentrations occurring during the colder monthsis predicted in agreement with measurements(Fig. 7) and previous findings (Halsall et al.,1997). Note that the model predicted seasonalitymust be underestimated as the winter emissionmaximum (due to higher fossil fuel usage) is notrepresented in the model. For BAP the predictedwinter maximum is higher than the summer mini-mum by a factor of 13 and 8 for BAPOB andBAPAS, respectively (Fig. 7). In the case of theeffectively degraded tracer BAPDP, the seasonalityis inverted but at a very low concentration rangeð�10�6 pgÞ. FLT seasonality at Zeppelinfjell isunderestimated under the FLTOB (absorptive)and overestimated under the FLTAS (adsorptive
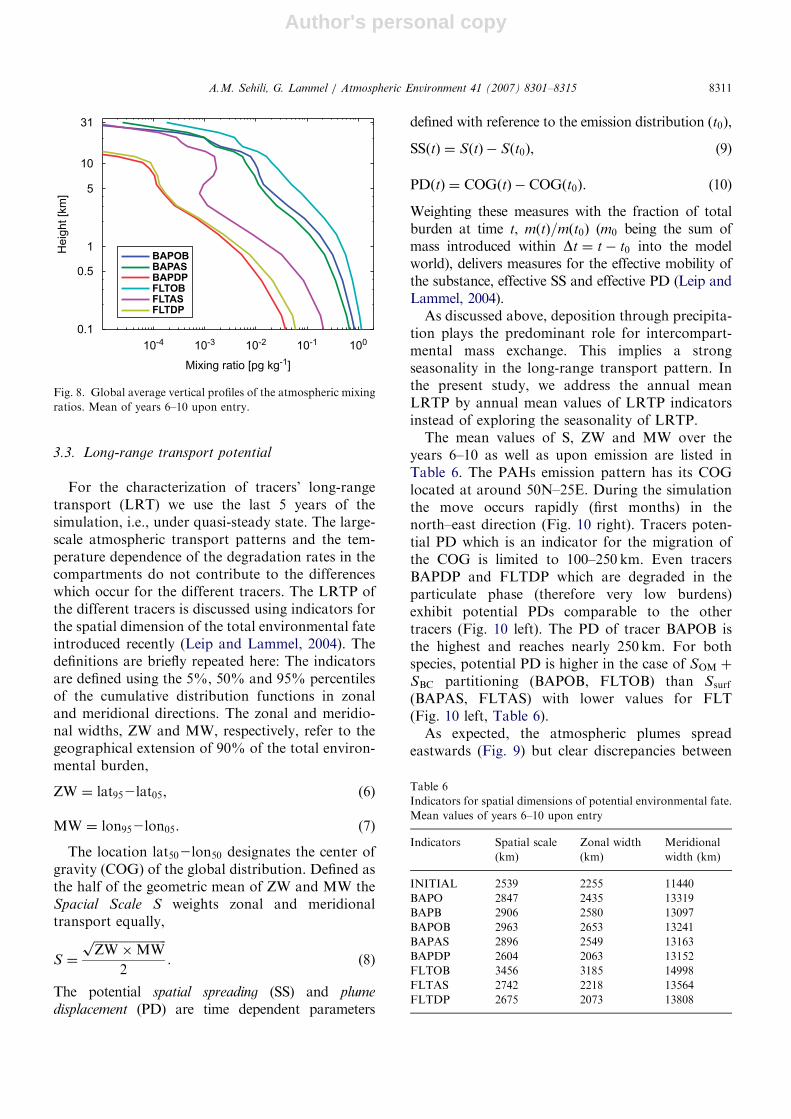
gas–particle partitioning) scenario (Fig. 7). FLTDPshows also a clear seasonality which is slightlydisturbed during the period November–January.The maximum mixing ratios for all tracers arefound at ground level (Fig. 8). In the vicinity of thetropopause a second maximum of the mixing ratiois found (in the global mean) for tracer FLTAS.Moreover, the zonal width plots (mean over thelongitudes) show the occurrence of transport intothe Arctic regions at the tropopause level andbeyond during summer months. BAP and FLTare mostly present in the planetary boundarylayer although they are transported into the strato-sphere to some extent. The tracers BAPDP andFLTDP (with degradation in the particulate phase)remain in the troposphere (Fig. 8). The heightscorresponding to 50% of the mixing ratios arelocated between 200 and 450m altitude.
ARTICLE IN PRESS
Table 5
Comparison of simulated mean concentrations for years 6–10 and measured mean concentrations ðpgm�3Þ for two substances at three
different stations. Values for Dunay and Alert are 1993 data taken from Fig. 25 of Macdonald et al. (2000). Measured values for
Zeppelinfjell are 1994 data (EMEP)
Substance Scenario Dunay Alert Spitsbergen EMEP no. 42
Simulated Measured Simulated Measured Simulated Measured
Benzo[a]pyrene BAPOB 0.95 0.27 0.40
BAPAS 0.84 � 3.0 0.26 � 7.0 0.32 13.7
FLTOB 1.55 2.57 2.01
Fluoranthene FLTAS 0.67 � 120.0 0.07 � 70 0.03 122.0
Jan Feb Mar Apr May Jun Jul Aug Sep Oct Nov Dec106
104
102
100
102
Months
Co
ncen
tra
tio
n [pg
/m3]
BAPOB BAPAS BAPDP BAP meas.
Jan Feb Mar Apr May Jun Jul Aug Sep Oct Nov Dec106
104
102
100
102
Months
Co
ncen
tra
tio
n [pg
/m3]
FLTOB FLTAS FLTDP FLT meas.
Fig. 7. Monthly average simulated and measured (years 1994–2004 at Zeppelinfjell, EMEP data) concentrations: Benzo[a]pyrene (left) and
fluoranthene (right). Simulated values are averages for years 6–10 upon entry.
A.M. Sehili, G. Lammel / Atmospheric Environment 41 (2007) 8301–83158310
Author's personal copy
3.3. Long-range transport potential
For the characterization of tracers’ long-rangetransport (LRT) we use the last 5 years of thesimulation, i.e., under quasi-steady state. The large-scale atmospheric transport patterns and the tem-perature dependence of the degradation rates in thecompartments do not contribute to the differenceswhich occur for the different tracers. The LRTP ofthe different tracers is discussed using indicators forthe spatial dimension of the total environmental fateintroduced recently (Leip and Lammel, 2004). Thedefinitions are briefly repeated here: The indicatorsare defined using the 5%, 50% and 95% percentilesof the cumulative distribution functions in zonaland meridional directions. The zonal and meridio-nal widths, ZW and MW, respectively, refer to thegeographical extension of 90% of the total environ-mental burden,
ZW ¼ lat952lat05, (6)
MW ¼ lon952lon05. (7)
The location lat502lon50 designates the center ofgravity (COG) of the global distribution. Defined asthe half of the geometric mean of ZW and MW theSpacial Scale S weights zonal and meridionaltransport equally,
S ¼
ffiffiffiffiffiffiffiffiffiffiffiffiffiffiffiffiffiffiffiffiffiffiffiffiZW�MWp
2. (8)
The potential spatial spreading (SS) and plume
displacement (PD) are time dependent parameters
defined with reference to the emission distribution ðt0Þ,
SSðtÞ ¼ SðtÞ � Sðt0Þ, (9)
PDðtÞ ¼ COGðtÞ � COGðt0Þ. (10)
Weighting these measures with the fraction of totalburden at time t, mðtÞ=mðt0Þ (m0 being the sum ofmass introduced within Dt ¼ t� t0 into the modelworld), delivers measures for the effective mobility ofthe substance, effective SS and effective PD (Leip andLammel, 2004).
As discussed above, deposition through precipita-tion plays the predominant role for intercompart-mental mass exchange. This implies a strongseasonality in the long-range transport pattern. Inthe present study, we address the annual meanLRTP by annual mean values of LRTP indicatorsinstead of exploring the seasonality of LRTP.
The mean values of S, ZW and MW over theyears 6–10 as well as upon emission are listed inTable 6. The PAHs emission pattern has its COGlocated at around 50N–25E. During the simulationthe move occurs rapidly (first months) in thenorth–east direction (Fig. 10 right). Tracers poten-tial PD which is an indicator for the migration ofthe COG is limited to 100–250 km. Even tracersBAPDP and FLTDP which are degraded in theparticulate phase (therefore very low burdens)exhibit potential PDs comparable to the othertracers (Fig. 10 left). The PD of tracer BAPOB isthe highest and reaches nearly 250 km. For bothspecies, potential PD is higher in the case of SOM þ
SBC partitioning (BAPOB, FLTOB) than Ssurf
(BAPAS, FLTAS) with lower values for FLT(Fig. 10 left, Table 6).
As expected, the atmospheric plumes spreadeastwards (Fig. 9) but clear discrepancies between
ARTICLE IN PRESS
Table 6
Indicators for spatial dimensions of potential environmental fate.
Mean values of years 6–10 upon entry
Indicators Spatial scale
(km)
Zonal width
(km)
Meridional
width (km)
INITIAL 2539 2255 11440
BAPO 2847 2435 13319
BAPB 2906 2580 13097
BAPOB 2963 2653 13241
BAPAS 2896 2549 13163
BAPDP 2604 2063 13152
FLTOB 3456 3185 14998
FLTAS 2742 2218 13564
FLTDP 2675 2073 13808
10-4 10-3 10-2 10-1 100
0.1
0.5
1
5
10
31
Mixing ratio [pg kg-1]
Heig
ht [k
m]
BAPOB
BAPAS
BAPDP
FLTOB
FLTAS
FLTDP
Fig. 8. Global average vertical profiles of the atmospheric mixing
ratios. Mean of years 6–10 upon entry.
A.M. Sehili, G. Lammel / Atmospheric Environment 41 (2007) 8301–8315 8311

Author's personal copy
the tracer scenarios are found. The SS indicatorcharacterizes the extent of the geographical areathat is significantly affected by the plume. In thecase of FLTOB and BAPOB, a plume move
towards south-west (part of Africa and the southAtlantic) is observed. Consequently, the highestpotential SS is found for the two tracers (916 and424 km, respectively). For both species, SS are
ARTICLE IN PRESS
Fig. 9. Mean atmospheric burden ðkgm�2Þ during years 6–10 upon entry of BAPOB, BAPAS, FLTOB and FLTAS.
BAPO BAPB BAPOB BAPAS BAPDP FLTOB FLTAS FLTDP FLTPV
0
100
200
300
400
500
600
700
800
900
1000
Tracers
Dis
tan
ce
[km
]
Plume Displacement
Spatial Spreading
BAPO BAPB BAPOB BAPAS BAPDP FLTOB FLTAS FLTDP FLTPV
0
100
200
300
400
500
600
700
800
900
1000
Tracers
Dis
tan
ce
[km
]
Plume Displacement
Spatial Spreading
Fig. 10. Indicators for spatial dimensions of potential environmental fate, potential (left) and effective (right) plume displacement and
spatial spreading. Mean values of years 6–10 upon entry.
A.M. Sehili, G. Lammel / Atmospheric Environment 41 (2007) 8301–83158312
Author's personal copy
higher in the case of SOM þ SBC partitioning(BAPOB, FLTOB) than the Ssurf one (BAPAS,FLTAS) (Fig. 10 left, Table 6). Hence, the influenceof the gas–particle partitioning parametrization onthe long-range transport is much more pronouncedfor PAHs with high partial vapor pressure like FLTin the present case (Fig. 9).
The comparison of LRTP indicator valuesof BAPO BAPB, and BAPOB allows to assessadditivity of individual contributions of gas–particlepartitioning on LRTP. BAPOB partitioning isdescribed by the sum of absorptive and adsorptivepartitioning used for BAPO and BAPB, respec-tively. SS under BAPOB is close to the sum of SSunder BAPO and BAPB, while PD under BAPOB ismuch less than the sum of PDs under BAPO andBAPB. Obviously, non-additivity of contributionsof gas–particle partitioning on LRTP has to beexpected.
Effective PD and SS for BAPO, BAPB, BAPOBand BAPAS are reduced by 1
4and 1
3in comparison
with potential values. The effective indicators fortracer FLTOB exhibiting the highest environmentalburden is lower by a factor 2. Degradation in theparticulate phase (BAPDP and FLTDP) reducesthe effective LRTP (Fig. 10 right). A singularity isnoticed for FLTAS (Ssurf partitioning) which showsvery low values of the effective indicators similar toBAPDP and FLTDP.
4. Conclusions
Several scenarios of gas–particle partitioning anddegradability in air have been studied in globalsimulations of emissions of two PAHs, BAP andFLT, into air in Europe and Russia. It is found thatthe lifetime and vertical distribution of the sub-stances in the atmosphere and the long-rangetransport potential (LRTP) are all significantlyinfluenced by the partitioning and degradationscenario. The total environmental burden is higherwhen sorption to organic matter and black carbonare considered to rule the gas–particle partitioningthan adsorption to the surface of particulate matter.The effect is þ20% for BAP but sevenfold for FLT.The soil compartment stores the major part of thetwo PAHs. The multicompartmental character ofPAHs is stressed by the finding that volatilizationfrom the surfaces can reach 1.5% and 3% of totalBAP and FLT deposition, respectively, as a globaland annual mean. In hot and dry continentalregions seasonal volatilization from ground surfaces
can be stronger than deposition. Lifetime in soiland, hence, volatilization from soil, however, isparticularly uncertain because degradation in soiland its temperature was only estimated in this study.A transport of PAHs emitted from Europe andRussia towards northern latitudes was established.This transport is more pronounced when sorptionto organic matter and black carbon is used for thegas–particle partitioning than adsorption to thesurface of particulate matter and particularly formore volatile PAHs like fluoranthene. Beyond thecompilation of global aerosols and PAHs emissions,further developments should address more deeplydegradation in ground compartments and particu-late phase atmospheric degradation.
Acknowledgments
We thank Semeena V.S., Rainer Lohmann andJohann Feichter (MPI) for discussions. This re-search was supported by the German ResearchFoundation (DFG).
References
Drijfhout, S.S., Heize, M., Latif, M., Maier-Reimer, E., 1996.
Mean circulation and internal variability in an ocean
primitive equation model. Journal of Physical Oceanography
26, 559–580.
EU 2005. Directive 2004/107/EC of the European Parliament and
of the Council of 15 December 2004 relating to arsenic,
cadmium, mercury, nickel and polycyclic aromatic hydro-
carbons in ambient air [Official Journal L 23 of 26.01.2005].
EU Working Group on Polycyclic Aromatic Hydrocarbons
(Hailwood M. et al.) 2001. Ambient air pollution by
polycyclic aromatic hydrocarbons. Position Paper, European
Commission, Brussels, 62 pp.
Finlayson-Pitts, B.J., Pitts, J.N., 2000. Chemistry of the Upper
and Lower Atmosphere: Theory Experiments and Applica-
tions. Academic Press, New York.
Ganzeveld, L., Lelieveld, J., 1995. Dry deposition parametriza-
tion in chemistry general circulation model and its influence
on the distribution of reactive trace gases. Journal of
Geophysical Research 100, 20999–21012.
Ganzeveld, L., Lelieveld, J., Roelofs, G.J., 1998. Dry deposition
parametrization of sulfur oxides in chemistry general circula-
tion model. Journal of Geophysical Research 103, 5694–5779.
Gusev, A., Mantseva, E., Rozovskaya, O., Shatalov, V., Strukov,
B., Vulykh, N., Aas, W., Breivik, K., 2005. Persistent organic
pollutants in the environment. Report EMEP Meteorological
Synthesizing Centre East, No. 3/2005, MSCE, Moscow.
Hagemann, S., 2002. An improved land surface parameter
data set for global and regional climate models. Report
No. 336, Max-Planck-Institut fur Meteorologie, Hamburg,
Germany, 21 pp.
ARTICLE IN PRESSA.M. Sehili, G. Lammel / Atmospheric Environment 41 (2007) 8301–8315 8313

Author's personal copy
Halsall, C.J., Barrie, L.A., Fellin, P., Muir, D.C.G., Billeck, B.N.,
Lockhart, L, et al., 1997. Spatial and temporal variation of
polycyclic aromatic hydrocarbons in the Arctic atmosphere.
Environmental Science and Technology 31, 3593–3599.
Harner, T., Bidleman, T.F., 1998. Measurement of octanol–air
partitioning coefficients for polychlorinated aromatic hydro-
carbons and polychlorinated naphthalenes. Journal of Che-
mical Engineering Data 43, 40–46.
Holoubek, I., Korinek, P., Seda, Z., Schneiderova, E., Holoub-
kova, I., Pacl, A., Triska, J., Cudlin, P., Caslavsky, J., 2000.
The use of mosses and pine needles to detect persistent
organic pollutants at local and regional scales. Environmental
Research 15, 115–125.
Hung, H., Blanchard, P., Halsall, C.J., Bidleman, T.F., Stern,
G.A., Fellin, P., Muir, D.C.G., Barrie, L.A., Jantunen, L.M.,
Helm, P.A., Ma, J., Konoplev, A., 2005. Temporal and
spatial variabilities of atmospheric polychlorinated biphenyls
(PCBs), organochlorine (OC) pesticides and polycyclic aro-
matic hydrocarbons (PAHs) in the Canadian Arctic: results
from a decade of monitoring. Science of the Total Environ-
ment 342, 119–144.
International Energy Agency, Vienna, 2006. Statistics for years
1971–2004: hhttp://www.iea.org/Textbase/stats/graphsearch.aspi.
Junge, C.E., 1977. Fate of pollutants in the air and water
environment. In: Suffet, I.H. (Ed.), Basic Considerations
about Trace Constituents in the Atmosphere as Related to
the Fate of Global Pollutants. Wiley, New York (Part 1)
pp. 7–25.
Klopffer, W., 1994. Environmental hazard-assessment of chemi-
cals and products—2. Persistence and degradability of
organic chemicals. Environmental Science Pollution Research
8, 108–116.
Lammel, G., 2004. Effects of temporally averaging climate
parameters on predicted multicompartmental fate of pesti-
cides and POPs. Environmental Pollution 128, 291–302.
Lammel, G., Feichter, J., Leip, A., 2001. Long-range transport
and global distribution of semivolatile organic compounds: a
case study on two modern agrochemicals. Report No. 324,
Max Planck Institute for Meteorology, Hamburg, 44 pp.
Lammel, G., Klopffer, W., Semeena, V.S., Schmidt, E., Leip, A.,
2006. Multicompartmental fate of persistent substances:
Comparison of predictions from multi-media box models
and a multicompartment chemistry-atmospheric transport
model. Environmental Science Pollution Research 14,
10.1065/espr2006.11.363.
Leip, A., Lammel, G., 2004. Indicators for persistence and long-
range transport potential as derived from multicompartment
chemistry-transport modelling. Environmental Pollution 128,
205–221.
Lohmann, R., Lammel, G., 2004. Adsorptive and absorptive
contributions to the gas–particle partitioning of polycyclic
aromatic hydrocarbons: State of knowledge and recom-
mended parametrization for modelling. Environmental
Science and Technology 38, 3793–3803.
Macdonald, R.W., Barrie, L.A., Bidleman, T.F., Diamond,
M.L., Gregor, D.J., Semkin, R.G., Strachan, W.M., Li,
Y.F., Wania, F., Alaee, M., Alexeeva, L.B., Backusand, S.M.,
Bailey, R., Bewers, J.M., Gobeil, C., Halsall, C.J., Harner, T.,
Hoff, J.T., Jantunen, L.M.M., Lockhart, W.L., Mackay, D.,
Muir, D.C.G., Pudykiewicz, K.J., Reimer, K.J., Smith, J.N.,
Stern, G.A., Schroeder, W.H., Wagemann, R., Yunker, M.B.,
2000. Contaminants in the Canadian Arctic: 5 years of
progress in understanding sources, occurrence and pathways.
Science of the Total Environment 254, 93–234.
Mackay, D., Yeun, A.T.K., 1983. Mass transfer coefficients
correlations for volatilization of organic solutes from water.
Environmental Science and Technology 17, 211–233.
Munch, J., Axenfeld, F., 1999. Historic emission data base of
selected organic pollutants (POPs) in Europe (1970-95)-
PCDD/F, B(a)P, PCB, g-HCH, HCB, DDE/DDT. Report
to the European Commission (DG XII), Environment and
Climate Project No. ENV-CT96-0214.
Pankow, J.F., 1987. Review and comparative analysis of the
theory on partitioning between the gas and aerosol particulate
phases in the atmosphere. Atmospheric Environment 21,
2275–2283.
Pedersen, D.U., Durant, J.L., Penman, B.W., Crespi, C.L.,
Hemond, H.F., Lafleur, A.L., Gass, G.R., 2004. Human-cell
mutagens in respirable airborne particles in the northeastern
United States. I Mutagenicity of fractional samples. Environ-
mental Science and Technology 38, 682.
Rasch, P.J., Feichter, J., Law, K., Mahowald, N., Penner, J.,
Benkovitz, C., Genthon, C., Giannakopoulos, C., Kasibhatla,
P., Koch, D., Levy, D.H., Maki, T., Prather, M., Roberts,
D.L., Roelofs, G.J., Stevenson, D., Stockwell, Z., Taguchi, S.,
Kritz, M., Chipperfield, M., Baldocchi, D., McMurry, P.,
Barrie, L., Balkansi, Y., Chatfield, R., Kjellstrom, E.,
Lawrence, M., Lee, H.N., Lelieveld, J., Noone, K.J.,
Seinfeld, J., Stenchikov, G., Schwartz, S., Walcek, C.,
Williamson, D., 2000. A comparison of scavenging and
deposition processes in global models: results from the WCRP
Cambridge Workshop of 1995. Tellus 52B, 1025–1056.
Rippen, G., 2000. Umweltchemikalien (CD-ROM edition).
Ecomed Publishers, Landsberg, Germany.
Roeckner, E., Bauml, G., Bonaventura, L., Brokopf, R., Esch,
M., Giorgetta, M., Hagemann, S., Kirchner, I., Kornbluh, L.,
Manzini, E., Rhodin, A., Schlese, U., Schulzweida, U.,
Tompkins, A., 2003. The atmospheric general circulation
model ECHAM5. Part I: model description. Report 349, Max
Planck Institute for Meteorology, Hamburg, Germany,
140pp.
Roeckner, E., Brokopf, R., Esch, M., Giorgetta, M., Hagemann, S.,
Kornbluh, l., Manzini, E., Schlese, U., Schulzweida, U., 2004.
The atmospheric general circulation model ECHAM5. Part II:
sensitivity of simulated climate to horizontal and vertical
resolution. Report 354, Max Planck Institute for Meteorology,
Hamburg, Germany, 64pp.
Roelofs, G.J., Lelieveld, J., van Dorland, R., 1997. A three
dimensional chemistry-general circulation model simulation
of anthropogenically derived ozone in the troposphere and its
radiative climate forcing. Journal of Geophysical Research
102, 23389–23401.
Scheringer, W., Hungerbuhler, K., Matthies, M., 2001. The
spatial scale of organic chemicals in multimedia fate model-
ling. Recent developments and significance for chemical
assessment. Environmental Science Pollution Research 8,
150–155.
Smit, A.A.M.F.R., Leistra, M., van den Berg, F., 1997.
Estimation method for the volatilization of pesticides from
fallow soil. Environmental Planning Bureau Series 4, DLO
Winand Staring Centre, Wageningen, The Netherlands,
99pp.
Stier, P., Feichter, J., Kinne, S., Kloster, S., Vignati, E., Wilson,
J., Ganzeveld, L., Tegen, I., Werner, M., Schultz, M.,
ARTICLE IN PRESSA.M. Sehili, G. Lammel / Atmospheric Environment 41 (2007) 8301–83158314
Author's personal copy
Balkanski, Y., Boucher, O., Minikin, A., Petzold, A., 2005.
The aerosol-climate model ECHAM5-HAM. Atmospheric
Chemistry and Physics 5, 1125–1156.
TGD, 1996. European Commission Technical Guidance Document
in Support of The Commissions Directive 93/67/EEC on Risk
Assessment for the Notified Substances and the Commission
Regulation (EC) 1488/94 on Risk Assessment for Existing
Substances. European Chemicals Bureau, Ispra, Italy.
Wang, D., Chen, J., Zhen, X., Qiao, X., Huang, L., 2005.
Disappearance of polycyclic aromatic hydrocarbons sorbed
on surfaces of pine [Pinua thunbergii] needles under irradia-
tion of sunlight: Volatilization and photolysis. Atmospheric
Environment 39, 4583–4591.
Wania, F., Mackay, D., 1995. A global distribution model for
persistent organic chemicals. Science of the Total Environ-
ment 160/161, 211–232.
World Health Organization, 2002. Health Risks of Persistent
Organic Pollutants from Long-range Transboundary Air
Pollution. European Centre for Environment and Health,
Bonn, 200pp.
ARTICLE IN PRESSA.M. Sehili, G. Lammel / Atmospheric Environment 41 (2007) 8301–8315 8315