Global Equities in the Year of the Rooster · 2015 2016 For Professional Investors only ... Source:...
22
Global Equities in the Year of the Rooster Bill Maldonado Global CIO Equities
Transcript of Global Equities in the Year of the Rooster · 2015 2016 For Professional Investors only ... Source:...

Global Equities in the Year of the Rooster
Bill Maldonado
Global CIO Equities
2
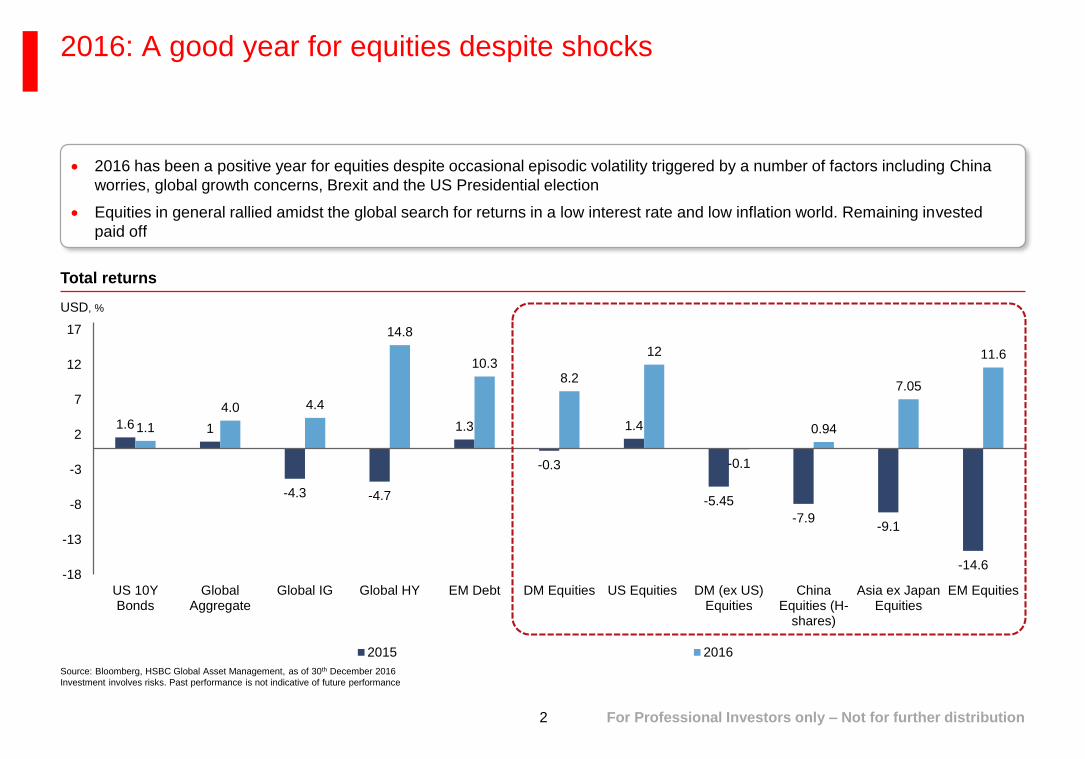
2016: A good year for equities despite shocks
Source: Bloomberg, HSBC Global Asset Management, as of 30th December 2016
Investment involves risks. Past performance is not indicative of future performance
2016 has been a positive year for equities despite occasional episodic volatility triggered by a number of factors including China
worries, global growth concerns, Brexit and the US Presidential election
Equities in general rallied amidst the global search for returns in a low interest rate and low inflation world. Remaining invested
paid off
1.6 1
-4.3 -4.7
1.3
-0.3
1.4
-5.45
-7.9-9.1
-14.6
1.1
4.0 4.4
14.8
10.38.2
12
-0.1
0.94
7.05
11.6
-18
-13
-8
-3
2
7
12
17
US 10YBonds
GlobalAggregate
Global IG Global HY EM Debt DM Equities US Equities DM (ex US)Equities
ChinaEquities (H-
shares)
Asia ex JapanEquities
EM Equities
2015 2016
For Professional Investors only – Not for further distribution
Total returns
USD, %

3
Many strategists argue that equities are overvaluedBut assuming a mean reversion of conventional valuation metrics is naïve
Source: HSBC AMG Global Investment Strategy, as of December 2016
0
5
10
15
20
25
30
35
40
45
50
1881 1900 1919 1938 1957 1976 1996 2015
Cyclically adjusted Price Earnings Ratio
Historic average P/E
0
2
4
6
8
10
12
14
16
18
US 10-year Government Bond Yield
0
100
200
300
400
500
600
700
1919 1932 1945 1959 1972 1985 1999 2012
Moody's Corporate BAA spread
Many market observers conclude that “everything is overvalued” when looking across conventional valuation metrics
For equities, some analysts cite a range of price metrics (P/Es, Equity/Gold ratios and Tobin’s Q etc). They argue that multiples
are significantly above historic norms and must adjust. Even if this takes place over a multi-year time frame, it would imply very
poor prospective returns from a core return-seeking asset class
Is this view right?
Global bonds at historically low yields… …Credit spreads are tight… …And equity ratings are high
bp

4
…We disagreeValuation needs to be done “in context”
Valuation analysis needs to be done “in context” of:
– (i) the macro-economic and interest rate regime we are in
– (ii) the available opportunity set (ie a cross-asset perspective)
This means that we want to think about valuation in a structured and integrated way
– We don’t think it is right to use ad hoc metrics – ie comparing bond yields vs credit spreads vs equity PEs makes no sense
to us
– And we need to avoid the biases of hindsight and regret
The starting point to think about today’s investment opportunities needs to be an understanding of the
growth/inflation environment we are in and the policy regime we are likely to face
Once we have this, we think hard about the valuation position of each asset class to understand the “implied
odds” that the market is offering us today
Valuation is Key

5
Risk premia todayWhere are valuation opportunities?
Note:1. Global Fixed Income assets are shown hedged to USD. Local EM debt, Equity and Real Estate assets are shown unhedged
Source: HSBC AMG Global Investment Strategy, December 2016
Any forecast, projection or target contained in this presentation is for information purpose only and is not guaranteed in any way. HSBC Global Asset Management accepts no liability for any failure to meet such forecasts, projections or
targets. For illustrative purpose only
Chart shows today’s implied returns (based on current pricing) for a range of asset classes
US TIPS
UK IL Gilts
US Tsy
UK Gilts
Germany Bunds
Japan JGBs
US Corp
US HY
GBP Corp
EUR Corp
EM Sovs USD
EM CreditUS Equity
UK Equity
Japan Equity
EM Equity
AC World Equity
Asia ex Japan Equity
Global Gov
Global Credit
Global ILBs
Global HY
Euro ABSUS 5y Tsy
UK 5y Gilts
Local EM Debt
Europe x UK Equity (H)
UK Equity (H)
Japan Equity (H)
Canada EquityCanada Equity (H)
-2
0
2
4
6
8
10
0 2 4 6 8 10 12 14 16 18 20 22 24 26
Current pecking order of asset classes1
Expected Risk Premia (%, Nominal, USD)
Expected Volatility (%)
Sharpe Ratio = 0.25
Sharpe Ratio = 0.10

6
Global EquitiesThe equity premium is still high
Source: HSBC Global Asset Management, Global Investment Strategy, as of December 2016.
Any forecast, projection or target contained in this presentation is for information purpose only and is not
guaranteed in any way. HSBC Global Asset Management accepts no liability for any failure to meet such forecasts,
projections or targets. For illustrative purpose only
0
5
10
15
20
2005 2007 2009 2011 2013 2015
MSCI US MSCI US (ex AMG)MSCI US (Sector-Neutral) MSCI US (ex Oil & Gas)
The implied expected return on global equities is
around 5.5%. This is hardly inspiring relative to
history and investors need to be realistic about the
sustainable returns on offer
However, the equity risk premium remains high
relative to our expectations for cash interest rates
and relative to government bonds even after the
recent sell-off
The equity vs bonds decision seems clear
A reflationary environment favours global equities
relative to competing asset classes
In the absence of an imminent recession and sharply
deteriorating corporate fundamentals, harvesting the
equity premium makes sense
Cyclical data looks good and recession probability
models suggest a low chance of an imminent recession
Recent US macro profits data illustrates relatively stable
corporate fundamentals
President-elect Trump’s policies appear capital-friendly
200
250
300
350
400
450
500
0
500
1,000
1,500
2,000
2,500
2005 2007 2009 2011 2013 2015
US Corporate Profits - Total, LHSUS Corporate Profits - Domestic, LHSUS Corporate Profits - Rest of the World, RHS
US Corporate profits
MSCI US
USDbn USDbn
ROE, %

7
Europe/Japan Equity MarketsRelatively high implied premia
Source: HSBC Global Asset Management, Global Investment Strategy, December 2016
6000
8000
10000
12000
14000
16000
18000
20000
22000
60
70
80
90
100
110
120
130
2010 2011 2012 2013 2014 2015 2016
JPY/USD (LHS) Nikkei 225 (RHS)
0
5
10
15
20
Jan 14 May 14 Sep 14 Jan 15 May 15 Sep 15 Jan 16 May 16 Sep 16
Eurozone Japan
In Japan, the ERP is around 5%. With “yield curve
control” proving effective so far, is the Bank of
Japan guaranteeing us the equity premium?
– A move towards more co-ordinated fiscal-monetary
policy, in addition to BOJ ETF buying, should be
supportive for equities
Eurozone equity valuations also remain attractive.
Implied premia close to 5% in some markets (eg
Germany) and the profits catch-up story remains in
play
– Activity data is also encouraging. Growth is running well
above trend. With continued ECB support, this could be
sustained
We want to hedge Japan and European equity
market exposures (from the perspective of USD
investors). We want to be exposed to equity market
returns driven by sustained local currency
weakness
JPY and Nikkei
12m forward earnings in Europe and Japan
JPY/USD Index
Y-o-y%

8
Asia/Emerging MarketsAsia/EM risk is also attractively priced
Source: HSBC Global Asset Management, Global Investment Strategy, as of December 2016
Investment involves risks. Past performance is not indicative of future performance
-40
-30
-20
-10
0
10
20
30
2011 2012 2013 2014 2015 2016
Earnings Growth Multiple Expansion Dividend Yield FX Total Return
10
12
14
16
18
20
2005 2007 2009 2011 2013 2015
MSCI EM MSCI EM (ex Oil & Gas and Basic Materials)
Asia/EM equities have been a major laggard over
the last decade. Disappointing earnings growth,
multiple contraction and depreciating currencies
have all weighed on total returns
Today, (i) equity valuations look reasonable, (ii)
Asia/EM currencies look undervalued, (iii)
profitability and cyclical indicators are improving
We estimate the implied sustainable return on
Asia/EM equities at around 9% in USD terms
Weak profitability over the past three years has
been primarily driven by commodity-related sectors
(see chart)
Interest rates remain high in many markets. There
is potential for a secular equity market re-rating
Political concerns and dis-continuities from dollar
strength/more aggressive Fed scenario are
important risks however. There is a lot of
uncertainty here. We need to be comfortable that
we are being compensated for the risk
MSCI Emerging Markets Index (USD) Total Return
Decomposition
MSCI EM
%
ROE, %

Key themes for 2017

10
Beneficiaries of reflationary and pro-growth policies
Source: Datastream, UBS as of November 2016.
Rebased
The near-term growth outlook for the US has improved with the turn up in PMIs and the expected fiscal policy proposals of
President-elect Trump which will likely boost GDP growth in 2017
Emerging market cyclical indicators have been improving. Equity earnings expected to pick up further as better macro data
supports the corporate environment
S&P 500 earnings expected to continue to grow
MSCI Emerging Markets universe earnings revisions have
bottomed
Any forecast, projection or target contained in this presentation is for information purposes only and is not guaranteed in any way. HSBC accepts no liability for any failure to meet such forecasts, projections or targets. For illustrative
purpose only

11
Emerging market vs developed market equities
Source: HSBC Global Asset Management, Bloomberg as at 30 December 2016. For illustrative purposes. Any performance information shown refers to the past and should not be seen as an indication of future returns
-15%
-10%
-5%
0%
5%
10%
15%
20%
25%
De
c-0
4
Jun-0
5
De
c-0
5
Jun-0
6
De
c-0
6
Jun-0
7
De
c-0
7
Jun-0
8
De
c-0
8
Jun-0
9
De
c-0
9
Jun-1
0
De
c-1
0
Jun-1
1
De
c-1
1
Jun-1
2
De
c-1
2
Jun-1
3
De
c-1
3
Jun-1
4
De
c-1
4
Jun-1
5
De
c-1
5
Jun-1
6
De
c-1
6
Difference in 5-year annualized return of EM and DM Equities
EM equities have been a major laggard over the last decade, as disappointing earnings growth, multiple contraction and
depreciating currencies have all weighed on total returns
EM equities have lagged DM peers in the last decade

12
The case for emerging market equities
Source: HSBC Global Asset Management, DataStream as at 30 September 2016. For illustrative purposes only
-2%
0%
2%
4%
6%
19
81
19
86
19
91
19
96
20
01
20
06
20
11
20
16
Emerging markets Developed markets
Emerging markets now contribute about a third of global GDP and half of global GDP growth
In the short to medium term, we expect economic fundamentals to be supportive for EM equities
Continued, rapid, industrialisation will boost growth while potential moves up the value chain could improve corporate earnings in
some economies
Contribution to global GDP growth

13
The case for emerging market equities II
Source: HSBC Global Asset Management, DataStream as at 30 September 2016. For illustrative purposes only
Emerging market equities – MSCI Emerging Markets Index, Developed Market Equities – MSCI World Index
0.0
1.0
2.0
3.0
4.0
De
c-9
9
De
c-0
1
De
c-0
3
De
c-0
5
De
c-0
7
De
c-0
9
De
c-1
1
De
c-1
3
De
c-1
5
Emerging Markets Developed Markets
0%
5%
10%
15%
20%
Jan-9
5
Jan-9
7
Jan-9
9
Jan-0
1
Jan-0
3
Jan-0
5
Jan-0
7
Jan-0
9
Jan-1
1
Jan-1
3
Jan-1
5
Emerging Markets Developed Markets
Today, (i) equity valuations look reasonable, (ii) EM currencies look undervalued, (iii) profitability and cyclical indicators are
improving
Emerging market equities expected returns appear attractive versus bonds and cash
Valuations: Price-Book Return on Equity (RoE)

14
Asia ex Japan equities favoured amongst peers
Source: Bloomberg, MSCI, HSBC Global Asset Management, as of December 2016. Investment involves risks. Past performance is not indicative of future performance
0.5
1.0
1.5
2.0
2.5
3.0
1996 1999 2002 2005 2008 2011 2014
Asia ex-JP - Trailing PB
1.41x now
1.23x in
Feb 090.94x in
Aug 98
1.22x in
Mar 03
1.23x on
21 Jan
Avg: 1.77x
1.19x in
Sep 01
-1.6
-1.4
-1.2
-1.0
-0.8
-0.6
-0.4
-0.2
0.0
0.2
0.4
8/11 8/12 8/13 8/14 8/15 8/16
Asia ex Japan forward P/B vs. EU Asia ex Japan forward P/B vs. US
MSCI Asia ex Japan has rallied strongly since Brexit, led by cyclical sectors including materials, energy and financials
Even after recent rally, Asia is still trading at a 17% discount to average historic levels
Discount to developed markets has not narrowed significantly, despite an improving outlook
Asian equities likely to remain in favour, supported by improving earnings outlook and compelling valuations
Asia ex Japan P/B valuation vs developed markets Asia exJ trailing P/B at 20% discount to normalised levels

15
Asia ex Japan equity earnings outlook improving
Source: CLSA, Credit Suisse, HSBC Global Asset Management, data as of January 2017
0%
2%
4%
6%
8%
10%
12%
14%
16%
18%
Dec-95 Dec-98 Dec-01 Dec-04 Dec-07 Dec-10 Dec-13 Dec-16
Asia ex-JP - ROE
9.9% now
13.8% Dec 10
low 11.5% in 2009
low 1.7% in 1998
10% 6 months ago
-7
-6
-5
-4
-3
-2
-1
0
1
2
Jan16
Feb16
Mar16
Apr16
May16
Jun16
Jul16
Aug16
Sep16
Oct16
Nov16
Dec16
Earnings revisions appear to have bottomed, percentage of companies missing their earnings estimates has trended down
recently
Rising consumption, stable commodity prices and supportive monetary policy (rate cuts) are all tailwinds for earnings in Asia
The rate of decline in RoE for MSCI Asia ex Japan has slowed to just 0.1% over the past six months, one third of the 0.3% decline
in MSCI US RoE
MSCI Asia ex Japan earnings revisions have bottomed MSCI Asia ex Japan RoEs starting to bottom
L3M earnings revision (17F, %)

16
Chinese market still highly inefficient; earnings revisions abound
Significant earnings revisions in Chinese equities for the past 2 years
– For 2014, 21% of companies beat consensus by more than 10%, 38% of companies missed consensus by more than 10%
– For 2015, 28% of companies beat consensus by more than 10%, 30% of companies missed consensus by more than 10%
– For 2016, 13% of companies had more than 10% upward earnings revisions, 35% have more than 10% downward earnings revision
Our internal earnings estimates could be 6-12 month ahead of the market
– Proprietary demand/supply analyses enable us to come up with better margin estimates
Source: Goldman Sachs, as of December 2016
For illustrative purposes only and does not constitute any investment recommendation in the above-mentioned securities. Past performance is not indicative of future performance
Any forecast, projection or target contained in this presentation is for information purposes only and is not guaranteed in any way. HSBC accepts no liability for any failure to meet such forecasts, projections or targets
2014 2015 2016
Sectors
Net Income
actual vs
Jan
Consensus
Net Income
actual vs
July
Consensus
Net Income
actual vs
Jan
Consensus
Net Income
actual vs
July
Consensus
Net Income
Dec vs Jan
Energy -2% -16% -62% -33% -29%
Materials -49% -40% -37% -27% 26%
Industrials -21% 34% -10% -15% -10%
Consumer Discretionary -19% -6% -28% -22% -10%
Consumer Staples -30% -23% -29% -20% -22%
Health Care -33% -17% -2% -1% -3%
Banks -8% -2% -7% -2% 0%
Insurance -9% 19% 35% 5% -21%
Property 5% 14% 0% 14% -22%
Information Technology -21% 0% -3% 20% -5%
Telecommunication Services -5% 4% -5% -3% -15%
Utilities -26% -17% -4% -7% -24%
MSCI China -9% -1% -11% -4% -8%
% of
stocks Distribution of YTD performance
MSCI
China<-20% -20%~ -10% -10% ~0% 0%~+10% +10~+20% >+20% Universe
2014 21% 16% 14% 16% 10% 23% 100%
2015 28% 15% 18% 9% 9% 22% 100%
2016 27% 19% 18% 16% 8% 12% 100%
% of
stocks Distribution of earnings revision
MSCI
China<-20% -20%~ -10% -10% ~0% 0%~+10% +10~+20% >+20% Universe
2014 26% 12% 20% 21% 11% 10% 100%
2015 23% 7% 27% 17% 9% 19% 100%
2016 21% 14% 27% 25% 3% 10% 100%
Earnings revision and price performance for MSCI ChinaMSCI China – Consensus vs actual earnings

17
Chinese equity valuations
Source: MSCI, Bloomberg, Credit Suisse, HSBC Global Asset Management, data as of 31 December 2016. Investment involves risks. Past performance is not indicative of future performance
MSCI China is still trading below its average historic valuation
Investors need to be selective in terms of opportunities
0
1
2
3
4
5
6
1/96 1/98 1/00 1/02 1/04 1/06 1/08 1/10 1/12 1/14 1/16
12-month return
112.6%
12-month return
-5.4%
12-month return
60.2%
12-month return
82.5%12-month return
?
0.43x
Aug 98
0.54x
Feb 00
1.22x
Apr 03
1.51x
Oct 08
1.56x
Now
10-year average: 2.11x
Price-to-book (x)

18
Shenzhen-Hong Kong Stock Connect – Gateway to opportunity
Source: Bloomberg, MSCI, as of December 2016
Shenzhen-Hong Kong Stock Connect opens up a brand new universe for international investors to potentially monetise compelling
growth opportunities
The Shenzhen equity market offers investors a wider and deeper hunting ground for new economy sectors such as consumer
discretionary, consumer staples and information technology, which boast higher earnings growth and are arguably better placed to
benefit from ongoing economic reforms
On the other hand, the opening up of the HK small cap universe allows an expanded channel for mainland investors to effectively
diversify their assets and FX allocations.
Source: Bloomberg, FactSet, Goldman Sachs Global Investment Research, as of January 2017
0.1
0.6
1.1
1.6
2.1
2.6
4/14 7/14 10/14 1/15 4/15 7/15 10/15 1/16 4/16 7/16 10/16 1/17
HSSI SME ChiNext100 HSMI
0.98x
1.22x
0.69x
0.47x
0%
20%
40%
60%
80%
100%
Shanghai Shenzhen MSCI China
Consumer discretionary Consumer staples EnergyFinancials Health care IndustrialsInformation technology Materials Real estateTelecom services Utilities
Sector allocation of Shanghai, Shenzhen and offshore
Chinese equity marketsSmall-mid caps in HK seem more attractively valued than their
onshore peers
Trailing 12m PEG (X)

In conclusion

20
Impact of unexpected events diluted in long term
0
50
100
150
200
250
2005 2006 2007 2008 2009 2010 2011 2012 2013 2014 2015 2016
S&P 500 Total return index MSCI ACWI (USD) Total Return Index
Hurricane Katrina
hit the Gulf Coast
of the US, almost
destroying New
Orleans
London
bombings
North Korea’s
1st nuclear test
Saddam Hussein is
executed
Multiple suicide
bombings in
northern Iraq
Thailand rocked
by bombs
The US sub-
prime housing
crisis
Icelandic and
Russian
Financial Crisis
Global Financial
Crisis
Israel invaded
Gaza
The US withdrew
from Iraq
Lehman
Brothers
collapsed
Oil price swings
between US$145 –
US$32 p.b.
North Korea
fired missiles
Haiti
earthquake
European
sovereign debt
crisis
Japan’s
nuclear
disaster
1st Libyan civil
war
Gold skyrocketed to ~US$1,900
per ounce
Arab Spring
Uprising
Israel and
Gaza conflict is
reignited
Kenyan
shopping mall
attack
North Korea’s
3rd nuclear test
Spain accepted
EUR100 bn
bailout deal
The US reached a
crisis point nearly
defaulting on public
debt
DJI dropped 634
pts. in 1 day
The Hang Seng
Index dropped
2,100 pts in 1 dayRise of ISIS in
the Middle East
and on the world
stage
2nd Libyan civil
war
US stocks sink
as oil price hits
$40
Charlie Hebdo
attack Paris
Russian
Financial Crisis
Russia made
incursions into
Ukraine
DJI dropped 9%
between 21 – 24
Aug
Greek banks
shut for 6 days
Bond yields
turned negative
as central banks
rolled out asset-
purchase
programs
Chinese stock
market slump
Deutsche
announces to
cut 9,000 jobs in
2015 - 2018
Investors retreat
from
commodities on
concerns over
China’s Growth.
Glencore
plunged 31% in
Oct.
“Brexit”
Source: Bloomberg, HSBC Global Asset Management as of 30th December 2016
Past performance is not an indication of future returns. The performance may go down as well as up
US
election
OPEC
meeting

21
Looking ahead – 2017 and beyond
Global economy remains in a state of fragile equilibrium with a low growth/inflation mix
Combination of reflationary policies, corporate fundamentals and compelling valuations form a supportive
backdrop for equities in the year ahead
Equity premiums look attractive in a low return world, especially when compared with government bonds
Emerging market equities, particularly in Asia, continue to stand out in terms of growth prospects, positive
earnings revisions and valuations
The Year of the Rooster will see an overhang from many of the risks that materialised in the previous year and
new ones including de-globalisation and potential policy missteps
On a longer time perspective, geopolitical events play much less important role than fundamentals and
economic and market development

22
Important Information
This presentation is intended for Professional Clients only and should not be distributed to or relied upon by Retail Clients.
The contents of this presentation are confidential and may not be reproduced or further distributed to any person or entity, whether in whole or in part, for
any purpose. The material contained herein is for information only and does not constitute investment advice or a recommendation to any reader of this
material to buy or sell investments. This document is not intended for distribution to or use by any person or entity in any jurisdiction or country where such
distribution or use would be contrary to law or regulation. This document is not and should not be construed as an offer to sell or the solicitation of an offer
to purchase or subscribe to any investment.
HSBC Global Asset Management has based this presentation on information obtained from sources it believes to be reliable but which it has not
independently verified HSBC Global Asset Management and HSBC Group accept no responsibility as to its accuracy or completeness.
This presentation is intended for discussion only and shall not be capable of creating any contractual or other legal obligations on the part of HSBC Global
Asset Management or any other HSBC Group company. Care has been taken to ensure the accuracy of this presentation but HSBC Global Asset
Management accepts no responsibility for any errors or omissions contained therein.
This presentation and any issues or disputes arising out of or in connection with it (whether such disputes are contractual or non-contractual in nature, such
as claims in tort, for breach of statute or regulation or otherwise) shall be governed by and construed in accordance with English law.
The views expressed above were held at the time of preparation and are subject to change without notice. Any forecast, projection or target where provided
is indicative only and is not guaranteed in any way. HSBC Global Asset Management accepts no liability for any failure to meet such forecast, projection or
target.
The value of investments and any income from them can go down as well as up and investors may not get back the amount originally invested. Where
overseas investments are held the rate of currency exchange may also cause the value of such investments to fluctuate. Stockmarket investments should
be viewed as a medium to long term investment and should be held for at least five years. Any performance information shown refers to the past and should
not be seen as an indication of future returns. The value of the underlying assets is strongly affected by interest rate fluctuations and by changes in the
credit ratings of the underlying issuer of the assets.
HSBC Global Asset Management (UK) Limited provides information to Institutions, Professional Advisers and their clients on the investment products and
services of the HSBC Group.
This presentation has been produced by HSBC Global Asset Management (Hong Kong) Limited and has been approved for issue in the United Kingdom by
HSBC Global Asset Management (UK) Limited. Authorised and regulated by the Financial Conduct Authority. www.assetmanagement.hsbc.com/uk
Copyright © HSBC Global Asset Management (UK) Limited 2017. All rights reserved 17-I-00274/SC/Asian EqCNY/26/01/2017/LB EXP 31/03/2017