Global Environment - Universidade Nova de...
47
Global Environment Francesco Franco Nova SBE October 8, 2014 Francesco Franco Global Environment 1/47
Transcript of Global Environment - Universidade Nova de...

Global Environment
Francesco Franco
Nova SBE
October 8, 2014
Francesco Franco Global Environment 1/47

Money & BanksBanks in the West: deposit, exchange,credit and public
• Italian Bankers and Banks, Merchants, Goldsmiths (later inEngland): Bills of Exchange
• Ricciardi (default by Edward I 1275), Peruzzi (1435), Bardi,Medici (1494)
• Bank of Venice, Genova Casa di San Giorgio (later Barcelona,Palermo,...)
• Bank of Amsterdam (1609), Banco di Giro (1152, 1587),Hamburg (1612), Nuremberg, Rotterdam
• Bank of Sweden, bank notes (copper), oldest central bank(1668), Economic Nobel for 300th anniversary
• Bank of England (1694), Tensions between private and publicpurposes
Francesco Franco Global Environment 2/47

MoneyThe many forms of Money: from liquid to illiquid, M1, M2, M3
Figure : M3
Francesco Franco Global Environment 3/47

MoneyThe many forms of Money: from liquid to illiquid, M1, M2
Figure : ((M2-M1)/M1)/Y
Francesco Franco Global Environment 4/47

Monetary PolicyShort term interest rate
Figure : Monetary Policy instrument
Francesco Franco Global Environment 5/47

Monetary PolicyCentral Banks
• The US:http://www.federalreserveeducation.org/about-the-fed/history/
• The Euro:http://www.ecb.int/ecb/educational/movies/html/index.en.html?id=2
• China:http://www.pbc.gov.cn:8080/publish/english/963/index.html
Francesco Franco Global Environment 6/47

A model is neede to organize thoughtsNot always easy
http://money.cnn.com/2011/03/10/markets/bondcenter/pimco_gross_bonds/?iid=EL
Francesco Franco Global Environment 7/47

Money Supply ProcessAgents
1 Central Bank2 Banks (depository institutions; financial intermediaries)3 Depositors (individuals and institutions)4 Borrowers (individuals and institutions)
Francesco Franco Global Environment 8/47

Money Supply ProcessAgents
The CB influences the other players’ actions leading to changes inthe monetary aggregates, M, and the interest rates, i , by:
1 reserve requirements2 open market operations3 discount loans4 QE
Francesco Franco Global Environment 9/47

Central BankBalance Sheet
Liabilities• Currency in circulation: in the hands of the public• Reserves: bank deposits at the Fed and vault cash• Central Bank Securities• Government Deposits• Other
Francesco Franco Global Environment 10/47

Central BankBalance Sheet
Assets• Government securities: holdings by the CB that a�ect money
supply and earn interest• Discount loans: provide reserves to banks and earn the
discount rate• Foreign Assets• Other
Francesco Franco Global Environment 11/47

Central BankBalance Sheet
• The CB controls the Monetary Base (high-powered money:H):
H = CU + R
CU: Currency in circulation R: Total reserves in the bankingsystem.
• The CB has more control over the monetary base than overreserves through:
1 Open market operations2 Discount loans
Francesco Franco Global Environment 12/47

Central BankCentral bank operations examples
• Discount Loans example• OM Purchase from a bank or a person (deposit and currency
cases) example: net e�ect on monetary liabilities is zero.Reserves are changed by random fluctuations. Monetary baseis a more stable variable.
• Interventions in the foreign exchange market:• Buying or selling foreign exchange.• Similar to a open market operation.• Usually sterilized, i.e. counteracted by operations that oset the
change in the monetary base.
Francesco Franco Global Environment 13/47

Central BankTransmission: Deposit Creation
• By using its instruments, the CB controls the monetarybase/reserves and this translates to “control” of broadermonetary aggregates such as M1 by deposit creation by banks:
• OMP imply excess reserves increase; banks loan out the excessreserves; creates a checking account; borrower makespurchases; the money supply has increased
• If excess reserves are zero i.e. Required Reserves RR = TotalReserves TR
RR = ◊D◊=is the required reserve ratio and D= checkable deposits
Francesco Franco Global Environment 14/47

Central BankTransmission: Deposit Creation
• Looking at changes:
�D =1◊�RR
1
◊ is the Simple deposit multiplier• Deposit creation continues until all excess reserves are
eliminated in the banking system.• Note that whether the banks chooses to use its excess
reserves to make loans or buy securities does not matter.
Francesco Franco Global Environment 15/47

Central BankDeposit Creation
• A given level of reserves in the banking system determines thelevel of checkable deposits.
• By controlling reserves, the CB controls the level of checkabledeposits.
• By controlling checkable deposits, the CB controls the moneysupply (M1)
• Critique of the Simple Model:• Holding cash stops the process• Banks may not use all of their excess reserves to buy securities
or make loans
Francesco Franco Global Environment 16/47
Money SupplyThe money multiplier
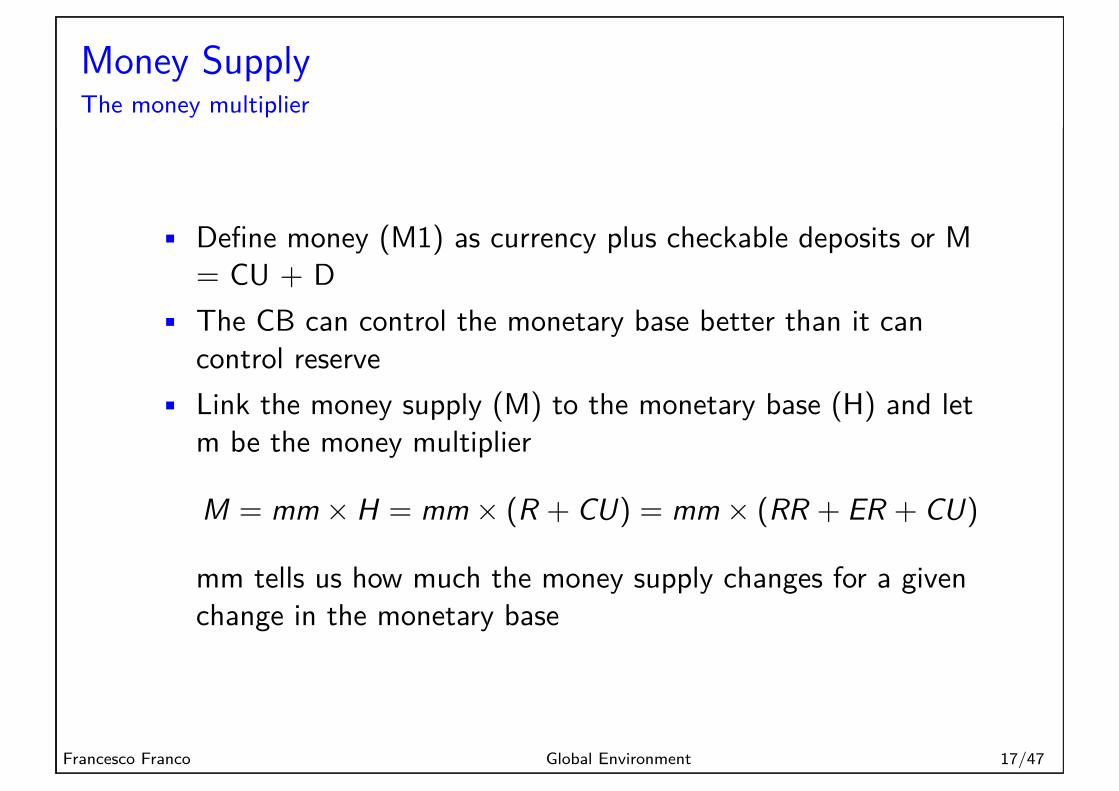
• Define money (M1) as currency plus checkable deposits or M= CU + D
• The CB can control the monetary base better than it cancontrol reserve
• Link the money supply (M) to the monetary base (H) and letm be the money multiplier
M = mm ◊ H = mm ◊ (R + CU) = mm ◊ (RR + ER + CU)
mm tells us how much the money supply changes for a givenchange in the monetary base
Francesco Franco Global Environment 17/47

Money SupplyThe money multiplier
• RR = ◊D
H = RR + ER + CU = ◊D + ER + CU
This reveals the amount of monetary base is needed tosupport the existing amounts of checkable deposits, excessreserves and currency
• An increase in H that goes into currency Cu is not multiplied,whereas an increase that goes into supporting deposits D ismultiplied
• An additional dollar of H that goes into excess reserves ERdoes not support any additional deposits or currency
Francesco Franco Global Environment 18/47

Money SupplyThe money multiplier
• Assume the desired level of currency Cu grows proportionallywith the level of deposits D, i.e.
c =CUD
c is the currency ratio• Assume excess reserves ER grows proportionally with the level
of deposits D, i.e.ERD
e is the excess reserves ratio
Francesco Franco Global Environment 19/47
Money SupplyThe money multiplier
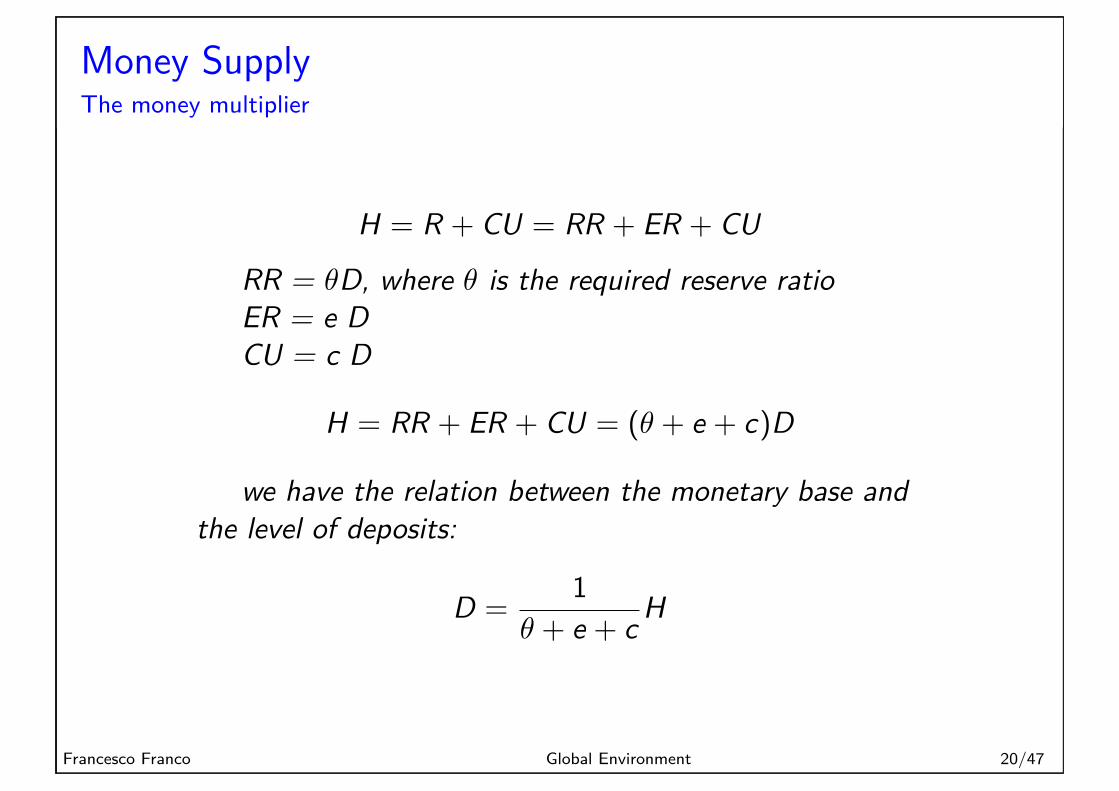
H = R + CU = RR + ER + CU
RR = ◊D, where ◊ is the required reserve ratioER = e DCU = c D
H = RR + ER + CU = (◊ + e + c)D
we have the relation between the monetary base andthe level of deposits:
D =1
◊ + e + c H
Francesco Franco Global Environment 20/47

Money SupplyThe money multiplier
Since money supply M equals deposits D plus currency C:
M =1 + c
◊ + e + c H
and the money multiplier is
mm =1 + c
◊ + e + c
Francesco Franco Global Environment 21/47

Money SupplyThe money multiplier
mm =1 + c
◊ + e + c
• Changes in the required reserve ratio ◊. The money multiplierand the money supply are negatively related to ◊
• Changes in the currency ratio c. The money multiplier andthe money supply are negatively related to c
• Changes in the excess reserves ratio e. The money multiplierand the money supply are negatively related to the excessreserves ratio e
Francesco Franco Global Environment 22/47

Money SupplyThe money multiplier
Figure : mm
Francesco Franco Global Environment 23/47
Monetary PolicyInstruments
• the instability of the multiplier implies that M is di�cult touse as an instrument, especially most illiquid part M2
• transmission of change in reserves to changes in M can beunstable
• reserve market allows to control the interest rate on reserves(opportunity cost of ER)
• transmission of the overnight interest rate to yield curve alsoproblematic but appears to work well in the short term part ofthe curve (in normal times)
Francesco Franco Global Environment 24/47

Monetary PolicySupply and Demand in the Market for Reserves
• The supply of reserves can be broken up into two components:• the amount of reserves that are supplied by the CB’s open
market operations, called non-borrowed reserves• the amount of reserves borrowed from the CB, called discount
loans
• The primary cost of borrowing discount loans from the Fed isthe interest rate the Fed charges on these loans, the discountrate
• In practice, the CB generally sets the discount rate abovemarket interest rates such that BR is very small now intereston excesses reserves
Francesco Franco Global Environment 25/47

Monetary PolicyReserve Market
Figure : Equilibrium in the reserve market
Francesco Franco Global Environment 26/47

Monetary PolicyReserve Market
• Open market operation purchase, repo,main refinancingoperations,outright, LTRO
• Reserve requirement• Discount rate, marginal lending rate, reserve rate, deposit
facility• primary/secondary• Lender of Last Resort (original function of CB) against
panics/moral hazard
• Corridor:https://www.ecb.europa.eu/mopo/implement/sf/html/index.en.html
Francesco Franco Global Environment 27/47

Monetary PolicyGoals
• price stability: low and stable inflation (only mandate forECB)
• employment• growth• stability of financial system: banks, interest rates, exchange
rates
Francesco Franco Global Environment 28/47
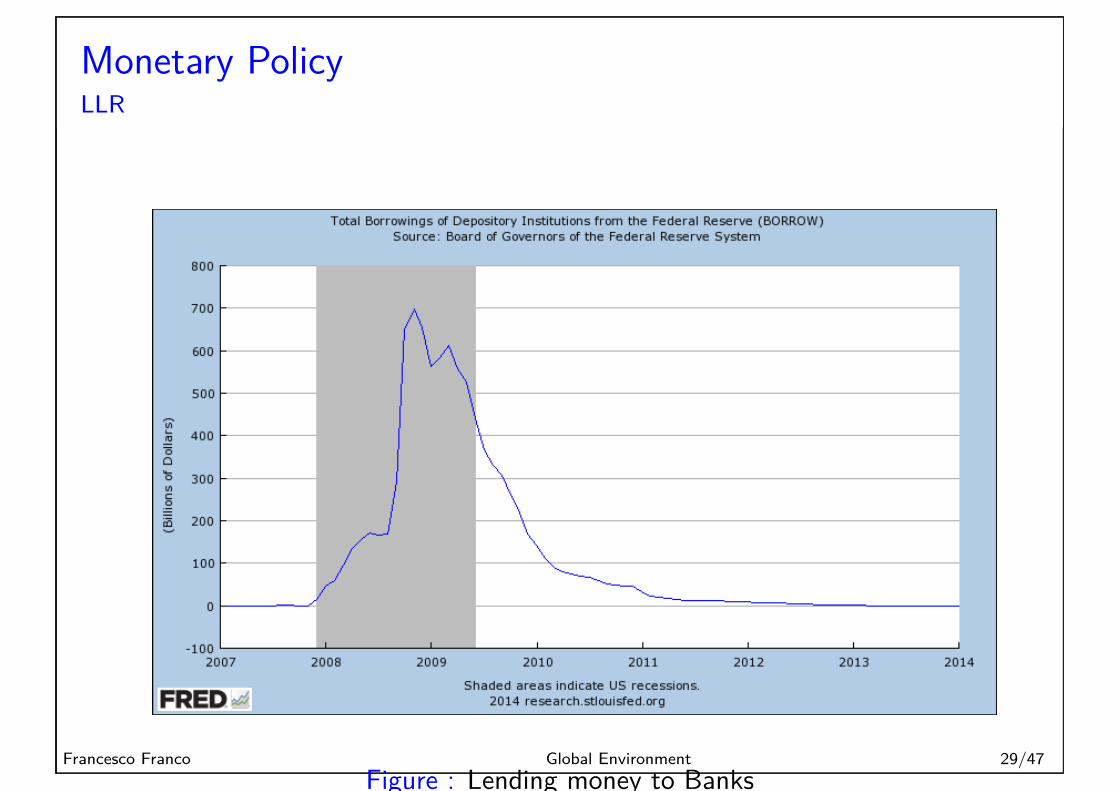
Monetary PolicyLLR
Figure : Lending money to BanksFrancesco Franco Global Environment 29/47
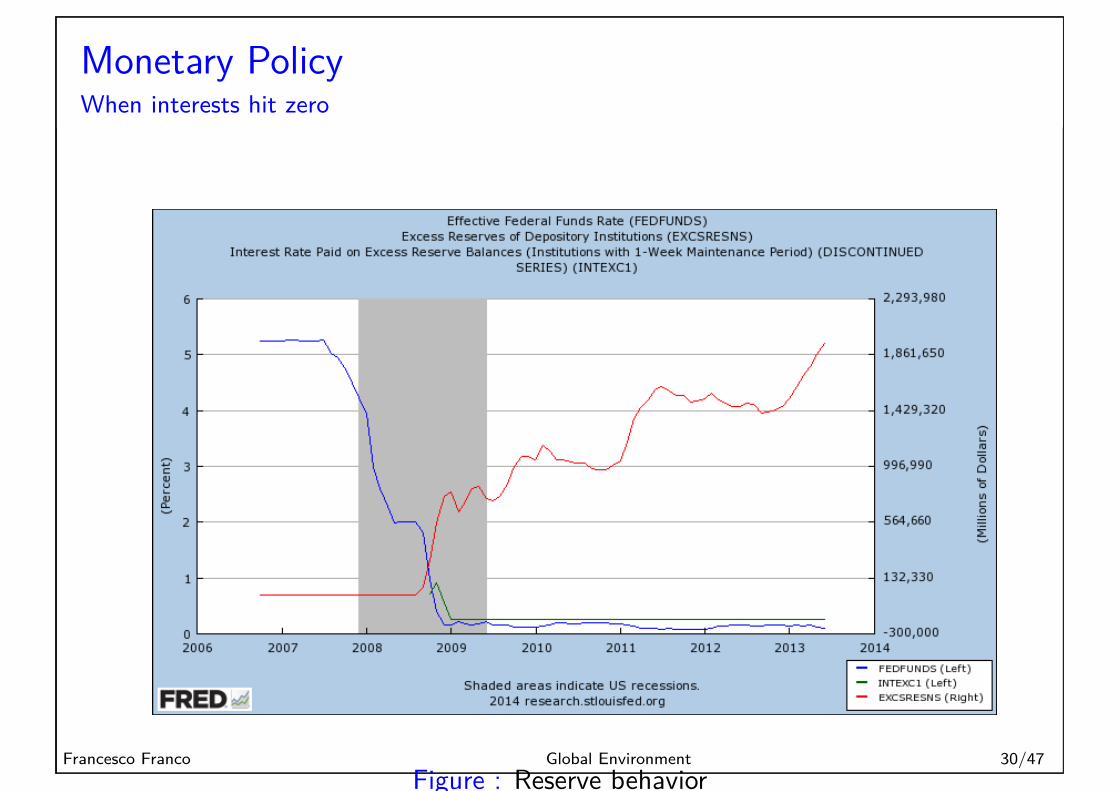
Monetary PolicyWhen interests hit zero
Figure : Reserve behaviorFrancesco Franco Global Environment 30/47

Monetary PolicyTransmission along the curve
Why is it important to control the overnight interest rate? For itstransmission to the longer maturity (analogy to liquidity in M1, M2and M3). The expectational hypothesis
it,T =1T
Tÿ
i=0
iet+i ,1
where t is today, T is maturity and ie are expected interest rates.For example ie
t+1,1 is the one period expected interest rate in oneperiod.
Francesco Franco Global Environment 31/47
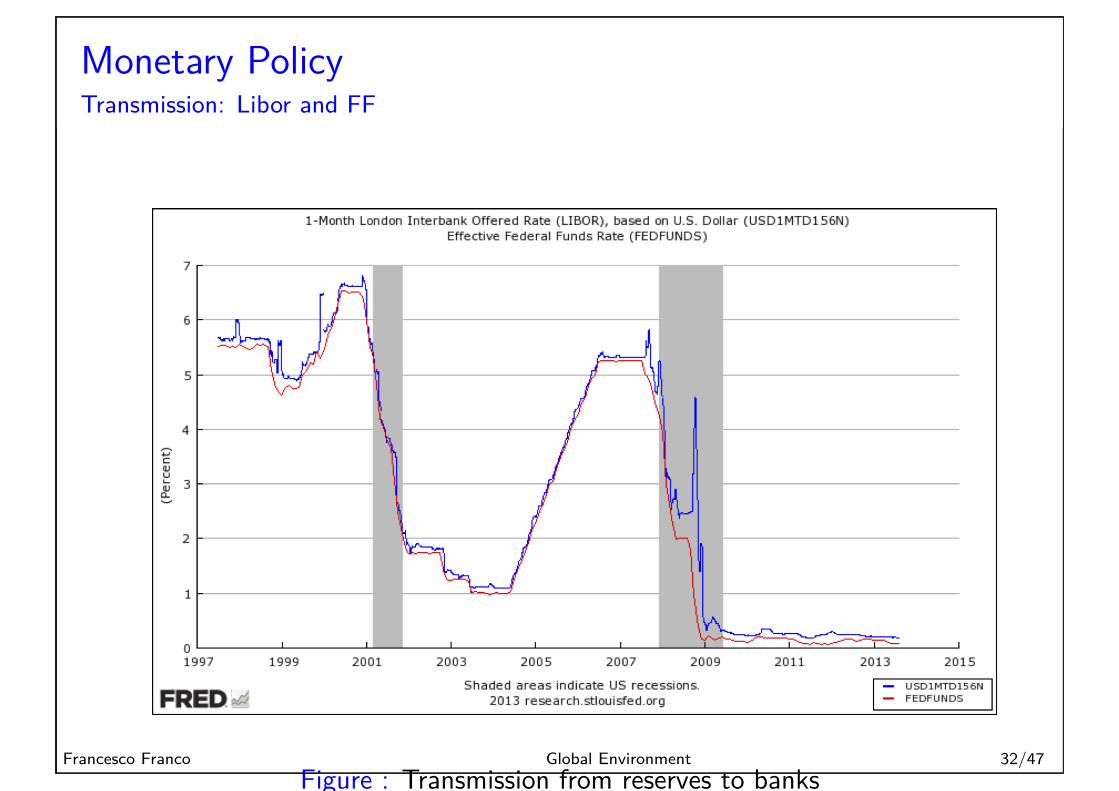
Monetary PolicyTransmission: Libor and FF
Figure : Transmission from reserves to banksFrancesco Franco Global Environment 32/47

Monetary PolicyTransmission: longer maturity
Traditional Preferred-Habitat⁄Scarcity Channel, asset j withmaturity m as an interest rate
i jt,T = it,T + flj
t,m
where fl is a term premium that can demend on the maturity orthe class of asset: imperfect substitution in assets
Francesco Franco Global Environment 33/47

Monetary PolicyTransmission: Banks to Sovereign
Figure : Transmission along the yield curveFrancesco Franco Global Environment 34/47

Monetary PolicyTransmission to the real economy
• we are working in the background with a model in whichmonetary policy a�ects Aggregate Demand (AD) throughinterest rates management, at least for the short-medium run
• notice for AD it is the real interest rate that matters
r = i ≠ fi
• money growth rate translates into inflation in the long run• in models where AD is irrelevant (Flexible prices) money
growth a�ects inflation immediately
Francesco Franco Global Environment 35/47

Monetary PolicyTransmission
Looking the best estimate – the purple line – we can see that increasing the interestrate leads to a reduction in output. In the euro area, the greatest decline in production isreached in the second and third quarters after the increase in the interest rate, comparedto five quarters in the USA.
The second panel from top shows the evolution of the price level. Remember that oneof the assumptions of the IS–LM model is that the price level is given, and thus does not vary with changes in demand. The figure shows that this assumption is not a bad representation of reality in the short term. In the euro area the price level remains almostunchanged approximately for the first five quarters (compared to two quarters in theUSA). It is only after the first five quarters that the price level begins to decline. This sug-gests that the IS–LM model becomes less reliable when we look at the medium term: inthe medium term we can no longer assume that the price level is given, and changes inprices become significant.
Comparing the euro area and the USA we observe that prices react more rapidly in theUSA, although the size of the responses are the same.
Figure 5.16 illustrates two important lessons:
1. It gives us a sense of the dynamics of adjustment in output and other variables inresponse to monetary policy.
2. It shows that what we observe in the economy is consistent with the implications of theIS–LM model. This does not prove that that model is the right model. It could also be that
CHAPTER 5 GOODS AND FINANCIAL MARKETS: THE IS–LM MODEL 103
Figure 5.16The empirical effects of an increase in the interestrate in (a) the euro area and (b) the USAIn the short run, an increase in theinterest rate leads to a decrease inoutput and to an increase inunemployment, but it also has littleeffect on the price level.Source: G. Peersman and F. Smets, The Monetary Transmission Mechanism inthe Euro Area: More Evidence from VarAnalysis, European Central Bank, workingpaper No. 91, December 2001.
Figure : The empirical e�ects of an increase in the interest rate in (a) theeuro area and (b) the USA
Francesco Franco Global Environment 36/47

Liquidity TrapNot the First Time
Figure :
Francesco Franco Global Environment 37/47

Liquidity TrapNot the First Time
Figure :
Francesco Franco Global Environment 38/47

Liquidity TrapIt can happen
• On December 16, 2008 the FOMC reduced the fed funds rateto nearly zero
• is monetary policy completely ine�ective at the zero lowerbound?
• unconventional policies refers to:• credible announcement of the future policy path (last
announcement: from mid 2014 to mid 2015 low fed funds)• changes in the composition and/or size of a central bank’s
balance sheet that are designed to ease liquidity and/or creditconditions
Francesco Franco Global Environment 39/47

Balance Sheet ManagementChannels
• Expectations ⁄ Signalling Channel: captures those changes inthe expected path of future short-term rates (standardexpectation hypothesis)
• Traditional Preferred-Habitat⁄Scarcity Channel, asset j withmaturity m as an interest rate
i jt,m = it,m + flj
t,m
where fl is a term premium that can demend on the maturityor the class of asset: imperfect substitution in assets
• Duration channel: the removal of duration risk shouldgenerate reactions of yields across much of the maturityspectrum
• history
Francesco Franco Global Environment 40/47

Balance Sheet ManagementHistory
Figure : Fed balance sheetFrancesco Franco Global Environment 41/47

QEAssessment: case study
The 8-10-2010, In its statement after that meeting, the FOMCannounced (at 2.15 p.m.) that principal payments from agencysecurities would be reinvested in longer term Treasury. Soonthereafter, at 2.45 p.m., the Federal Reserve Bank of New Yorkissued a statement indicating that the purchases underlying thereinvestment policy would be concentrated in the 2- to 10-yearsector of the nominal Treasury yield curve.
The first two rows of Table 1 establish that, in response to the FRBNY statement, thetwo securities with maturities close to or below 10 years experienced a reversal of onlyabout 20% of the price increases that had come in the wake of the FOMCannouncement.20 In contrast, for the two securities with maturities above 14 years,about two-thirds of the initial price increase was reversed in the wake of the FRBNYannouncement. The contrasting extent of price reversals across the two maturitygroups suggests that roughly two-thirds of the decline in the 14-year Treasury yield isattributable to the anticipation of a reduction in supply around that maturity – which isto say, the scarcity channel.21 The part of the price movement that endured in the wakeof both announcements likely reflected the anticipation of reduction in aggregateduration.
Furthermore, in the wake of the second announcement, the on-the-run 30-yearTreasury yield more than reversed its earlier decline, suggesting that the price action atthis maturity was almost entirely driven by changing perceptions of the likelihood ofpurchases being conducted in this sector rather than by expected changes in duration.Although we cannot rule out the possibility that a fraction of these variations was due torevisions to funds rate expectations, it seems reasonable to assume that those wouldlikely only have a minor impact on yields so far along the yield curve.
4. Data Description and Variable Construction
In this Section, we discuss our data sources and the series that we construct from thedata. To generate accurate measures of local Treasury supply (i.e. the supply of thesecurity in question and that of securities with nearby maturities) and to discern theaggregate characteristics of Treasury debt held by private investors, we start from CU-SIP-level data (i.e. data delineated by the identification number of the issued Treasurysecurity). For each CUSIP, we have available the total amount outstanding (TAO), theamount held in the Federal Reserve!s SOMA portfolio (SOMA), and the cumulativeamount of any Treasury buyback (TB), all of which are measured at par value. The
Table 1
Behaviour of Selected Longer Term Yields on 10 August 2010
Years to maturity Maturity date
Simple returns (%)
(1) 1.55 p.m.–2.35 p.m. (2) 2.35 p.m.–3.35 p.m. (2) ⁄ (1)
(1) 9.51 2 ⁄ 15 ⁄ 2020 0.44 !0.08 !18.9%(2) 10.01 8 ⁄ 15 ⁄ 2020 0.45 !0.09 !20.1%(3) 14.26 11 ⁄ 15 ⁄ 2024 0.64 !0.42 !65.7%(4) 14.52 2 ⁄ 15 ⁄ 2025 0.65 !0.43 !66.2%
20 Part of this reversal likely reflects investors! marking-down of the probability that 10-year Treasurysecurities would be among the bonds purchased. Most likely, investors initially interpreted the FOMC ref-erence to "longer term Treasury securities! as pertaining to maturities beyond seven years.
21 As in the case of the 10-year rate, a minor part of this retracement may be attributable to the expectationthat a smaller amount of duration would be withdrawn from the market, this expectation arising from therealisation that the Federal Reserve would not be buying any maturity beyond 10 years. The likelihood thatthe patterns of the 10- and 14-year rates are driven by the same factors is reinforced by the fact that the twosecurities considered are more similar to each other in duration than in maturity.
F428 [ N O V E M B E RT H E E C O N O M I C J O U R N A L
! 2012 The Author(s). The Economic Journal ! 2012 Royal Economic Society.
Figure : Scarcity versus DurationFrancesco Franco Global Environment 42/47
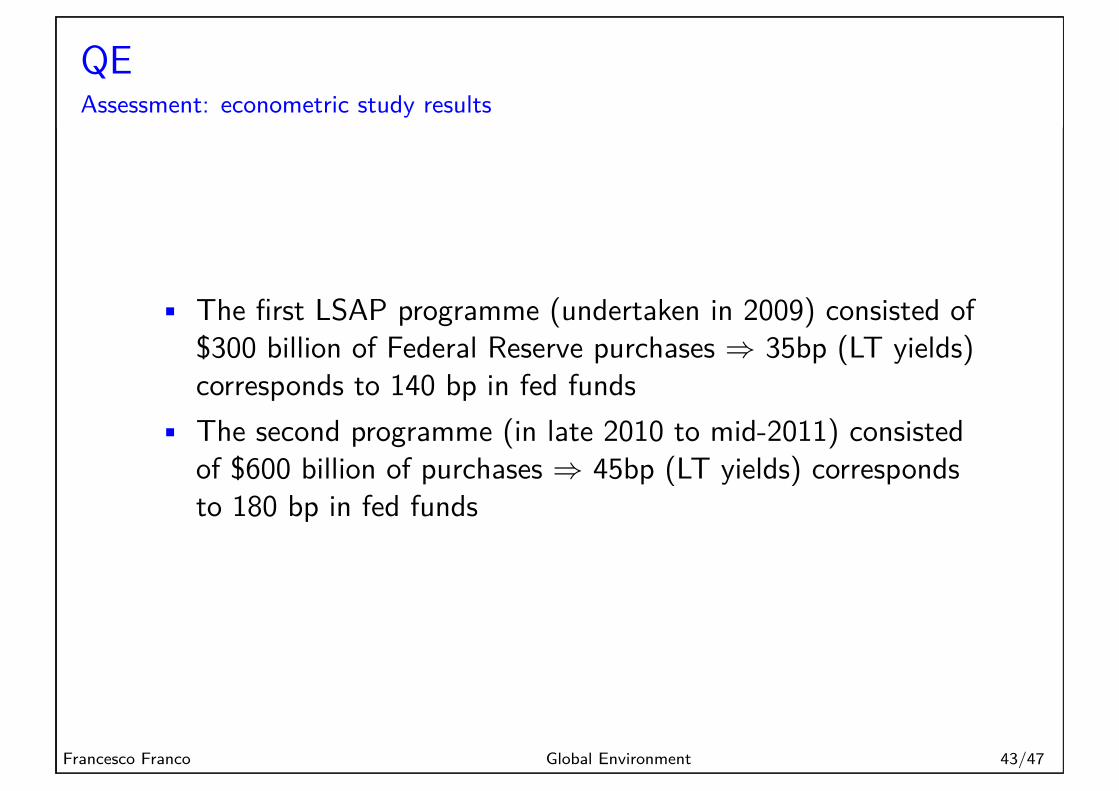
QEAssessment: econometric study results
• The first LSAP programme (undertaken in 2009) consisted of$300 billion of Federal Reserve purchases ∆ 35bp (LT yields)corresponds to 140 bp in fed funds
• The second programme (in late 2010 to mid-2011) consistedof $600 billion of purchases ∆ 45bp (LT yields) correspondsto 180 bp in fed funds
Francesco Franco Global Environment 43/47
QEUncertainty, controversy and international spillovers
• The QE e�ects are far from certain• They have costs: balance sheet reduction of the CB (?),
international spillovers...next class
Francesco Franco Global Environment 44/47

LTROsLong term refinancing operations
Figure : Fianncial fragmentation
Francesco Franco Global Environment 45/47

Monetary PolicySummary
• The Central Bank Balance Sheet• By changing the amount of reserves CB can influence the
amount of Money• By changing the amount of reserves CB can target interbank
interest rate• CB can committ to a path of interest rates to influence the
yield curve• CB can use her balance sheet to target specific asset markets
such as LT bonds or Mortgages
Francesco Franco Global Environment 46/47

Readings
*Olivier Blanchard, Alessia Aminghini, Francesco Giavazzi.Macroeconomics A European Perspective. Prentice Hall 2011,chapter 4: Financial Markets.Charles Kindleberger. A Financial History of Western Europe.2th Edition, chapter 3: Bank Money.**Frederic S. Mishkin and Stanley G. Eakins. Financialmarkets and institutions. 7th edition chap10. p.214-p.232History of Fed and ECB from links above.
Francesco Franco Global Environment 47/47