Global EntrEprEnEurship Monitor - Ser Empreendedor · Global Entrepreneurship Monitor 2006...
30
Global EntrEprEnEurship Monitor William D. Bygrave with Mark Quill 2006 Financing Report
Transcript of Global EntrEprEnEurship Monitor - Ser Empreendedor · Global Entrepreneurship Monitor 2006...

G lo ba l E n t r E p r E n E u r s h i p M o n i t o r
William D. Bygrave with Mark Quill
2006 Financing Report

�
Globa l En t rep reneursh ip Mon i to r
2006 Financing Report
William D. Bygrave
with Mark Quill
Founding and Sponsoring Institutions
Babson College, Babson Park, MA, USALondon Business School, London, UK
The authors thank Marcia Cole for her direction to GEM and her support in the production of this report.
Although GEM data were used in the preparation of this report, their interpretation and use are the sole responsibility of the author.
© 2007 by William D. Bygrave with Mark Quill, Babson College, London Business School

�
Executive Summary 3 KeyFindings—InformalInvestment 4 KeyFindings—FormalInvestment 4 KeyImplications 4
Financing Entrepreneurial Ventures 5EntrepreneurialFinancingfortheWorld’sPoorest 5 Microfinancing 5 MicrocreditforthePoorestofthePoor 6EntrepreneursandInformalInvestors 8 InformalInvestors 8 Entrepreneurs 12 ExpectedFinancialReturns 14VentureCapital 14 ClassicVentureCapitalAmongGEMNations 15
Concluding Comments �9
References �0
GEM National Teams �006 ��
GEM Sponsors �6
Contacts �7
List of Figures and TablesFigure1:PercentofAdultsWhoAreActiveInformalInvestors 9Figure2:TotalInformalInvestmentasPercentofGDP 9Figure3:AnnualAmountPerInformalInvestorvsGDP 10Figure4:AmountofStartupMoneyvsGDP 11Figure5:PercentofNascentsFundablewithAvailableInformalInvestment 13Figure6:ClassicVentureCapitalasaPercentofGDP(2005) 16Figure7:AmountofClassicVentureCapitalinG7Nationsin2005 16Figure8:NumberofCompaniesReceivingVentureCapitalinG7Nationsin2005 16Figure9:AmountofClassicVentureCapitalperCompany 17
Table1:GrowthintheImplementationofMicrocredit,1997–2003 7Table2:MicrofinancingbyRegion,2003 7Table3:Enterpreneur’sExpectedSourcesofFinancing 12Table4RelationshipofInformalInvestortoEntrepreneur 12
Table of Contents

3
This report reviews and assesses the state of financing for entrepreneurs and their ventures around the world. The empirical data are from the Global Entrepreneurship Monitor (GEM) 2006 study of national level of entrepreneurial activity, microcredit institutions,1 and venture capital associations,2 augmented with some information from the previous years of GEM studies. This is the second time that GEM has published a separate report on financing. The first was in 2004. In other years the financing report has been a section in the GEM Global Report.
Since GEM was launched in 1997 by scholars at Babson College and London Business School, the project has developed into one of the world’s leading research consortia, concerned with improving knowledge about the relationships between entrepreneurial activity and national economic growth. To this end, the project has, from the start, been designed as a multinational research program providing annual assessments of the entrepreneurial sector for a range of countries.
The nations that participated in the GEM 2006 study were Argentina, Australia, Belgium, Brazil, Canada, Chile, China, Colombia, Croatia, Czech Republic, Denmark, Finland, France, Germany, Greece, Hungary, Iceland, India, Indonesia, Ireland, Italy, Jamaica, Japan, Latvia, Malaysia, Mexico, Netherlands, Norway, Peru, Philippines, Russia, Singapore, Slovenia, South Africa, Spain, Sweden, Thailand, Turkey, United Arab Emirates, United Kingdom, United States, and Uruguay.
In this report the term “informal investment” is used in a broad sense to include not only investments, but also loans and even gifts. We think our classification is justified because putting money into a fledgling business is very risky, and the outcome is the same for both lenders and investors if the business fails: They lose money. The term “classic venture capital” includes money invested by professional venture capital firms in seed, early, start-up, and expansion-stage companies.
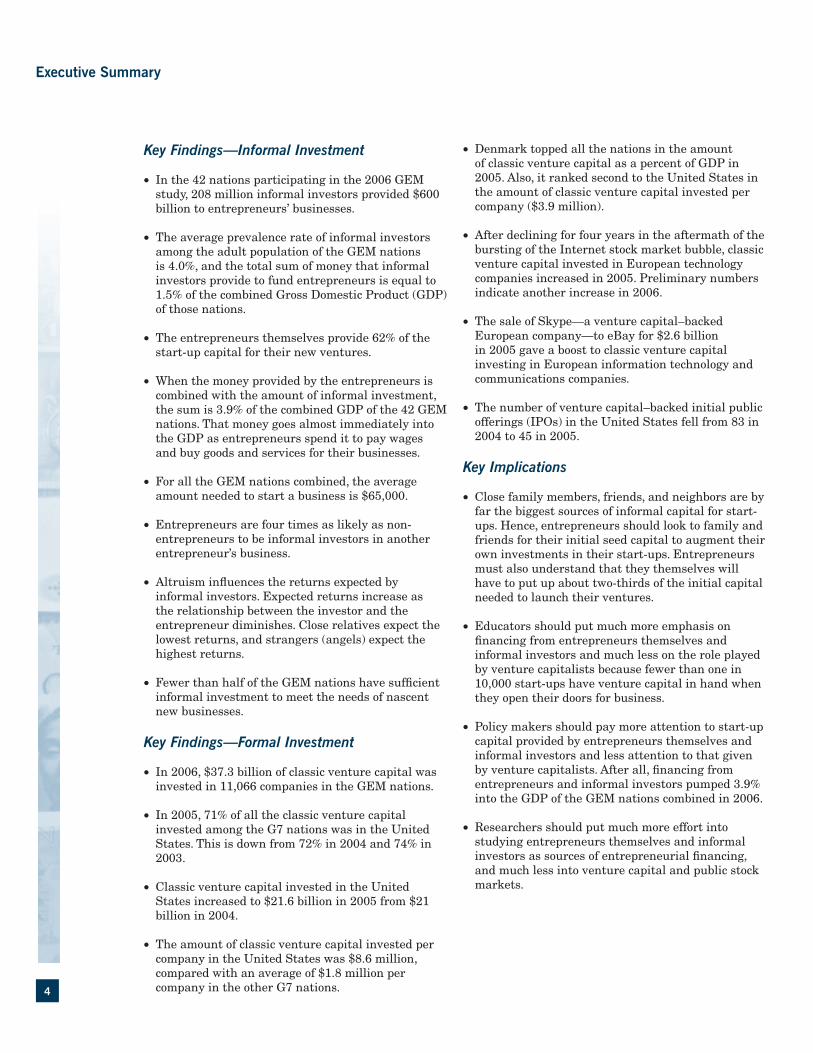
Executive Summary
�
Key Findings—Informal Investment
• In the 42 nations participating in the 2006 GEM study, 208 million informal investors provided $600 billion to entrepreneurs’ businesses.
• The average prevalence rate of informal investors among the adult population of the GEM nations is 4.0%, and the total sum of money that informal investors provide to fund entrepreneurs is equal to 1.5% of the combined Gross Domestic Product (GDP) of those nations.
• The entrepreneurs themselves provide 62% of the start-up capital for their new ventures.
• When the money provided by the entrepreneurs is combined with the amount of informal investment, the sum is 3.9% of the combined GDP of the 42 GEM nations. That money goes almost immediately into the GDP as entrepreneurs spend it to pay wages and buy goods and services for their businesses.
• For all the GEM nations combined, the average amount needed to start a business is $65,000.
• Entrepreneurs are four times as likely as non-entrepreneurs to be informal investors in another entrepreneur’s business.
• Altruism influences the returns expected by informal investors. Expected returns increase as the relationship between the investor and the entrepreneur diminishes. Close relatives expect the lowest returns, and strangers (angels) expect the highest returns.
• Fewer than half of the GEM nations have sufficient informal investment to meet the needs of nascent new businesses.
Key Findings—Formal Investment
• In 2006, $37.3 billion of classic venture capital was invested in 11,066 companies in the GEM nations.
• In 2005, 71% of all the classic venture capital invested among the G7 nations was in the United States. This is down from 72% in 2004 and 74% in 2003.
• Classic venture capital invested in the United States increased to $21.6 billion in 2005 from $21 billion in 2004.
• The amount of classic venture capital invested per company in the United States was $8.6 million, compared with an average of $1.8 million per company in the other G7 nations.
• Denmark topped all the nations in the amount of classic venture capital as a percent of GDP in 2005. Also, it ranked second to the United States in the amount of classic venture capital invested per company ($3.9 million).
• After declining for four years in the aftermath of the bursting of the Internet stock market bubble, classic venture capital invested in European technology companies increased in 2005. Preliminary numbers indicate another increase in 2006.
• The sale of Skype—a venture capital–backed European company—to eBay for $2.6 billion in 2005 gave a boost to classic venture capital investing in European information technology and communications companies.
• The number of venture capital–backed initial public offerings (IPOs) in the United States fell from 83 in 2004 to 45 in 2005.
Key Implications
• Close family members, friends, and neighbors are by far the biggest sources of informal capital for start-ups. Hence, entrepreneurs should look to family and friends for their initial seed capital to augment their own investments in their start-ups. Entrepreneurs must also understand that they themselves will have to put up about two-thirds of the initial capital needed to launch their ventures.
• Educators should put much more emphasis on financing from entrepreneurs themselves and informal investors and much less on the role played by venture capitalists―because fewer than one in 10,000 start-ups have venture capital in hand when they open their doors for business.
• Policy makers should pay more attention to start-up capital provided by entrepreneurs themselves and informal investors and less attention to that given by venture capitalists. After all, financing from entrepreneurs and informal investors pumped 3.9% into the GDP of the GEM nations combined in 2006.
• Researchers should put much more effort into studying entrepreneurs themselves and informal investors as sources of entrepreneurial financing, and much less into venture capital and public stock markets.
Executive Summary

5
Financing Entrepreneurial Ventures
A new business searching for capital has no track record to present to potential investors and lenders. All it has is a plan—sometimes written, sometimes not—that projects its future performance. This means that it is very difficult to raise debt financing from conventional banks because they require as many as three years of actual—not projected—financial statements and assets that adequately cover the loan. Hence, almost every new business raises its initial money from the founders of the businesses themselves and from informal investors: family, friends, neighbors, work colleagues, and strangers. A few raise it from lending institutions, primarily banks, and a miniscule number raise it from venture capitalists. This report examines funding from entrepreneurs themselves, informal investors, and venture capitalists throughout the world.
Before we study the GEM findings for the financing of start-ups in the GEM nations, we will begin by looking at how would-be entrepreneurs eking out subsistence livings in some of the most impoverished regions of the world are being financed by microcredit organizations.
ENTREPRENEURIAL FINANCING FOR THE WORLD’S POOREST
A 2005 article in the Wall Street Journal proposed reducing worldwide poverty by increasing investment in entrepreneurs. To wit: “To ‘make poverty history,’ leaders in private, public and civil-society organizations need to embrace entrepreneurship and innovation as antidotes to poverty. Wealth-substitution through aid must give way to wealth-creation through entrepreneurship.”3 But where do nascent entrepreneurs living in poverty get any money
to start a micro-business? In Africa, for instance, 600 million people live on less than $3 per day based on purchasing power parity (PPP). For China, the number may be 400 million, and for India, 500 million.
Conventional banking is based on the principle that the more you have, the more you can borrow. It is based on collateral, which means that a bank loan must be adequately covered by assets of the business or its owner or in many cases, both. But half the world’s population is very poor, so about 5 billion people are shut out from banks. For example, less than 10% of adults in many African countries have bank accounts. Even in Mexico the number is scarcely 20%.
Microfinancing
In 1976 in the village of Jobra, Bangladesh, an economist named Muhammad Yunus started what today is the Grameen bank. It was the beginning of the microfinance concept, which is best known for its application in rural areas of Bangladesh, but has now spread throughout the world. Yunus believes that access to credit is a human right. According to Yunus, “one that does not possess anything gets the highest priority in getting a loan.” And he practices what he preaches. Even beggars can get loans from the Grameen bank. They are not required to give up begging but are encouraged to take up an additional income-generating activity such as selling popular consumer items door to door or at the place of begging.4 The bank provides larger loans, called micro-enterprise loans, for “fast moving members.” By the end of 2004, almost 300,000 Bangladeshis had taken micro-enterprise loans. The average loan was US$344, and the biggest loan was US$17,195, to purchase a truck. The loan recovery rate is almost 99%, which is remarkable because the bank relies entirely on personal trust, not collateral.5

6
Financing Entrepreneurial Ventures
The 2006 Nobel Peace Prize was awarded to Professor Muhammad Yunus and the Grameen Bank, which he founded in 1983 to dispense tiny loans to Bangladeshi women. These women used the money to transform their lives by purchasing the tools needed to start small businesses.
LaMamanMoleMotukelivedinawreckedcarinasuburbofKinshasa,Zaire,withherfourchildren.Ifshecouldfindsomethingtoeat,shewouldfeedtwoofherchildren;thenexttimeshefoundsomethingtoeat,herothertwowouldeat.Whenorganizersfromamicrocreditlendinginstitutioninterviewedher,shesaidthatsheknewhowtomakechikwangue(maniocpaste),andsheneededonlyafewdollarstostartproduction.Aftersixmonthsoftraininginmarketingandproductiontechniques,MamanMotukegotherfirstloanofUS$100andboughtproductionmaterials.
Today,MamanMotukeandherfamilynolongerliveinabroken-downcar;theyrentahousewithtwobedroomsandalivingroom.Herfourchildrengotoschoolconsistently,eatregularly,anddresswell.Shecurrentlyissavingtobuysomelandinasuburbfartheroutsideofthecityandhopestobuildahouse.6
Microfinancing is now available in many nations. It is generally agreed that microfinance is a powerful tool in the fight to reduce poverty in poorer nations. Here is an example from Mexico.7 When he was 21, Oscar Javier Rivera Jimenez became an entrepreneur by delivering parts on his tricycle in the Chimalhuacan district, which is one of the poorest slums on the outskirts of Mexico City. Six years later he had a warehouse well stocked with girders for local builders, and in 2005, he opened a branch nearby. He then employed nine persons, four from outside his family. He grew his business with money from Compartamos, Latin America’s biggest provider of microfinance. Compartamos (“Let’s share” in Spanish) started life as a non-governmental organization and gained its seed capital from multilateral funds. In 2005, it had more than 300,000 clients and plans to have more than 1 million clients by 2008. Its average loan is $330,8 and like microcredit institutions elsewhere in the world, it reports that less than 1% of its borrowers are more than 30 days late with their payments.
Microcredit for the Poorest of the Poor
The Microcredit Summit Campaign was held in 1997. The aim was “... to reach 100 million of the world’s poorest families, especially the women of those families, with credit for self-employment and other financial and business services by the year 2005.”
It defines the “poorest” people as those who are in the bottom half of those living below their nation’s poverty line, or any of the 1.2 billion people in the world who live on less than $1 per day based on PPP. The Microcredit Summit Campaign Report 2004 provides the following data9 (see Table 1):

7
Financing Entrepreneurial Ventures
Table �. Growth in the Implementation of Microcredit, �997–�003
YEaR NuMbER oF INSTITuTIoNS REpoRTING
ToTaL NuMbER oF CLIENTS REaChEd
NuMbER oF “pooREST” CLIENTS REpoRTEd
1997 618 13,478,797 7,600,000
1998 925 20,938,899 12,221,918
1999 1065 23,555,689 13,779,872
2000 1567 30,681,107 19,327,451
2001 2186 54,932,235 26,878,332
2002 2572 67,606,080 41,594,778
2003 2931 80,868,343 54,785,433
Women accounted for 82.5% of the total number of “poorest” clients. Assuming five persons per family, the 54.8 million poorest clients reached by the end of 2003 affected some 274 million family members.10 Table 2 shows the relationship between the number of families living in absolute poverty in each region (i.e., those living under one dollar a day adjusted for PPP) and the number of poorest families reached in each region at the end of 2003.
In 2005—the International Year of Microcredit—the 1997 Microcredit Campaign came close to achieving its goal of reaching 100 million of the world’s poorest families. Put another way, assuming five persons per family, the campaign helped microcredit reach 500 million or 42% of the world’s poorest persons.
Source: Daley-Harris, S., State of the Microcredit Summit Campaign Report 2004, 2004, Microcredit Summit Campaign, http://www.microcreditsummit.org/pubs/reports/socr/2004/SOCR04.pdf
Table �. Microfinancing by Region, �003
aSIa aFRICa & ThE MIddLE EaST
LaTIN aMERICa & ThE CaRIbbEaN EuRopE
Number of Poorest Families (million) 157.8 61.5 12.1 3.5
Number reached by MicroFinance (million) 48.8 4.8 1.1 0.06
Percent Coverage 31% 7.8% 9.1% 1.7%
Source: Daley-Harris, S., State of the Microcredit Summit Campaign Report 2004, 2004, Microcredit Summit Campaign,http://www.microcreditsummit.org/pubs/reports/socr/2004/SOCR04.pdf

�
In the following sections we will examine how entrepreneurs in all financial circumstances, from the poor in developing nations to the well-off in developed nations, raise money to start their new businesses.
ENTREPRENEURS AND INFORMAL INVESTORS
We begin by looking at funding from the 4Fs: informal investors who fall in the categories of Family, Friends, Foolhardy strangers, and the Founding entrepreneurs themselves.
Informal Investors
Informal investors are essential for a vibrant entrepreneurial society. One of the most remarkable discoveries of GEM research is the extent of informal investing. For example, in 2006 we estimate that
there were 208 million active informal investors in the 42 GEM nations and that they invested $600 billion in fledgling companies. The average annual amount invested was approximately $3,000, which may appear to be a modest amount per company. But for an individual starting business, particularly in less developed regions, a relatively tiny sum can make a major difference, as Muhammad Yunus first showed with Bangladeshi women entrepreneurs.
The percent of adults aged 18 to 64 who are active informal investors is shown in Figure 1. The prevalence rate ranges from slightly more than 0.5% in Japan to almost 16% in Peru. As might be expected, most countries with high rates of entrepreneurial activity also have high informal investor prevalence rates (e.g., Peru, India, and Indonesia) and vice versa (e.g., Japan). But there are notable exceptions such as Brazil, which has a comparatively high rate of entrepreneurial activity but a low informal investor prevalence rate.
Financing Entrepreneurial Ventures

9
Financing Entrepreneurial Ventures
Figure �. percent of adults Who are active Informal Investors
Perc
ent o
f Adu
lt Po
pulat
ion B
etwe
en 1
8-64
Year
s
16
14
12
10
8
6
4
2
0
Japa
nBr
azil
Philip
pines
Russ
iaNe
ther
lands
Unite
d Ki
ngdo
mCr
oatia
Hung
ary
Slov
enia
Irelan
dSw
eden
Germ
any
Italy
Sout
h Af
rica
Belgi
umDe
nmar
kUn
ited
Arab
Em
irate
sGr
eece
Spain
Aust
ralia
Sing
apor
eTu
rkey
Finlan
dM
exico
Arge
ntin
aCa
nada
Fran
ceUr
ugua
yLa
tvia
Norw
ayUn
ited
Stat
esM
alays
iaTh
ailan
dCh
ileCz
ech
Repu
blic
Jam
aica
Icelan
d
Colom
biaCh
ina
Indo
nesia
India Peru
To put the total amount of informal investment in each nation on the same basis, we measure the total amount of informal investment as a percent of GDP in each nation (see Figure 2). This percentage ranges from 0.1% in Brazil to 13% in Indonesia. The average
per nation is 1.8%; looked at another way, informal investment represents 1.5% of the combined GDP of the 42 GEM nations. This is a sizeable amount of money, which usually comes from the savings of informal investors.
Figure �. Total Informal Investment as percent of Gdp
INDONESIA 13.0%
CHINA 10.1%
INDIA 7.8%
Info
rmal
Inve
stm
ent,
perc
ent G
DP
4
3.5
3
2.5
2
1.5
1
.5
0
Japa
n
Braz
il
Philip
pines
Russ
ia
Neth
erlan
ds
Unite
d Ki
ngdo
m
Croa
tia
Hung
ary
Slov
enia
Irelan
d
Swed
en
Germ
any
Italy
Sout
h Af
rica
Belgi
um
Denm
ark
Unite
d Ar
ab E
mira
tes
Gree
ce
Spain
Aust
ralia
Sing
apor
e
Turk
ey
Finlan
d
Mex
ico
Arge
ntin
a
Cana
da
Fran
ce
Urug
uay
Latv
ia
Norw
ay
Unite
d St
ates
Mala
ysia
Thail
and
Chile
Czec
h Re
publi
c
Jam
aica
Icelan
d
Colom
biaPeru

�0
The wealthier a nation, the higher the average annual amount of money that each informal investor puts into start-up companies (see Figure 3). The amount ranges from $308 in the Philippines to $44,000 in the Netherlands. The average amount of money provided
by an informal investor has to be examined relative to the average amount of money that is needed to start a business, which ranges from $843 in the Philippines to $186,000 in the United Arab Emirates (see Figure 4).
Financing Entrepreneurial Ventures
Figure 3. annual amount per Informal Investor vs Gdp
IN
ID
GR
CN TRCO
LVUY
TH
SLCZ
HR
HUAR
ZA
MY
FI
BE
AE
IS
DK
NL
SG DE
NO
USCA
ITES
UKSE AU
JPFRAnnu
al Am
ount
per
Info
rmal
Inve
stor
($)
50,000
45,000
40,000
35,000
30,000
25,000
20,000
15,000
10,000
5,000
0
GDP per Capita (PPP $)
60,00050,00040,00030,00020,00010,0000
y = 0.0012x 1.57
R2 = 0.71
IE
PHJM RUPE
BR MX
CL
Note: R2 is the proportion of the variation that is explained by the trend line. An R2 of 0.71 indicates that 71% of the variation in annual amount per informal investor is explained by GDP per capita.

��
Figure �: amount of Start-up Money vs Gdp
Financing Entrepreneurial Ventures
The money needed to start a business in nations that fall below the trend line in Figure 4 is less than in nations that fall above the trend line. This may partially explain why Norway has a higher rate of early-stage entrepreneurial activity than its Scandinavian neighbors, Sweden and Denmark: It simply costs less to get a new business started in Norway. Another interesting point is that it costs less
to start a business in the nations with so-called Anglo-Saxon economies (Australia, Canada, Ireland, United Kingdom, and the United States). This is consistent with the findings of the GEM 2005 High-Expectation Entrepreneurship, which found that the Anglo-Saxon group of countries has a noticeably higher rate of entrepreneurs starting companies that are expected to create 20 or more jobs.11
y = 0.0225x 1.47
R2 = 0.74
AE
IN
ID
JM
PH
PE CO
CN TH
BR
UY
RU MYMX
CL AR
ZAHU
HRLV
CZ
SL SG
GR
IT
SE
FI
ES
FR
UK DENL
BE
AU
CA
DKIE
NO
USATR
IS
JP
Star
tup
amou
nt ($
)
200,000
180,000
160,000
140,000
120,000
100,000
80,000
60,000
40,000
20,000
0
GDP per Capita (PPP $ )
60,00050,00040,00030,00020,00010,0000
Note: R2 is the proportion of the variation that is explained by the trend line. An R2 of 0.74 indicates that 74% of the variation in annual amount per informal investor is explained by GDP per capita.

��
Financing Entrepreneurial Ventures
Entrepreneurs
The founding entrepreneurs themselves generally provide more of the money to launch their new ventures than do informal investors. Among the GEM nations, the entrepreneurs provide 62% of the start-up funds, with the remaining 38% coming from external sources. When the entrepreneurs’ self-funding is combined with the money from informal investors, it amounts to 3.9% of the GDP of the GEM nations. Not only does this create new companies and jobs, but it also gives an immediate boost to a nation’s economy because new companies immediately spend their start-up money to purchase goods and services and to pay wages of the founding entrepreneurs and employees, if there are any. Hence, most new companies make a sizeable contribution to a nation’s economy before they open their doors for business.
Entrepreneurs expected to get their external financing from multiple sources. Table 3 shows that entrepreneurs know that the 3Fs—Family, Friends, and Foolhardy strangers—are sources of start-up money. The percentage of entrepreneurs who expected to get some of their start-up financing from banks or financial institutions is high—in fact, it ranks highest among all the sources. That number is probably so high because the respondents included nascent entrepreneurs who were still in the process of trying to start their businesses; thus, it seems reasonable to assume that they were still naïve about the chances of getting a bank or other financial institution to invest in a new business. Similarly, they were probably too optimistic about the chances of getting financial support from government programs.
Table 3. Entrepreneur’s Expected Sources of Financing (all GEM Nations)
SouRCES oF FuNdING pERCENT oF ENTREpRENEuRS
Close Family 32.9%
Other Relative 14.5%
Work Colleague 14.7%
Friend or Neighbor 15.3%
Stranger 7.3%
Bank or Other Financial Institutions 42.2%
Government Programs 19.7%
Other 12.3%
When entrepreneurs’ expected sources of funding (Table 3) are compared with the entrepreneurs that informal investors actually invested in (Table 4), we see that entrepreneurs underestimated friends
and neighbors as potential sources of money and overestimated other relatives and work colleagues. But they were approximately correct in their estimate of close relatives and strangers as potential sources.
Table �. Relationship of Informal Investor to Entrepreneur
SouRCES oF FuNdING pERCENT ToTaL
Close Family 48.9%
Other Relative 8.4%
Work Colleague 7.7%
Friend or Neighbor 26.4%
Stranger 5.8%
Other 2.7%
Total 100.0%
Total is more than 100% as entrepreneurs cited multiple sources.

�3
Financing Entrepreneurial Ventures
One never-ending debate in the small business arena is the so-called private equity gap; that is, the shortfall in the amount of money that is available for investment in young companies. We think the GEM study of informal investment sheds some light on the debate. For each GEM nation, we knew the total amount of money that nascent entrepreneurs reported that they needed for their new ventures, and we also knew the total amount of informal investment, so from that we calculated the percentage of nascent businesses that could be funded annually (see Figure 5). Some nations have more than enough money to fund every nascent, regardless of merit. As we have pointed out in the GEM 2004 Financing Report,12 not all nascents merit funding. It seems likely that a country with enough informal investment to fund 40% or more of all its nascent entrepreneurs probably has sufficient informal investment because the majority of new businesses never become viable in the long-term,13 and they fail to produce a satisfactory return on investment for either their owners or investors.
With the 40% criterion, slightly fewer than half of the GEM nations have sufficient informal investment overall. However, the observation that there is enough money overall does not mean that all of it is effectively invested; without doubt, some deserving entrepreneurs fail to raise money, and vice versa.
There are other sources of external funding besides informal investors, for instance, banks and government programs. Just because a nation has insufficent informal investment to fund, let’s say, 40% of its nascents does not mean that there is not enough external money available for entrepreneurs. For example, the amount of informal investment available in Finland could fund less than 10% of its nascents; however, 81% of Finnish nascent entrepreneurs expect to get external funding from banks and 33% from government programs, while only 30% expect to get funding from close family and other relatives.
Figure 5. percent of Nascents Fundable with available Informal Investment
Perc
ent o
f Nas
cent
s
100%
90%
80%
70%
60%
50%
40%
30%
20%
10%
0%
Japa
n
Braz
il
Philip
pines
Russ
ia
Peru
Neth
erlan
ds
Unite
d Ki
ngdo
m
Croa
tia
Hung
ary
Slov
enia
Irelan
dSw
eden
Germ
any
Sout
h Af
rica
Belgi
um
Denm
ark
Unite
d Ar
ab E
mira
tes
Gree
ce
Spain
Aust
ralia
Sing
apor
e
Turk
ey
Finlan
d
Mex
ico
Arge
ntin
a
Cana
daFr
ance
Urug
uay
Latv
ia
Norw
ay
Unite
d St
ates
Mala
ysia
Thail
and
Chile
Czec
h Re
publi
c
Jam
aica
Icelan
d
Colom
bia
Chin
a
Indo
nesia
IndiaIta
ly

��
Financing Entrepreneurial Ventures
Expected Financial Returns
In the GEM 2004 Financing Report, we reported the financial returns that informal investors expected to receive. Here is what we wrote:14
The median expected payback time is two years and the median amount returned is one times the original investment. In other words, there is a negative or zero return on investment for half the informal investments. Interestingly, the payback time and times return are the same for all types of investees except strangers. What’s more, the amount invested in strangers is the highest. The most likely reason is that investments in strangers are made in a more detached and business-like manner than investments in relatives and friends.
There is a big variation in the times return expected by informal investors: 34% expect that they will not receive any of their investment back, whereas 5% expect to receive more 20 or more times the original investment. Likewise, there is a big variation in the payback time: 17% expect to get their return in six months, whereas 2% expect to get it back in 20 years or longer.
Entrepreneurs are much more optimistic about the return on the money that they themselves put into their own ventures: 74% expect the payback time to be two years or sooner, and their median times return is two, with 15% who expect 20 or more times on their original investment.
After we wrote that in 2005, we investigated how the financial returns expected by informal investors were influenced by a number of factors. We found that expected returns are affected by altruism because they increase as the relationship distance between the investor and the entrepreneur increases (i.e., strangers expect higher returns than parents); that men expect higher returns than women; that entrepreneurs expect higher returns than non-entrepreneurs; that expected returns increase as the amount invested increases; that older persons expect lower returns than younger ones; and that
entrepreneurs expect higher returns on investments in their own businesses than on their investments in others’ businesses.15
VENTURE CAPITAL
We began this report by discussing microcredit for the poorest of the poor would-be entrepreneurs. Now we look at the other end of the entrepreneurial finance spectrum: venture capital. As we have pointed out in previous GEM reports, financing from the 4Fs is vital for an entrepreneurial economy. If money from the 4Fs dried up, entrepreneurship would shrivel and die. In contrast, eliminating venture capital would not make a perceptible difference to entrepreneurial activity overall because even in the preeminent venture capital nation, the United States, fewer than one in 10,000 new ventures has venture capital in hand at the outset, and fewer than one in 1,000 businesses ever has venture capital at any time in its existence. Even in the United States, a would-be entrepreneur has a greater chance of winning a million dollars or more in a lottery than getting venture capital.16 Nonetheless, venture capital plays an important role—some say a crucial role—in the advanced economies because some of the companies in which venture capital is invested change the way in which we live, work, and play. Apple, Microsoft, and FedEx have already done this, for example, and eBay, Amazon.com, and Google are now doing this.
The founding and funding of Google (see the text box) is a good example of how high-potential start-ups raise their money. Sergey Brin and Larry Page maxed out their credit cards to buy the terabyte of storage that they needed to start Google in Larry’s dorm room. Then they raised $100,000 from Andy Bechtolsheim, one of the founders of Sun Microsystems, and approximately $900,000 from family, friends, and acquaintances. Subsequently, Google raised $24 million from two venture capital firms, and $1.67 billion from its IPO. The company was three-and-a-half years old when it raised venture capital, and eight-and-a-half when it had its IPO.

�5
Financing Entrepreneurial Ventures
Google: a Classic Example of Funding from the �Fs, Venture Capital, and an Ipo
GooglefoundersLarryPageandSergeyBrinboughtaterabyteofstorageatbargainpricesandbuilttheirowncomputerhousingsinLarry’sdormroom,whichbecameGoogle’sfirstdatacenter.Unabletointerestthemajorportalplayersoftheday,LarryandSergeydecidedtomakeagoofitontheirown.Alltheyneededwasalittlecashtomoveoutofthedorm—andtopayoffthecreditcardstheyhadmaxedoutbuyingtheirterabyteofmemory.Sotheywroteupabusinessplan,puttheirPh.D.plansonhold,andwentlookingforanangelinvestor.Theirfirstvisitwaswithafriendofafacultymember.
AndyBechtolsheim,oneofthefoundersofSunMicrosystems,wasusedtotakingthelongview.OnelookattheirdemoandheknewGooglehadpotential—alotofpotential.Butthoughhisinteresthadbeenpiqued,hewaspressedfortime.AsSergeytellsit,“WemethimveryearlyonemorningontheporchofaStanfordfacultymember’shomeinPaloAlto.Wegavehimaquickdemo.Hehadtorunoffsomewhere,sohesaid,‘Insteadofusdiscussingallthedetails,whydon’tIjustwriteyouacheck?’ItwasmadeouttoGoogleInc.andwasfor$100,000.”
Theinvestmentcreatedasmalldilemma.Sincetherewasnolegalentityknownas“GoogleInc.,”therewasnowaytodepositthecheck.ItsatinLarry’sdeskdrawerforacoupleofweekswhileheandSergeyscrambledtosetupacorporationandlocateotherfundersamongfamily,friends,andacquaintances.Ultimately,theybroughtinatotalinitialinvestmentofalmost$1million.
OnSeptember7,1998,morethantwoyearsaftertheybeganworkontheirsearchengine,GoogleInc.openeditsdoorsinMenloPark,California.Thedoorcamewitharemotecontrol,asitwasattachedtothegarageofafriendwhosubletspacetothenewcorporation’sstaffofthree.Theofficeofferedseveralbigadvantages,includingawasheranddryerandahottub.Italsoprovidedaparkingspaceforthefirstemployeehiredbythenewcompany:CraigSilverstein,nowGoogle’sdirectoroftechnology.
Excerpted from “Google History.” http://www.google.com/corporate/history.html
There is a pattern in the initial funding of Google that is repeated over and over again in almost every start-up. The money comes from the 4Fs: First the founders themselves dip into their own pockets for the initial capital; next they turn to family, friends, and foolhardy investors (business angels). If their companies grow rapidly and show the potential to become superstars, they raise venture capital, then either have an IPO or are acquired by a bigger company. Venture capital is very rare, and IPOs are much rarer. For instance, in the United States in 2005, 910 companies raised $5.3 billion of first-round venture capital, and 45 venture
capital–backed companies raised $3.4 billion with IPOs. In comparison, approximately 3 million new companies raised $100 billion of informal investment, and the founding entrepreneurs themselves contributed another $200 billion or thereabouts.
Classic Venture Capital Among GEM Nations
Approximately 59% of classic venture capital in the GEM nations is invested in companies in the United States; the second highest percentage, 7.9%, is invested in the United Kingdom.

�6
Financing Entrepreneurial Ventures
To put comparisons among nations on an equal footing, the amount of venture capital in each nation is shown as a percentage of GDP (see Figure 6). Compared with 2004, the biggest increases in classic venture capital in 2005 were in Denmark and the United Kingdom, and the biggest decreases were in Belgium and Ireland. The United States and Canada held steady. Year-to-year comparisons can be misleading in some countries such as Greece, the Czech Republic, and Slovenia, where only a few investments are made annually.
Seventy-one percent of the amount of venture capital in the G7 nations was invested in companies in the United States (see Figure 7), but only 33% of the companies were in the United States (see Figure 8). This is because the amount invested per company was much higher in the United States.
Figure 6. Classic Venture Capital as a percent of Gdp (�005)Cl
assic
Ven
ture
Cap
ital,
Perc
ent G
DP
0.450
0.400
0.350
0.300
0.250
0.200
0.150
0.100
0.050
0.000
Japa
n
Neth
erlan
ds
Unite
d Ki
ngdo
m
Hung
ary
Slov
enia
Irelan
d
Swed
en
Germ
any
Belgi
um
Denm
ark
Gree
ce
Spain
Finlan
d
Cana
da
Fran
ce
Norw
ay
Unite
d St
ates
Czec
h Re
publi
c
Chin
a
Italy
Figure 7. amount of Classic Venture Capital in G7 Nations in �005
Figure �. Number of Companies Receiving Venture Capital in G7 Nations in �005
USA71%
Canada5%
France4%
Germany4%
Italy2%
Japan4%
UK10%
Canada8%
France8%
Germany10%
Italy2%
Japan26%
UK13%
USA33%

�7
Financing Entrepreneurial Ventures
The total amount of venture capital in a nation indicates the overall level of investing, but it does not tell us anything about the potential effectiveness of the venture capital that is invested. One measure of the potential effectiveness of venture capital is the amount invested per company (see Figure 9). The highest year-to-year increase was in Denmark, where the average amount invested per company more than doubled to $3.9 million; in most other European nations, the average amount declined, and in the United States, it held steady at $8.6 million. In general, the gap between the average amount invested
per company in the United States and other GEM nations widened year-to-year in 2005 after narrowing somewhat in 2004. As in previous GEM reports, we question how venture capital–backed companies outside the United States can compete with similar ones in the United States when on average they have so much less capital. After all, the U.S. market is much bigger than the home market in other wealthy nations, the cost of starting a U.S. company is lower, and operating expenses are comparable—or sometimes even lower—in the United States.
Figure 9. amount of Classic Venture Capital per Company
0
1,000
2,000
3,000
4,000
5,000
6,000
7,000
8,000
9,000
Clas
sic V
entu
re C
apita
l per
Com
pany
($)
Japa
n
Neth
erlan
ds
Unite
d Ki
ngdo
m
Hung
ary
Slov
enia
Irelan
d
Swed
en
Germ
any
Belgi
um
Denm
ark
Gree
ce
Spain
Finlan
d
Cana
da
Fran
ce
Norw
ay
Unite
d St
ates
Czec
h Re
publi
c
Chin
a
Italy
Sing
apor
e

��
Financing Entrepreneurial Ventures
There have been some notable venture capital successes in Europe. The purchase of Skype, the fast-growing Internet phone company registered in Luxembourg, by eBay for $2.6 billion in 2005, gave a boost to venture capital investments in Europe. We do not yet have detailed data, but preliminary indications suggest that there was a significant increase in venture capital investment in Europe in 2006, whereas it held steady in the United States.
An interesting development in 2006 was the announcement by French President Jacques Chirac that the French government was financially supporting the development of a search engine. In his 2006 New Year’s speech at the Elysée Palace,
Chirac spoke of the need to “take up the global challenge posed by Google and Yahoo!” Subsequently, he announced the development of Quaero, a Franco-German project, to create a search engine. Its budget will be e450m over five years, including e90m in government subsidies.17 This is in stark contrast to the way in which Google and Yahoo were funded in the United States, with money coming from the 4Fs, venture capital firms, and public stock markets. Some Europeans are concerned that by the time Quaero is operational, the market will have moved on. It remains to see how the project turns out, but it will be quite a challenge to compete with Google, whose annual R&D budget tops $500 million.

�9
Concluding Comments
When entrepreneurs are starting a business, they are out of necessity very frugal, so a little start-up financing goes a long way. The average micro-loan to the poorest of the poor is a few hundred dollars, but that is enough to get a business started and provide employment for an entrepreneur. Even in advanced economies, companies start with surprisingly little, including companies like Google that turn out to be superstars and change the global economy. Google started up and developed its search engine with nothing more than the meager resources of two Ph.D. students. It was more than two years old before it even had any external financing from informal investors. There’s no doubt about it—self-financing by entrepreneurs themselves and from family, friends, and strangers is fundamental to entrepreneurship.
Important as venture capital is in the acceleration of superstar companies, it affects only a tiny number of companies overall. In 2005, only 11,066 companies received venture capital in all the GEM nations, compared with hundreds of millions of companies that received money from informal investors and the entrepreneurs themselves. The total amount of venture capital was $38.6 billion, compared with $600 billion of informal investment.
Informal investment is an essential ingredient of an entrepreneurial nation, whereas venture capital makes no perceptible difference to the overall entrepreneurial activity at the grassroots level. Venture capital does, however, make a big difference in the acceleration of a few superstar companies. A nation that wants an environment in which entrepreneurs thrive and prosper must first and foremost have policies that facilitate investment by the 4Fs, because nearly every new venture must have it.

�0
References
1http://www.microcreditsummit.org/involve/page1.htm.
2National Venture Capital Association 2006 Yearbook, European Venture Capital Association 2006 Yearbook, Venture Capital Development in China 2006, Japan Venture Capital Association.
3Prahalad, C. K. Wall Street Journal. Commentary: Aid is Not the Answer. August 31, 2005; Page A8.
4Yunus, M. Grameen Bank at a Glance. 2004. Dhaka, Bangladesh: Grameen Bank.
5http://www.microcreditsummit.org/involve/page1.htm.
6Ibid.
7Authers, John. “Major Victories for Microfinance,” Financial Times, May 18, 2005.
8www.accion.org/more about microfinance.
9Daley-Harris, S. State of the Microcredit Summit Campaign Report 2004, 2004, Microcredit Summit Campaign, http://www.microcreditsummit.org/pubs/reports/socr/2004/SOCR04.pdf.
10As of November 9, 2004, 6,321 institutions were members of the Microcredit Summit Campaign’s 15 councils. Of that number, 3,844 institutions from 131 countries were members of the Microcredit Summit Council of Practitioners. Data in Table 1 were collected from 2,931 institutions, which is 43% of the 6,321 institutions worldwide. Hence, the numbers in Table 1 underestimate the number of clients served throughout the world.
11Autio, E. 2005. Global Entrepreneurship Monitor 2005 Report on High-Expectation Entrepreneurship. www.gemconsortium.org.
12Bygrave, W. D. Global Entrepreneurship Monitor 2004 Financing Report (with Steve Hunt). www.gemconsortium.org.
13Headd, Brian. Business Success: Factors Leading to Surviving and Closing Successfully. Center for Economic Studies, U.S. Bureau of the Census, Working Paper #CES-WP-01-01, January 2001; Advocacy-Funded Research by Richard J. Boden (Research Summary #204).
14Bygrave, W. D. Global Entrepreneurship Monitor 2004 Financing Report (with Steve Hunt). www.gemconsortium.org.
15Bygrave, W. D., and Hunt, S. A. “For love or money? A study of financial returns on informal investments in businesses owned by relatives, friends, and strangers.” Presented at the AGSE Entrepreneurship Research Conference, QUT, Brisbane, Australia, February 2007.
16Bygrave, William, and Zacharakis, Andrew. Entrepreneurship. New York: Wiley. 2007. p. 397.
17http://technology.guardian.co.uk/news/story/0,1761482,00.html#article_continue.

��
GEM National Teams �006
TEaM INSTITuTIoN NaTIoNaL TEaM MEMbERS FINaNCIaL SpoNSoR apS VENdoR
Argentina Center for Entrepreneurship IAE Management and Business School Universidad Austral
Silvia Torres Carbonell Hector Rocha Natalia Weisz
IAE Management and Business School Banco Rio
MORI Argentina
Australia Australian Graduate School of Entrepreneurship, Swinburne University of Technology and Education, Centre for Innovation and CommercialisationThe University of Adelaide
Kevin Hindle Kim Klyver Gary Hancock Noel Lindsay
Australian Graduate School of Entrepreneurship, Swinburne University of Technology and Education, Centre for Innovation and CommercialisationThe University of Adelaide
Australian Centrefor Emerging Technologies and Society
Belgium Vlerick Leuven Gent Management SchoolGhent University
Hans CrijnsMirjam KnockaertSophie ManigartMiguel Meuleman Tom van Acker Sabine Vermeulen
Flemish Ministery of Economic Affairs (Steunpunt Ondernemerschap, Ondernemingen en Innovatie)
TNS Dimarso
Brazil IBQP - Instituto Brasileiro da Qualidade e Produtividade
Simara Maria S. S. GrecoPaulo Alberto Bastos JuniorJoana Paula MachadoSolange Krupa Carlos Artur Krüger PassosJúlio César FelixMarcos Mueller Schlemm
IBQP - Instituto Brasileiro da Qualidade e ProdutividadeSEBRAE- Serviço Brasileiro de Apoio às Micro e Pequenas EmpresasSistema Federação das Indústrias do Estado do Paraná (FIEP, SESI, SENAI e IEL)
Instituto Bonilha
Canada HEC-MontréalSauder School of Business, The University of British Columbia
Nathaly RiverinLouis-Jacques FilionVictor CuiQianqian Du Aviad Pe’erDaniel MuzykaIlan Vertinsky
Gouvernement du QuébecChaire d’entrepreneuriat Rogers-J.A.Bombardier, HEC MontréalThe W. Maurice Young Entrepreneurship and Venture Capital ResearchThe Social Sciences and Humanities Council of Canada
BIP
Chile Universidad Adolfo Ibáñez
Universidad del Desarrollo
Germán Echecopar
José Ernesto Amorós
Centro de Entrepreneurship Grupo SantanderUniversidad Adolfo Ibáñez Centro para el Emprendimiento y la InnovaciónUniversidad del Desarrollo
Benchmark
China National EntrepreneurshipCentre, Tsinghua University
Jian Gao Yuan ChengXibiao LiYanfu JiangWei ZhangLan QinShude Shi
Beijing Municipal Science & Technology Commission
Synovate
Colombia Coordination Team
Universidad del Norte
Pontificia Universidad Javeriana CaliUniversidad ICESI
Universidad de los Andes
Liyis GómezJorge JiménezRodrigo VarelaJuan Pablo Correales Luis Javier Sánchez Alberto IbarraAlberto Arias Fernando Pereira Luis Miguel Alvarez Ana Carolina MartínezCamilo Martinez Rafael Vesga
Comfenalco Valle
Centro Nacional de Consultoría
Czech Republic University of Economics, Prague Martina JaklMartin Lukes
Ministry of Industry and Trade of the Czech RepublicDeloitte Czech Republic
Factum Invenio

��
GEM National Teams �006
TEaM INSTITuTIoN NaTIoNaL TEaM MEMbERS FINaNCIaL SpoNSoR apS VENdoR
Croatia J.J. Strossmayer University in Osijek Slavica SingerNatasa SarlijaSanja PfeiferDjula BorozanSuncica Oberman Peterka
Ministry of Economy, Labour and EntrepreneurshipSME Policy Centre - CEPOR, ZagrebJ.J. Strossmayer University in Osijek - Faculty of Economics, Osijek
Puls, d.o.o., Zagreb
Denmark Centre for Small Business Studies, University of Southern Denmark
Thomas SchøttTorben BagerHannes OttossonLone Toftild
IDEA - International Danish Entrepreneurship Academy Karl Petersen og Hustrus Fond University of Sourthern DenmarkNational Agency for Enterprise and ConstructionVaekstfonden Ernst & Young Ringkøbing Amt Fyns Amt Viborg Amt Sønderjyllands Amt Vestsjællands AmtÅrhus AmtVejle Amt
Institut for Konjunkturanalyse
Finland Turku School of Economics
Imperial College
Anne KovalainenTommi PukkinenJarna HeinonenPekka StenholmErkko Autio
Tekes – Finnish Funding Agency for Technology and InnovationTurku School of Economics
TNS Gallup Oy
France EM Lyon Olivier TorrésDanielle RoussonSophie Vallet
Caisse des Dépôts et ConsignationsObservatoire des PME
CSA
Germany Institute of Economic and Cultural Geography, University of Hannover Institute for Employment Research, Nuremberg
Rolf SternbergUdo BrixyChristian Hundt
Institute for Employment Research, Nuremberg
Infas - Institute for Applied Social Sciences
Greece Foundation for Economic and Industrial Research (IOBE)
Stavros IoannidesAggelos Tsakanikas Takis Politis
Hellenic Bank Association Datapower SA
Hungary University of Pécs George Mason UniversityCorvinus University of BudapestMax Planck Institute of Economics
László SzerbZoltan J. AcsJózsef UlbertSiri TerjesenAttila VargaJudit KárolyKrisztián CsapóGábor Kerékgyártó
Ministry of Economy and TransportUniversity of Pécs, Faculty of Business and EconomcsOhio University
Szocio-Graf Piac-es Közvélemény-kutató Intézet
Iceland Reykjavik University Rögnvaldur SæmundssonSilja Björk Baldursdóttir
Reykjavik UniversityThe Confederation of Icleandic EmployersNew Business Venture FundPrime Minister’s Office
Capacent (formerly known as Gallup)
Ireland University College, Dublin Paula FitzsimonsColm O’GormanPia Arenius
Enterprise IrelandForfásNDP Gender Equality Unit, Department of Justice, Equality and Law Reform
Behaviour and Attitudes
Italy Bocconi University Guido CorbettaAlexandra Dawson
Ernst & Young Target Research
�3
TEaM INSTITuTIoN NaTIoNaL TEaM MEMbERS FINaNCIaL SpoNSoR apS VENdoR
India Pearl School of Business, Gurgaon Janaki RamanI. M. Pandey Ashutosh Bhupatkar
Pearl School of Business, Gurgaon
Metric Consultancy
Indonesia Prasetiya Mulya Business SchoolINRR (Institute of Natural & Regional Resources)Bogor University of Agriculture
Agus Wijaya SoehadiImam SoesenoAsep Saefuddin
Prasetiya Mulya Business SchoolINRR (Institute of Natural & Regional Resources)
MARS (Marketing Research Specialist) Indonesia
Jamaica University of Technology, Jamaica Sandra Glasgow Claudette Williams-Myers Vanetta SkeeteIsmail Olusegun Afis
University of Technology, JamaicaNational Commercial Bank Jamaica LimitedExport-Import Bank of Jamaica LimitedPort Authority of Jamaica LimitedDigicelG-Tech Jamaica Limited
Koci Market Research & Data Mining Services
Japan Kobe UniversityKeio UniversityMusashi University
Takehiko IsobeTsuneo YahagiNoriyuki Takahashi
Venture Enterprise Center SSRI
Latvia TeliaSonera Institute at Stockholm School of Economics in Riga
Vyacheslav DombrovskyOlga RastriginaAndrejs JakobsonsKarlis Kreslins
TeliaSonera NDB Latvijas Fakti
Malaysia Technopreneur Development Division, Multimedia Development Corp. Sdn Bhd
Dato’ Dr. Abu Talib BachikWilson Tay Chuan HuiFahiza BasirAmran YusoffSyed Azizi Wafa Syed Khalid WafaTengku Farith Ritthauddean
Economic Planning Unit, Prime Ministers DepartmentMultimedia Development Corporation Sdn BhdTechnopreneurs Association of MalaysiaUniversiti Malaysia Sabah
Rehanstat Sdn Bhd
Mexico Tecnológico de Monterrey, Business Development CentreTecnológico de Monterrey, EGAP, Strategic Studies Centre
Arturo TorresMarcia CamposElvira Naranjo
Tecnológico de Monterrey Profesionales en Estudios de Mercado y Cultura, S.C.
Netherlands EIM Business and Policy Research Jolanda HesselsSander WennekersKashifa SuddleAndré van StelNiels BosmaRoy ThurikLorraine UhlanerIngrid VerheulPhilipp Koellinger
Dutch Ministry of Economic Affairs
Stratus (formerly known as Survey@)
Norway Bodø Graduate School of Business Lars Kolvereid Bjørn Willy ÅmoErlend Bullvaag
Innovation NorwayMinistry of Trade and Industry Ministry of Local Government and Regional Development Kunnskapsparken Bodø AS, Center for Innovation and EntrepreneurshipKunnskapsfondet Nordland AS Bodø Graduate School of Business
TNS
Peru Centro de Desarrollo Emprendedor, Universidad ESAN
Jaime Serida Keiko Nakamatsu Armando Borda Oswaldo Morales
Universidad ESAN SAMIMP Research
GEM National Teams �006

��
TEaM INSTITuTIoN NaTIoNaL TEaM MEMbERS FINaNCIaL SpoNSoR apS VENdoR
Philippines Philippine Center for Entrepreneurship Foundation Inc.
Imelda J. Madarang Sonia Tiong-Aquino Vicentita Cervera Gloria Chavez Ma. Corazon Lopez Jaime Noel Santos Katrina Kay Bulaong
Philippine Center for EntrepreneurshipPresident’s Social FundNational Livelihood Support Fund
Synergy Business Consultancy
Russia Saint Petersburg TeamSchool of Management, Saint Petersburg
Vassily DermanovValery KatkaloOlga VerhovskayaMaria Rumyantsteva
School of Management, Saint Petersburg
Levada-Center
Moscow Team State University - Higher School of Economics, Moscow
Alexander ChepurenkoOlga ObraztsovaTatiana AlimovaVladimir LobachevAlla AlievaDmitry Naumov
State University - Higher School of Economics, Moscow
Levada-Center
Singapore National University of Singapore (NUS)Entrepreneurship Centre
Poh Kam WongLena LeeHo Yuen Ping
Standards, Productivity and InnovationBoard (SPRING) Singapore and NationalUniversity of Singapore (NUS) Enterprise
Joshua Research Consultants
Slovenia Institute for Entrepreneurship and Small Business Management, Faculty of Economics & Business, University of Maribor
Miroslav RebernikPolona TomincKsenja Pusnik
Slovenian Research AgencyMinistry of the EconomySmart ComFinance – Slovenian Business Daily
RM PLUS
South Africa UCT Centre for Innovation and Entrepreneurship, Graduate School of Business, University of Cape Town
Mike Herrington Gideon Maas
Liberty Life, Standard Bank, South African Breweries and the National Research Foundation
AC Nielsen ZA
Spain
Regional Teams:AndalucíaAsturiasCanary I.Castille LeonCastille la ManchaCataloniaC. ValencianaExtremaduraGaliciaMadridMurciaNavarraBasque Country
Instituto de Empresa
Regional Universities:CádizOviedoLas Palmas & La LagunaLeónCastille la ManchaAutónoma de BarcelonaMiguel HernándezFundación Xavier de SalasSantiago de CompostelaAutónoma de MadridMurciaPública de NavarraDeusto & Basque Country
Ignacio de la VegaAlicia Coduras
Regional Team Directors:José Ruiz NavarroJuan Ventura VictoriaRosa M. Batista CaninoMariano Nieto AntolínMiguel Ángel Galindo MartínCarlos GuallarteJosé Mª Gómez GrasRicardo Hernández MogollónJ. Alberto Díez de CastroEduardo Bueno CamposAntonio Aragón SánchezIñaki Mas EriceIñaki Peña Legazkue
Dirección Gral. Política PYMEsInstituto de EmpresaCámaras de ComercioJunta de AndalucíaGob. del Principado de AsturiasGob. De Canarias, CabildoFondo Social EuropeoCentros de Innovación Europeos (Navarra, Murcia, C y León)Generalitat de CatalunyaJunta de ExtremaduraAir Nostrum, CEG, BIC GaliciaIMADE, FGUAM Fundación Caja MurciaEusko IkaskuntzaInstituto Vasco de Competitividad and others
Instituto Opinòmetre S.L.
Sweden ESBRI – Entrepreneurship and Small Business Research Institute
Magnus AronssonLena RamfeltMikael Samuelsson
Confederation of Swedish Enterprise (Svenskt Näringsliv) NUTEK – Swedish Agency for Economic and Regional Growth VINNOVA – Swedish Governmental Agency for Innovation Systems
SKOP
GEM National Teams �006

�5
GEM National Teams �006GEM National Teams �006
TEaM INSTITuTIoN NaTIoNaL TEaM MEMbERS FINaNCIaL SpoNSoR apS VENdoR
Thailand College of Management, Mahidol University
Thanaphol VirasaBrian HuntRandall Shannon Tang Zhi Min
Office of Small and Medium Enterprises PromotionCollege of Management, Mahidol University
Taylor Nelson Sofres (Thailand) Ltd.
Turkey Yeditepe University Nilufer EgricanEsra Karadeniz
SiemensTechnology Development Foundation of Turkey
Akademetre
United Arab Emirates
Zayed University David McGlennon Kenneth J PreissDeclan McCrohanRaed Daoudi
Mohammed Bin Rashid Establishment for Young Business Leaders
IPSOS-STAT (Emirates)
United Kingdom
London Business School
Northern Ireland TeamSmall Business Research Centre, Kingston University Scottish Team Hunter Centre for Entrepreneurship, University of StrathclydeWelsh TeamNational Entrepreneurship ObservatoryUniversity of GlamorganCardiff University
Rebecca Harding
Mark Hart
Jonathan Levie
David BrooksbankDylan Jones-Evans
Small Business ServiceBarclays Bank plcEast Midlands Development Agency, Yorkshire ForwardSouth East England Development Agency, North West Development Agency, Government Offices for the North East, One North East, East of England Development AgenciesBarking and Dagenham District CouncilInstitute for Family Business (UK)
Invest Northern Ireland
Hunter Centre for Entrepreneurship, University of StrathclydeWelsh Assembly Government Welsh European Funding Office
Iff
United States Babson College
George Mason University
Erlend BullvaagI. Elaine AllenZoltan J. AcsWilliam D. Bygrave Stephen Spinelli, Jr. Marcia Cole
Babson College
George Mason University
Opinion ResearchCorp.
Uruguay Universidad de Montevideo Jorge Pablo Regent VitaleLeonardo VeigaAdrián EdelmanCecilia Gomeza
IEEM Business School - Universidad de Montevideo
Mori
GEM Global Coordination Team
London Business School
Babson College
Utrecht UniversityImperial College
Rebecca HardingMark Quill Davina McAleely Chris Aylett Mick Hancock Maria MinnitiMarcia Cole Niels BosmaErkko Autio
London Business SchoolBabson College

�6
GERA AND GEM
The Global Entrepreneurship Research Association (GERA) is, for formal constitutional and regulatory purposes, the umbrella organization that hosts the GEM project. GERA is an association formed of Babson College, London Business School, and representatives of the Association of GEM national teams.
The GEM program is a major initiative aimed at describing and analyzing entrepreneurial processes within a wide range of countries. The program has three main objectives:
• To measure differences in the level of entrepreneurial activity between countries
• To uncover factors leading to appropriate levels of entrepreneurship • To suggest policies that may enhance the national level of entrepreneurial
activity.
New developments, and all global, national and special topic reports, can be found at www.gemconsortium.org. The program is sponsored by Babson College and London Business School.
BABSON COLLEGE
Babson College in Wellesley, Massachusetts, USA, is recognized internationally as a leader in entrepreneurial management education. Babson grants BS degrees through its innovative undergraduate program, and grants MBA and custom MS and MBA degrees through the F.W. Olin Graduate School of Business at Babson College. Babson Executive Education offers executive development programs to experienced managers worldwide. For information, visit www.babson.edu.
LONDON BUSINESS SCHOOL
London Business School’s vision is to be the pre-eminent global business school, nurturing talent and advancing knowledge in a multinational, multi-cultural environment. Founded in 1965, the School graduated more than 800 MBAs, Executive MBAs, Masters in Finance, Sloan Fellows, and PhDs from more than 70 countries last year. The School’s executive education department serves 6,000 executives and 60 corporate clients on its programs every year. London Business School is based in the most accessible and international city in the world and is one of only two business schools in the UK to be awarded a six-star (6*) rating by the Higher Education Funding Council for England (HEFCE), confirming the School as a center of world-class research in business and management. For information, visit www.london.edu.
GEM Sponsors

�7
Contacts
CONTACTS
For more information on this report, contact the author at:
To download copies of the GEM Global Report(s), GEM National Team Reports, and to access select data sets, please visit the GEM Web site:
www.gemconsortium.org Nations not currently represented in the GEM Consortium may express interest in joining and ask for additional information by e-mailing Marcia Cole at [email protected].


G lo ba l E n t r E p r E n E u r s h i p M o n i t o r
William D. Bygrave with Mark Quill
2006 Financing Report