Global energy trends and Norwegian opportunities · China, total energy consumption is expected to...
16
Global energy trends and Norwegian opportunities Statkraft's Low Emissions Scenario
Transcript of Global energy trends and Norwegian opportunities · China, total energy consumption is expected to...

Global energy trends and Norwegian opportunities
Statkraft's Low Emissions Scenario


Global energy trends and Norwegian opportunities – Statkraft's Low Emissions Scenario
The increase in world energy consumption during the last decade has been unprecedented, driven by population and economic growth. Whilst energy growth has largely been met by fossil energy sources, we have in recent years witnessed a strong growth in installed capacity of renewable energy, particularly onshore wind and solar.
To make the best possible decisions, Statkraft continually monitors and analyses global and regional drivers in the energy markets. We are now in a transition phase for the world's energy systems. To better capture uncertainties, Statkraft develops several long-term scenarios towards 2035. In this report we present one of these scenarios, called the Low Emissions Scenario. This scenario illustrates an optimistic, yet realistic, future for technology development and greenhouse gas emissions from the energy sector. The Low Emissions Scenario builds on Statkraft's own country analyses and in-depth studies of numerous external sources1. This scenario is one of several that informs Statkraft’s commercial decisions.
To put it simply, decarbonising a modern economy should happen in two stages. First, greenhouse gas emissions must be reduced in the power sector. Then that emission-free power must be used to electrify the processes that were previously powered by fossil energy.
Norway differs from most other countries in that we have completed the first stage. We already have an emission-free power sector, mainly based on flexible hydropower. Since there are no emissions to cut in the power sector, climate policies should be geared towards cutting emissions in other parts of the economy, primarily through electrification. The final part of the report points out some areas where conditions are favourable for making better use of our renewable power.
1 In regions or sectors where Statkraft does not conduct its own analyses or in-depth studies, the main reference is the IEA World Energy Outlook 2015, New Policies Scenario. (For more details see Table 1 on page 11).
3STATKRAFT'S LOW EMISSIONS SCENARIO

1) Low Emissions Scenario globally
➔ The rate of growth in renewable technologies will continue as in recent years, driven by a continued sharp decline in costs and a more stringent climate policy. This will allow emissions from energy consumption to drop off around 2020 and fall from around 32 GtCO2 in 2020 down to 27 GtCO2 by 2035, which brings us closer to the two-degree target.
➔ Global power consumption will increase by 2.6 per cent annually during the period, primarily as a result of electrification in transport, buildings and industry.
➔ The entire increase in consumption will be covered by emission-free power generation.
➔ Fossil power generation will drop by 12 per cent during the period. Coal consumption will fall by 33 per cent from current levels by 2035. Oil consumption will start to decline from 2025 onwards.
2) Norwegian opportunities
➔ The key to decarbonising the Norwegian economy is electrification. Norway has a particularly good starting point. Where other countries are now just starting their transition to cleaner electricity, the Norwegian power sector is already almost emission-free. The greatest potential for electrification lies in transport and industry.
➔ Realistically, electrification in Norway across onshore sectors can potentially reduce emissions nationally by around 10 million tonnes from the current level. In addition, increased industrial production in Norway based on renewable energy can reduce global emissions.
➔ If the goal is to decarbonise the Norwegian economy, the current policy instruments in these sectors are heading in the right direction.
Summary of key findings in Statkraft's Low Emissions Scenario:
5STATKRAFT'S LOW EMISSIONS SCENARIO
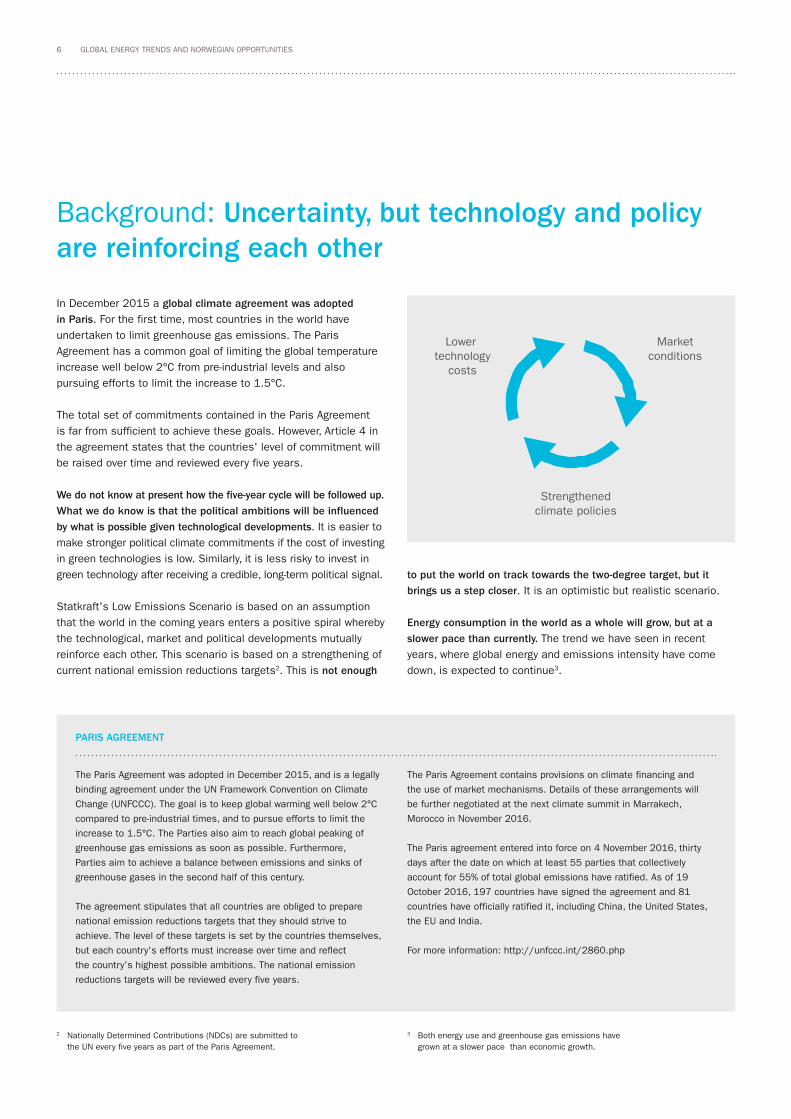
Background: Uncertainty, but technology and policy are reinforcing each other
In December 2015 a global climate agreement was adopted in Paris. For the first time, most countries in the world have undertaken to limit greenhouse gas emissions. The Paris Agreement has a common goal of limiting the global temperature increase well below 2°C from pre-industrial levels and also pursuing efforts to limit the increase to 1.5°C.
The total set of commitments contained in the Paris Agreement is far from sufficient to achieve these goals. However, Article 4 in the agreement states that the countries' level of commitment will be raised over time and reviewed every five years.
We do not know at present how the five-year cycle will be followed up. What we do know is that the political ambitions will be influenced by what is possible given technological developments. It is easier to make stronger political climate commitments if the cost of investing in green technologies is low. Similarly, it is less risky to invest in green technology after receiving a credible, long-term political signal.
Statkraft's Low Emissions Scenario is based on an assumption that the world in the coming years enters a positive spiral whereby the technological, market and political developments mutually reinforce each other. This scenario is based on a strengthening of current national emission reductions targets2. This is not enough
to put the world on track towards the two-degree target, but it brings us a step closer. It is an optimistic but realistic scenario.
Energy consumption in the world as a whole will grow, but at a slower pace than currently. The trend we have seen in recent years, where global energy and emissions intensity have come down, is expected to continue3.
Lower technology
costs
Strengthenedclimate policies
Marketconditions
2 Nationally Determined Contributions (NDCs) are submitted to the UN every five years as part of the Paris Agreement.
PARIS AGREEMENT
The Paris Agreement was adopted in December 2015, and is a legally
binding agreement under the UN Framework Convention on Climate
Change (UNFCCC). The goal is to keep global warming well below 2°C
compared to pre-industrial times, and to pursue efforts to limit the
increase to 1.5°C. The Parties also aim to reach global peaking of
greenhouse gas emissions as soon as possible. Furthermore,
Parties aim to achieve a balance between emissions and sinks of
greenhouse gases in the second half of this century.
The agreement stipulates that all countries are obliged to prepare
national emission reductions targets that they should strive to
achieve. The level of these targets is set by the countries themselves,
but each country's efforts must increase over time and reflect
the country's highest possible ambitions. The national emission
reductions targets will be reviewed every five years.
The Paris Agreement contains provisions on climate financing and
the use of market mechanisms. Details of these arrangements will
be further negotiated at the next climate summit in Marrakech,
Morocco in November 2016.
The Paris agreement entered into force on 4 November 2016, thirty
days after the date on which at least 55 parties that collectively
account for 55% of total global emissions have ratified. As of 19
October 2016, 197 countries have signed the agreement and 81
countries have officially ratified it, including China, the United States,
the EU and India.
For more information: http://unfccc.int/2860.php
3 Both energy use and greenhouse gas emissions have grown at a slower pace than economic growth.
6 GLOBAL ENERGY TRENDS AND NORWEGIAN OPPORTUNITIES

1 3
4Electricity
Heat
Hydrogen
Petrol/diesel
Biofuel
Batteries
Heat storage
Gas storage
Gas
Electricity demand
Heatdemand
Transport demand
Met
er
2
Smart energy
More �exible demand when electri�ed
More distributed generation and storage
More renewables generation overall
Convergence of energy sectors by electri�cation, storage, fuel-�exible sources, and hydrogen
5 Smart and ef�ciently operated
Batteries
Heat storage
Moreover, we assume strong technology development throughout the energy system, in power, buildings, industry and transport (Figure 1). We have observed over the past 10 years how increased deployment drives technological advancement. A similar pattern was observed for fossil energy technologies 50–150 years ago. The Low Emissions Scenario captures this trend and extrapolates the speed at which deployment has spread and costs have come down for green technologies over the past five years. In this scenario costs continue to decline sharply, not only for solar, but also for wind, batteries and electric vehicles (EVs).
In the Low Emissions Scenario the energy system will be cleaner, more distributed and smarter. In addition, electrification will significantly reduce emissions in the transport, buildings and industrial sectors. This trend applies to most countries, but there are major differences in energy demand and mix in the different regions. While the Low Emissions Scenario assumes that overall energy consumption increases by 0.7% per year on average globally, a decline in consumption is expected in the OECD countries. While most countries, including China, will reduce their coal consumption during the period, coal consumption in India will increase by around 1.5% annually in this scenario. In China, total energy consumption is expected to increase by 0.6% annually, while coal demand will decline by almost 2% per year on average during the same period.
Traditionally, the power sector has consisted of large centralised units that have produced electricity and distributed it directly to households and industry. Going forward, the power sector will be gradually supplemented with more renewable energy and decentralised units with local electricity production.
New renewable power generation, such as solar and wind, varies greatly with weather conditions. During periods with little wind and sun these must be balanced with flexible power generation, such as hydro and gas power, as well as increased flexibility in consumption. When electricity use is expanded into new sectors, such as transport, industry and buildings, opportunities for flexible consumption also increase. To encourage increased consumer flexibility, well-functioning power markets with prices that are responsive to changes in market fundamentals are key.
The Low Emissions Scenario is based on the interaction between technological development and climate policy being continuously reinforced. We have not specified which political measures will be implemented in each country to drive this development forward. However, our modelling of the European electricity market points to pricing of CO2 emissions as the most effective measure to increase investment in renewable energy. Examples of other policy measures which will effectively facilitate a development towards the Low Emissions Scenario include cutting fossil fuel subsidies, phasing out coal power generation, and expanding power grids and charging infrastructure.
Figure 1: A changing energy system – strong technology trends
7STATKRAFT'S LOW EMISSIONS SCENARIO
Global Low Emissions Scenario: A greener energy future is possible
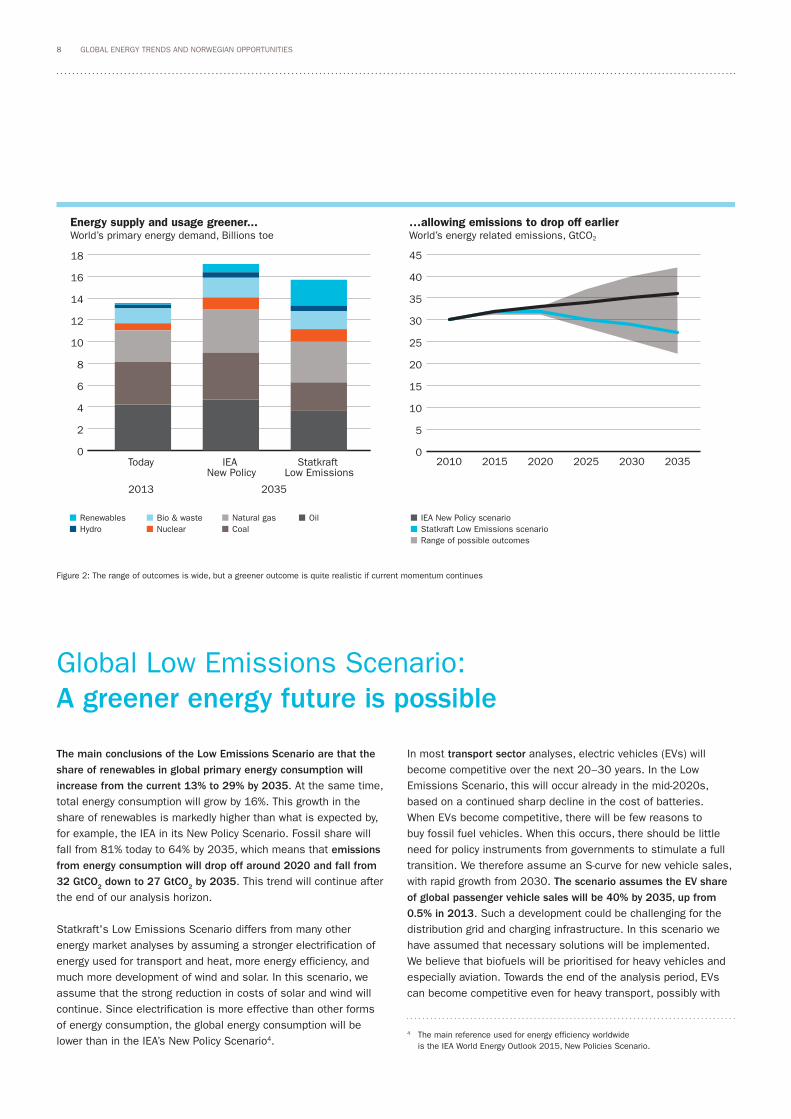
The main conclusions of the Low Emissions Scenario are that the share of renewables in global primary energy consumption will increase from the current 13% to 29% by 2035. At the same time, total energy consumption will grow by 16%. This growth in the share of renewables is markedly higher than what is expected by, for example, the IEA in its New Policy Scenario. Fossil share will fall from 81% today to 64% by 2035, which means that emissions from energy consumption will drop off around 2020 and fall from 32 GtCO2 down to 27 GtCO2 by 2035. This trend will continue after the end of our analysis horizon.
Statkraft's Low Emissions Scenario differs from many other energy market analyses by assuming a stronger electrification of energy used for transport and heat, more energy efficiency, and much more development of wind and solar. In this scenario, we assume that the strong reduction in costs of solar and wind will continue. Since electrification is more effective than other forms of energy consumption, the global energy consumption will be lower than in the IEA’s New Policy Scenario4.
In most transport sector analyses, electric vehicles (EVs) will become competitive over the next 20–30 years. In the Low Emissions Scenario, this will occur already in the mid-2020s, based on a continued sharp decline in the cost of batteries. When EVs become competitive, there will be few reasons to buy fossil fuel vehicles. When this occurs, there should be little need for policy instruments from governments to stimulate a full transition. We therefore assume an S-curve for new vehicle sales, with rapid growth from 2030. The scenario assumes the EV share of global passenger vehicle sales will be 40% by 2035, up from 0.5% in 2013. Such a development could be challenging for the distribution grid and charging infrastructure. In this scenario we have assumed that necessary solutions will be implemented. We believe that biofuels will be prioritised for heavy vehicles and especially aviation. Towards the end of the analysis period, EVs can become competitive even for heavy transport, possibly with
RenewablesHydro
0
2
4
6
8
10
12
14
16
18
Today IEA New Policy
Statkraft Low Emissions
2013 2035
Natural gasCoal
OilNuclearBio & waste
Energy supply and usage greener...World’s primary energy demand, Billions toe
0
5
10
15
20
25
30
35
40
45
203520302025202020152010
IEA New Policy scenarioStatkraft Low Emissions scenarioRange of possible outcomes
…allowing emissions to drop off earlierWorld’s energy related emissions, GtCO2
Figure 2: The range of outcomes is wide, but a greener outcome is quite realistic if current momentum continues
4 The main reference used for energy efficiency worldwide is the IEA World Energy Outlook 2015, New Policies Scenario.
8 GLOBAL ENERGY TRENDS AND NORWEGIAN OPPORTUNITIES
hydrogen- based fuel cells. Trends such as autonomous vehicles, car sharing and smarter traffic management will reinforce this development.
Within industry and buildings, we assume a strong move toward energy efficiency, electrification and smarter control of heating, cooling and ventilation. This will result in an average annual growth in total energy demand of 1% for industry and 0.4% for the building sector toward 2035. The annual growth in electricity demand in these two sectors, however, increases much more strongly; 2.3% and 2.5% respectively. We observe some momentum for the use of biofuel and hydrogen in industry, but so far this appears limited in scope. Similarly, we assume a limited scope for carbon capture in industry, and even less so in the power sector.
As a result of electrification in the building, transport and industrial sectors, global power consumption will increase in the Low Emissions Scenario with an average growth rate of 2.6% per year during the period. This entire increase in consumption will
be covered by clean power generation, while 12% of current fossil power generation will be displaced. The share of solar and wind power in the power mix will therefore increase to 18% and 19% respectively, up from 1% and 3% today. This primarily impacts coal, and to a lesser extent gas, while hydro power and nuclear power will grow moderately.
It will be difficult for regional and national energy systems to balance such amounts of renewable power. Well-functioning power and CO2 markets that stimulate and reward both lower emissions and greater flexibility will lay the groundwork for efficient decarbonisation of the power sector. In addition, increasing amounts of variable power will require more flexible consumption than today. Correct pricing of power and CO2 emissions will help encourage more flexibility on the consumption side. Flexible power supply, batteries, and aggregated consumption together can deal with any short-term imbalances. Lengthier imbalances will require different types of solutions such as flexible hydropower and smaller gas-fired power plants.
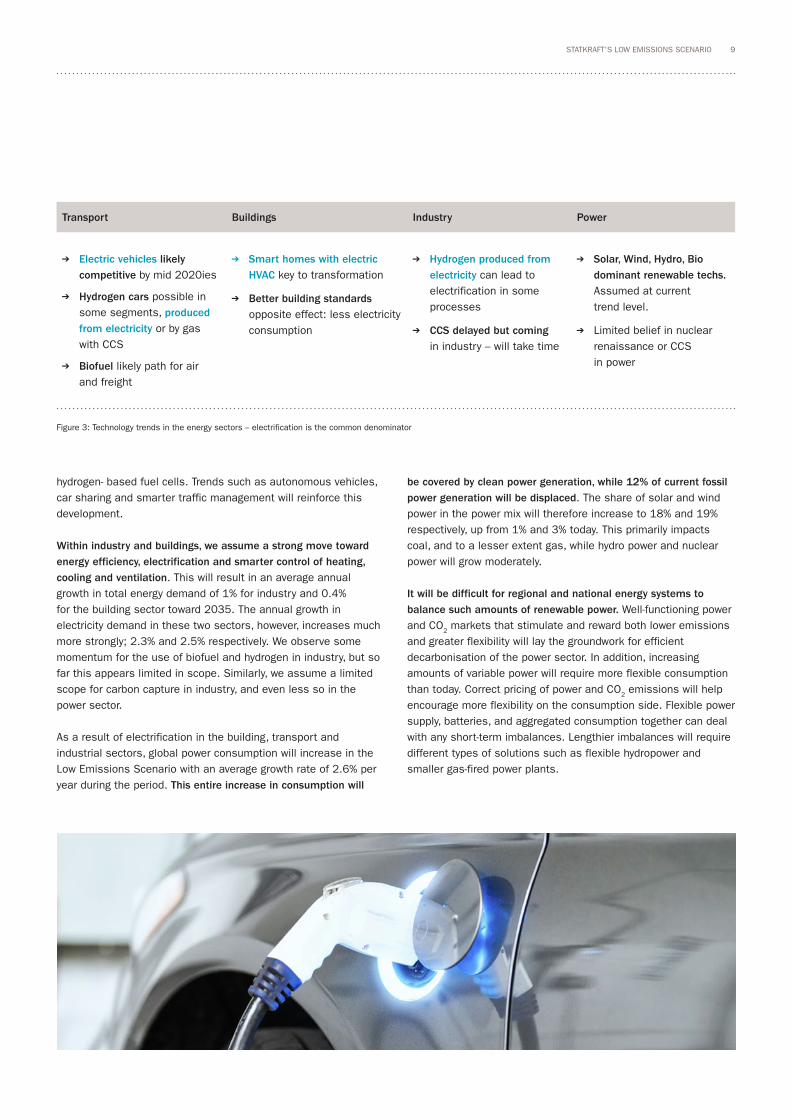
Transport Buildings Industry Power
➔ Electric vehicles likely competitive by mid 2020ies
➔ Hydrogen cars possible in some segments, produced from electricity or by gas with CCS
➔ Biofuel likely path for air and freight
➔ Smart homes with electric HVAC key to transformation
➔ Better building standards opposite effect: less electricity consumption
➔ Hydrogen produced from electricity can lead to electrification in some processes
➔ CCS delayed but coming in industry – will take time
➔ Solar, Wind, Hydro, Bio dominant renewable techs. Assumed at current trend level.
➔ Limited belief in nuclear renaissance or CCS in power
Figure 3: Technology trends in the energy sectors – electrification is the common denominator
9STATKRAFT'S LOW EMISSIONS SCENARIO

The consequences for coal and oil can be significant in the Low Emissions Scenario. The strong increase in renewable power generation challenges the previously dominant position of fossil fuels, and these will lose significant market shares. Gas remains in the scenario as a bridge, but consumption will probably start to fall after the analysis horizon. The demand for gas in both the industry and power sectors is expected to increase in response to the increasing energy demand and the phasing out of coal. In the power sector, gas will take over as the largest flexible energy source to help stabilise a power system with more than one third variable
energy production. Coal consumption on the other hand will drop sharply, in both the power and industry sectors, by 33% overall from now until 2035. Gradually tighter regulation is expected here, as emissions from coal are much higher than from other fuels. Few new coal mines or coal-fired power plants will come online, although we still assume growth in some regions, primarily in India and Southeast Asia5. Oil consumption will start to level off and then fall from around 2025. From 2025 to 2035 global oil demand will fall by around 13%, mainly due to strong electrification of the transport sector. This trend is expected to continue after 2035.
WELL-FUNCTIONING MARKETS SHOULD BE USED TO ENCOURAGE RENEWABLES IN THE POWER SECTOR
More and more investments in renewables in the power sector
globally are occurring in variable power such as solar and wind.
These are technologies which essentially only entail investment costs.
Operating expenses are very low. Once the investment is made,
production continues even if power prices drop towards zero. With
more subsidised renewable power coming into the energy system,
this will happen more often. Power prices are then driven downwards,
thereby reducing the profitability of the entire power industry.
The subsidies can ensure the profitability of that next investment, but
there is a price to be paid in the form of reduced profitability of earlier
renewable investments. The paradox of subsidies is therefore that
over time they can reduce the investing power of the industry they are
supposed to strengthen. Without profitability, investments in renewables
will stop. This, in turn, will weaken the decarbonisation agenda.
CO2 pricing has the opposite effect: they improve the profitability
of all emission-free power generation, while reducing the profitability
of all power generation that emits greenhouse gases. Appropriate
carbon prices motivate everyone to make climate-friendly investment
decisions.
5 We have already seen increased regulation in China (NDRC limits new coal power development, restrictions on imported coal, national emissions trading scheme from 2017), USA (Clean Power Plan) and India (doubling of carbon tax in 2016). A continuation of the trend of increased regulation and CO2 pricing will contribute to the decline in coal consumption in this scenario.
0203520302025202020152010
IEA New Policy Statkraft Low Emission
20000
25000
30000
35000
40000
45000
+22%
+56%
36 400 500
2 800
800
1 500 41 000
IEA NewPolicy
Demandrevisions
Transport Industry Buildings Statkraft Low
Emission
Demand increase beyond IEA forecast…Global electricity consumption (TWh)
...from all sectors, yet most from transport2035 consumption level (TWh)
Figure 4: Electrification is further increasing power demand
10 GLOBAL ENERGY TRENDS AND NORWEGIAN OPPORTUNITIES

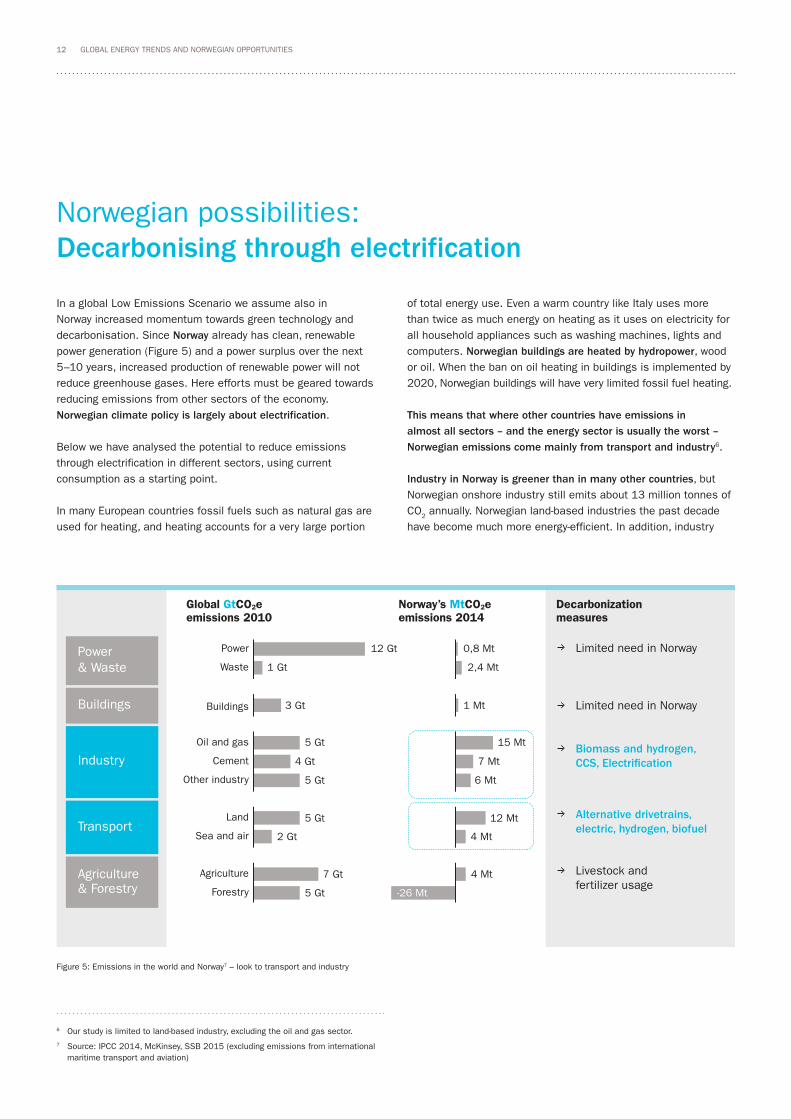
Global GtCO2eemissions 2010
Norway’s MtCO2eemissions 2014
Decarbonization measures
Forestry
Agriculture
Sea and air
Land
Other industry
Cement
Oil and gas
Buildings
Waste
Power 12 Gt
1 Gt
3 Gt
5 Gt
4 Gt
5 Gt
5 Gt
2 Gt
5 Gt
7 Gt
0,8 Mt
2,4 Mt
1 Mt
15 Mt
7 Mt
6 Mt
12 Mt
4 Mt
-26 Mt
4 Mt
Limited need in Norway
Limited need in Norway
Biomass and hydrogen, CCS, Electri�cation
Alternative drivetrains, electric, hydrogen, biofuel
Livestock and fertilizer usage
Power & Waste
Buildings
Industry
Transport
Agriculture& Forestry
Figure 5: Emissions in the world and Norway7 – look to transport and industry
Norwegian possibilities: Decarbonising through electrification
In a global Low Emissions Scenario we assume also in Norway increased momentum towards green technology and decarbonisation. Since Norway already has clean, renewable power generation (Figure 5) and a power surplus over the next 5–10 years, increased production of renewable power will not reduce greenhouse gases. Here efforts must be geared towards reducing emissions from other sectors of the economy. Norwegian climate policy is largely about electrification.
Below we have analysed the potential to reduce emissions through electrification in different sectors, using current consumption as a starting point.
In many European countries fossil fuels such as natural gas are used for heating, and heating accounts for a very large portion
of total energy use. Even a warm country like Italy uses more than twice as much energy on heating as it uses on electricity for all household appliances such as washing machines, lights and computers. Norwegian buildings are heated by hydropower, wood or oil. When the ban on oil heating in buildings is implemented by 2020, Norwegian buildings will have very limited fossil fuel heating.
This means that where other countries have emissions in almost all sectors – and the energy sector is usually the worst – Norwegian emissions come mainly from transport and industry6.
Industry in Norway is greener than in many other countries, but Norwegian onshore industry still emits about 13 million tonnes of CO2 annually. Norwegian land-based industries the past decade have become much more energy-efficient. In addition, industry
6 Our study is limited to land-based industry, excluding the oil and gas sector. 7 Source: IPCC 2014, McKinsey, SSB 2015 (excluding emissions from international
maritime transport and aviation)
12 GLOBAL ENERGY TRENDS AND NORWEGIAN OPPORTUNITIES
is based on renewable hydropower as an energy source. Thus for most Norwegian industry sectors, emissions per tonne of produced goods is lower than in other countries. Carbon capture (CCS) is a possibility, but this is still complex in many ways: the technology is immature and infrastructure for transport and storage is not in place – this also applies to Norway. Alternative fuels and raw materials in industrial processes are mainly biomass, biofuels and renewable hydrogen produced by electricity. We estimate that the realistic electrification potential of existing Norwegian industry is limited to emission reductions of about 1 MtCO2. On the other hand, Norway has a major competitive advantage in having access to clean and competitive power, and should have good prospects to attract new energy-intensive industries. The potential is difficult to estimate, but through the establishment of large data centres in Norway and the expansion of existing aluminium plants, a realistic estimate would be around 6 TWh. This could save the world around 3 MtCO2 in emissions8.
It is possible to reduce emissions from buildings by just over 1 MtCO2 by replacing existing oil and gas boilers with electric heating. Much of this reduction will come when the ban on oil heating comes in force. This also contributes to energy efficiency in buildings by switching to more efficient forms of heating.
In transport, we assume that electrification, biofuels and hydrogen will be the most important energy sources. Electric vehicles can transform the passenger car market in the next decade, and Norway is already at the forefront in this area. The full technical potential for electrification of transport in Norway is about 16 TWh, while we assume a realistic outcome at around 9 TWh during the period. This will reduce emissions by about 7 MtCO2 in Norway9. This is equivalent to all of the cars and vans in Norway today having an electric motor or fuel cell engine. In addition, a significant proportion of buses and heavy transport will run on electricity, hydrogen or biofuels.
Overall we estimate a realistic potential for electrification in Norway across sectors to provide a reduction of around 10 million tonnes of CO2 emissions nationally from current levels. In addition, global emissions can be reduced through new Norwegian industry. To realise these reductions, it is important to have a good and predictable regulatory framework. Today's use of policy instruments is heading in the right direction, but should likely be maintained and possibly strengthened in some areas.
Today's use of purchase incentives for low-emissions vehicles as a policy instrument within personal transport is highly effective. In line with our assumptions, purchase incentives can gradually be reduced as purchase prices of low-emission vehicles decline. In addition, public authorities have an important role to play in continuing to facilitate the development of charging corridors. Within other transport areas, increasing requirements for low-emissions ships and vehicles through concessions, licenses and procurement of public transport can be important policy instruments.
To achieve reduced emissions in buildings, the approved ban on fossil oil heating in buildings from 2020 will be an important instrument. Beyond this, incentives and calculation methods that give new renewable energy advantages over existing renewables, such as hydropower and wind, should be avoided.
For existing industry it will be important to maintain competitiveness globally with a predictable regulatory framework. If industry is moved out of the country, it will often relocate to countries with weaker climate policies and dirtier energy systems. Such a development would lead to increased global emissions. Similarly, the establishment of new energy-intensive industry in Norway will result in lower emissions compared to most alternative locations.
NORWEGIAN HYDROPOWER IS RENEWABLE AND FLEXIBLE
Norway produces 135 TWh of hydropower annually. In addition to being
a renewable energy source, this gives us a very high security of supply
– the best in the world. Norway has half of Europe's reservoir capacity.
This large reservoir capacity has long been Norway's battery, which at
low cost can store energy over short and long periods. Hydropower also
has the lowest carbon footprint of all power producing technologies.
The flexibility of Norwegian hydropower makes it a smart solution
for future energy systems that will include more variable renewable
power such as solar and wind. Flexible hydropower can, by using
reservoirs, produce power even during periods of low rainfall and low
inflow. Access to large reservoir capacity offers the ability to balance
production over years, seasons, weeks and days depending on need.
Future energy systems will lead to a need for more short-term flexibility.
Increased electrification will mean that more consumers will have a
need to use electricity simultaneously, although smart management
will curb the effect somewhat. Such fluctuations in consumption and
supply can be handled by the flexibility of hydropower. Since the need
for balancing power increases with the amount of variable renewable
energy such as solar and wind, the flexible nature of hydropower is
extremely valuable for the energy system.
8 Source: IEA WEO15, global CO2 factor for the power industry of 520 g CO2 / kWh9 Sources: Statistics Norway (SSB), National Transport Plan
13STATKRAFT'S LOW EMISSIONS SCENARIO

Sectors
Statkraft Low Emissions
Scenario (2016)
IEA New Policies
Scenario (2015)
Statoil Reform
Scenario (2016)
Greenpeace Energy
Revolution Scenario (2015) 10
IHS CERA Rivalry (2015)
Average annual growth in primary energy demand 2013–2035 (primary)
0.7% 1.1% 0.8% (to 2040)
-0.2% 1.3%
Transport sector
Oil share (final, Mtoe, 2035)
75% 87.5% 63.8% 86.1%
% Electric vehicle (EV+PHEV) share of new
car sales
40% by 2035 11
5.7% in 2040
(IEA 2014)
~70% by 2040
27.8% by 2040
Power sector (annual ave. growth, TWh, 2013–2035):
Demand 2.6% 2% 1.3% 2.5%
Wind power 12% 7.4% - 13.1% 8.1%
Solar power 19.7% 10.5% - 19.1% 11.3%
Hydropower 2% 2% - 1.1% 1.5%
Fossil fuel share in power sector (TWh, 2035)
34% 55% 29% 61%
Oil consumption: annual ave. growth 2013–2035
-0.7% (flat to 2020)
0.5% -2.5% 0.8%
Gas consumption: annual average growth 2013–35
1.2% 1.4% 1.1% (by 2040)
-0.3% 2.1%
Coal consumption: annual average growth 2013–35
-1.8 0.4% -0.4% (by 2040)
-2.9% 0.5%
Global energy-related CO2 emissions (GtCO2) by 2035
26.7 35.7 ~30 (2040)
17.1 40.5
10 2035 is assumed to be the average of 2030 and 2040 data.11 This includes both electric and fuel cell engines.
Table 1. The assumptions in the Statkraft scenario compared to IEA, Statoil, IHS Cera and Greenpeace
14 GLOBAL ENERGY TRENDS AND NORWEGIAN OPPORTUNITIES

10 2035 is assumed to be the average of 2030 and 2040 data.11 This includes both electric and fuel cell engines.

Design: Artbox AS
Print: Printbox AS O
ctober 201
6
Statkraft ASPO Box 200 Lilleaker0216 OsloTel: +47 24 06 70 00Fax: +47 24 06 70 01Street address:Lilleakerveien 6
Org. Number:Statkraft AS, 987 059 699
www.statkraft.com
For more information Press contact Knut Fjerdingstad [email protected]