Global distribution maps of the arbovirus vectors Ae. aegypti and Ae. Albopictus
38
The global distribution of the arbovirus vectors Ae. aegypti and Ae. albopictus Moritz Kraemer
-
Upload
bonniefernley -
Category
Presentations & Public Speaking
-
view
399 -
download
0
Transcript of Global distribution maps of the arbovirus vectors Ae. aegypti and Ae. Albopictus

The global distribution of the arbovirus vectors Ae. aegypti and
Ae. albopictus
Moritz Kraemer

Outline
1. Introduction2. Arboviruses and their emerging importance3. Species distribution modelling4. Aedes distributions5. Future work6. Conclusion
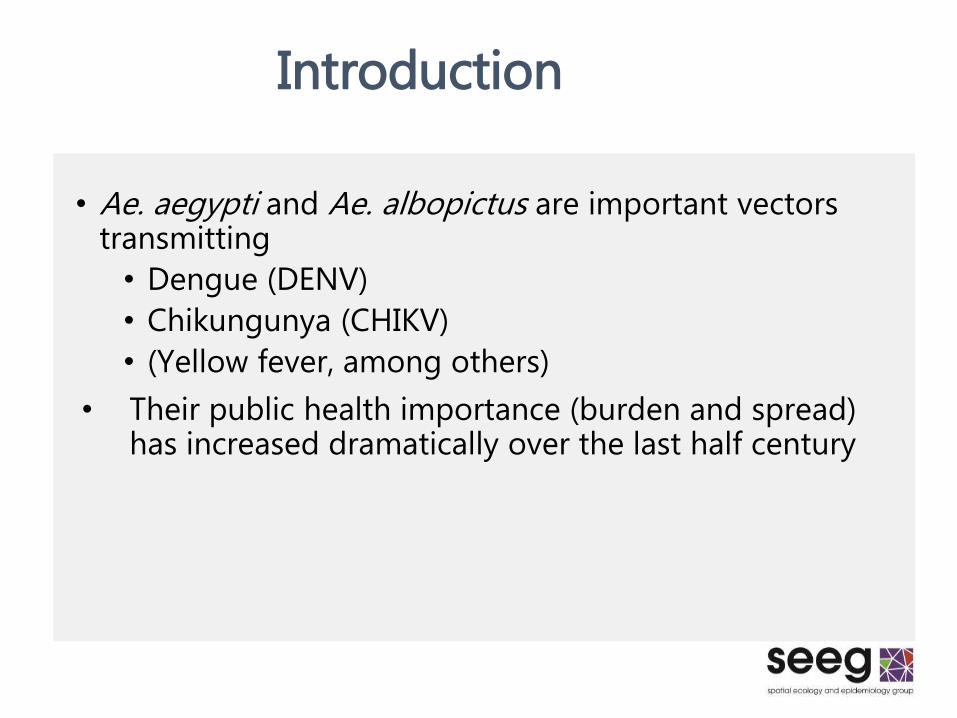
Introduction
• Ae. aegypti and Ae. albopictus are important vectors transmitting
• Dengue (DENV)
• Chikungunya (CHIKV)
• (Yellow fever, among others)
• Their public health importance (burden and spread) has increased dramatically over the last half century

Dengue
• Self-limited, systemic viral infection (4 serotypes)
• Transmitted between humans by primarily Aedesaegypti
• 390 (96 apparent) million infections each year
• Emerged in Africa during slave trade in the 15th; spread in 19th century to Asia through commercial exchanges, and has expanded globally over the past 50 years
• Endemicity has been facilitated by global traffic and urbanization
• No vaccine or antiviral treatment available today

Messina et al. 2014
DENV 1-4

Chikungunya
• Four CHIKV genotypes identified to date (since its discovery in 1952)
• Unlike DENV, infections are associated with recurrent joint pain and high rates of symptomatic infections
• Dramatic outbreaks in La Reunion (2005-2006 with some 225,000 cases), and recently the Americas > 780,000 cases (as of 31.10.2014)
• Rapid expansion and risk posed to the United States and Europe
• No vaccine or antiviral treatment available today

CHIKV
CDC 2014

Mapping approaches
• Many attempts have been made to model the distribution of vector-borne diseases globally
• Global maps of CHIKV are still unavailable
• Autochthonous transmission of both viruses, by definition, are limited by the availability of an infected individual as well as competent vector
• This has often been ignored in global estimates of disease risk in such models to date
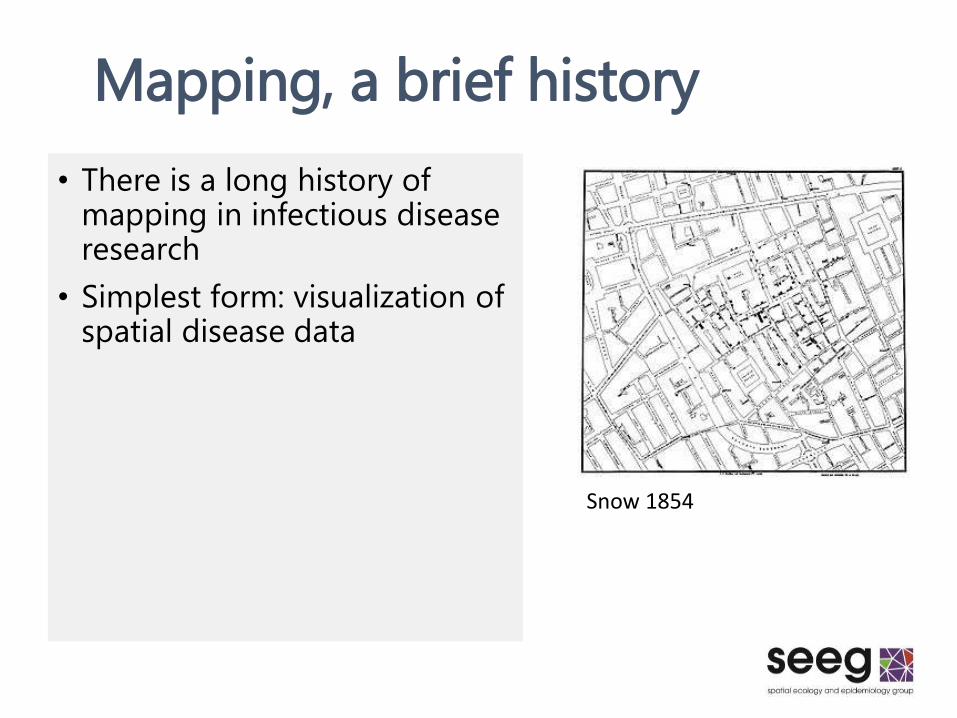
Mapping, a brief history
• There is a long history of mapping in infectious disease research
• Simplest form: visualization of spatial disease data
Snow 1854

• Environmental conditions have shown to be strong predictors of disease risk
• Especially for vector borne diseases (DENV, CHIKV, Malaria)
• Early and ongoing modelling approaches were important to identify thermal limits of occurrence (often based on laboratory studies)
Mapping, a brief history

Deterministic Aedes model
Comparative temperature suitability of Ae. aegypti (A) and Ae. albopictus (B).The annualised temperature suitability index (X(T)) normalised relative to the maximum value of both species and plotted on a logarithmic scaleBrady, Kraemer, et al. 2014

Limitations of deter. models
• Omits a range of other factors that are known to influence transmission
• Species interaction
• Other covariates such as urbanization, economic factors, control efforts
Kraemer, Golding, Hay 2014, forthcoming

Statistical environmental modelling
• Species distribution modelling (SDM)
• Required: flexible multivariate statistical models
• Using: a set of spatially continuous maps of environmental predictors
• SDMs have been applied to vector distributions and vector-borne diseases (dengue, malaria vectors)
• Limitations: a refined fundamental niche but still ignoring control efforts or/and species interactions

Satellite imagery
• As ever more timely and high resolution imagery becomes available
• Environmental: daily rainfall, temperature, vegetation cover, soil structure, etc.
• Socio-economic: urbaness, settlement structure
NASA

Modern mapping approaches
Hay et al. 2014
• The following set of input data is required in order to make accurate predictions
• A mask defining the fundamental limits
• A globally comprehensive dataset of geo-positioned occurrence points
• Pseudoabsence points• Appropriate
environmental covariates

presence-only data
Dengue occurrence and evidence consensus; Bhatt et al. (2013) Nature

Dengue global distribution
Bhatt et al. (2013) NatureData published and accessible: Messina et al. 2014

Malaria vectors, zoonotic niche of EVD
Sinka et al. 2010
Pigott, Golding, Kraemer, Hay et al. 2014

Progress in malaria cartography
• Relative prevalence Boyd 1936 (top) vs
• Modern mapping parasite rates on a continuous surface (Gething et al. 2011)

The global distribution of the arbovirus vectors Aedes aegypti and Aedes albopictus
Kraemer, M.U.G. 1 ,*, Sinka, M.E. 1,*, Duda, K.A. 1, Mylne, A. 1, Shearer, F.M. 1, Barker, C. M. 2,3,4, Carvalho, R.G. 5, Coelho, G.E. 5, Elyazar, I.R.F.6, Moore, C.G. 7, Teng, H.-J. 8, Brady, O.J. 1, Messina. J.P. 1, Pigott, D.M.1, Scott, T.W. 4,9, Smith, D.L. 1,4, Wint, G.R.W. 1,10, Golding, N. 1 and Hay, S.I. 1,4, §

Ae. aegypti
• Urban endophilic vector
• Originated in Africa and after domestication spread across the tropics and subtropics
• Almost exclusively man-biting
Schaffner & Mathis 2014 www.nature.com

• Mostly found in peri-urban and rural environments
• Day biting vector with native range in Asia
• Now present in most of the Americas, Europe and several islands in the Pacific and the Indian Ocean
• Most invasive mosquito
vector globally
• Feeds readily on a variety of
mammalian and avian species
Ae. albopictus
Schaffner & Mathis 2014

Input data for Aedes modelling
• A temperature suitability mask to define fundamental limits of both species
• Globally comprehensive occurrence dataset
• Appropriate socio-economic and environmental dataset

Temperature suitability mask
Comparative temperature suitability of Ae. aegypti (A) and Ae. albopictus (B).The annualised temperature suitability index (X(T)) normalised relative to the maximum value of both species and plotted on a logarithmic scale
Brady, Kraemer, et al. 2014

Occurrence databaseAedes database
Aedes aegyptiData source Dates N's TypeUSA - 2014 95polygonsPrimary PDFs - 2014 8,119points and polygonsBrazil - 2013 4,421polygonsTaiwan - 2014 25,000polygonsIndonesia - 2013 518points
Aedes albopictusData source Dates N's TypeEurope - 2013 247polygonsUSA - 2010 1,282polygons Primary PDFs - 2014 3,789points and polygonsBrazil - 2013 4,572pointsTaiwan - 2014 25,000polygonsIndonesia - 2013 500points

Set of covariates (N = 5)
• Environmental:
• NDVI (Normalized Difference Vegetation Index)
• Temperature suitability
• Elevation
• Socio-economic:
• Urban, peri-urban, rural
• Urban accessibility

Model specifications
• Boosted regression tree (BRT)
• Combining both, machine learning approaches and regression techniques
• predictor variables can be of any type (numeric, binary, categorical, etc.)
• Boosting: a forward, stagewiseprocedure
• Outperforms MaxEnt, GARP, BIOCLIM

Removing spatial bias in occurrence data
• Often a problem in SDM modelling
• Sampling bias
• Oversampled regions where national surveys are conducted
• 2 ways
• Assigning different weights of occurrence data depending on density of points
• We use background data that have a similar bias (n = 10,000 records) (http://www.gbif.org/ - Global Biodiversity Information Facility)
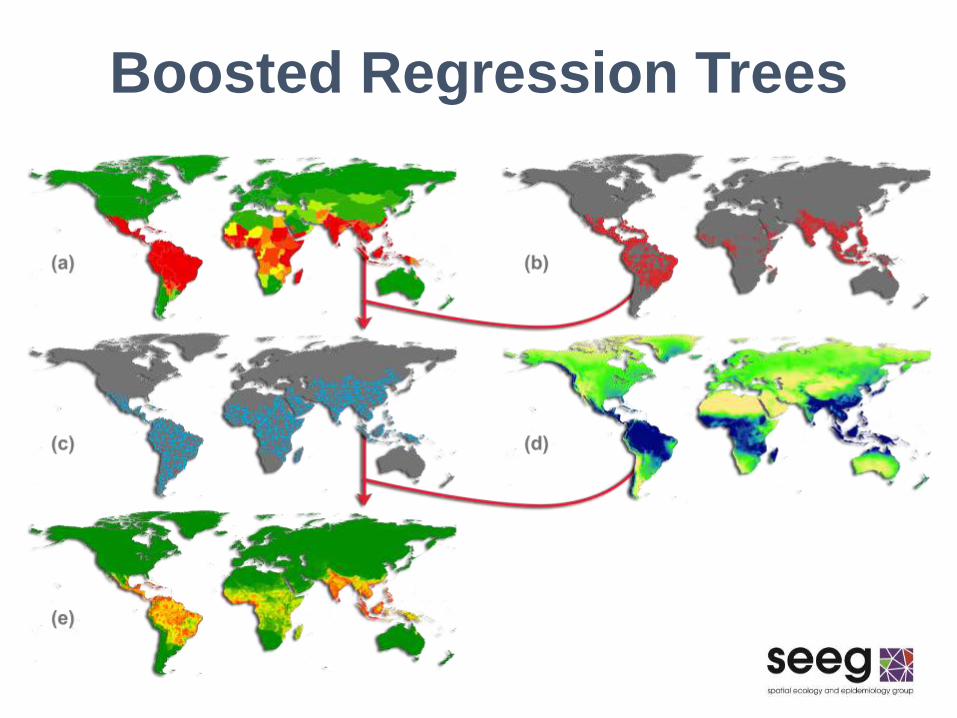
Boosted Regression Trees

Ae. aegypti map
https://github.com/SEEG-Oxford/seegSDM
Temp. suitability 58%; Urban accessibility 18%; NDVI 12%

Ae. albopictus map
• Major contributing factors:• Temp. suitability: 40%• Urban accessibility: 31%• NDVI: 20%
https://github.com/SEEG-Oxford/seegSDM

Dissemination and future work
• Data will be made openly available through figshareand scientific data publication
• Maps will be made available as a GIS file to use as covariate/reproduction-extension of work
• Source code are already available through: https://github.com/SEEG-Oxford/seegSDM
• Three related projects: • Modelling past and future spread of the arbovirus
vectors Ae. aegypti and Ae. albopictus• The global distribution of CHIKV• The future distribution of dengue risk

Global travel time to a major city, based on travel ‘friction’(Uchida et al. 2008)
Continental spread model of Ae. albopictus
Ren et al. 2014
• We want to understand the patterns of dispersal, and thus future distribution of Aedesmosquitos
• Human mobility major driver of spread of Aedes mosquitos

Model specifications - spread
https://github.com/SEEG-Oxford/movement
Spatio-temporal data for the United States (1985-2014) and Europe (1979 – 2013)GLM to predict future spread of the arbovirus vector
p(establishment) = p(suitability)∗p(introduction)p(introduction) =𝑓(connectedness)
1. =𝑓(euclidean distance)2. =𝑓(friction distance)3. =f(gravity model)
4. =𝑓(radiation model)
Specification:
= 𝑘(𝑛𝑖
𝛼𝑛𝑗𝛽)
𝑑𝑖𝑠𝑡(𝑖,𝑗)𝛾(gravity model)
= 𝑛𝑖𝑛𝑗
(𝑛𝑖+𝑠𝑖𝑗)(𝑛𝑖+𝑛𝑗+ 𝑠𝑖𝑗)(radiation model)

Seebens et al. (2013)
1. global shipping data available from Seebens et al. with information of 2.89m directed voyages
2. each port represents a node in the network
Global invasion risk of Ae. aegypti/albopictus

The future of dengue fever globally
1. Climatic indicators2. Vector suitability3. Vector spread4. Urbanization

Conclusion• Here, we have compiled the most comprehensive up-to-
date database for both species
• SDMs have shown strong predictive performance modelling the Aedes mosquitos
• Thee updated maps can now be used for disease modelling
• We hope to inform future surveillance and ventor control efforts
• Integrating work of vector spread will help identify areas where we can expect future establishment to more accurately predict the burden of DENV and CHIKV