Global Debates Playbook Asset Class Views (6 … O R G A N S T A N L E Y R E S E A R C H Global...
51
Global Debates Playbook The Coast Is Not Yet Clear M O R G A N S T A N L E Y R E S E A R C H September 15, 2013 GLOBAL CROSS-ASSET STRATEGY Due to the nature of the fixed income market, the issuers or bonds of the issuers recommended or discussed in this report may not be continuously followed. Accordingly, investors must regard this report as providing stand-alone analysis and should not expect continuing analysis or additional reports relating to such issuers or bonds of the issuers. Morgan Stanley does and seeks to do business with companies covered in Morgan Stanley Research. As a result, investors should be aware that the firm may have a conflict of interest that could affect the objectivity of Morgan Stanley Research. Investors should consider Morgan Stanley Research as only a single factor in making their investment decision. For analyst certification and other important disclosures, refer to the Disclosure Section, located at the end of this report. Global Cross-Asset Strategy Morgan Stanley & Co. LLC Jason Draho +1 212 761-7893 Brennan Leong +1 212 761-9729 Marc Englander +1 212 761-8278 Please see page 2 for full list of members Global Cross-Asset Directory Subscribe to the Global Debates Playbook Asset Class Views (6 months) The risk of a tactical correction remains high, in our view. After a strong start to September, investor complacency and uncertainty about Fed policy and its implications post-tapering leave risk assets vulnerable to a pull-back. In general, the transition from a liquidity-driven market to one focused on growth and policy is likely to keep volatility high near term (Dealing With Daylight ). We remain strategically constructive on DM risk assets, favoring equities over credit and government bonds. The latest economic data is consistent with DM acceleration and EM stabilization, while valuations are not stretched. A gradual rise in rates that reflects this recovery is ultimately a positive for risk assets. However, rates rising rapidly in the near term is the biggest risk for a correction. We expect the Fed to announce a modest start to tapering at the FOMC meeting this week. But uncertainty about the efficacy of forward rate guidance and the next Governor could lead to rates overshooting if the Fed loses control over investor expectations. That would be negative for risk markets. For that reason we would wait for some of this uncertainty to pass and look for a better buying opportunity later in September or October to add risk. EM assets may have more tactical upside, but that’s likely to be short-lived. Positive China data, improved valuations, and better technicals are the reasons for a better tactical outlook. But the strategic outlook remains cautious because structural adjustments still must occur and growth stabilization may be temporary. Note: The rankings are relative within each asset class. – + Equities Credit Government Bonds Cash Equities – + US Europe Japan AxJ EM Credit – + US Europe Asia EM Securitized Government Bonds – + Treasuries Bunds JGBs EM Local FX – + USD EUR JPY EM
Transcript of Global Debates Playbook Asset Class Views (6 … O R G A N S T A N L E Y R E S E A R C H Global...
Global Debates PlaybookThe Coast Is Not Yet Clear
M O R G A N S T A N L E Y R E S E A R C H
September 15, 2013
GLOBAL CROSS-ASSET STRATEGY
Due to the nature of the fixed income market, the issuers or bonds of the issuers recommended or discussed in this report may not be continuously followed. Accordingly, investors must regard this report as providing stand-alone analysis and should not expect continuing analysis or additional reports relating to such issuers or bonds of the issuers.Morgan Stanley does and seeks to do business with companies covered in Morgan Stanley Research. As a result, investors should be
aware that the firm may have a conflict of interest that could affect the objectivity of Morgan Stanley Research. Investors should consider Morgan Stanley Research as only a single factor in making their investment decision.For analyst certification and other important disclosures, refer to the Disclosure Section, located at the end of this report.
Global Cross-Asset Strategy
Morgan Stanley & Co. LLCJason Draho +1 212 761-7893
Brennan Leong +1 212 761-9729
Marc Englander +1 212 761-8278
Please see page 2 for full list of members
Global Cross-Asset Directory
Subscribe to the Global Debates Playbook
Asset Class Views (6 months)
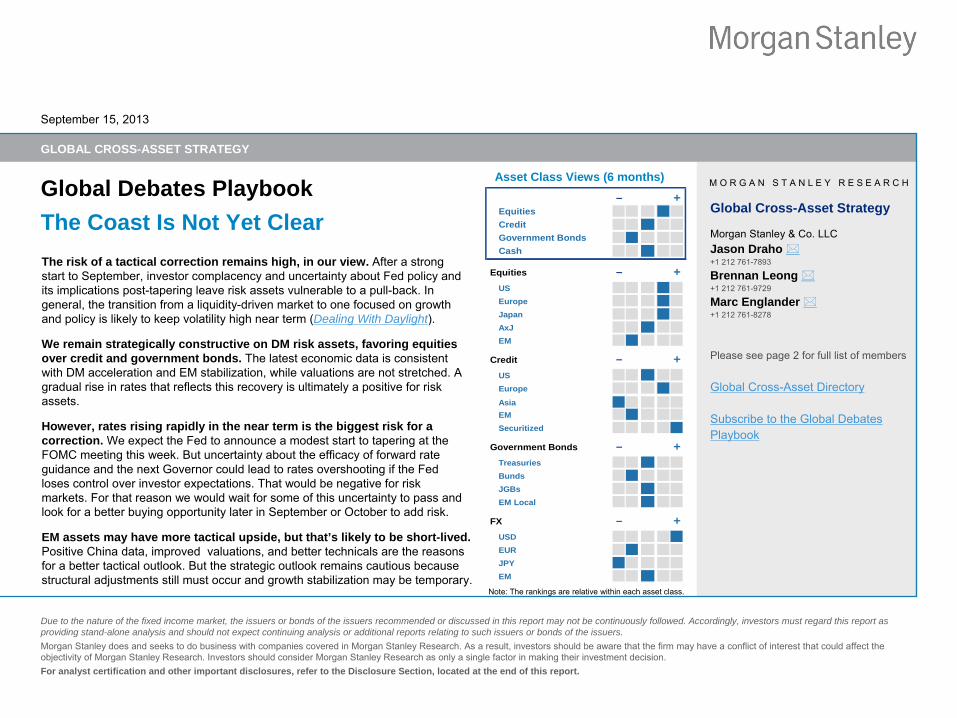
The risk of a tactical correction remains high, in our view. After a strong start to September,
investor complacency and uncertainty about Fed policy and its implications post-tapering leave risk assets vulnerable to a pull-back. In general, the transition from a liquidity-driven market to one focused on growth and policy is likely to keep volatility high near term (Dealing With Daylight).
We remain strategically constructive on DM risk assets, favoring equities over credit and government bonds. The latest economic data is consistent with DM acceleration and EM stabilization, while valuations are not stretched. A gradual rise in rates that reflects this recovery is ultimately a positive for risk assets.
However, rates rising rapidly in the near term is the biggest risk for a correction. We expect the Fed to announce a modest start to tapering at the FOMC meeting this week. But uncertainty about the efficacy of forward rate guidance and the next Governor could lead to rates overshooting if the Fed loses control over investor expectations. That would be negative
for risk markets. For that reason we would wait for some of this uncertainty to pass and look for a better buying opportunity later in September or October to add risk.
EM assets may have more tactical upside, but that’s likely to be short-lived. Positive China data, improved valuations, and better technicals
are the reasons for a better tactical outlook. But the strategic outlook remains
cautious because structural adjustments still must occur and growth stabilization
may be temporary.Note: The rankings are relative within each asset class.
– +EquitiesCreditGovernment BondsCash
Equities – +USEuropeJapanAxJEM
Credit – +USEurope
AsiaEMSecuritized
Government Bonds – +TreasuriesBundsJGBsEM Local
FX – +USDEURJPYEM

M O R G A N S T A N L E Y R E S E A R C H
Global Debates PlaybookSeptember 15, 2013
21 Morgan Stanley & Co. LLC
2 Morgan Stanley & Co. International plc 3 Morgan Stanley Asia Limited 4 Morgan Stanley Australia Ltd 5 Morgan Stanley MUFG Securities + Analysts employed by non-U.S. affiliates are not registered with FINRA, may not be associated persons of the member and may not be subject to NASD/NYSE restrictions on communications with a subject company, public appearances and trading securities held by a research analyst account.
Economics Joachim Fels2
+44 (0)20 7425 6138Vincent Reinhart1
+1 212 761 3537Elga
Bartsch2
+44 (0)20 7425 5434Robert Feldman5
+81 3 5424 5285Helen Qiao3
+852 2848 6511Chetan
Ahya3
+852 2239 7812Gray Newman1
+1 212 761 6510Tevfik
Aksoy2
+44 (0)20 7677-6917Manoj
Pradhan2
+44 (0)20 7425-3805
Strategy Neil McLeish2+
+44 (0)20 7677 7481Jason Draho1
+1 212 761-7893Matthew Hornbach1
+1 212 761-1837Anthony O’Brien2+
+44 (0)20 7677 7748Anton Heese2+
+44 (0)20 7677 6951Le Ngoc Nhan5+
+81 3 5424-7698Rashique
Rahman1
+1 212 761-6533Hans Redeker2+
+44 (0)20 7425 2430Gabriel de Kock1
+1 212 761-5154Adam Parker1
+1 212 761-1755Graham Secker2+
+44 (0)20 7425 6188Jonathan Garner3+ +852 2848 7288Adam Richmond1
+1 212 761-1485Andrew Sheets2+
+44 (0)20 7677 2905Viktor Hjort3+
+852 2848 7479Vishwanath
Tirupattur1
+1 212 761 1043Sivan Mahadevan1
+1 212 761 1349
Global Cross-Asset Strategy Market Commentary
3Morgan Stanley Key Economic Forecasts
18Morgan Stanley Asset Class Forecasts
19
Risk-Reward Views: EconomicsGlobal Economics
20US
21Europe
22Japan
23China
24Asia ex-Japan
25Brazil
26India
27Russia
28
Risk-Reward Views: Strategy US Rates
29Europe Rates
30Japan Rates
31UK Rates
32EM Fixed Income
33G10 Currency
34EM Currency
35US Equities
36Europe Equities
37Asia / GEMs
Equities
38US Corporate Credit 39Europe Corporate Credit
40Asia Corporate Credit
41Securitized Credit
42Global Credit Derivatives
43Crude Oil 44Cross-Asset Volatility
45
Table of Contents Global Cross-Asset Strategy Group

M O R G A N S T A N L E Y R E S E A R C H
Global Debates PlaybookSeptember 15, 2013
3
The Coast Is Not Yet Clear
The risk of a tactical correction remains elevated, in our view. Improving PMIs
globally, better-than-expected data in China, and easing Middle East geopolitical tensions, and with it the price of oil, have certainly provided a tailwind for the markets to start September. Yet the primary reason for tactical caution that we laid out in our Back-to-School Global Strategy Outlook hasn’t changed (Dealing With Daylight, September 3). Specifically, that the transition from a liquidity-driven market to one focused on growth, policy and valuation differentials will be challenging, and keep volatility elevated near term. Investor complacency about downside risks –
the put-call ratio recently hit a YTD low (Exhibit 1) –
suggest otherwise, and that adds to the risk of a correction.
Rates that continue to rise is the biggest risk for a correction. The current risk rally in spite of rising rates is a positive development, if it reflects policy normalization and economic recovery (Exhibit 2). Three things concern us that this dynamic won’t continue to be so benign. First, the mid-cycle correction was relatively mild compared to other cycles when policy became less
accommodative. Second, uncertainty about Fed policy won’t fall with the likely tapering announcement this week, as it has already shifted to forward rate guidance and the next Governor. Third and related, this uncertainty could lead to rates overshooting if the Fed loses control over investor expectations. It’s hard to see risk assets not reacting negatively to that scenario.
EM assets have rebounded, but that’s likely to be short-lived. Positive China data, improved valuations, and better technicals
are the reasons why our EM fixed income strategy team just upgraded their tactical outlook for EM FX and local rates to Accumulate (Near-Term Stability, Medium-Term Adjustment). For now, the risk of an EM unwind is low without a big move in US rates. But the medium term outlook for EM remains cautious because structural adjustments still must occur, while China’s growth spurt may be temporary.
Tactical risks aside, we stay strategically constructive on developed markets. The latest economic data is consistent with DM acceleration and
EM stabilization. A gradual rise in rates that reflects this recovery is ultimately a positive for risk assets. But the uncertain transition to that stage should keep volatility elevated and possibly cause a correction. For that reason we would wait for a better buying opportunity later in September or October to add risk.
Exhibit 1: The low put-call ratio suggests investor complacency
Source: Bloomberg, Morgan Stanley Research
Exhibit 2: Equities and rates have risen in September
Source: Bloomberg, Morgan Stanley Research
0.4
0.5
0.6
0.7
0.8
0.9
Sep-12 Nov-12 Jan-13 Mar-13 May-13 Jul-13
Put-Call Ratio10-Day MA
1.40%
1.60%
1.80%
2.00%
2.20%
2.40%
2.60%
2.80%
3.00%
3.20%
1400
1450
1500
1550
1600
1650
1700
1750
Jan-13 Mar-13 May-13 Jul-13 Sep-13
S&P 500US 10yr (RHS)
M O R G A N S T A N L E Y R E S E A R C H
Global Debates PlaybookSeptember 15, 2013
4
The Start of Tapering Isn’t the End of Fed Policy Uncertainty, or Rate Risk
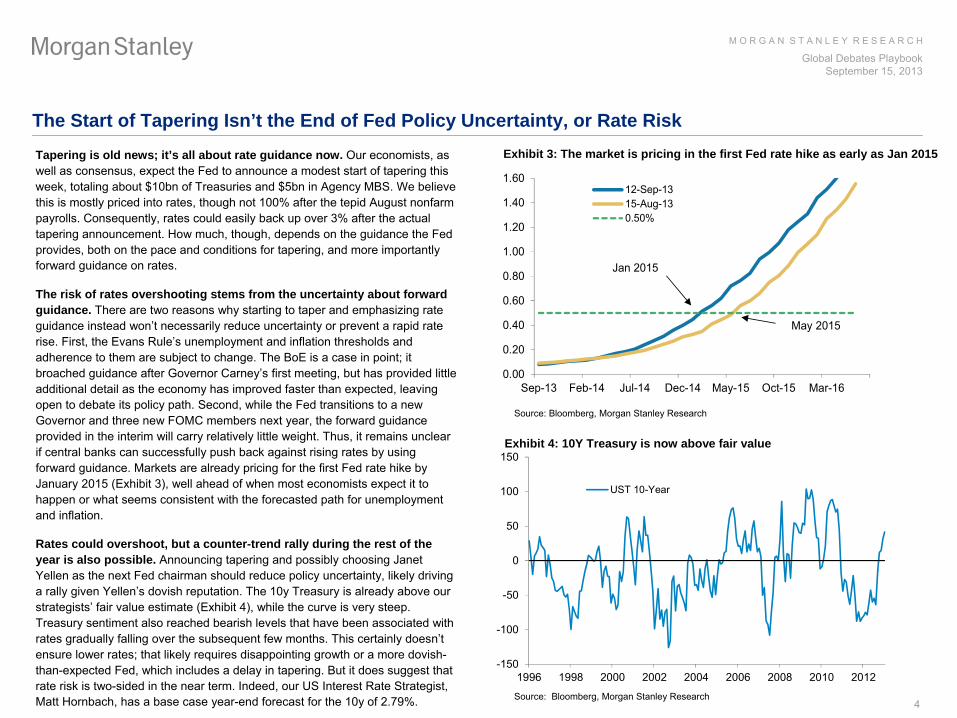
Tapering is old news; it’s all about rate guidance now. Our economists, as well as consensus, expect the Fed to announce a modest start of tapering this week, totaling about $10bn of Treasuries and $5bn in Agency MBS.
We believe this is mostly priced into rates, though not 100% after the tepid August nonfarm payrolls. Consequently, rates could easily back up over 3% after
the actual tapering announcement. How much, though, depends on the guidance
the Fed provides, both on the pace and conditions for tapering, and more
importantly forward guidance on rates.
The risk of rates overshooting stems from the uncertainty about forward guidance. There are two reasons why starting to taper and emphasizing rate guidance instead won’t necessarily reduce uncertainty or prevent a rapid rate rise. First, the Evans Rule’s unemployment and inflation thresholds and adherence to them are subject to change. The BoE is a case in point; it broached guidance after Governor Carney’s first meeting, but has provided little additional detail as the economy has improved faster than expected, leaving open to debate its policy path. Second, while the Fed transitions to a new Governor and three new FOMC members next year, the forward guidance provided in the interim will carry relatively little weight. Thus, it remains unclear if central banks can successfully push back against rising rates by using forward guidance. Markets are already pricing for the first Fed rate hike by January 2015 (Exhibit 3), well ahead of when most economists expect it to happen or what seems consistent with the forecasted path for unemployment and inflation.
Rates could overshoot, but a counter-trend rally during the rest of the year is also possible. Announcing tapering and possibly choosing Janet Yellen
as the next Fed chairman should reduce policy uncertainty, likely driving a rally given Yellen’s
dovish reputation. The 10y Treasury is already above our strategists’
fair value estimate (Exhibit 4), while the curve is very steep.
Treasury sentiment also reached bearish levels that have been associated with rates gradually falling over the subsequent few months. This certainly doesn’t ensure lower rates; that likely requires disappointing growth or
a more dovish-
than-expected Fed, which includes a delay in tapering. But it does suggest that rate risk is two-sided in the near term. Indeed, our US Interest Rate Strategist,
Matt Hornbach, has a base case year-end forecast for the 10y of 2.79%.
Exhibit 3: The market is pricing in the first Fed rate hike as early as Jan 2015
Source: Bloomberg, Morgan Stanley Research
Exhibit 4: 10Y Treasury is now above fair value
Source: Bloomberg, Morgan Stanley Research
0.00
0.20
0.40
0.60
0.80
1.00
1.20
1.40
1.60
Sep-13 Feb-14 Jul-14 Dec-14 May-15 Oct-15 Mar-16
12-Sep-1315-Aug-130.50%
Jan 2015
May 2015
-150
-100
-50
0
50
100
150
1996 1998 2000 2002 2004 2006 2008 2010 2012
UST 10-Year
M O R G A N S T A N L E Y R E S E A R C H
Global Debates PlaybookSeptember 15, 2013
5
The Rebound in Emerging Market Assets Does Not Mean Stabilization Is Assured
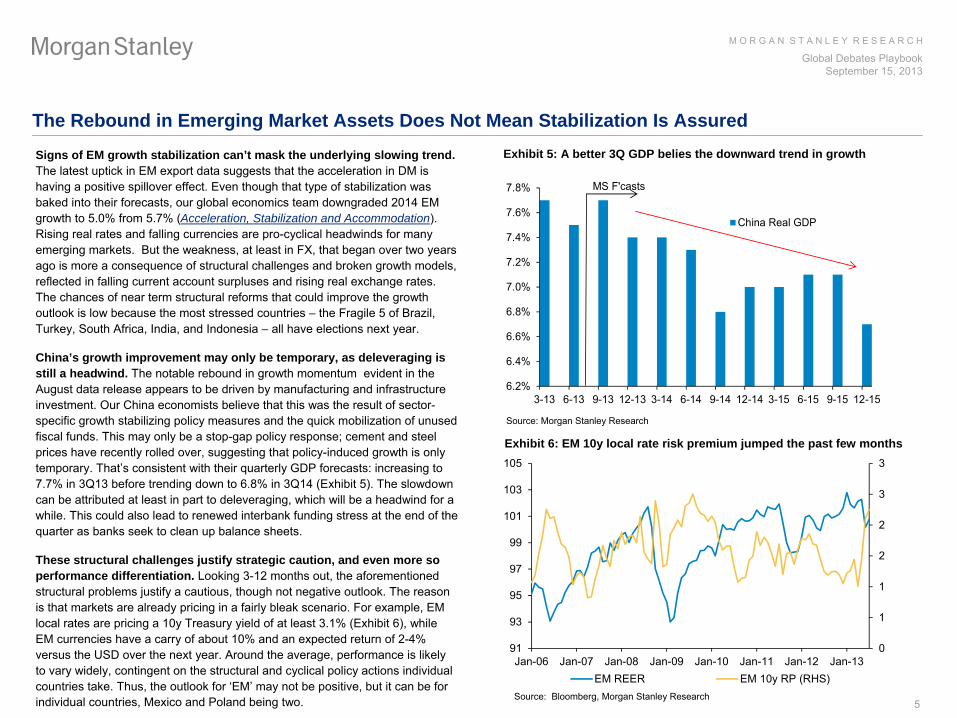
Signs of EM growth stabilization can’t mask the underlying slowing trend. The latest uptick in EM export data suggests that the acceleration in DM is having a positive spillover effect. Even though that type of stabilization was baked into their forecasts, our
global economics team downgraded 2014 EM growth to 5.0% from 5.7% (Acceleration, Stabilization and Accommodation). Rising real rates and falling currencies are pro-cyclical headwinds for many emerging markets. But the weakness, at least in FX, that began over two years ago is more a consequence of structural challenges and broken growth models, reflected in falling current account surpluses and rising real exchange rates. The chances of near term structural reforms that could improve the growth outlook is low because the most stressed countries –
the Fragile 5 of Brazil, Turkey, South Africa, India, and Indonesia –
all have elections next year.
China’s growth improvement may only be temporary, as deleveraging is still a headwind. The notable rebound in growth momentum evident in the August data release appears to be driven by manufacturing and infrastructure investment. Our China economists believe that this was the result of sector-
specific growth stabilizing policy measures and the quick mobilization of unused fiscal funds. This may only be a stop-gap policy response; cement and steel prices have recently rolled over, suggesting that policy-induced growth is only temporary. That’s consistent with their quarterly GDP forecasts: increasing to 7.7% in 3Q13 before trending down to 6.8% in 3Q14 (Exhibit 5). The slowdown can be attributed at least in part to deleveraging, which will be a headwind for a while. This could also lead to renewed interbank funding stress at the end of the quarter as banks seek to clean up balance sheets.
These structural challenges justify strategic caution, and even more so performance differentiation. Looking 3-12 months out, the aforementioned structural problems justify a cautious, though not negative outlook. The reason is that markets are already pricing in a fairly bleak scenario. For example, EM local rates are pricing a 10y Treasury yield of at least 3.1% (Exhibit 6), while EM currencies have a carry of about 10% and an expected return of 2-4% versus the USD over the next year. Around the average, performance is likely to vary widely, contingent on the structural and cyclical policy
actions individual countries take. Thus, the outlook for ‘EM’
may not be positive, but it can be for individual countries, Mexico and Poland being two.
Exhibit 5: A better 3Q GDP belies the downward trend in growth
Source: Morgan Stanley Research
Exhibit 6: EM 10y local rate risk premium jumped the past few months
Source: Bloomberg, Morgan Stanley Research
0
1
1
2
2
3
3
91
93
95
97
99
101
103
105
Jan-06 Jan-07 Jan-08 Jan-09 Jan-10 Jan-11 Jan-12 Jan-13EM REER EM 10y RP (RHS)
6.2%
6.4%
6.6%
6.8%
7.0%
7.2%
7.4%
7.6%
7.8%
3-13 6-13 9-13 12-13 3-14 6-14 9-14 12-14 3-15 6-15 9-15 12-15
China Real GDP
MS F'casts
M O R G A N S T A N L E Y R E S E A R C H
Global Debates PlaybookSeptember 15, 2013
6
The Good News: Rate Uncertainty Is Keeping Volatility High, but the Cycle Is Intact
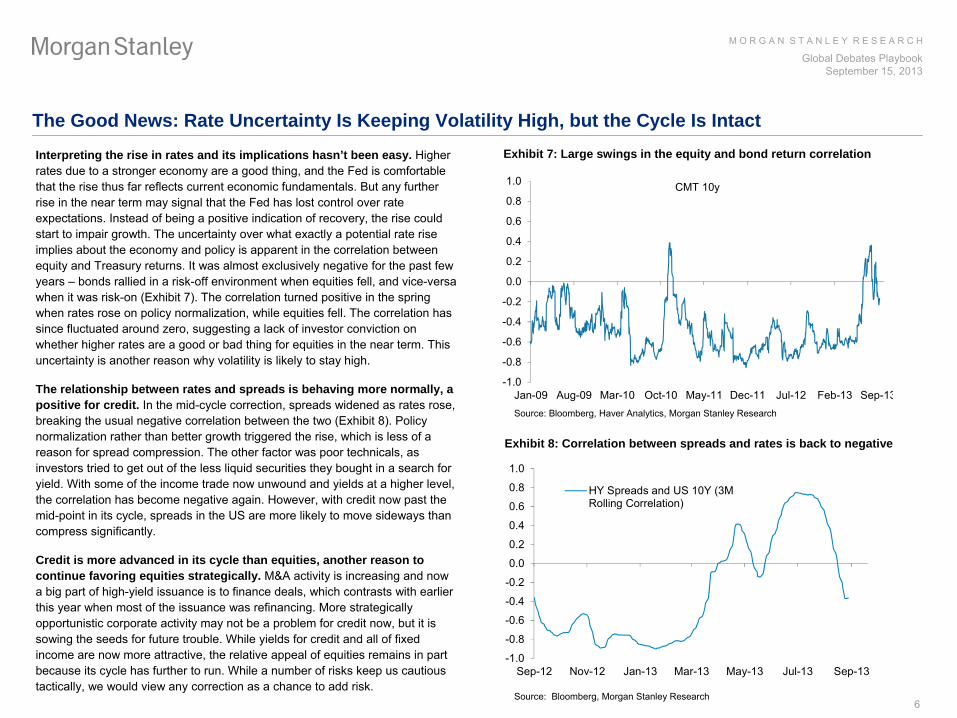
Interpreting the rise in rates and its implications hasn’t been easy. Higher rates due to a stronger economy are a good thing, and the Fed is comfortable that the rise thus far reflects current economic fundamentals. But any further rise in the near term may signal that the Fed has lost control over rate expectations. Instead of being a positive indication of recovery, the rise could start to impair growth. The uncertainty over what exactly a potential rate rise implies about the economy and policy is apparent in the correlation between equity and Treasury returns. It was almost exclusively negative for the past few years –
bonds rallied in a risk-off environment when equities fell, and vice-versa when it was risk-on (Exhibit 7). The correlation turned positive in the spring when rates rose on policy normalization, while equities fell. The correlation has since fluctuated around zero, suggesting a lack of investor conviction on whether higher rates are a good or bad thing for equities in the
near term. This uncertainty is another reason why volatility is likely to stay high.
The relationship between rates and spreads is behaving more normally, a positive for credit. In the mid-cycle correction, spreads widened as rates rose, breaking the usual negative correlation between the two (Exhibit
8). Policy normalization rather than better growth triggered the rise, which is less of a reason for spread compression. The other factor was poor technicals, as investors tried to get out of the less liquid securities they bought in a search for yield. With some of the income trade now unwound and yields at a
higher level, the correlation has become negative again. However, with credit now past the mid-point in its cycle, spreads in the US are more likely to move sideways than compress significantly.
Credit is more advanced in its cycle than equities, another reason to continue favoring equities strategically. M&A activity is increasing and now a big part of high-yield issuance is to finance deals, which contrasts with earlier
this year when most of the issuance was refinancing. More strategically opportunistic corporate activity may not be a problem for credit
now, but it is sowing the seeds for future trouble. While yields for credit and
all of fixed income are now more attractive, the relative appeal of equities remains in part because its cycle has further to run. While a number of risks keep us cautious tactically, we would view any correction as a chance to add risk.
Exhibit 7: Large swings in the equity and bond return correlation
Source: Bloomberg, Haver
Analytics, Morgan Stanley Research
Exhibit 8: Correlation between spreads and rates is back to negative
Source: Bloomberg, Morgan Stanley Research
-1.0
-0.8
-0.6
-0.4
-0.2
0.0
0.2
0.4
0.6
0.8
1.0
Jan-09 Aug-09 Mar-10 Oct-10 May-11 Dec-11 Jul-12 Feb-13 Sep-13
CMT 10y
-1.0
-0.8
-0.6
-0.4
-0.2
0.0
0.2
0.4
0.6
0.8
1.0
Sep-12 Nov-12 Jan-13 Mar-13 May-13 Jul-13 Sep-13
HY Spreads and US 10Y (3MRolling Correlation)
M O R G A N S T A N L E Y R E S E A R C H
Global Debates PlaybookSeptember 15, 2013
7
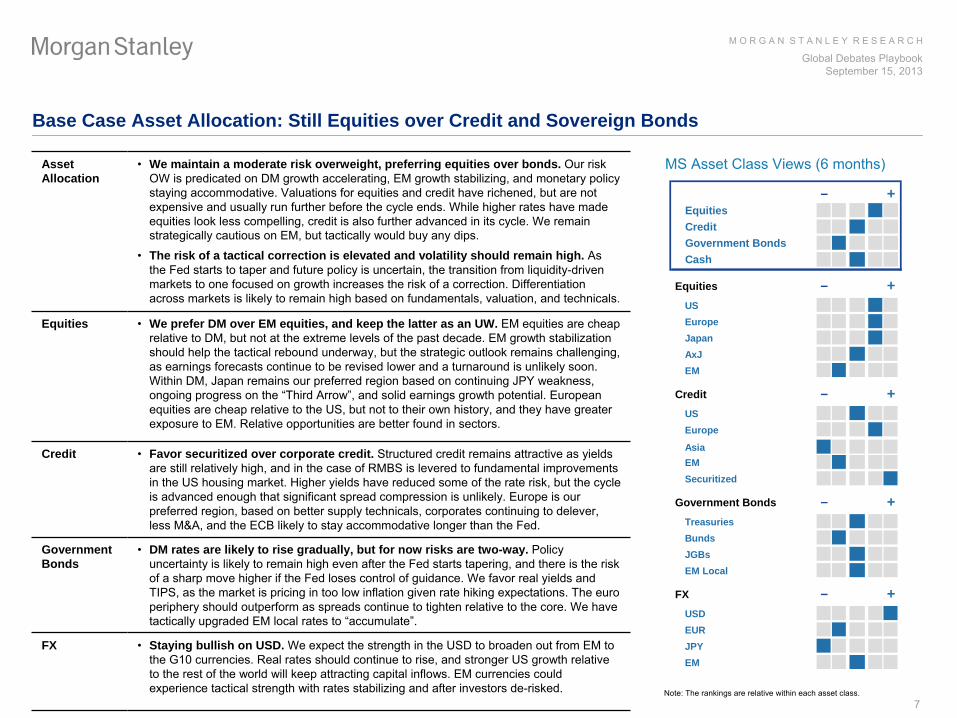
Base Case Asset Allocation: Still Equities over Credit and Sovereign Bonds
MS Asset Class Views (6 months)
Note: The rankings are relative within each asset class.
Asset Allocation
•
We maintain a moderate risk overweight, preferring equities over bonds. Our risk OW is predicated on DM growth accelerating, EM growth stabilizing, and monetary policy staying accommodative. Valuations for equities and credit have richened, but are not expensive and usually run further before the cycle ends. While higher rates have made equities look less compelling, credit is also further advanced in its cycle. We remain strategically cautious on EM, but tactically would buy any dips.
•
The risk of a tactical correction is elevated and volatility should remain high. As the Fed starts to taper and future policy is uncertain, the transition from liquidity-driven markets to one focused on growth increases the risk of a correction. Differentiation across markets is likely to remain high based on fundamentals, valuation, and technicals.
Equities •
We prefer DM over EM equities, and keep the latter as an UW. EM equities are cheap relative to DM, but not at the extreme levels of the past decade. EM growth stabilization should help the tactical rebound underway, but the strategic outlook remains challenging, as earnings forecasts continue to be revised lower and a turnaround is unlikely soon. Within DM, Japan remains our preferred region based on continuing JPY weakness, ongoing progress on the “Third Arrow”, and solid earnings growth potential. European equities are cheap relative to the US, but not to their own history, and they have greater exposure to EM. Relative opportunities are better found in sectors.
Credit •
Favor securitized over corporate credit. Structured credit remains attractive as yields are still relatively high, and in the case of RMBS is levered to
fundamental improvements in the US housing market. Higher yields have reduced some of the
rate risk, but the cycle is advanced enough that significant spread compression is unlikely. Europe is our preferred region, based on better supply technicals, corporates
continuing to delever, less M&A, and the ECB likely to stay accommodative longer than the Fed.
Government Bonds
•
DM rates are likely to rise gradually, but for now risks are two-way. Policy uncertainty is likely to remain high even after the Fed starts tapering, and there is the risk of a sharp move higher if the Fed loses control of guidance. We favor real yields and TIPS, as the market is pricing in too low inflation given rate hiking expectations. The euro periphery should outperform as spreads continue to tighten relative to the core. We have tactically upgraded EM local rates to “accumulate”.
FX •
Staying bullish on USD. We expect the strength in the USD to broaden out from EM to the G10 currencies. Real rates should continue to rise, and stronger US growth relative to the rest of the world will keep attracting capital inflows. EM currencies could experience tactical strength with rates stabilizing and after investors de-risked.
– +EquitiesCreditGovernment BondsCash
Equities – +USEuropeJapanAxJEM
Credit – +USEurope
AsiaEMSecuritized
Government Bonds – +TreasuriesBundsJGBsEM Local
FX – +USDEURJPYEM

M O R G A N S T A N L E Y R E S E A R C H
Global Debates PlaybookSeptember 15, 2013
8
•
The latest economic data supports DM growth acceleration and EM stabilizing, as the latter has experienced an uptick in exports and better responses from policy-
makers in the ‘Fragile Five’
(Brazil, India, Indonesia, South Africa, Turkey).
•
But EM is still weighed down by current accounts that remain sticky, and the negative feedback from the summer sell-off that has yet to be felt, while stable US rates and stronger China growth are likely to be temporary.
•
Higher rates could slow the US recovery, but not stall it. In particular, the housing recovery should stay resilient. The strong recovery in prices over the past year was likely to slow anyway, but housing affordability remains high, and the slowdown in new housing starts should be only temporary.
DM Growth Is Accelerating and EM Is Stabilizing for Now, but China’s Need to Delever Is a Headwind
Source: Federal Reserve, Morgan Stanley Research
Source: BIS, Morgan Stanley Research
Source: IMF, Markit, National Sources, Haver
Analytics, Morgan Stanley Research
EM exports are starting to grow again
US housing affordability is still relatively low after the rate rise China has built up a lot of leverage the past five years
Source: CEIC, CBRC, Wind, Morgan Stanley Research
PMIs
in DM are accelerating, only stabilizing in EM
30
35
40
45
50
55
60
Jun-03 Jun-05 Jun-07 Jun-09 Jun-11 Jun-13
DM EM
-50-40-30-20-10
0102030405060
Jun-03 Jun-05 Jun-07 Jun-09 Jun-11 Jun-13
AxJ
Latam
CEEMEA
10%
12%
14%
16%
18%
20%
22%
24%
26%
28%
30%
87 89 91 93 95 97 99 01 03 05 07 09 11 13
Monthly Paymentas % of IncomeLong-runAverage
20.8% 21.6% 20.6% 18.9% 18.6%
15.8% 25.0% 25.3% 24.6% 27.7%
73.6%81.1% 83.5% 84.7%
99.2%
34.5%
39.6%52.6% 51.9%
53.5%
11.9%
16.2%18.7% 18.8%
20.1%
0%
50%
100%
150%
200%
250%
2008 2009 2010 2011 2012
Central government Local governments Mid/large corporates
Small business Consumers

M O R G A N S T A N L E Y R E S E A R C H
Global Debates PlaybookSeptember 15, 2013
9
•
Volatility for all asset classes except for rates has stayed relatively contained since rising in the May/June correction. Rate volatility is likely to remain high until there is more clarity on the path of policy and forward guidance under the new Fed chairman.
•
The rise in volatility has had relatively little effect on cross-asset correlations, which have fallen sharply over the past year to pre-
crisis levels. Differentiation in performance across markets should remain high as valuations are around fair value, with company, sector and country fundamentals being the main driver.
•
High rate volatility could continue to weigh on other markets, including equities, as it’s a proxy for the uncertainty about Fed policy and implications.
Fed Policy Uncertainty Will Keep Volatilities High, but Not a ‘Market of One’
Source: Bloomberg, Morgan Stanley Research
Source: Bloomberg, Morgan Stanley Research
Source: Bloomberg, Morgan Stanley Research
Cross-asset correlations remain moderate
Higher rates volatility has corresponded to equity weakness
35%
40%
45%
50%
55%
60%
65%
70%
75%
03 04 05 06 07 08 09 10 11 12 13
%var explained by 1st principal component
-1.00
-0.80
-0.60
-0.40
-0.20
0.00
0.20
0.40
0.60
0.80
Jan-10 Aug-10 Mar-11 Oct-11 May-12 Dec-12 Jul-13
30d Correlation
90100110120130140150160170180190200210220
1 6 11 16 21 26 31 36 41 46 51 56 61 66 71 76 81 86 91
EquityFXRatesCredit
Indexed to 100 as of most recent trough
Days Since Trough
Volatilities for all asset classes have risen recently
M O R G A N S T A N L E Y R E S E A R C H
Global Debates PlaybookSeptember 15, 2013
10
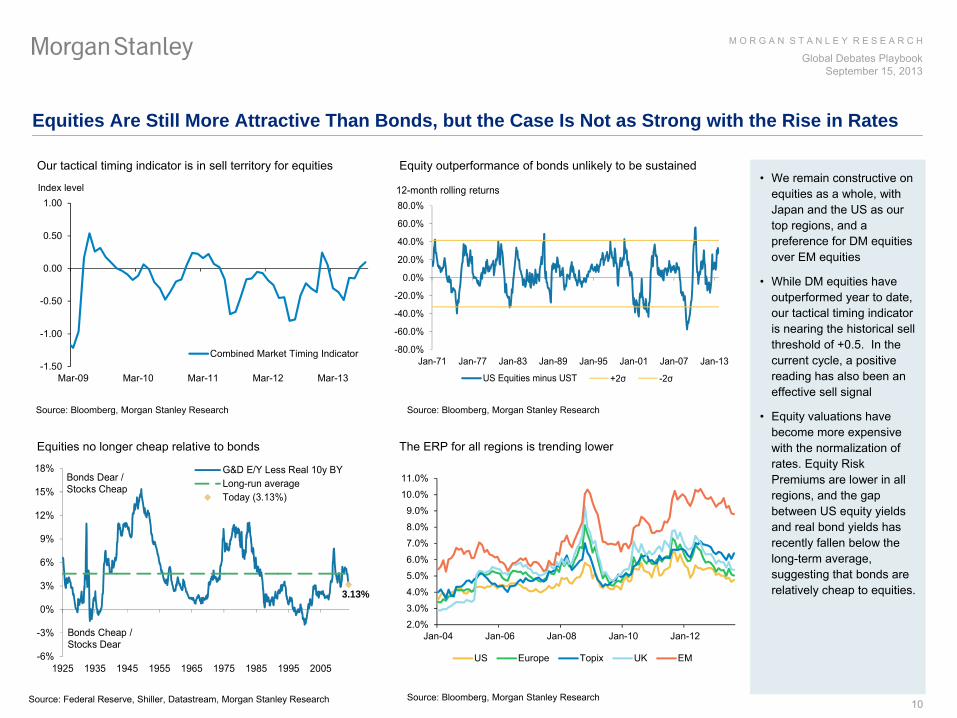
•
We remain constructive on equities as a whole, with Japan and the US as our top regions, and a preference for DM equities over EM equities
•
While DM equities have outperformed year to date, our tactical timing indicator is nearing the historical sell threshold of +0.5. In the current cycle, a positive reading has also been an effective sell signal
•
Equity valuations have become more expensive with the normalization of rates. Equity Risk Premiums are lower in all regions, and the gap between US equity yields and real bond yields has recently fallen below the long-term average, suggesting that bonds are relatively cheap to equities.
Equities Are Still More Attractive Than Bonds, but the Case Is Not as Strong with the Rise in Rates
Source: Bloomberg, Morgan Stanley Research
Source: Federal Reserve, Shiller, Datastream, Morgan Stanley Research
Source: Bloomberg, Morgan Stanley Research
Equity outperformance of bonds unlikely to be sustained
Equities no longer cheap relative to bonds The ERP for all regions is trending lower
Source: Bloomberg, Morgan Stanley Research
-1.50
-1.00
-0.50
0.00
0.50
1.00
Mar-09 Mar-10 Mar-11 Mar-12 Mar-13
Combined Market Timing Indicator
Index level
-80.0%
-60.0%
-40.0%
-20.0%
0.0%
20.0%
40.0%
60.0%
80.0%
Jan-71 Jan-77 Jan-83 Jan-89 Jan-95 Jan-01 Jan-07 Jan-13
US Equities minus UST +2σ -2σ
12-month rolling returns
3.13%
-6%
-3%
0%
3%
6%
9%
12%
15%
18%
1925 1935 1945 1955 1965 1975 1985 1995 2005
G&D E/Y Less Real 10y BYLong-run averageToday (3.13%)
Bonds Cheap / Stocks Dear
Bonds Dear / Stocks Cheap
Our tactical timing indicator is in sell territory for equities
2.0%
3.0%
4.0%
5.0%
6.0%
7.0%
8.0%
9.0%
10.0%
11.0%
Jan-04 Jan-06 Jan-08 Jan-10 Jan-12
US Europe Topix UK EM

M O R G A N S T A N L E Y R E S E A R C H
Global Debates PlaybookSeptember 15, 2013
11
•
The rise in rates has pushed Treasury, Bund, and Gilt yields back around fair value. The 2s10s curve in the US is also within about 40bps of its high over the past 40 years. Neither of these factors would keep 10y yields from overshooting if the Fed makes a policy mistake, but they do suggest an upper limit of how far rates will rise.
•
Sentiment on Treasuries remains very bearish. When sentiment was at this level during the past decade, the 10y yield gradually drifted about 40bps lower over the subsequent six months. Since sentiment recently troughed, the yield has gone even higher.
Fed Policy Mistakes Could Lead to Higher Rates, but the Upside Looks Limited Near Term
Source: Bloomberg, Morgan Stanley Research
Source: Bloomberg, Morgan Stanley Research
Source: US Economics Team, Morgan Stanley Research
The yield curve is also very steep
Investor bearishness on Treasuries is high… …and that has corresponded to rates drifting lower
Source: Bloomberg, Morgan Stanley Research
Treasury, Bund and Gilt 10y yields are back to fair value
-200
-150
-100
-50
0
50
100
150
200
1996 1998 2000 2002 2004 2006 2008 2010 2012
UST 10-YearDBR 10-Year
-300
-200
-100
0
100
200
300
400
76 79 82 85 88 91 94 97 00 03 06 09 12
2s10s curve
0102030405060708090
100
Jan-03 Jan-06 Jan-09 Jan-12T-Bonds 20-day MA
% of traders bullish
-50-40-30-20-10
0102030405060
t + 0 t + 30 t + 60 t + 90 t + 120
Average since 2003
Bps change in 10-year yield since July 1
Basis point change from bearish sentiment reading
M O R G A N S T A N L E Y R E S E A R C H
Global Debates PlaybookSeptember 15, 2013
12
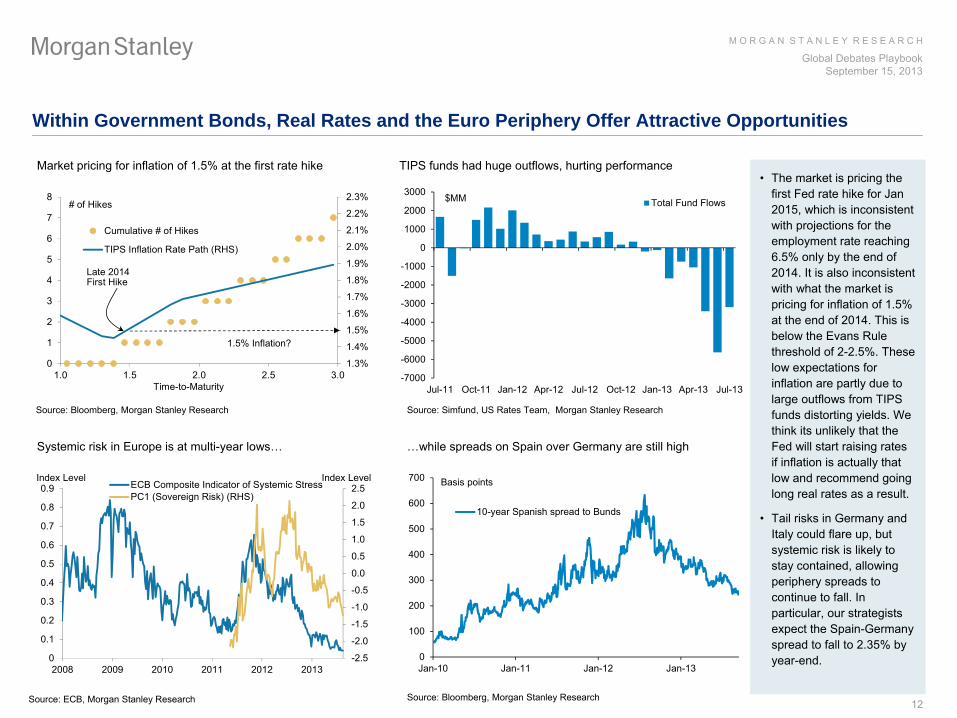
•
The market is pricing the first Fed rate hike for Jan 2015, which is inconsistent with projections for the employment rate reaching 6.5% only by the end of 2014. It is also inconsistent with what the market is pricing for inflation of 1.5% at the end of 2014. This is below the Evans Rule threshold of 2-2.5%. These low expectations for inflation are partly due to large outflows from TIPS funds distorting yields. We think its unlikely that the Fed will start raising rates if inflation is actually that low and recommend going long real rates as a result.
•
Tail risks in Germany and Italy could flare up, but systemic risk is likely to stay contained, allowing periphery spreads to continue to fall. In particular, our strategists expect the Spain-Germany spread to fall to 2.35% by year-end.
Within Government Bonds, Real Rates and the Euro Periphery Offer Attractive Opportunities
Source: Simfund, US Rates Team, Morgan Stanley Research
Source: ECB, Morgan Stanley Research
Source: Bloomberg, Morgan Stanley Research
Systemic risk in Europe is at multi-year lows…
Source: Bloomberg, Morgan Stanley Research
Market pricing for inflation of 1.5% at the first rate hike TIPS funds had huge outflows, hurting performance
-7000
-6000
-5000
-4000
-3000
-2000
-1000
0
1000
2000
3000
Jul-11 Oct-11 Jan-12 Apr-12 Jul-12 Oct-12 Jan-13 Apr-13 Jul-13
Total Fund Flows$MM
-2.5
-2.0
-1.5
-1.0
-0.5
0.0
0.5
1.0
1.5
2.0
2.5
0
0.1
0.2
0.3
0.4
0.5
0.6
0.7
0.8
0.9
2008 2009 2010 2011 2012 2013
Index LevelIndex Level ECB Composite Indicator of Systemic StressPC1 (Sovereign Risk) (RHS)
0
100
200
300
400
500
600
700
Jan-10 Jan-11 Jan-12 Jan-13
10-year Spanish spread to Bunds
Basis points
…while spreads on Spain over Germany are still high
1.3%
1.4%
1.5%
1.6%
1.7%
1.8%
1.9%
2.0%
2.1%
2.2%
2.3%
0
1
2
3
4
5
6
7
8
1.0 1.5 2.0 2.5 3.0
Cumulative # of Hikes
TIPS Inflation Rate Path (RHS)
# of Hikes
Time-to-Maturity
Late 2014 First Hike
1.5% Inflation?
M O R G A N S T A N L E Y R E S E A R C H
Global Debates PlaybookSeptember 15, 2013
13
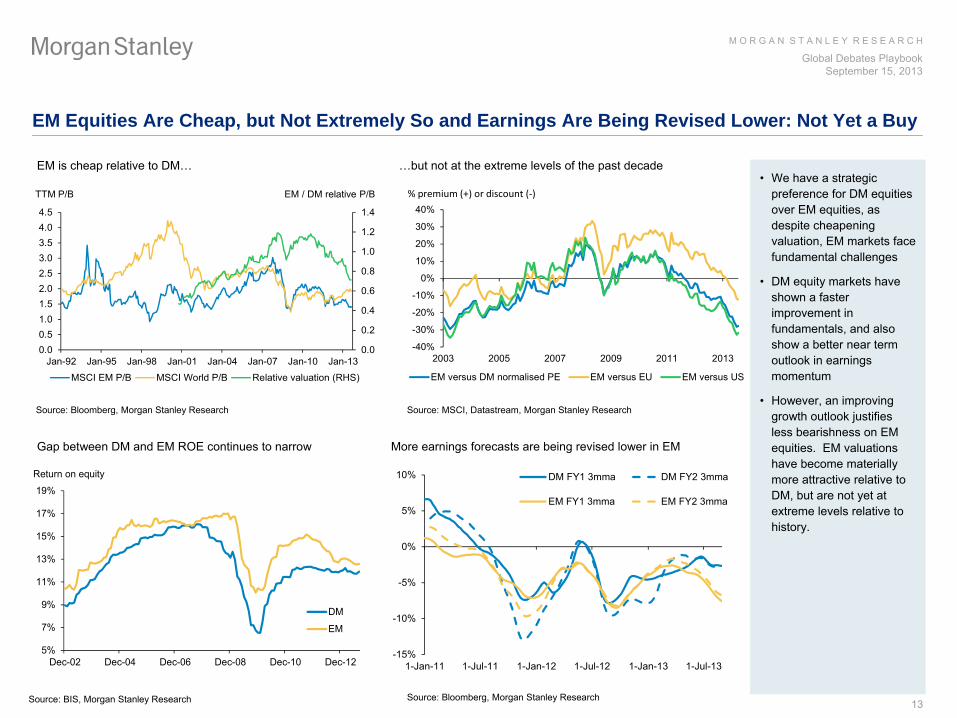
•
We have a strategic preference for DM equities over EM equities, as despite cheapening valuation, EM markets face fundamental challenges
•
DM equity markets have shown a faster improvement in fundamentals, and also show a better near term outlook in earnings momentum
•
However, an improving growth outlook justifies less bearishness on EM equities. EM valuations have become materially more attractive relative to DM, but are not yet at extreme levels relative to history.
EM Equities Are Cheap, but Not Extremely So and Earnings Are Being Revised Lower: Not Yet a Buy
Source: MSCI, Datastream, Morgan Stanley Research
Source: BIS, Morgan Stanley Research
Source: Bloomberg, Morgan Stanley Research
…but not at the extreme levels of the past decade
Gap between DM and EM ROE continues to narrow More earnings forecasts are being revised lower in EM
Source: Bloomberg, Morgan Stanley Research
0.0
0.2
0.4
0.6
0.8
1.0
1.2
1.4
0.00.51.01.52.02.53.03.54.04.5
Jan-92 Jan-95 Jan-98 Jan-01 Jan-04 Jan-07 Jan-10 Jan-13
MSCI EM P/B MSCI World P/B Relative valuation (RHS)
TTM P/B EM / DM relative P/B
-15%
-10%
-5%
0%
5%
10%
1-Jan-11 1-Jul-11 1-Jan-12 1-Jul-12 1-Jan-13 1-Jul-13
DM FY1 3mma DM FY2 3mma
EM FY1 3mma EM FY2 3mma
5%
7%
9%
11%
13%
15%
17%
19%
Dec-02 Dec-04 Dec-06 Dec-08 Dec-10 Dec-12
DM
EM
Return on equity
EM is cheap relative to DM…
-40%
-30%
-20%
-10%
0%
10%
20%
30%
40%
2003 2005 2007 2009 2011 2013
EM versus DM normalised PE EM versus EU EM versus US
% premium (+) or discount (‐)

M O R G A N S T A N L E Y R E S E A R C H
Global Debates PlaybookSeptember 15, 2013
14
•
We are overweight both US and European equities, with an improving European outlook justifying a more bullish stance
•
However, valuations for both US and European equities are close to long-
term averages, although European equities remain slightly cheaper than those of the US
•
One of the many reasons one may consider an overweight in Europe relative to the US is lower valuation and a high recovery potential –
this is very obvious in a sector like the Financials, with notable gaps in forward P/Es and ROE
Europe’s Outlook Has Improved, but European Equities Aren’t a Better Buy Than the US
Source: , Morgan Stanley Research
Source: IBES, MSCI, Datastream, Morgan Stanley Research
Source: Morgan Stanley Research
Europe’s ROE is lower, an opportunity and constraint
Europe Financials are relatively cheap to the US…
Source: MSCI, Datastream, Morgan Stanley Research
US and Europe both near long-term average valuations
…and the lower ROE should improve with the recovery
-2.00
-1.50
-1.00
-0.50
0.00
0.50
1.00
1.50
2.00
ROE TTM P/E P/Book P/Cash D/YUSA Europe
Z-Score
-15%
-10%
-5%
0%
5%
10%
15%
20%
Jan-04 Jan-06 Jan-08 Jan-10 Jan-12
Europe Financials
US Financials0
5
10
15
20
25
Jan-95 Jan-98 Jan-01 Jan-04 Jan-07 Jan-10 Jan-13
US Financials
EU Financials
NTM P/E
5%
7%
9%
11%
13%
15%
17%
19%
Dec-02 Dec-04 Dec-06 Dec-08 Dec-10 Dec-12
US
Europe
M O R G A N S T A N L E Y R E S E A R C H
Global Debates PlaybookSeptember 15, 2013
15
•
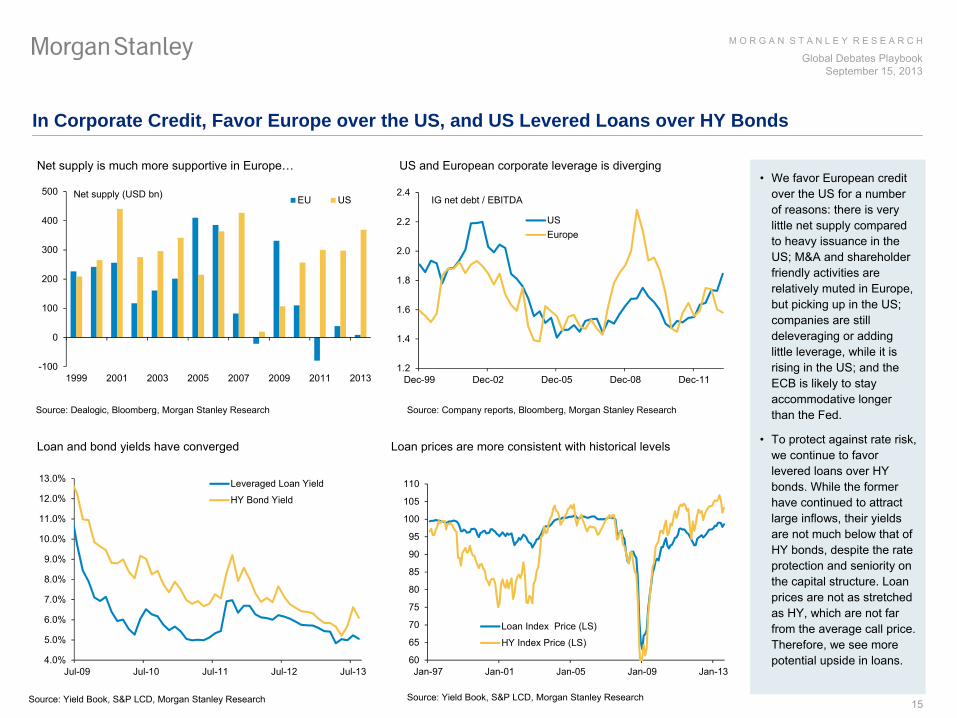
We favor European credit over the US for a number of reasons: there is very little net supply compared to heavy issuance in the US; M&A and shareholder friendly activities are relatively muted in Europe, but picking up in the US; companies are still deleveraging or adding little leverage, while it is rising in the US; and the ECB is likely to stay accommodative longer than the Fed.
•
To protect against rate risk, we continue to favor levered loans over HY bonds. While the former have continued to attract large inflows, their yields are not much below that of HY bonds, despite the rate protection and seniority on the capital structure. Loan prices are not as stretched as HY, which are not far from the average call price. Therefore, we see more potential upside in loans.
In Corporate Credit, Favor Europe over the US, and US Levered Loans over HY Bonds
Source: Company reports, Bloomberg, Morgan Stanley Research
Source: Yield Book, S&P LCD, Morgan Stanley Research
Source: Dealogic, Bloomberg, Morgan Stanley Research
US and European corporate leverage is diverging
Loan and bond yields have converged Loan prices are more consistent with historical levels
Source: Yield Book, S&P LCD, Morgan Stanley Research
Net supply is much more supportive in Europe…
-100
0
100
200
300
400
500
1999 2001 2003 2005 2007 2009 2011 2013
EU USNet supply (USD bn)
1.2
1.4
1.6
1.8
2.0
2.2
2.4
Dec-99 Dec-02 Dec-05 Dec-08 Dec-11
USEurope
IG net debt / EBITDA
4.0%
5.0%
6.0%
7.0%
8.0%
9.0%
10.0%
11.0%
12.0%
13.0%
Jul-09 Jul-10 Jul-11 Jul-12 Jul-13
Leveraged Loan Yield
HY Bond Yield
60
65
70
75
80
85
90
95
100
105
110
Jan-97 Jan-01 Jan-05 Jan-09 Jan-13
Loan Index Price (LS)
HY Index Price (LS)

M O R G A N S T A N L E Y R E S E A R C H
Global Debates PlaybookSeptember 15, 2013
16
•
EM FX and local rates have both cheapened significantly and are pricing in fairly bearish scenarios. EM currencies have a carry of about 10% and an expected return of 2-4% versus the USD over the next year. Local rates are pricing in a 10y Treasury yield of at least 3.1%. Better valuations, combined with stabilizing in US rates and China and investors building better cash positions, warranted a tactical upgrade to both.
•
However, much of EM still faces structural challenges, primarily stemming from a loss of competitiveness from rising real exchange rates, leading to smaller current account surpluses and slower FX reserve accumulation. Countries that undertake policy reforms to address these problems are likely to outperform in risk markets.
Valuations Help the Tactical Appeal of EM Fixed Income, but Not Enough to Offset Structural Issues
Source: Bloomberg, Morgan Stanley Research
Note: EM yields compiled from Turkey, South Africa, Poland, Hungary, Indonesia, Malaysia, Thailand, South Korea, and Mexico. DM refers to the US and Germany
Source: Bloomberg, Morgan Stanley Research
Source: US Economics Team, Morgan Stanley Research
Real exchanges rates are lower, especially for Fragile 5 But the growth in EM central bank reserves has halted
Source: Haver
Analytics, Morgan Stanley Research Note: Assumes IMF COFER weights
Average carry for EM FX is up over 3% the past few months EM local bonds now offer good value relative to DM
-10%-5%0%5%
10%15%20%25%30%35%
Jan-05 Jan-07 Jan-09 Jan-11 Jan-13AXJ (ex China) CEEMEA LatAm
YoY change in EM Central Bank FX Reserves
1.5%
2.5%
3.5%
4.5%
5.5%
6.5%
7.5%
8.5%
87
89
91
93
95
97
99
101
103
105
107
Jan-10 Aug-10 Mar-11 Oct-11 May-12 Dec-12 Jul-13
USD/EM
EMFX Avg Carry (Implied ForwardRate, RHS)
3.0%
3.5%
4.0%
4.5%
5.0%
5.5%
6.0%
6.5%
0.0%
1.0%
2.0%
3.0%
4.0%
5.0%
6.0%
7.0%
8.0%
9.0%
Apr-09 Nov-09 Jun-10 Jan-11 Aug-11 Mar-12 Oct-12 May-13EM-DM Spread (RHS) EM 10y DM 10y
80
85
90
95
100
105
110
115
120
Jan 03 Jun 04 Nov 05 Apr 07 Sep 08 Feb 10 Jul 11 Dec 12
EM REERFragile Five REER
M O R G A N S T A N L E Y R E S E A R C H
Global Debates PlaybookSeptember 15, 2013
17
Risk-Reward Views

M O R G A N S T A N L E Y R E S E A R C H
Global Debates PlaybookSeptember 15, 2013
18Source: Morgan Stanley Research forecasts
Note: *US GDP forecast for current quarter is tracking estimate.
**Global is comprised of G10, BRICs, and Korea
Economic Forecasts
2012 2013E 2014EReal GDP (%Q, SAAR) Bear Base Bull Base 3QE 4QE 1QE 2QE 3QE 4QEGlobal 3.2 2.6 2.9 3.2 3.5 3.8 3.7 3.4 3.2 3.7 3.9G10 1.5 0.8 1.0 1.2 2.0 1.7 2.1 2.3 1.5 1.9 2.1
US 2.8 1.6 1.6 1.7 2.7 2.1 2.7 2.8 2.9 2.8 2.8Euro Area -0.5 -0.7 -0.5 -0.3 0.9 0.4 0.9 0.9 1.0 1.2 1.2Japan 2.0 1.1 1.6 1.8 1.3 2.2 2.9 3.3 -3.5 0.3 1.3UK 0.2 1.3 1.4 1.5 2.4 3.6 2.0 2.4 2.0 2.0 2.0
EM (%Y) 4.9 4.2 4.8 5.1 4.9 5.0 4.5 4.7 4.9 4.8 5.1China (%Y) 7.7 7.0 7.6 7.7 7.1 7.7 7.4 7.4 7.3 6.8 7.0India (%Y) 5.1 4.1 4.4 4.6 4.6 4.5 3.9 3.8 4.2 5.0 5.1Brazil (%Y) 0.9 1.5 2.1 2.4 1.7 1.8 1.5 1.9 0.6 2.3 2.0Russia (%Y) 3.4 1.5 2.2 2.9 3.1 2.4 2.9 3.4 3.9 3.0 2.8
Consumer Price Inflation (%Y)Global 3.3 2.9 3.3 3.4 3.0 3.2 3.3 3.2 3.5 3.3 3.3G10 1.9 1.4 1.5 1.6 1.7 1.8 1.5 1.3 1.5 1.5 1.4
US 2.1 1.5 1.6 1.6 1.4 1.6 1.5 1.3 1.7 1.4 1.3Euro Area 2.5 1.5 1.5 1.6 1.6 1.4 1.5 1.6 1.8 1.5 1.4Japan -0.1 -0.1 0.2 0.4 2.3 0.5 0.7 0.8 2.8 2.7 2.7UK 2.8 2.7 2.7 2.7 2.7 2.8 2.6 2.6 2.8 2.8 2.6
EM 4.8 4.4 5.1 5.2 4.3 4.6 5.0 5.0 5.4 5.0 5.0China 2.6 1.5 2.6 2.6 1.8 3.0 2.6 1.5 2.2 1.9 1.5India 9.3 10.2 10.8 11.6 7.4 10.9 9.9 8.3 8.0 6.7 6.5Brazil 5.4 6.0 6.2 6.5 6.1 6.1 5.8 5.8 5.8 6.2 6.5Russia 5.1 6.0 6.5 7.0 4.9 6.1 5.5 5.2 4.8 4.7 5.0
Monetary Policy Rate (% p.a.)Global 3.3 2.9 2.9 3.0 2.9 2.8 2.9 2.8 2.9G10 0.6 0.5 0.3 0.5 0.5 0.4 0.4 0.3 0.3
US 0.2 0.2 0.2 0.2 0.2 0.2 0.2 0.2 0.2Euro Area 0.8 0.3 0.3 0.5 0.3 0.3 0.3 0.3 0.3Japan 0.1 0.1 0.1 0.1 0.1 0.1 0.1 0.1 0.1UK 0.5 0.5 0.5 0.5 0.5 0.5 0.5 0.5 0.5
EM 6.2 5.4 5.5 5.7 5.4 5.4 5.5 5.5 5.5China 6.0 6.0 5.5 6.0 6.0 6.0 5.8 5.8 5.5India 8.0 7.3 7.3 7.3 7.3 7.3 7.3 7.3 7.3Brazil 7.3 9.8 9.8 9.0 9.8 9.8 9.8 9.8 9.8Russia 5.5 5.0 4.8 5.3 5.0 4.8 4.8 4.8 4.8
2014E2013EAnnual Quarterly
M O R G A N S T A N L E Y R E S E A R C H
Global Debates PlaybookSeptember 15, 2013
19Source: Morgan Stanley Research forecasts
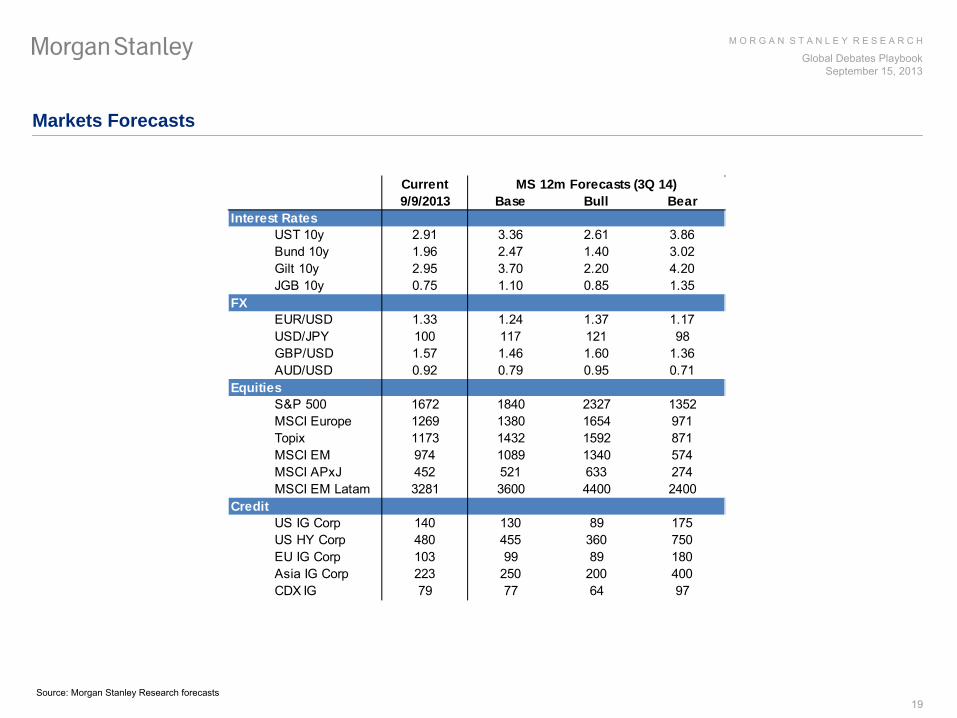
Markets Forecasts
Current9/9/2013 Base Bull Bear
Interest RatesUST 10y 2.91 3.36 2.61 3.86Bund 10y 1.96 2.47 1.40 3.02Gilt 10y 2.95 3.70 2.20 4.20JGB 10y 0.75 1.10 0.85 1.35
FXEUR/USD 1.33 1.24 1.37 1.17USD/JPY 100 117 121 98GBP/USD 1.57 1.46 1.60 1.36AUD/USD 0.92 0.79 0.95 0.71
EquitiesS&P 500 1672 1840 2327 1352MSCI Europe 1269 1380 1654 971Topix 1173 1432 1592 871MSCI EM 974 1089 1340 574MSCI APxJ 452 521 633 274MSCI EM Latam 3281 3600 4400 2400
CreditUS IG Corp 140 130 89 175US HY Corp 480 455 360 750EU IG Corp 103 99 89 180Asia IG Corp 223 250 200 400CDX IG 79 77 64 97
MS 12m Forecasts (3Q 14)

M O R G A N S T A N L E Y R E S E A R C H
Global Debates PlaybookSeptember 15, 2013
20
Global Economics Risk-Reward ViewInvestor Debates
DM: How long can monetary policy stay accommodative?
US: What is the profile for tapering?
ECB: Further easing measures to go?
Japan: What next for the consumption tax?
EM: Is stabilization finally here?
What’s in the price?
Central banks’
forward guidance being discounted by markets.
Fed tapering likely to be accompanied by attempt to prevent another rise in interest rates.
Markets not pricing more easing measures from the ECB.
Markets question Japan’s ability to deliver on structural reforms.
Weaker US payrolls numbers mean EM markets adequatelyreflect near-term risk.
Signposts
September 18, 2013 FOMC meeting, SEP and press conference
September 22, 2013 German parliamentary elections
October 2, 2013 ECB council meeting and press conference
October 2013Japan deadline for decision on consumption tax hike timing
November 2013Third Plenary session of 18th
Central Committee of CPC
February 1, 2014 Term begins for new chairman of the US Federal Reserve
March 1, 2014 ECB expected to assume supervisory tasks within Single Supervisory Mechanism
Joachim Fels, Manoj Pradhan (44 207) 425-6138, [email protected]
Key Indicators A Global Expansion Now Led by DM Growth
Source: Morgan Stanley Research
Base Case 2014 Global GDP: 3.5%We recently downgraded our global GDP forecasts by two-
tenths to 2.9% for 2013 and four-tenths to 3.5% for 2014. Our global narrative for the next 6-12 months rests on three pillars: An acceleration of growth in DM, stabilisation
in EM economies (with downside risks) and continued accommodation by central banks.
We continue to expect the DM economies to accelerate from twilight to daylight, taking leadership of the global economic cycle. EM growth should stabilise at a lower level, although we remain concerned about the structural and cyclical fragilities. Global monetary policy is likely to remain accommodative, as DM central banks are likely to continue to push back on market expectations of earlier rate hikes.
Bull Case 2014 Global GDP: 4.1%In our bull scenario, benign US rates, sustained growth in China, and encouraging progress on EM reforms propel a more rapid acceleration to above 4% GDP growth in 2014.
Bear Case 2014 Global GDP: 2.4%In our bear scenario, US bond yields surge sharply to around 4.0% in the next few months and China growth slows down into a 5.5-6.0%Y range in late 2013 and much of 2014. This scenario marks the next global recession, with global GDP growth falling below the 2.5% threshold.
CZE COL
CHL
Growth bottoming
Growth peaking
THL
IDN, MAL
IND, BRA CHN, RUS, NGR, GHA
TUR
KOR, TWN, KEN
MEX, POL, HUN, ISR, SAF, PEREA,
US, CAN
JPN, UK, SWE
2013E 2014E 2015E
Global GDPBear 2.6 2.4 2.7Base 2.9 3.5 3.7
Bull 3.2 4.1 4.4
G10 GDPBear 0.8 1.1 1.0Base 1.0 2.0 2.0Bull 1.2 2.6 2.7
EM GDPBear 4.2 3.6 4.2Base 4.8 4.9 5.2
Bull 5.1 5.6 5.9Global
Inflation (CPI)
Bear 2.9 2.0 2.1Base 3.3 3.0 3.1Bull 3.4 3.6 3.9
M O R G A N S T A N L E Y R E S E A R C H
Global Debates PlaybookSeptember 15, 2013
21
-0.60
-0.40
-0.20
0.00
0.20
0.40
0.60
0.80
1.00
1.20
Jul Aug Sep Oct Nov Dec Jan Feb Mar Apr May Jun Jul Aug
Aggregate Weekly Payrolls: Total Private Industries% Change MoM
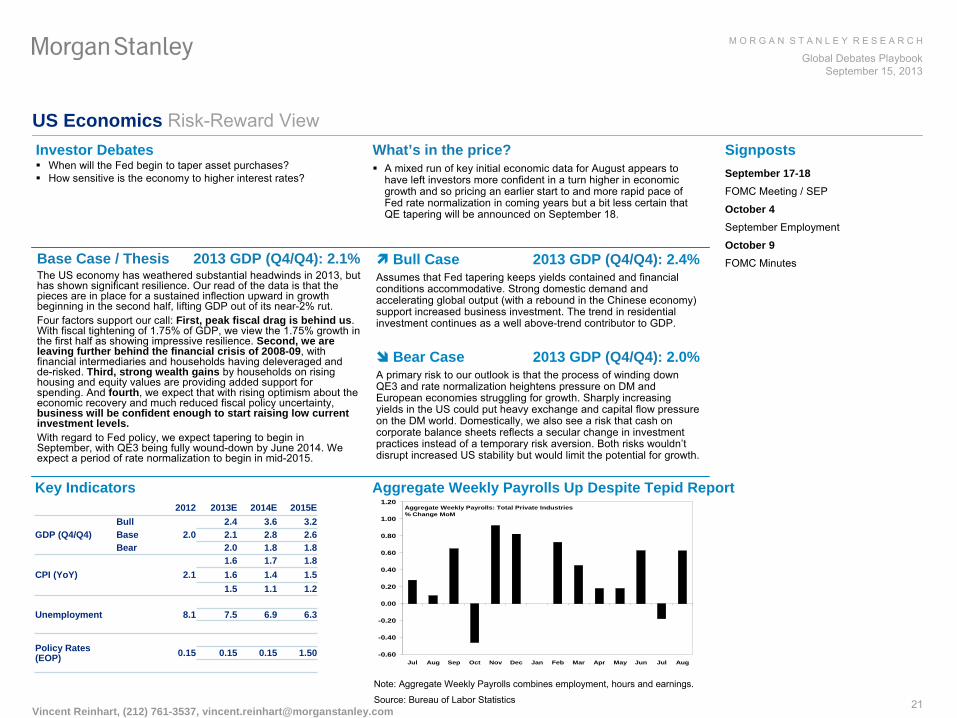
US Economics Risk-Reward ViewInvestor Debates
When will the Fed begin to taper asset purchases?
How sensitive is the economy to higher interest rates?
What’s in the price?
A mixed run of key initial economic data for August appears to have left investors more confident in a turn higher in economic growth and so pricing an earlier start to and more rapid pace of
Fed rate normalization in coming years but a bit less certain that QE tapering will be announced on September 18.
SignpostsSeptember 17-18FOMC Meeting / SEP
October 4September Employment
October 9FOMC Minutes
Key Indicators Aggregate Weekly Payrolls Up Despite Tepid Report
Base Case / Thesis 2013 GDP (Q4/Q4): 2.1%The US economy has weathered substantial headwinds in 2013, but has shown significant resilience. Our read of the data is that the pieces are in place for a sustained inflection upward in growth beginning in the second half, lifting GDP out of its near-2% rut.Four factors support our call: First, peak fiscal drag is behind us. With fiscal tightening of 1.75% of GDP, we view the 1.75% growth
in the first half as showing impressive resilience. Second, we are leaving further behind the financial crisis of 2008-09, with financial intermediaries and households having deleveraged and de-risked. Third, strong wealth gains by households on rising housing and equity values are providing added support for spending. And fourth, we expect that with rising optimism about the economic recovery and much reduced fiscal policy uncertainty, business will be confident enough to start raising low current investment levels.With regard to Fed policy, we expect tapering to begin in September, with QE3 being fully wound-down by June 2014. We expect a period of rate normalization to begin in mid-2015.
Bull Case 2013 GDP (Q4/Q4): 2.4%Assumes that Fed tapering keeps yields contained and financial conditions accommodative. Strong domestic demand and accelerating global output (with a rebound in the Chinese economy) support increased business investment. The trend in residential investment continues as a well above-trend contributor to GDP.
Bear Case 2013 GDP (Q4/Q4): 2.0%A primary risk to our outlook is that the process of winding down QE3 and rate normalization heightens pressure on DM and European economies struggling for growth. Sharply increasing yields in the US could put heavy exchange and capital flow pressure on the DM world. Domestically, we also see a risk that cash on corporate balance sheets reflects a secular change in investment
practices instead of a temporary risk aversion. Both risks wouldn’t disrupt increased US stability but would limit the potential for
growth.
Note: Aggregate Weekly Payrolls combines employment, hours and earnings.
Source: Bureau of Labor StatisticsVincent Reinhart, (212) 761-3537, [email protected]
2012 2013E 2014E 2015E
GDP (Q4/Q4)Bull 2.4 3.6 3.2Base 2.0 2.1 2.8 2.6Bear 2.0 1.8 1.8
CPI (YoY)1.6 1.7 1.8
2.1 1.6 1.4 1.51.5 1.1 1.2
Unemployment 8.1 7.5 6.9 6.3
Policy Rates (EOP) 0.15 0.15 0.15 1.50
M O R G A N S T A N L E Y R E S E A R C H
Global Debates PlaybookSeptember 15, 2013
22
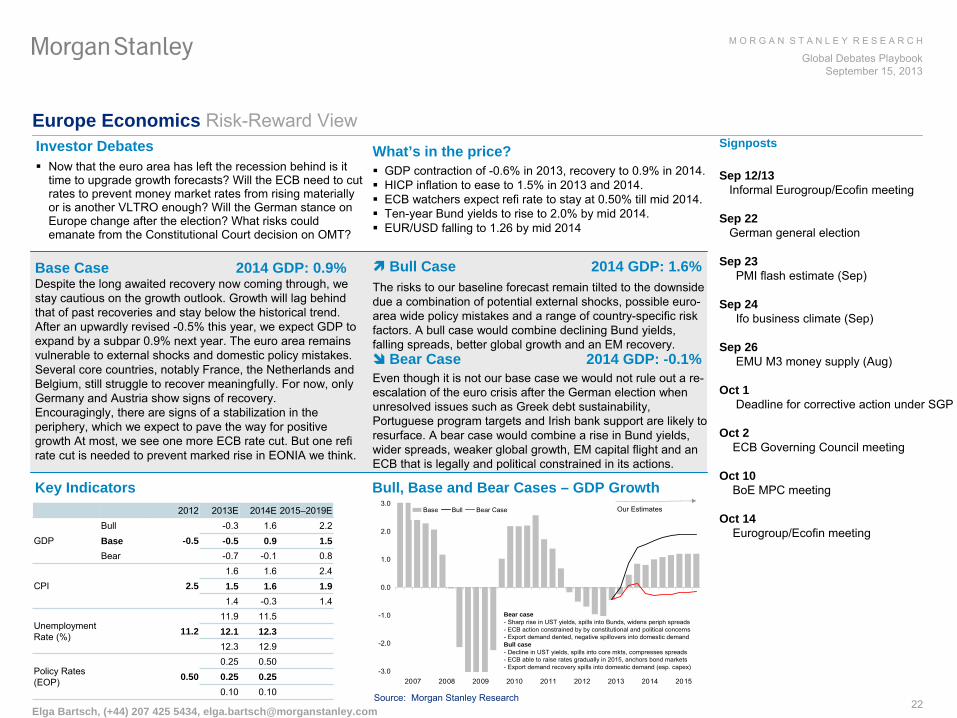
Europe Economics Risk-Reward ViewInvestor Debates
Now that the euro area has left the recession behind is it time to upgrade growth forecasts? Will the ECB need to cut rates to prevent money market rates from rising materially or is another VLTRO enough? Will the German stance on Europe change after the election? What risks could emanate from the Constitutional Court decision on OMT?
What’s in the price?
GDP contraction of -0.6% in 2013, recovery to 0.9% in 2014.
HICP inflation to ease to 1.5% in 2013 and 2014.
ECB watchers expect refi
rate to stay at 0.50% till mid 2014.
Ten-year Bund yields to rise to 2.0% by mid 2014.
EUR/USD falling to 1.26 by mid 2014
Signposts
Sep 12/13Informal Eurogroup/Ecofin
meeting
Sep 22German general election
Sep 23 PMI flash estimate (Sep)
Sep 24 Ifo
business climate (Sep)
Sep 26 EMU M3 money supply (Aug)
Oct 1Deadline for corrective action under SGP
Oct 2 ECB Governing Council meeting
Oct 10 BoE MPC meeting
Oct 14 Eurogroup/Ecofin
meeting
Elga Bartsch, (+44) 207 425 5434, [email protected]
Key Indicators Bull, Base and Bear Cases – GDP Growth
Base Case 2014 GDP: 0.9% Despite the long awaited recovery now coming through, we stay cautious on the growth outlook. Growth will lag behind that of past recoveries and stay below the historical trend. After an upwardly revised -0.5% this year, we expect GDP to expand by a subpar 0.9% next year. The euro area remains vulnerable to external shocks and domestic policy mistakes. Several core countries, notably France, the Netherlands and Belgium, still struggle to recover meaningfully. For now, only Germany and Austria show signs of recovery. Encouragingly, there are signs of a stabilization in the periphery, which we expect to pave the way for positive growth At most, we see one more ECB rate cut. But one refi
rate cut is needed to prevent marked rise in EONIA we think.
Bull Case 2014 GDP: 1.6%The risks to our baseline forecast remain tilted to the downside
due a combination of potential external shocks, possible euro-
area wide policy mistakes and a range of country-specific risk factors. A bull case would combine declining Bund yields, falling spreads, better global growth and an EM recovery.
Bear Case 2014 GDP: -0.1%Even though it is not our base case we would not rule out a re-
escalation of the euro crisis after the German election when unresolved issues such as Greek debt sustainability, Portuguese program targets and Irish bank support are likely to resurface. A bear case would combine a rise in Bund yields, wider spreads, weaker global growth, EM capital flight and an ECB that is legally and political constrained in its actions.
2012 2013E 2014E 2015–2019E
GDPBull
-0.5-0.3 1.6 2.2
Base -0.5 0.9 1.5Bear -0.7 -0.1 0.8
CPI 2.51.6 1.6 2.41.5 1.6 1.91.4 -0.3 1.4
Unemployment Rate (%) 11.2
11.9 11.512.1 12.312.3 12.9
Policy Rates (EOP) 0.50
0.25 0.500.25 0.250.10 0.10 Source: Morgan Stanley Research
-3.0
-2.0
-1.0
0.0
1.0
2.0
3.0
2007 2008 2009 2010 2011 2012 2013 2014 2015
Base Bull Bear Case Our Estimates
Bear case- Sharp rise in UST yields, spills into Bunds, widens periph spreads- ECB action constrained by by constitutional and political concerns- Export demand dented, negative spillovers into domestic demandBull case- Decline in UST yields, spills into core mkts, compresses spreads- ECB able to raise rates gradually in 2015, anchors bond markets- Export demand recovery spills into domestic demand (esp. capex)
M O R G A N S T A N L E Y R E S E A R C H
Global Debates PlaybookSeptember 15, 2013
23
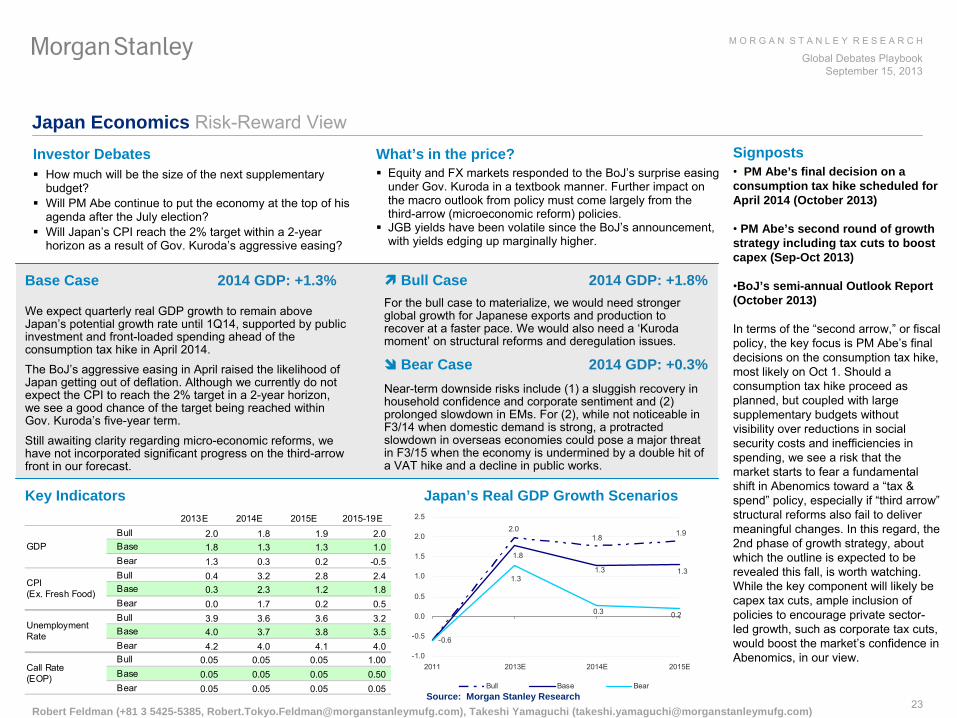
Japan Economics Risk-Reward View
Robert Feldman (+81 3 5425-5385, [email protected]), Takeshi Yamaguchi ([email protected])
Japan’s Real GDP Growth Scenarios
Investor Debates
How much will be the size of the next supplementary budget?
Will PM Abe continue to put the economy at the top of his agenda after the July election?
Will Japan’s CPI reach the 2% target within a 2-year horizon as a result of Gov. Kuroda’s aggressive easing?
What’s in the price?
Equity and FX markets responded to the BoJ’s
surprise easing under Gov. Kuroda in a textbook manner. Further impact on the macro outlook from policy must come largely from the third-arrow (microeconomic reform) policies.
JGB yields have been volatile since the BoJ’s
announcement, with yields edging up marginally higher.
Signposts•
PM Abe’s final decision on a consumption tax hike scheduled for April 2014 (October 2013)
•
PM Abe’s second round of growth strategy including tax cuts to boost capex (Sep-Oct 2013)
•BoJ’s semi-annual Outlook Report (October 2013)
In terms of the “second arrow,”
or fiscal policy, the key focus is PM Abe’s final decisions on the consumption tax hike, most likely on Oct 1. Should a consumption tax hike proceed as planned, but coupled with large supplementary budgets without visibility over reductions in social security costs and inefficiencies in spending, we see a risk that the market starts to fear a fundamental shift in Abenomics
toward a “tax & spend”
policy, especially if “third arrow”
structural reforms also fail to deliver meaningful changes. In this regard, the 2nd phase of growth strategy, about which the outline is expected to be revealed this fall, is worth watching. While the key component will likely be capex
tax cuts, ample inclusion of policies to encourage private sector-
led growth, such as corporate tax cuts, would boost the market’s confidence in Abenomics, in our view.
Key Indicators
Base Case 2014 GDP: +1.3%
We expect quarterly real GDP growth to remain above Japan’s potential growth rate until 1Q14, supported by public investment and front-loaded spending ahead of the consumption tax hike in April 2014. The BoJ’s
aggressive easing in April raised the likelihood of Japan getting out of deflation. Although we currently do not expect the CPI to reach the 2% target in a 2-year horizon, we see a good chance of the target being reached within Gov. Kuroda’s five-year term.
Still awaiting clarity regarding micro-economic reforms, we have not incorporated significant progress on the third-arrow front in our forecast.
Bull Case 2014 GDP: +1.8%For the bull case to materialize, we would need stronger global growth for Japanese exports and production to recover at a faster pace. We would also need a ‘Kuroda moment’
on structural reforms and deregulation issues.
Bear Case 2014 GDP: +0.3%Near-term downside risks include (1) a sluggish recovery in household confidence and corporate sentiment and (2) prolonged slowdown in EMs. For (2), while not noticeable in F3/14 when domestic demand is strong, a protracted slowdown in overseas economies could pose a major threat in F3/15 when the economy is undermined by a double hit of a VAT hike and a decline in public works.
2013E 2014E 2015E 2015-19EBull 2.0 1.8 1.9 2.0Base 1.8 1.3 1.3 1.0Bear 1.3 0.3 0.2 -0.5Bull 0.4 3.2 2.8 2.4Base 0.3 2.3 1.2 1.8Bear 0.0 1.7 0.2 0.5Bull 3.9 3.6 3.6 3.2Base 4.0 3.7 3.8 3.5Bear 4.2 4.0 4.1 4.0Bull 0.05 0.05 0.05 1.00Base 0.05 0.05 0.05 0.50Bear 0.05 0.05 0.05 0.05
GDP
CPI(Ex. Fresh Food)
UnemploymentRate
Call Rate(EOP)
-0.6
2.01.8 1.9
1.8
1.31.31.3
0.20.3
-1.0
-0.5
0.0
0.5
1.0
1.5
2.0
2.5
2011 2013E 2014E 2015E
Bull Base BearSource: Morgan Stanley Research
M O R G A N S T A N L E Y R E S E A R C H
Global Debates PlaybookSeptember 15, 2013
24
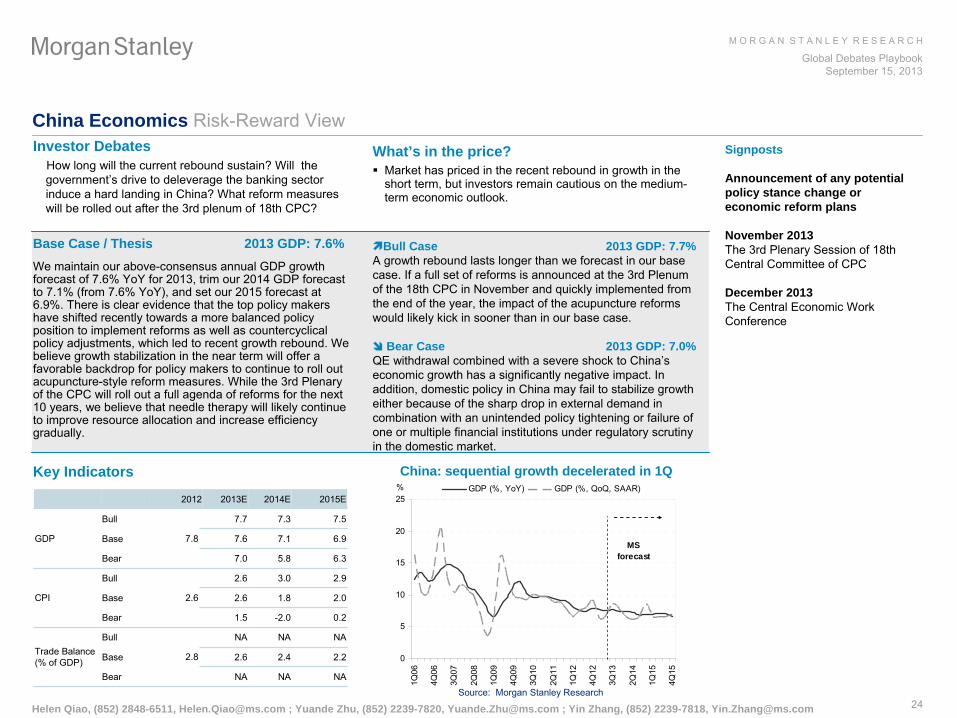
China Economics Risk-Reward ViewInvestor Debates
How long will the current rebound sustain? Will the government’s drive to deleverage the banking sector induce a hard landing in China? What reform measures will be rolled out after the 3rd plenum of 18th CPC?
What’s in the price?
Market has priced in the recent rebound in growth in the short term, but investors remain cautious on the medium-
term economic outlook.
Signposts
Announcement of any potential policy stance change or economic reform plans
November 2013The 3rd Plenary Session of 18th Central Committee of CPC
December 2013The Central Economic Work Conference
Key Indicators China: sequential growth decelerated in 1Q
Base Case / Thesis 2013 GDP: 7.6%We maintain our above-consensus annual GDP growth forecast of 7.6% YoY
for 2013, trim our 2014 GDP forecast to 7.1% (from 7.6% YoY), and set our 2015 forecast at 6.9%. There is clear evidence that the top policy makers have shifted recently towards a more balanced policy position to implement reforms as well as countercyclical policy adjustments, which led to recent growth rebound. We believe growth stabilization in the near term will offer a favorable backdrop for policy makers to continue to roll out acupuncture-style reform measures. While the 3rd Plenary of the CPC will roll out a full agenda of reforms for the next 10 years, we believe that needle therapy will likely continue to improve resource allocation and increase efficiency gradually.
Bull Case 2013 GDP: 7.7%A growth rebound lasts longer than we forecast in our base case. If a full set of reforms is announced at the 3rd Plenum of the 18th CPC in November and quickly implemented from the end of the year, the impact of the acupuncture reforms would likely kick in sooner than in our base case.
Bear Case 2013 GDP: 7.0%QE withdrawal combined with a severe shock to China’s economic growth has a significantly negative impact.
In addition, domestic policy in China may fail to stabilize growth either because of the sharp drop in external demand in combination with an unintended policy tightening or failure of one or multiple financial institutions under regulatory scrutiny
in the domestic market.
Source: Morgan Stanley Research
Helen Qiao, (852) 2848-6511, [email protected] ; Yuande Zhu, (852) 2239-7820, [email protected] ; Yin Zhang, (852) 2239-7818, [email protected]
2012 2013E 2014E 2015E
GDP
Bull
7.8
7.7 7.3 7.5
Base 7.6 7.1 6.9
Bear 7.0 5.8 6.3
CPI
Bull
2.6
2.6 3.0 2.9
Base 2.6 1.8 2.0
Bear 1.5 -2.0 0.2
Trade Balance
(% of GDP)
Bull
2.8
NA NA NA
Base 2.6 2.4 2.2
Bear NA NA NA
0
5
10
15
20
25
1Q06
4Q06
3Q07
2Q08
1Q09
4Q09
3Q10
2Q11
1Q12
4Q12
3Q13
2Q14
1Q15
4Q15
GDP (%, YoY) GDP (%, QoQ, SAAR)%
MS forecast
M O R G A N S T A N L E Y R E S E A R C H
Global Debates PlaybookSeptember 15, 2013
25
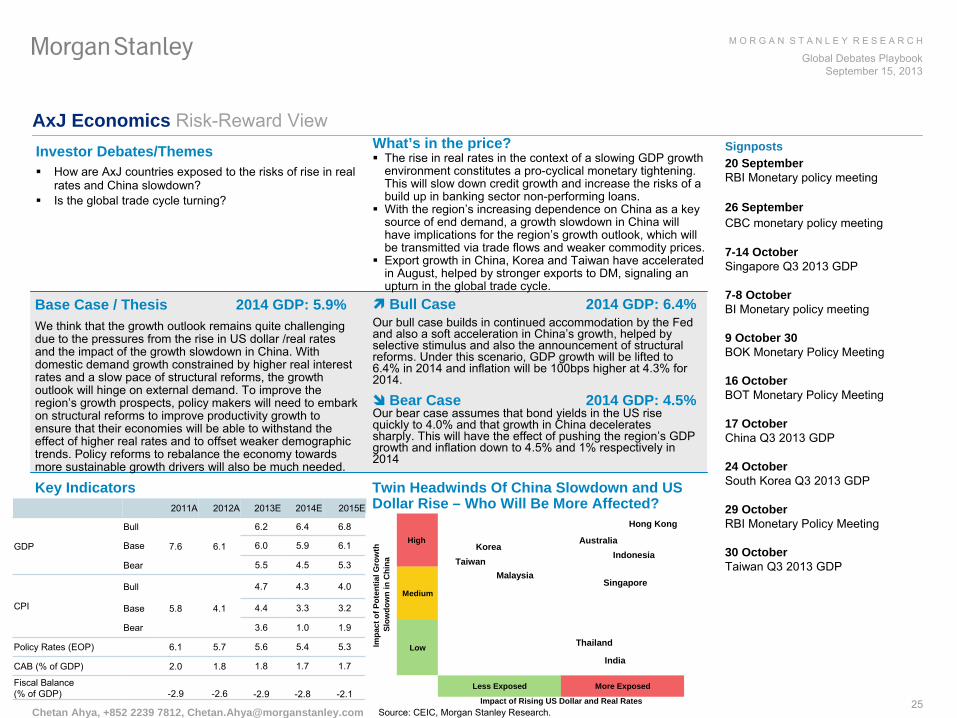
AxJ Economics Risk-Reward ViewInvestor Debates/Themes
How are AxJ
countries exposed to the risks of rise in real rates and China slowdown?
Is the global trade cycle turning?
What’s in the price?
The rise in real rates in the context of a slowing GDP growth environment constitutes a pro-cyclical monetary tightening. This will slow down credit growth and increase the risks of a build up in banking sector non-performing loans.
With the region’s increasing dependence on China as a key source of end demand, a growth slowdown in China will have implications for the region’s growth outlook, which will be transmitted via trade flows and weaker commodity prices.
Export growth in China, Korea and Taiwan have accelerated in August, helped by stronger exports to DM, signaling an upturn in the global trade cycle.
Chetan Ahya, +852 2239 7812, [email protected]
Key Indicators
Base Case / Thesis 2014 GDP: 5.9%We think that the growth outlook remains quite challenging due to the pressures from the rise in US dollar /real rates and the impact of the growth slowdown in China. With domestic demand growth constrained by higher real interest rates and a slow pace of structural reforms, the growth outlook will hinge on external demand. To improve the region’s growth prospects, policy makers will need to embark on structural reforms to improve productivity growth to ensure that their economies will be able to withstand the effect of higher real rates and to offset weaker demographic trends. Policy reforms to rebalance the economy towards more sustainable growth drivers will also be much needed.
Bull Case 2014 GDP: 6.4%Our bull case builds in continued accommodation by the Fed and also a soft acceleration in China’s growth, helped by selective stimulus and also the announcement of structural reforms. Under this scenario, GDP growth will be lifted to 6.4% in 2014 and inflation will be 100bps higher at 4.3% for 2014.
Bear Case 2014 GDP: 4.5%Our bear case assumes that bond yields in the US rise quickly to 4.0% and that growth in China decelerates sharply. This will have the effect of pushing the region’s GDP growth and inflation down to 4.5% and 1% respectively in 2014
2011A 2012A 2013E 2014E 2015E
GDP
Bull
7.6 6.1
6.2 6.4 6.8
Base 6.0 5.9 6.1
Bear 5.5 4.5 5.3
CPI
Bull 4.7 4.3 4.0
Base 5.8 4.1 4.4 3.3 3.2
Bear 3.6 1.0 1.9
Policy Rates (EOP) 6.1 5.7 5.6 5.4 5.3
CAB (% of GDP) 2.0 1.8 1.8 1.7 1.7
Fiscal Balance (% of GDP) -2.9 -2.6 -2.9 -2.8 -2.1
Source: CEIC, Morgan Stanley Research.
Signposts20 SeptemberRBI Monetary policy meeting
26 SeptemberCBC monetary policy meeting
7-14 OctoberSingapore Q3 2013 GDP
7-8 OctoberBI Monetary policy meeting
9 October 30BOK Monetary Policy Meeting
16 OctoberBOT Monetary Policy Meeting
17 OctoberChina Q3 2013 GDP
24 October South Korea Q3 2013 GDP
29 OctoberRBI Monetary Policy Meeting
30 OctoberTaiwan Q3 2013 GDP
Twin Headwinds Of China Slowdown and US Dollar Rise – Who Will Be More Affected?
High
Medium
Low
Less Exposed More Exposed
Impa
ct o
f Pot
entia
l Gro
wth
Sl
owdo
wn
in C
hina
Impact of Rising US Dollar and Real Rates
KoreaTaiwan
AustraliaIndonesia
Singapore
Thailand
India
Hong Kong
Malaysia
High
Medium
Low
Less Exposed More Exposed
Impa
ct o
f Pot
entia
l Gro
wth
Sl
owdo
wn
in C
hina
Impact of Rising US Dollar and Real Rates
KoreaTaiwan
AustraliaIndonesia
Singapore
Thailand
India
Hong Kong
Malaysia
M O R G A N S T A N L E Y R E S E A R C H
Global Debates PlaybookSeptember 15, 2013
26
Brazil / Latam Economics Risk-Reward ViewInvestor Debates
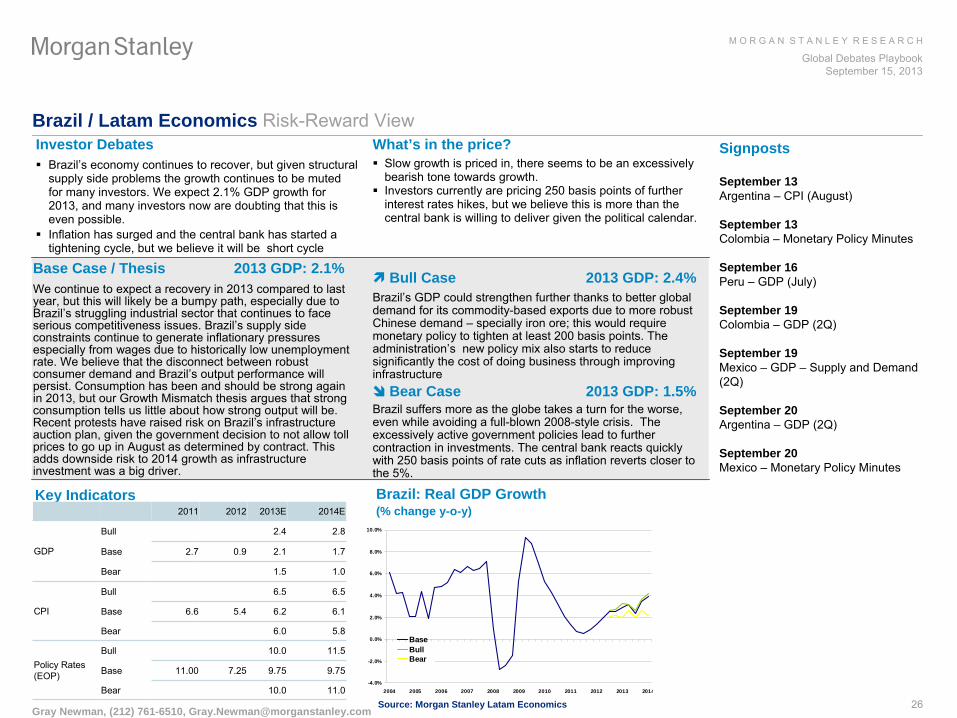
Brazil’s economy continues to recover, but given structural supply side problems the growth continues to be muted for many investors. We expect 2.1% GDP growth for 2013, and many investors now are doubting that this is even possible.
Inflation has surged and the central bank has started a tightening cycle, but we believe it will be short cycle
What’s in the price?
Slow growth is priced in, there seems to be an excessively bearish tone towards growth.
Investors currently are pricing 250 basis points of further interest rates hikes, but we believe this is more than the central bank is willing to deliver given the political calendar.
Signposts
September 13Argentina –
CPI (August)
September 13Colombia –
Monetary Policy Minutes
September 16Peru –
GDP (July)
September 19Colombia –
GDP (2Q)
September 19Mexico –
GDP –
Supply and Demand (2Q)
September 20Argentina –
GDP (2Q)
September 20Mexico –
Monetary Policy Minutes
Gray Newman, (212) 761-6510, [email protected]
Key Indicators Brazil: Real GDP Growth(% change y-o-y)
Base Case / Thesis 2013 GDP: 2.1%We continue to expect a recovery in 2013 compared to last year, but this will likely be a bumpy path, especially due to Brazil’s struggling industrial sector that continues to face serious competitiveness issues. Brazil’s supply side constraints continue to generate inflationary pressures especially from wages due to historically low unemployment rate. We believe that the disconnect between robust consumer demand and Brazil’s output performance will persist. Consumption has been and should be strong again in 2013, but our Growth Mismatch thesis argues that strong consumption tells us little about how strong output will be. Recent protests have raised risk on Brazil’s infrastructure auction plan, given the government decision to not allow toll prices to go up in August as determined by contract. This adds downside risk to 2014 growth as infrastructure investment was a big driver.
Bull Case 2013 GDP: 2.4%Brazil’s GDP could strengthen further thanks to better global demand for its commodity-based exports due to more robust Chinese demand –
specially iron ore; this would require monetary policy to tighten at least 200 basis points. The administration’s new policy mix also starts to reduce significantly the cost of doing business through improving infrastructure
Bear Case 2013 GDP: 1.5%Brazil suffers more as the globe takes a turn for the worse, even while avoiding a full-blown 2008-style crisis. The excessively active government policies lead to further contraction in investments. The central bank reacts quickly with 250 basis points of rate cuts as inflation reverts closer to the 5%.
Source: Morgan Stanley Latam Economics
2011 2012 2013E 2014E
GDP
Bull 2.4 2.8
Base 2.7 0.9 2.1 1.7
Bear 1.5 1.0
CPI
Bull 6.5 6.5
Base 6.6 5.4 6.2 6.1
Bear 6.0 5.8
Policy Rates (EOP)
Bull 10.0 11.5
Base 11.00 7.25 9.75 9.75
Bear 10.0 11.0-4.0%
-2.0%
0.0%
2.0%
4.0%
6.0%
8.0%
10.0%
2004 2005 2006 2007 2008 2009 2010 2011 2012 2013 2014
BaseBullBear
M O R G A N S T A N L E Y R E S E A R C H
Global Debates PlaybookSeptember 15, 2013
27
India Economics Risk-Reward View
Chetan Ahya, +852 2239 7812, [email protected]
Key Indicators India’s Real GDP Growth – Bull-, Base- and Bear-case Scenarios
E = Morgan Stanley Research estimates; Source: Morgan Stanley Research
Investor Debates/Themes
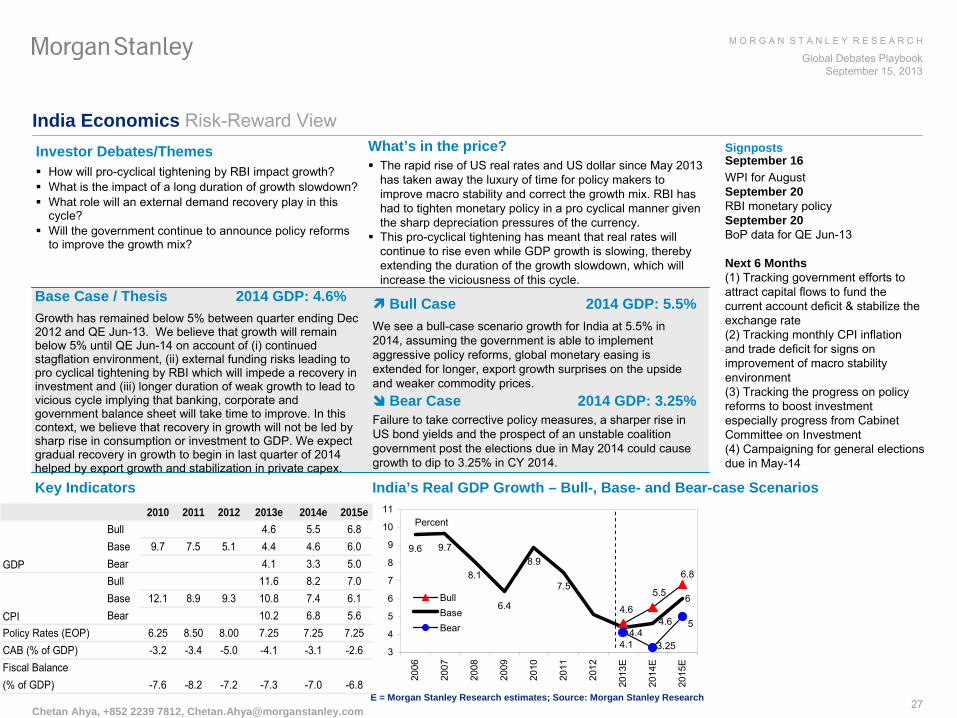
How will pro-cyclical tightening by RBI impact growth?
What is the impact of a long duration of growth slowdown?
What role will an external demand recovery play in this cycle?
Will the government continue to announce policy reforms to improve the growth mix?
What’s in the price?
The rapid rise of US real rates and US dollar since May 2013 has taken away the luxury of time for policy makers to improve macro stability and correct the growth mix. RBI has had to tighten monetary policy in a pro cyclical manner given the sharp depreciation pressures of the currency.
This pro-cyclical tightening has meant that real rates will continue to rise even while GDP growth is slowing, thereby extending the duration of the growth slowdown, which will increase the viciousness of this cycle.
Base Case / Thesis 2014 GDP: 4.6%Growth has remained below 5% between quarter ending Dec 2012 and QE Jun-13. We believe that growth will remain below 5% until QE Jun-14 on account of (i) continued stagflation environment, (ii) external funding risks leading to pro cyclical tightening by RBI which will impede a recovery in investment and (iii) longer duration of weak growth to lead to vicious cycle implying that banking, corporate and government balance sheet will take time to improve. In this context, we believe that recovery in growth will not be led by sharp rise in consumption or investment to GDP. We expect gradual recovery in growth to begin in last quarter of 2014 helped by export growth and stabilization in private capex.
Bull Case 2014 GDP: 5.5%We see a bull-case scenario growth for India at 5.5% in 2014, assuming the government is able to implement aggressive policy reforms, global monetary easing is extended for longer, export growth surprises on the upside and weaker commodity prices.
Bear Case 2014 GDP: 3.25%Failure to take corrective policy measures, a sharper rise in US bond yields and the prospect of an unstable coalition government post the elections due in May 2014 could cause growth to dip to 3.25% in CY 2014.
2010 2011 2012 2013e 2014e 2015eBull 4.6 5.5 6.8Base 9.7 7.5 5.1 4.4 4.6 6.0Bear 4.1 3.3 5.0Bull 11.6 8.2 7.0Base 12.1 8.9 9.3 10.8 7.4 6.1Bear 10.2 6.8 5.6
Policy Rates (EOP) 6.25 8.50 8.00 7.25 7.25 7.25CAB (% of GDP) -3.2 -3.4 -5.0 -4.1 -3.1 -2.6Fiscal Balance(% of GDP) -7.6 -8.2 -7.2 -7.3 -7.0 -6.8
GDP
CPI
9.6 9.7
8.1
6.4
8.9
7.5
4.6
5.5
6.8
4.44.6
6
4.1 3.25
5
3
4
5
6
7
8
9
10
11
2006
2007
2008
2009
2010
2011
2012
2013
E
2014
E
2015
E
BullBaseBear
Percent
Signposts September 16WPI for AugustSeptember 20RBI monetary policySeptember 20BoP
data for QE Jun-13
Next 6 Months (1) Tracking government efforts to attract capital flows to fund the current account deficit & stabilize the exchange rate(2) Tracking monthly CPI inflation and trade deficit for signs on improvement of macro stability environment (3) Tracking the progress on policy reforms to boost investment especially progress from Cabinet Committee on Investment(4) Campaigning for general elections due in May-14

M O R G A N S T A N L E Y R E S E A R C H
Global Debates PlaybookSeptember 15, 2013
28
Russia Economics Risk-Reward ViewInvestor Debates
Continued slowdown, stabilisation
or pickup?
Is inflation falling and will the CBR ease?
Will the authorities deliver promised structural reforms?
Is a reversal of political liberalisation
underway?
What’s in the price?
The government has downgraded its 2013 growth forecast from 3.6% to 2.4%, while consensus sees GDP growth at
2.3%Y. We see growth slowing to 2.2%Y from 3.4%Y in 2012, largely due to an investment slowdown.
Signposts2013-
CBR rate cut in 2013,- Rosneft
integration of TNK-BP,- execution of privatisation
deals;-
progress on improving Russia's ranking on the World Bank's ease of doing business index;- pension reform- anti-corruption campaign.
Jacob Nell, (7495) 287 2134, [email protected]; Alina Slyusarchuk, (44) 20 7677-6869, [email protected]
Key Indicators Investment Slowdown the Driver of Growth Disappointment
Base Case / Thesis 2013 GDP: 2.2%We revise growth down from 2.9%Y to 2.2%Y in 2013 and from 3.4%Y to 3.1%Y in 2014, largely due to weak investment. With a better harvest, and some investment recovery, supported by monetary easing, we think that Russian growth troughed in 2Q13 and will now pick up. Falling inflation opens the way for easier monetary policy. Still, we think that Governor Nabiullina
will err on the side of caution and pare the scale of the easing cycle from our previous forecast of 100bp to 75bp, which would take the policy rate (repo auction rate) to 4.75%. As a result of revenue weakness, we revise down our 2013 forecast for the fiscal balance from a 0.8% of GDP surplus to a 0.4% of GDP deficit, but tight expenditure control, high oil prices and fiscal policy room temper our concern.
Bull Case 2013 GDP: 2.9%We see investment as the key variable. Strong implementation of the reform agenda, leading to pickup in investment in line with the target 25% of GDP by 2015, would raise growth to 4%, and reduced capital outflows could drive the RUB up.
Bear Case 2013 GDP: 1.5%
In the bear case, with investment stagnant, growth could slow below 2%Y.
Source: Rosstat, Morgan Stanley Research
2011 2012 2013E 2014E
GDP
Bull
4.3
2.9 3.8
Base 3.4 2.2 3.1
Bear 1.5 1.5
CPI, avg
Bull
8.5
7.0 6.0
Base 5.1 6.5 4.9
Bear 6.0 4.5
Policy Rate
Bull
5.25
5.50 5.50
Base 5.50 5.00 4.75
Bear 4.75 4.75
-5
0
5
10
15
20
Jan 11 Jul 11 Jan 12 Jul 12 Jan 13 Jul 13
Industrial output Fixed investmentTransport Construction
3mma Y%
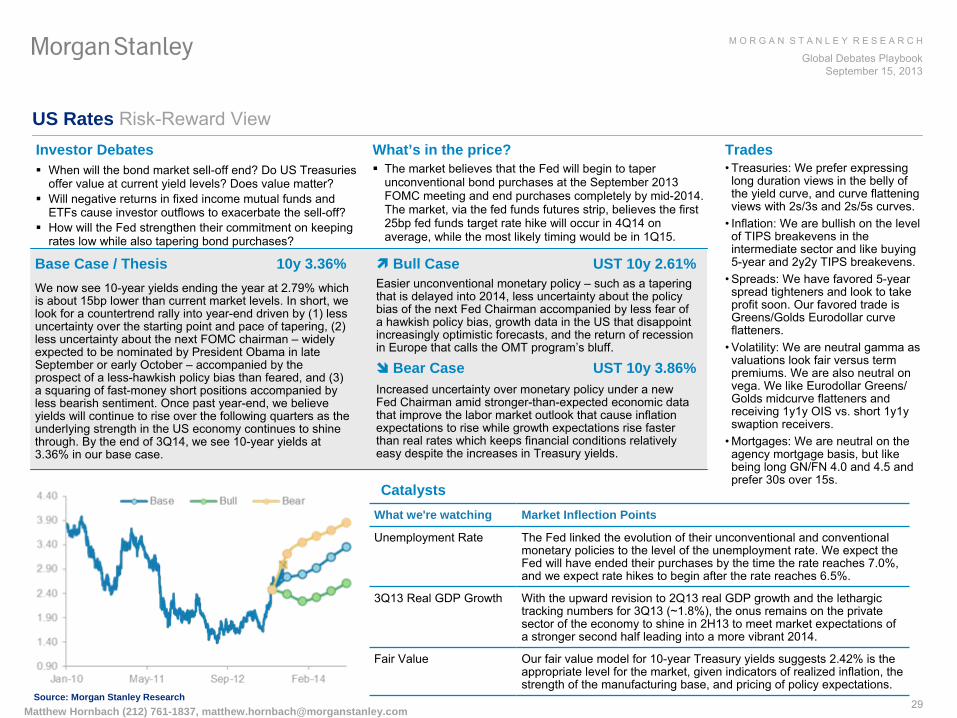
M O R G A N S T A N L E Y R E S E A R C H
Global Debates PlaybookSeptember 15, 2013
29
US Rates Risk-Reward ViewInvestor Debates
When will the bond market sell-off end? Do US Treasuries offer value at current yield levels? Does value matter?
Will negative returns in fixed income mutual funds and ETFs
cause investor outflows to exacerbate the sell-off?
How will the Fed strengthen their commitment on keeping rates low while also tapering bond purchases?
What’s in the price?
The market believes that the Fed will begin to taper unconventional bond purchases at the September 2013 FOMC meeting and end purchases completely by mid-2014. The market, via the fed funds futures strip, believes the first 25bp fed funds target rate hike will occur in 4Q14 on average, while the most likely timing would be in 1Q15.
Trades•
Treasuries: We prefer expressing long duration views in the belly of the yield curve, and curve flattening views with 2s/3s and 2s/5s curves.
•
Inflation: We are bullish on the level of TIPS breakevens in the intermediate sector and like buying 5-year and 2y2y TIPS breakevens.
•
Spreads: We have favored 5-year spread tighteners
and look to take profit soon. Our favored trade is Greens/Golds
Eurodollar curve flatteners.
•
Volatility: We are neutral gamma as valuations look fair versus term premiums. We are also neutral on vega. We like Eurodollar Greens/ Golds
midcurve
flatteners and receiving 1y1y OIS vs. short 1y1y swaption
receivers.•
Mortgages: We are neutral on the agency mortgage basis, but like being long GN/FN 4.0 and 4.5 and prefer 30s over 15s.
Catalysts
Base Case / Thesis 10y 3.36%We now see 10-year yields ending the year at 2.79% which is about 15bp lower than current market levels. In short, we look for a countertrend rally into year-end driven by (1) less uncertainty over the starting point and pace of tapering, (2) less uncertainty about the next FOMC chairman –
widely expected to be nominated by President Obama in late September or early October –
accompanied by the prospect of a less-hawkish policy bias than feared, and (3) a squaring of fast-money short positions accompanied by less bearish sentiment. Once past year-end, we believe yields will continue to rise over the following quarters as the underlying strength in the US economy continues to shine through. By the end of 3Q14, we see 10-year yields at 3.36% in our base case.
Bull Case UST 10y 2.61%Easier unconventional monetary policy –
such as a tapering that is delayed into 2014, less uncertainty about the policy bias of the next Fed Chairman accompanied by less fear of a hawkish policy bias, growth data in the US that disappoint increasingly optimistic forecasts, and the return of recession in Europe that calls the OMT program’s bluff.
Bear Case UST 10y 3.86%Increased uncertainty over monetary policy under a new Fed Chairman amid stronger-than-expected economic data that improve the labor market outlook that cause inflation expectations to rise while growth expectations rise faster than real rates which keeps financial conditions relatively easy despite the increases in Treasury yields.
What we're watching Market Inflection Points
Unemployment Rate The Fed linked the evolution of their unconventional and conventional monetary policies to the level of the unemployment rate. We expect the Fed will have ended their purchases by the time the rate reaches
7.0%, and we expect rate hikes to begin after the rate reaches 6.5%.
3Q13 Real GDP Growth With the upward revision to 2Q13 real GDP growth and the lethargic tracking numbers for 3Q13 (~1.8%), the onus remains on the private sector of the economy to shine in 2H13 to meet market expectations of a stronger second half leading into a more vibrant 2014.
Fair Value Our fair value model for 10-year Treasury yields suggests 2.42% is the appropriate level for the market, given indicators of realized inflation, the strength of the manufacturing base, and pricing of policy expectations.
Source: Morgan Stanley ResearchMatthew Hornbach (212) 761-1837, [email protected]
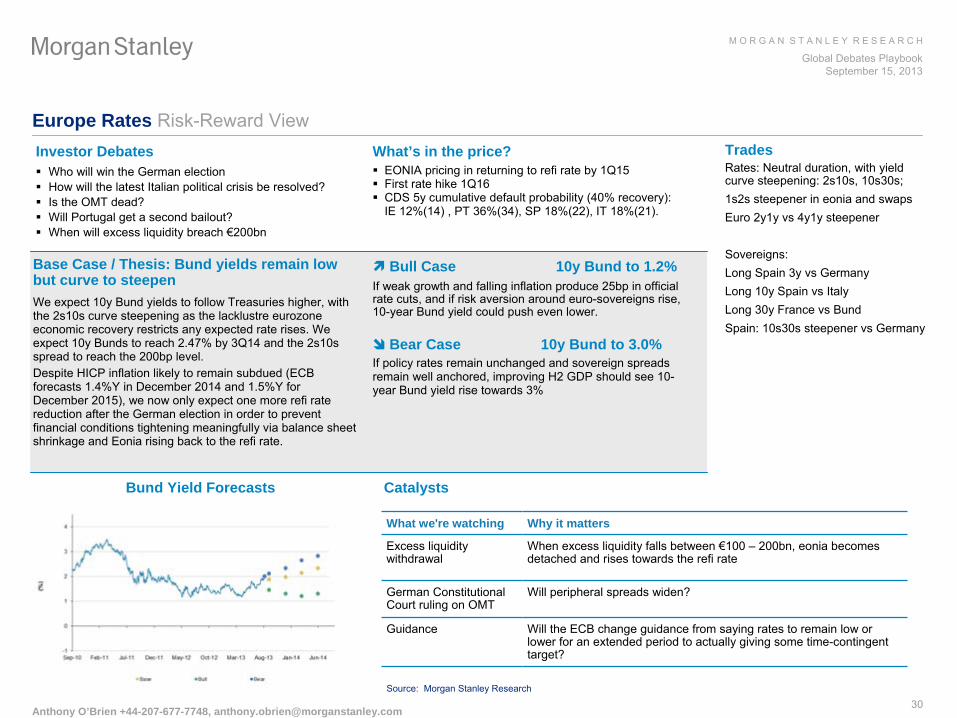
M O R G A N S T A N L E Y R E S E A R C H
Global Debates PlaybookSeptember 15, 2013
30
Europe Rates Risk-Reward ViewInvestor Debates
Who will win the German election
How will the latest Italian political crisis be resolved?
Is the OMT dead?
Will Portugal get a second bailout?
When will excess liquidity breach €200bn
What’s in the price?
EONIA pricing in returning to refi
rate by 1Q15
First rate hike 1Q16
CDS 5y cumulative default probability (40% recovery): IE 12%(14) , PT 36%(34), SP 18%(22), IT 18%(21).
TradesRates: Neutral duration, with yield curve steepening: 2s10s, 10s30s; 1s2s steepener
in eonia
and swapsEuro 2y1y vs
4y1y steepener
Sovereigns: Long Spain 3y vs
GermanyLong 10y Spain vs
ItalyLong 30y France vs
BundSpain: 10s30s steepener
vs
Germany
Bund Yield Forecasts Catalysts
Base Case / Thesis: Bund yields remain low but curve to steepenWe expect 10y Bund yields to follow Treasuries higher, with the 2s10s curve steepening as the lacklustre eurozone
economic recovery restricts any expected rate rises. We expect 10y Bunds to reach 2.47% by 3Q14 and the 2s10s spread to reach the 200bp level.Despite HICP inflation likely to remain subdued (ECB forecasts 1.4%Y in December 2014 and 1.5%Y for December 2015), we now only expect one more refi
rate reduction after the German election in order to prevent financial conditions tightening meaningfully via balance sheet shrinkage and Eonia
rising back to the refi
rate.
Bull Case 10y Bund to 1.2%If weak growth and falling inflation produce 25bp in official rate cuts, and if risk aversion around euro-sovereigns rise, 10-year Bund yield could push even lower.
Bear Case 10y Bund to 3.0%If policy rates remain unchanged and sovereign spreads remain well anchored, improving H2 GDP should see 10-
year Bund yield rise towards 3%
What we're watching Why it matters
Excess liquidity withdrawal
When excess liquidity falls between €100 –
200bn, eonia
becomes detached and rises towards the refi
rate
German Constitutional Court ruling on OMT
Will peripheral spreads widen?
Guidance Will the ECB change guidance from saying rates to remain low or lower for an extended period to actually giving some time-contingent target?
Source: Morgan Stanley Research
Anthony O’Brien +44-207-677-7748, [email protected]

M O R G A N S T A N L E Y R E S E A R C H
Global Debates PlaybookSeptember 15, 2013
31
Japan Rates Risk-Reward ViewInvestor Debates
When will inflation show signs of picking up?
When will market participants start to see credible evidence of structural reforms and other growth-promoting policies? When will economic indicators show signs of a sustainable recovery?
What’s in the price?
The JGB curve is currently almost unchanged from a year earlier when the Nikkei 225 was below 9,000 and the 10y UST yield was below 1.7%. This shows virtually no expectation that the BOJ will achieve its 2% inflation target or the "third arrow of Abenomics" will prove successful.
Trades•
JGBs: we continue to recommend shorting the synthetic 10y-forward 20y yield via a cash-neutral vis-à-vis a 10s30s steepener. The trade has been trading sideway during the past several months even when overall yield level was falling. We believe the trade is a highly effective way to prepare for a significant upside surprise in inflation numbers (and a potential re-pricing of the curve to reflect a higher possibility that inflation target will be reached sooner than expected.
•
Spreads: We continue to like buying 20y ASW against 10y and 30y.
•
Volatility: we like buying receivors
in the belly of the curve (e.g. 5y5y) while selling receivors
with tenors in the super-long sector (e.g. 5y20y); such trades have very attractive roll-
down and would benefit from further steepening of the curve and/or flattening of the volatility curve
Catalysts
Base Case / Thesis JGB 10y 1.1%We forecast the 10-year JGB at 1.1% by 3Q2014.
We have lowered our JGB yield forecasts by 10bp as we see low volatility and thus lower risk premium ahead due to BoJ’s
massive purchase program. We now expect the 10y JGB yield to reach 1.1% by 3Q2014. However, with our economists having slightly upgraded economic forecasts, our general view remains intact; we expect a gradual shift to higher long-term JGB yields consistent with a gradual economic recovery. As before, however, we see a risk of JGB yields rising significantly further than under our baseline scenario. Indeed, recent market developments suggest that this risk may be building.
Bull Case JGB 10y 0.85%Market would question the effectiveness of BoJ’s
policy action if macroeconomic conditions fail to improve. Long-
term yields would fall in this case as the likelihood of the BoJ
staying on hold much longer than expected rises.
Bear Case JGB 10y 1.35%CPI overshoots expectation, showing inflation targeting by the BoJ
might actually work. PM Abe’s growth strategy, beginning with the so-called “third arrow”
policies, progresses better than expected. Structural reform and deregulation are key to long-term growth. If successful, the bond market would see a significant sell-off in the 10y sector of the curve.
What we're watching Market Inflection Points
Inflation We particularly keep a watchful eye on inflation data. A strong positive surprise would imply a higher likelihood that the BoJ’s
reflation
strategy will work and would send yields much higher and vice versa.
Progress of economic reform and consumption tax hike
There are positive signs on the economic front; both inflation and growth data have surprised to the surprise. On the other hand, PM Abe’s final decisions on consumption tax hike might be also a risk. If the hike is delayed, there is a significant risk that markets will price much higher fiscal premiums into the super-long sector, causing the curve to bear-
steepen aggressively
Source: Morgan Stanley ResearchLe Ngoc Nhan 81 0(3) 5424-7698, [email protected]
0.40
0.60
0.80
1.00
1.20
1.40
Apr-11 Oct-11 Apr-12 Oct-12 Apr-13 Oct-13 Apr-14
main case bull case bear case
%

M O R G A N S T A N L E Y R E S E A R C H
Global Debates PlaybookSeptember 15, 2013
32
UK Rates Risk-Reward ViewInvestor Debates
When will unemployment hit 7%?
Is the UK recovery sustainable, or will it be derailed by higher yields?
If yields continue to rise, will the MPC ‘strengthen’
guidance with QE or stronger rhetoric?
What’s in the price?
Rates on hold until end of year
First rate hike in Q1 15
QE expectation: total spend of £375bn (i.e. unch)
TradesDuration: Short bias via steepeners
and x-market Curve: UKT 2s5s steepener, UKT 5s10s flattenersAsset Swaps: Long UKT 4y vs
SONIACross Currency: Pay GBP 2y1y vs
EuroVol: Long GBP 2y into 1y
Anthony O’Brien +44-207-677-7748, [email protected]
UKT 10y Yield Forecasts Catalysts
Base Case Thesis – Economy grows at 1.4% in 2013 and 2.4% in 2014. Guidance remains in place and Bank Rate rises in Q2 15. •
Incoming data makes us more confident on the recovery story and specifically leads us to upgrade our yield forecasts We expect UKT 10y yields to climb to 3.05% by year-end and up to 3.70% at the end of 3Q14, underperforming Bunds by 30bp.
Although we do not believe the unemployment knock-out will be triggered, we expect the MPC to raise Bank Rate in Q2 15 as they become more concerned about inflation.
Bull Case – Europe sovereign debt crisis resurfaces, UK economy slows. This would most likely be triggered by a re-emergence of systemic sovereign stress in the euro periphery, depressing the UK economy, with UKT 10y gilts following Bunds lower to a low of 2%.
Bear Case –UK growth strengthens, inflation rises and unemployment falls to 7%The composite PMIs
are consistent with 3Q13 growth closer to 1.5%. If productivity does not rise as much as we expect, the 7% unemployment threshold could be triggered sooner than expected. In this scenario, we would expect 10y yields to rise to 3.35% by year-end and above 4% in the next 12 months.
What we're watching Why it matters
Q3 GDP
Sept MPC Minutes
Unemployment data
The PMIs
are pointing to >1%
How comfortable are members with rising yields? Are they justified by the economic recovery?
As the economy recovers, does unemployment rate fall quickly or will productivity gains or increase in the participation rate slow the decline?
Source: Morgan Stanley Research
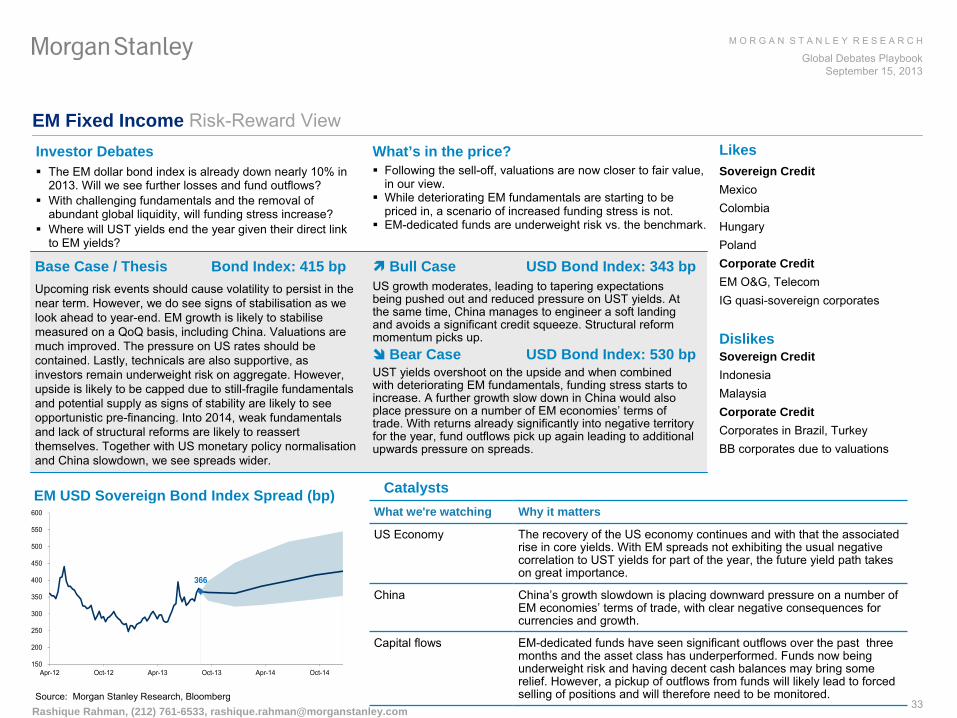
M O R G A N S T A N L E Y R E S E A R C H
Global Debates PlaybookSeptember 15, 2013
33
EM Fixed Income Risk-Reward ViewInvestor Debates
The EM dollar bond index is already down nearly 10% in 2013. Will we see further losses and fund outflows?
With challenging fundamentals and the removal of abundant global liquidity, will funding stress increase?
Where will UST yields end the year given their direct link to EM yields?
What’s in the price?
Following the sell-off, valuations are now closer to fair value, in our view.
While deteriorating EM fundamentals are starting to be priced in, a scenario of increased funding stress is not.
EM-dedicated funds are underweight risk vs. the benchmark.
LikesSovereign CreditMexicoColombiaHungaryPolandCorporate CreditEM O&G, Telecom IG quasi-sovereign corporates
DislikesSovereign CreditIndonesiaMalaysiaCorporate CreditCorporates
in Brazil, TurkeyBB corporates
due to valuations
Catalysts
Base Case / Thesis Bond Index: 415 bpUpcoming risk events should cause volatility to persist in the near term. However, we do see signs of stabilisation as we look ahead to year-end. EM growth is likely to stabilise measured on a QoQ
basis, including China. Valuations are much improved. The pressure on US rates should be contained. Lastly, technicals
are also supportive, as investors remain underweight risk on aggregate. However, upside is likely to be capped due to still-fragile fundamentals and potential supply as signs of stability are likely to see opportunistic pre-financing. Into 2014, weak fundamentals and lack of structural reforms are likely to reassert themselves. Together with US monetary policy normalisation
and China slowdown, we see spreads wider.
Bull Case USD Bond Index: 343 bpUS growth moderates, leading to tapering expectations being pushed out and reduced pressure on UST yields. At the same time, China manages to engineer a soft landing and avoids a significant credit squeeze. Structural reform momentum picks up.
Bear Case USD Bond Index: 530 bpUST yields overshoot on the upside and when combined with deteriorating EM fundamentals, funding stress starts to increase. A further growth slow down in China would also place pressure on a number of EM economies’
terms of trade. With returns already significantly into negative territory for the year, fund outflows pick up again leading to additional upwards pressure on spreads.
What we're watching Why it matters
US Economy The recovery of the US economy continues and with that the associated rise in core yields. With EM spreads not exhibiting the usual negative correlation to UST yields for part of the year, the future yield
path takes on great importance.
China China’s growth slowdown is placing downward pressure on a number of EM economies’
terms of trade, with clear negative consequences for currencies and growth.
Capital flows EM-dedicated funds have seen significant outflows over the past three months and the asset class has underperformed. Funds now being underweight risk and having decent cash balances may bring some relief. However, a pickup of outflows from funds will likely lead to forced selling of positions and will therefore need to be monitored. Source: Morgan Stanley Research, Bloomberg
EM USD Sovereign Bond Index Spread (bp)
Rashique Rahman, (212) 761-6533, [email protected]
366
150
200
250
300
350
400
450
500
550
600
Apr-12 Oct-12 Apr-13 Oct-13 Apr-14 Oct-14
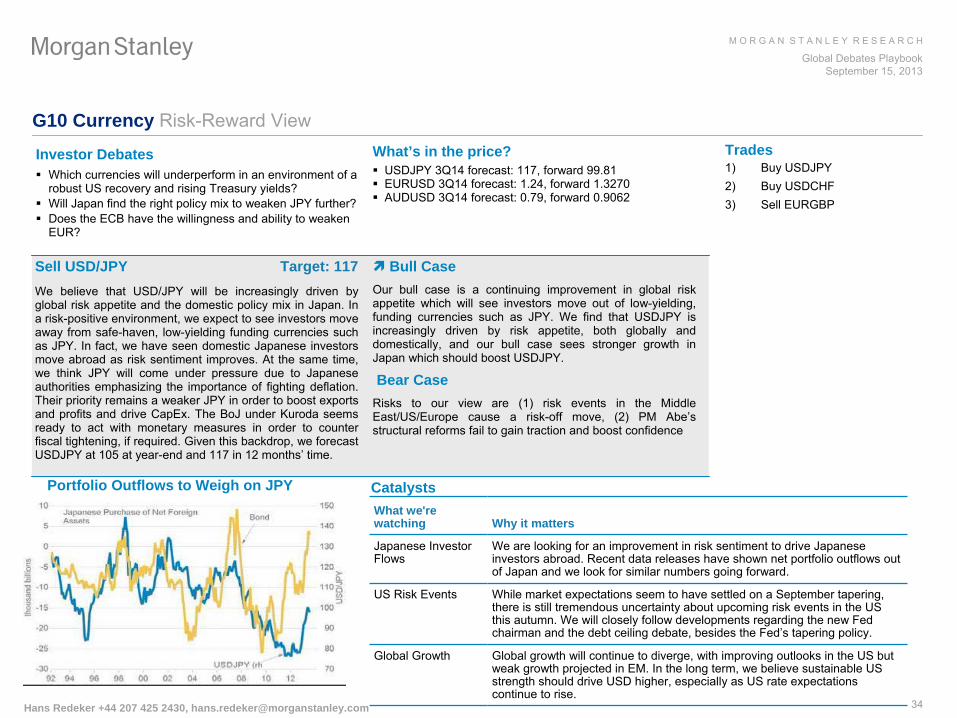
M O R G A N S T A N L E Y R E S E A R C H
Global Debates PlaybookSeptember 15, 2013
34
G10 Currency Risk-Reward View
Investor Debates
Which currencies will underperform in an environment of a robust US recovery and rising Treasury yields?
Will Japan find the right policy mix to weaken JPY further?
Does the ECB have the willingness and ability to weaken EUR?
What’s in the price?
USDJPY 3Q14 forecast: 117, forward 99.81
EURUSD 3Q14 forecast: 1.24, forward 1.3270
AUDUSD 3Q14 forecast: 0.79, forward 0.9062
Trades1)
Buy USDJPY2)
Buy USDCHF3)
Sell EURGBP
Hans Redeker +44 207 425 2430, [email protected]
Portfolio Outflows to Weigh on JPY Catalysts
Sell USD/JPY Target: 117We believe that USD/JPY will be increasingly driven by
global risk appetite and the domestic policy mix in Japan. In a risk-positive environment, we expect to see investors move away from safe-haven, low-yielding funding currencies such as JPY. In fact, we have seen domestic Japanese investors move abroad as risk sentiment improves. At the same time, we think JPY will come under pressure due to Japanese authorities emphasizing the importance of fighting deflation. Their priority remains a weaker JPY in order to boost exports and profits and drive CapEx. The BoJ
under Kuroda seems ready to act with monetary measures in order to counter fiscal tightening, if required. Given this backdrop, we forecast
USDJPY at 105 at year-end and 117 in 12 months’
time.
Bull CaseOur bull case is a continuing improvement in global risk appetite which will see investors move out of low-yielding, funding currencies such as JPY. We find that USDJPY is increasingly driven by risk appetite, both globally and domestically, and our bull case sees stronger growth in
Japan which should boost USDJPY.
Bear CaseRisks to our view are (1) risk events in the Middle East/US/Europe cause a risk-off move, (2) PM Abe’s structural reforms fail to gain traction and boost confidence
What we're watching Why it matters
Japanese Investor Flows
We are looking for an improvement in risk sentiment to drive Japanese investors abroad. Recent data releases have shown net portfolio outflows out of Japan and we look for similar numbers going forward.
US Risk Events While market expectations seem to have settled on a September tapering, there is still tremendous uncertainty about upcoming risk events
in the US this autumn. We will closely follow developments regarding the new Fed chairman and the debt ceiling debate, besides the Fed’s tapering policy.
Global Growth Global growth will continue to diverge, with improving outlooks in the US but weak growth projected in EM. In the long term, we believe sustainable US strength should drive USD higher, especially as US rate expectations continue to rise.

M O R G A N S T A N L E Y R E S E A R C H
Global Debates PlaybookSeptember 15, 2013
35
EM Currency Risk-Reward ViewInvestor Debates
How important is the QE tapering debate?
How much has positioning been reduced on EMFX?
Will EM growth show signs of improvement in 1H14?
How aggressive (where applicable) can EM central banks be in preventing currency depreciation?
Will USD/CNY continue to head lower?
What’s in the price?
EM currencies have more decisively priced in the weak fundamental position of EM economies and the risks surrounding QE tapering. While those with strong fundamentals (MXN, RUB) have scope to rally in 4Q13 based on better valuations and more stability in US rates, the ‘Fragile Five’
should continue to adjust.
TradesBuy PLN/CZKBuy INR/TRY
Catalysts
Base Case / Thesis 1.4% depreciationEmerging markets have endured the bulk of globaladjustment versus USD in recent months, with a high degreeof volatility. However, this has only brought the spotlight ontoa process of adjustment in EMFX that has been on-going foraround two years. We believe this adjustment will continue, although after a more stable 4Q13 in the context of higher vol-
adjusted carry and a marginal improvement of EM fundamentals on the back of stronger DM growth feeding through to EM. In 2014, we expect this adjustment to take centre-stage once again, but anticipate the need for greater differentiation, specifically between those undergoing structural supply-side reforms to boost competitiveness, and those with external vulnerabilities (BRL, IDR, INR, TRY, ZAR).
Bull Case 5.0% appreciationAny signs of a more robust global recovery in 4Q13 would help offset concerns surrounding the tapering of QE, as the currency negative impact of potential outflows from the bond market would be mitigated by inflows related to growing exports and/or the equity market.
Bear Case 3.3% depreciationA more immediate deterioration in growth in China will impact EM currencies significantly, as terms of trade for EM economies weaken more quickly and growth fails to accelerate.
EM Export Momentum Has FallenFX reserves change over May and June
Source: Morgan Stanley Research, BloombergRashique Rahman, (212) 761-6533, [email protected]
What we're watching Why it matters
Signs of Growth Improvement in EM
The catalyst to the recent sell-off across EM currencies was the start of the debate surrounding QE tapering. However, the underlying driver of weakness has been poor EM fundamentals, and if we see signs of growth picking-up the QE debate will become less significant. We look at export momentum and PMIs
going forward.
Policy Response from China
China’s growth slowdown is placing downward pressure on a number of EM economies’
terms of trade, with clear negative consequences for currencies and growth. Some recent commentary from Chinese officials has prompted anticipation of possible future growth-stabilizing measures, but strong actions are still to be seen.
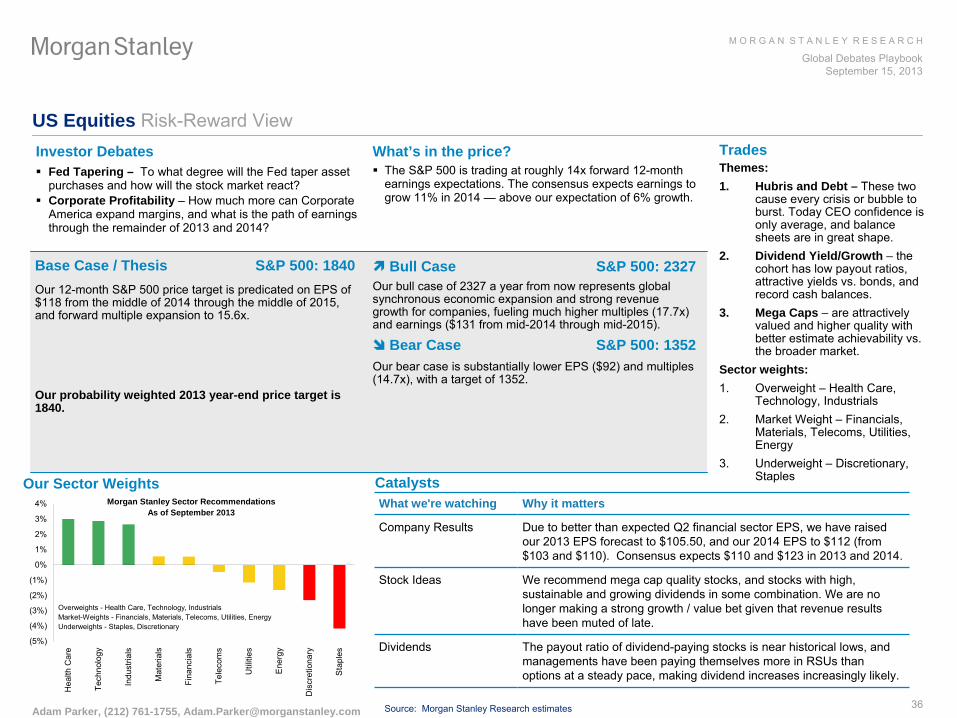
M O R G A N S T A N L E Y R E S E A R C H
Global Debates PlaybookSeptember 15, 2013
36
US Equities Risk-Reward ViewInvestor Debates
Fed Tapering – To what degree will the Fed taper asset purchases and how will the stock market react?
Corporate Profitability –
How much more can Corporate America expand margins, and what is the path of earnings through the remainder of 2013 and 2014?
What’s in the price?
The S&P 500 is trading at roughly 14x forward 12-month earnings expectations. The consensus expects earnings to grow 11% in 2014 —
above our expectation of 6% growth.
TradesThemes:1 . Hubris and Debt – These two
cause every crisis or bubble to burst. Today CEO confidence is only average, and balance sheets are in great shape.
2 . Dividend Yield/Growth – the cohort has low payout ratios, attractive yields vs. bonds, and record cash balances.
3 . Mega Caps –
are attractively valued and higher quality with better estimate achievability vs. the broader market.
Sector weights:1.
Overweight –
Health Care, Technology, Industrials
2.
Market Weight –
Financials, Materials, Telecoms, Utilities, Energy
3.
Underweight –
Discretionary, Staples
Adam Parker, (212) 761-1755, [email protected]
Our Sector Weights Catalysts
Base Case / Thesis S&P 500: 1840Our 12-month S&P 500 price target is predicated on EPS of $118 from the middle of 2014 through the middle of 2015, and forward multiple expansion to 15.6x.
Our probability weighted 2013 year-end price target is 1840.
Bull Case S&P 500: 2327Our bull case of 2327 a year from now represents global synchronous economic expansion and strong revenue growth for companies, fueling much higher multiples (17.7x) and earnings ($131 from mid-2014 through mid-2015).
Bear Case S&P 500: 1352Our bear case is substantially lower EPS ($92) and multiples (14.7x), with a target of 1352.
What we're watching Why it matters
Company Results Due to better than expected Q2 financial sector EPS, we have raised our 2013 EPS forecast to $105.50, and our 2014 EPS to $112 (from
$103 and $110). Consensus expects $110 and $123 in 2013 and 2014.
Stock Ideas We recommend mega cap quality stocks, and stocks with high, sustainable and growing dividends in some combination. We are no
longer making a strong growth / value bet given that revenue results have been muted of late.
Dividends The payout ratio of dividend-paying stocks is near historical lows, and managements have been paying themselves more in RSUs
than options at a steady pace, making dividend increases increasingly
likely.
Source: Morgan Stanley Research estimates
Morgan Stanley Sector Recommendations As of September 2013
(5%)
(4%)
(3%)
(2%)
(1%)
0%
1%
2%
3%
4%
Hea
lth C
are
Tech
nolo
gy
Indu
stria
ls
Mat
eria
ls
Fina
ncia
ls
Tele
com
s
Util
ities
Ene
rgy
Dis
cret
iona
ry
Sta
ples
Overweights - Health Care, Technology, IndustrialsMarket-Weights - Financials, Materials, Telecoms, Utilities, EnergyUnderweights - Staples, Discretionary

37
M O R G A N S T A N L E Y R E S E A R C H
Global Debates PlaybookSeptember 15, 2013
European Equities Risk-Reward ViewInvestor Debates
What is the impact of Fed tapering on European stocks?
Can equity inflows offset the negative impact of higher bond yields?
How strong will Europe’s EPS recovery be?
What is the right stance on Financials?
What’s in the price?
MSCI Europe is on a consensus 12m forward P/E of 12.6 compared to our base case assumption of 12.5. Consensus EPS growth is broadly in-line with our own top-
down forecast of 1% for this year. At +0.1SD our MTI is in the zone where equities have peaked over the last 3Y.
Inflection point in bond yields suggests EPS will take over from PE as driver for stocks
Catalysts
Base Case / Thesis MSCI Europe: 1380‘DM normalisation’
(8% upside). We assume DM economies continue their recovery (to moderate growth) while unconventional monetary policy fades and bond yields drift higher. No major re-escalation of the Euro-zone sovereign debt crisis. We forecast Europe’s EPS grows 1% in 2013, 9% in 2014 and 10% in 2015. We assume a consensus 12m PE for MSCI Europe of 12.5.
We probability weight our scenarios as: Bull case =20%; Base case = 60%; Bear case = 20%. Our probability weighted index target for MSCI Europe is 1350 (6% upside).
Bull Case MSCI Europe: 1654‘Goldilocks redux’
(30% upside). Global economy recovers at a moderate pace while central banks continue with aggressive unconventional policies and equities also see strong inflows. European EPS grows 3% in 2013 and 15% in 2014 and 2015. Europe’s 12m PE rises to 13.5 which is consistent with the peak multiple seen since 2003.
Bear Case MSCI Europe: 971‘Weaker EM growth or higher US rates’
(24% downside). Higher US bond yields and/or weaker EM growth could hurt European equities through a lower PE and/or disappointing EPS –
EM accounts for 1/3 of company revenues. Our economists’
bear case GDP forecasts imply EPS growth of -
1%, -5% and 0% for 2013-2015. We assume a consensus 12m PE of 11.
What we're watching Why it matters
QE and bond yields We believe that equity markets are tactically vulnerable as interest rates normalise and that QE tapering and higher bond yields are likely to weigh on stocks in the near-term.
Equity flows One potential offset to QE tapering and higher bond yields would
be a significant pick up in equity inflows that may support the PE ratio. Global investor
interest in Europe is picking up strongly.
EPS trends With Fed tapering limiting the potential for further PE expansion, the key driver of stocks in the medium-term is likely to be earnings. The recent improvement in Europe’s macro indicators imply that we are getting closer to the point where Europe’s EPS inflects up. Our margin lead indicator suggests margins will expand in 2014 for the first time in 3 years.
TradesSectors: O/W –
Banks, Insurance and Pharmaceuticals.U/W –
Consumer Staples, Industrials and Materials.
Themes: 1) Value over Growth.
2) OW European exposure.
3) OW European financials.
4) Stocks offering a combination of a good dividend yield with good DPS growth.
5) Taking profits in cyclicals.
Source: MSCI, Datastream, Morgan Stanley Research
0
5
10
15
20
25
30
79 81 83 84 86 88 89 91 93 94 96 98 99 01 03 04 06 08 09 11 130
20
40
60
80
100
120
140
MSCI Europe Trailing PE MSCI Europe EPS (RHS)
UST 10Y Yield
Graham Secker, +44-207-425-6188, [email protected]
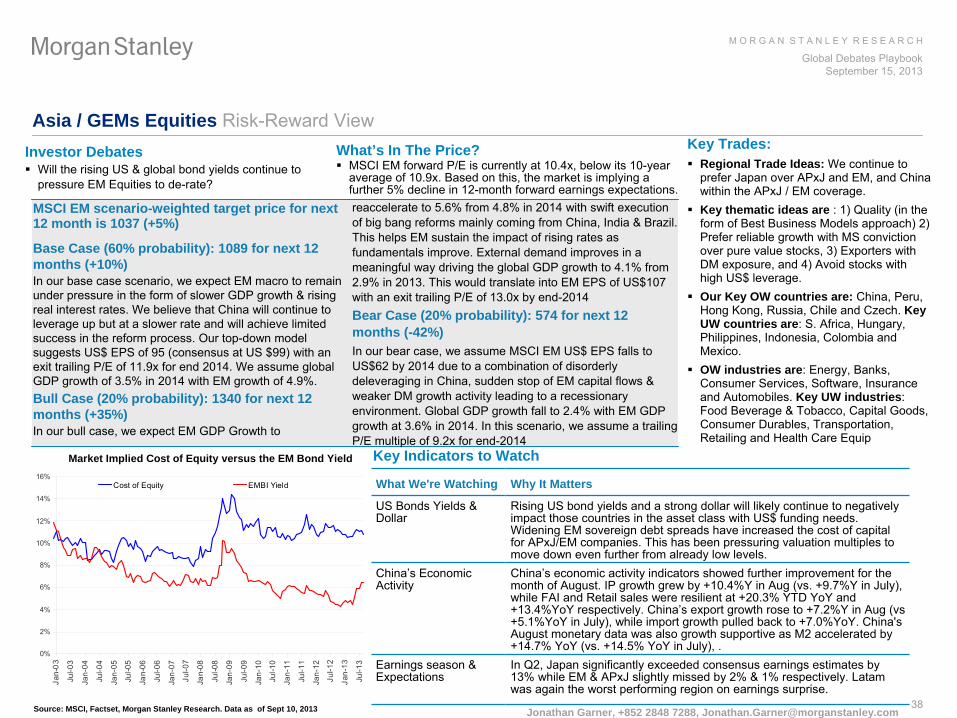
M O R G A N S T A N L E Y R E S E A R C H
Global Debates PlaybookSeptember 15, 2013
38
Asia / GEMs Equities Risk-Reward ViewInvestor Debates
Will the rising US & global bond yields continue to pressure EM Equities to de-rate?
What’s In The Price?
MSCI EM forward P/E is currently at 10.4x, below its 10-year average of 10.9x. Based on this, the market is implying a further 5% decline in 12-month forward earnings expectations.
Jonathan Garner, +852 2848 7288, [email protected]
Key Indicators to Watch
MSCI EM scenario-weighted target price for next 12 month is 1037 (+5%)
Base Case (60% probability): 1089 for next 12 months (+10%)In our base case scenario, we expect EM macro to remain under pressure in the form of slower GDP growth & rising real interest rates. We believe that China will continue to leverage up but at a slower rate and will achieve limited success in the reform process. Our top-down model suggests US$ EPS of 95 (consensus at US $99) with an exit trailing P/E of 11.9x for end 2014. We assume global GDP growth of 3.5% in 2014 with EM growth of 4.9%. Bull Case (20% probability): 1340 for next 12 months (+35%)In our bull case, we expect EM GDP Growth to
reaccelerate to 5.6% from 4.8% in 2014 with swift execution of big bang reforms mainly coming from China, India & Brazil. This helps EM sustain the impact of rising rates as fundamentals improve. External demand improves in a meaningful way driving the global GDP growth to 4.1% from 2.9% in 2013. This would translate into EM EPS of US$107 with an exit trailing P/E of 13.0x by end-2014Bear Case (20% probability): 574 for next 12 months (-42%)In our bear case, we assume MSCI EM US$ EPS falls to US$62 by 2014 due to a combination of disorderly deleveraging in China, sudden stop of EM capital flows & weaker DM growth activity leading to a recessionary environment. Global GDP growth fall to 2.4% with EM GDP growth at 3.6% in 2014. In this scenario, we assume a trailing P/E multiple of 9.2x for end-2014
What We're Watching Why It Matters
US Bonds Yields & Dollar
Rising US bond yields and a strong dollar will likely continue to negatively impact those countries in the asset class with US$ funding needs. Widening EM sovereign debt spreads have increased the cost of capital for APxJ/EM companies. This has been pressuring valuation multiples to move down even further from already low levels.
China’s Economic Activity
China’s economic activity indicators showed further improvement for the month of August. IP growth grew by +10.4%Y in Aug (vs. +9.7%Y in
July), while FAI and Retail sales were resilient at +20.3% YTD YoY
and +13.4%YoY respectively. China’s export growth rose to +7.2%Y in Aug (vs
+5.1%YoY in July), while import growth pulled back to +7.0%YoY. China's August monetary data was also growth supportive as M2 accelerated by +14.7% YoY
(vs. +14.5% YoY
in July), .Earnings season & Expectations
In Q2, Japan significantly exceeded consensus earnings estimates
by 13% while EM & APxJ
slightly missed by 2% & 1% respectively. Latam
was again the worst performing region on earnings surprise.
Market Implied Cost of Equity versus the EM Bond Yield
Source: MSCI, Factset, Morgan Stanley Research. Data as of Sept 10, 2013
Key Trades:
Regional Trade Ideas: We continue to prefer Japan over APxJ
and EM, and China within the APxJ
/ EM coverage.
Key thematic ideas are : 1) Quality (in the form of Best Business Models approach) 2) Prefer reliable growth with MS conviction over pure value stocks, 3) Exporters with DM exposure, and 4) Avoid stocks with high US$ leverage.
Our Key OW countries are: China, Peru, Hong Kong, Russia, Chile and Czech. Key UW countries are: S. Africa, Hungary, Philippines, Indonesia, Colombia and Mexico.
OW industries are: Energy, Banks, Consumer Services, Software, Insurance and Automobiles. Key UW industries: Food Beverage & Tobacco, Capital Goods, Consumer Durables, Transportation, Retailing and Health Care Equip
0%
2%
4%
6%
8%
10%
12%
14%
16%
Jan-
03
Jul-0
3
Jan-
04
Jul-0
4
Jan-
05
Jul-0
5
Jan-
06
Jul-0
6
Jan-
07
Jul-0
7
Jan-
08
Jul-0
8
Jan-
09
Jul-0
9
Jan-
10
Jul-1
0
Jan-
11
Jul-1
1
Jan-
12
Jul-1
2
Jan-
13
Jul-1
3
Cost of Equity EMBI Yield

M O R G A N S T A N L E Y R E S E A R C H
Global Debates PlaybookSeptember 15, 2013
39
175 (20%)141
130 (60%)
89 (20%)50
100
150
200
250
300
Jan-10 Jan-11 Jan-12 Jan-13 Jan-14
IG Spreads - Historical and Projected
Historical Spreads Current Spread Spread Base Case
(bp)
US Corporate Credit Risk-Reward ViewInvestor Debates
As the market inches closer to the beginning of the end of extraordinary central bank support, how should investors position and manage risk in a higher yield environment?
Will 2013 be another “beta”
year or will credit picking matter?
Can Financials continue to outperform Industrials?
What’s in the price?
Some stability in rates will enable the less liquid IG market to
find firmer footing, better clearing levels for bonds, and eventually tighter spreads.
Most investors seem to expect strong 2H growth and rising rates to serve as a continued headwind.
TradesModest Overweight IG, Equal-weight in HY –
We remain modestly overweight IG overall, and recommend looking at pockets of value, but still think risk reward is not as attractive in HY. Within IG, we are overweight the Financial, Basics, and Energy sectors.
Prefer the front-end in IG cash bonds –
Our preferred curve position remains the 3-7yr sector where attractive carry and rolldown
has kept it a well performing part of the market.
Long US vs. European Loans – EU loans have lower ratings, higher default rates, and a more challenging maturity wall relative to the US, even though valuations are similar.
Prefer CDS Longs to Cash Bonds –
We continue to recommend CDS to cash and avoiding the risk of higher rates and dollar prices.
Sivan Mahadevan (212) 761-1349, [email protected] . Adam Richmond (212) 761-1485, [email protected]
Modest Overweight in IG Catalysts
Base Case Modest OW for IG, EW for HYIG 130bp, HY 496bp (12m forecast). We are in a lower total return environment for credit, a simple reality dictated by tighter spreads and lower yields, in our view what you buy will be more important than if you buy. We maintain an overweight on US IG. Our models predict a tighter 12-month forecast for cash IG of 130bp and year-end forecast for CDX IG at 77bp. We think risk/reward is not overly attractive for US HY and forecast a total return of 4.7% for HY bonds for the next 12m period.In IG, we are overweight Financials, given the improving fundamental trend relative to non-financials. We expect more dispersion in performance in 2013 and the case for credit picking should get stronger as a low growth environment should differentiate winners from losers.
Bull Case Robust Growth ReturnsIG 89bp, HY 360bp. US economic growth and corporate earnings surprise to the upside. The new issue market is robust for most credits. Liquidity improves meaningfully as dealers and investors re-risk. Easier financial conditions, rising inflation expectations, and higher risk-free yields provide a better entry point into high quality credit, while low
defaults drive investors into HY.
Bear Case Mild US RecessionIG 175bp, HY 750bp. Global EM stresses continue to escalate and Financials deteriorate, pushing the US into a mild recession. Spreads widen materially (at or above 2002 wides) as investors demand more compensation for volatility and deteriorating fundamentals. HY defaults rise to 5.5%, but remain below prior recessions due to strong fundamentals.
Source: Morgan Stanley estimates, Yieldbook
What we're watching Why it matters Duration and Rates Within IG credit, the longer the duration, the weaker the duration-adjusted
returns have been. We have noted that a sharp move higher in yields was the biggest risk to IG and HY credit given the performance asymmetry and liquidity dynamics. As such, Treasury yield stability is a necessary component for credit outperformance.
Corporate Credit Fundamentals
Even as flows and issuance remain a key driver of credit spreads
today, we expect fundamentals to matter more going forward. We have seen some deterioration across IG and HY although this deterioration has been decelerating..
Flows June saw spread widening with a significant rise in rates. Both
IG and HY experienced negative total and excess returns. We’re watching this as a catalyst for outflows as the Fed begins to unwind its purchases in coming months.
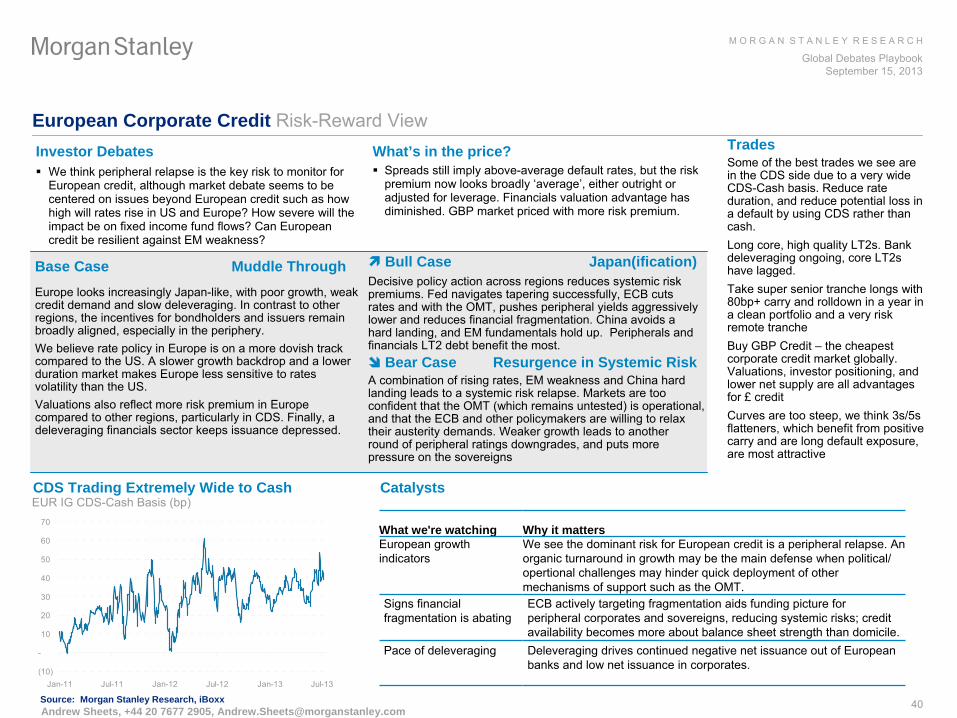
M O R G A N S T A N L E Y R E S E A R C H
Global Debates PlaybookSeptember 15, 2013
40
European Corporate Credit Risk-Reward ViewInvestor Debates
We think peripheral relapse is the key risk to monitor for European credit, although market debate seems to be centered on issues beyond European credit such as how high will rates rise in US and Europe? How severe will the impact be on fixed income fund flows? Can European credit be resilient against EM weakness?
What’s in the price?
Spreads still imply above-average default rates, but the risk premium now looks broadly ‘average’, either outright or adjusted for leverage. Financials valuation advantage has diminished. GBP market priced with more risk premium.
TradesSome of the best trades we see are in the CDS side due to a very wide CDS-Cash basis. Reduce rate duration, and reduce potential loss in a default by using CDS rather than
cash.Long core, high quality LT2s. Bank deleveraging ongoing, core LT2s have lagged.Take super senior tranche longs with 80bp+ carry and rolldown
in a year in a clean portfolio and a very risk remote trancheBuy GBP Credit –
the cheapest corporate credit market globally. Valuations, investor positioning, and lower net supply are all advantages for £
creditCurves are too steep, we think 3s/5s flatteners, which benefit from positive carry and are long default exposure, are most attractive
Andrew Sheets, +44 20 7677 2905, [email protected]
CDS Trading Extremely Wide to Cash Catalysts
Base Case Muddle ThroughEurope looks increasingly Japan-like, with poor growth, weak credit demand and slow deleveraging. In contrast to other regions, the incentives for bondholders and issuers remain broadly aligned, especially in the periphery. We believe rate policy in Europe is on a more dovish track compared to the US. A slower growth backdrop and a lower duration market makes Europe less sensitive to rates volatility than the US.Valuations also reflect more risk premium in Europe compared to other regions, particularly in CDS. Finally, a deleveraging financials sector keeps issuance depressed.
Bull Case Japan(ification)Decisive policy action across regions reduces systemic risk premiums. Fed navigates tapering successfully, ECB cuts rates and with the OMT, pushes peripheral yields aggressively lower and reduces financial fragmentation. China avoids a hard landing, and EM fundamentals hold up. Peripherals and financials LT2 debt benefit the most.
Bear Case Resurgence in Systemic RiskA combination of rising rates, EM weakness and China hard landing leads to a systemic risk relapse. Markets are too confident that the OMT (which remains untested) is operational, and that the ECB and other policymakers are willing to relax their austerity demands. Weaker growth leads to another round of peripheral ratings downgrades, and puts more pressure on the sovereigns
Source: Morgan Stanley Research, iBoxx
What we're watching Why it matters European growth indicators
We see the dominant risk for European credit is a peripheral relapse. An organic turnaround in growth may be the main defense
when political/ opertional
challenges may hinder quick deployment of other mechanisms of support such as the OMT.
Signs financial fragmentation is abating
ECB actively targeting fragmentation aids funding picture for peripheral corporates
and sovereigns, reducing systemic risks; credit availability becomes more about balance sheet strength than domicile.
Pace of deleveraging Deleveraging drives continued negative net issuance out of European banks and low net issuance in corporates.
EUR IG CDS-Cash Basis (bp)
(10)
-
10
20
30
40
50
60
70
Jan-11 Jul-11 Jan-12 Jul-12 Jan-13 Jul-13
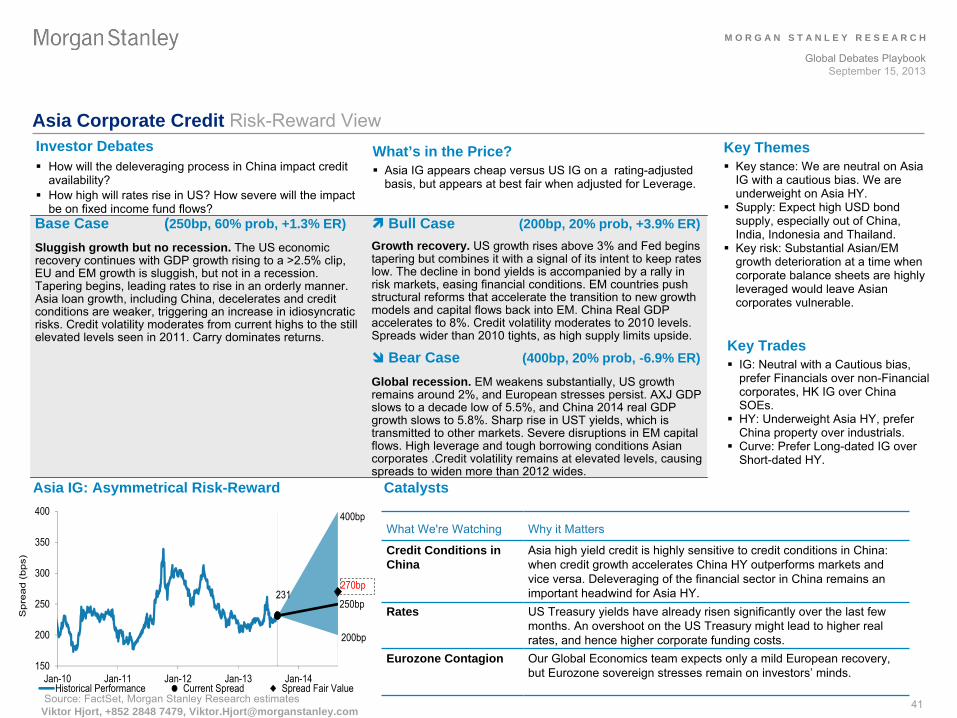
M O R G A N S T A N L E Y R E S E A R C H
Global Debates PlaybookSeptember 15, 2013
41
Asia Corporate Credit Risk-Reward ViewInvestor Debates
How will the deleveraging process in China impact credit availability?
How high will rates rise in US? How severe will the impact be on fixed income fund flows?
What’s in the Price?
Asia IG appears cheap versus US IG on a rating-adjusted basis, but appears at best fair when adjusted for Leverage.
Asia IG: Asymmetrical Risk-Reward Catalysts
Base Case (250bp, 60% prob, +1.3% ER)
Sluggish growth but no recession. The US economic recovery continues with GDP growth rising to a >2.5% clip, EU and EM growth is sluggish, but not in a recession. Tapering begins, leading rates to rise in an orderly manner. Asia loan growth, including China, decelerates and credit conditions are weaker, triggering an increase in idiosyncratic risks. Credit volatility moderates from current highs to the still elevated levels seen in 2011. Carry dominates returns.
Bull Case (200bp, 20% prob, +3.9% ER)Growth recovery. US growth rises above 3% and Fed begins tapering but combines it with a signal of its intent to keep rates low. The decline in bond yields is accompanied by a rally in risk markets, easing financial conditions. EM countries push structural reforms that accelerate the transition to new growth models and capital flows back into EM. China Real GDP accelerates to 8%. Credit volatility moderates to 2010 levels. Spreads wider than 2010 tights, as high supply limits upside.
Bear Case (400bp, 20% prob, -6.9% ER)
Global recession. EM weakens substantially, US growth remains around 2%, and European stresses persist. AXJ GDP slows to a decade low of 5.5%, and China 2014 real GDP growth slows to 5.8%. Sharp rise in UST yields, which is transmitted to other markets. Severe disruptions in EM capital flows. High leverage and tough borrowing conditions Asian corporates
.Credit volatility remains at elevated levels, causing spreads to widen more than 2012 wides.
Source: FactSet, Morgan Stanley Research estimates
What We're Watching Why it Matters
Credit Conditions in China
Asia high yield credit is highly sensitive to credit conditions in China: when credit growth accelerates China HY outperforms markets and vice versa. Deleveraging of the financial sector in China remains an important headwind for Asia HY.
Rates US Treasury yields have already risen significantly over the last few months. An overshoot on the US Treasury might lead to higher real rates, and hence higher corporate funding costs.
Eurozone Contagion Our Global Economics team expects only a mild European recovery,
but Eurozone
sovereign stresses remain on investors’
minds.
Key Themes
Key stance: We are neutral on Asia IG with a cautious bias. We are underweight on Asia HY.
Supply: Expect high USD bond supply, especially out of China, India, Indonesia and Thailand.
Key risk: Substantial Asian/EM growth deterioration at a time when corporate balance sheets are highly leveraged would leave Asian corporates
vulnerable.
Key Trades
IG: Neutral with a Cautious bias, prefer Financials over non-Financial corporates, HK IG over China SOEs.
HY: Underweight Asia HY, prefer China property over industrials.
Curve: Prefer Long-dated IG over Short-dated HY.
Viktor Hjort, +852 2848 7479, [email protected]
231
150
200
250
300
350
400
Jan-10 Jan-11 Jan-12 Jan-13 Jan-14
Sp
rea
d (
bp
s)
Historical Performance Current Spread Spread Fair Value
400bp
250bp
200bp
270bp

M O R G A N S T A N L E Y R E S E A R C H
Global Debates PlaybookSeptember 15, 2013
42
Securitized Credit Risk-Reward ViewInvestor Debates
Effect of rising rates on relative value between fixed vs. floating
Effect of rising mortgage rates on housing recovery
Servicer behavior and the challenges from MSR transfers
Extent of fund outflows and the pace of deleveraging driven liquidations from band banks and GSEs, especially on legacy non-
agency RMBS
What’s in the price?
The market has still not begun to price in significantly higher VCPRs
and lower realized loss severities and therefore all the potential positive convexity benefits from a sustained housing recovery. We continue to believe that prices reflect worse economic outcomes than alternatives, and offer attractive positive convexity opportunity.
TradesRMBS: Long originally AAA tranches of Alt-A CollateralRMBS: Long Last Cash Flow tranches off aggressively modified Subprime PoolsCLO: Long CLO equityUS CMBS: Long legacy CMBS AM and AJ in cash and long CMBX6 BBB-
and BB European CMBS: Long senior and selective mezz
tranchesUK Non-Conforming RMBS: Mezz
tranches with pro-rata optionality
Vishwanath Tirupattur, (212) 761-1043, [email protected]
Mortgage Affordability Is Still High Catalysts
Base Case / ThesisWe believe there is a significant positive convexity opportunity
in the resi
credit space. We expect to see additional improvements in prepays and roll rates, which should have a meaningful impact in the form of incrementally lower defaults, even from our now lower base case estimates. In our view, legacy Alt-A deals have the most positive-convexity potential.
In CLOs, Higher rates, wider loan spreads and lower market liquidity for loans decrease the prospects for loan re-pricings, and by extension, loan prepayment rates in CLOs. This helps moderate the recent trend of declining weighted average spreads (WAS) in CLO portfolios, which is a positive for excess spread in completed CLO transactions and thus a positive for distributions to equity tranches in those deals. Slower prepayments have the negative effect of prolonging the remaining weighted average life (WAL) of amortizing debt tranches, particularly the senior tranches.
Bull CaseSignificant policy intervention dramatically expanding refi
opportunities for borrowers in the non-agency pools would make VCPRs
significantly higher than our base case sooner. In CLOs, CLO AAAs re-price to lower spreads as the sponsorship for the AAAs improves, thus re-pricing the entire capital structure.
Bear CaseAny macro event that causes a selloff in risk assets broadly would be a negative for the securitized credit space. For non-agency in particular, blanket principal forgiveness modifications for performing borrowers would add duration while removing potential
positive convexity of prepay increases. Loan re-pricings in leveraged loans reducing excess spread in recent vintage new issue transactions and the effect of the new FDIC rules on assessments reducing the potential sponsorship of CLO AAAs by US domestic banks are key risks for CLOs
Source: NAR, Morgan Stanley Research
What we're watching Why it matters
Mortgage Rates Even though the housing recovery is not significantly dented by the recent hikes in mortgage rates, a substantial change from the current levels could.
Potential for policy intervention
Mortgage credit conditions remain tight. Any policy action to expand or further constrain the credit box would be very meaningful for securitized products in general.
Loan Repricing
and Repayment Rates in Leveraged Loans
Changes in the loan prepayment rates and re-pricings can result in substantial changes in relative value across the capital structure in CLOs
100
120
140
160
180
200
220 Affordability Index
4.67% Mortgage Rate
5.5% Mortgage Rate
6.5% Mortgage Rate
low 93-03
high 93-03

M O R G A N S T A N L E Y R E S E A R C H
Global Debates PlaybookSeptember 15, 2013
43
Global Credit Derivatives Risk-Reward ViewInvestor Debates
What is the outlook for credit volatility going forward, given uncertainty in global CB policy?
Can CDS continue to outperform cash bonds?
Could credit curves steepen further? What could be the catalyst of curve flattening today?
What’s in the price?
Implied credit volatility across regions and indices spiked on headlines from the Fed and PBOC and is pricing in greater moves in the underlying indices going forward.
Credit curves have steepened recently, and forward spreads trade at multiples of worst case losses.
Trade IdeasOPTIONS:Sell Straddles to Lock-in Ranges: We think the implied-realized premium is large enough to motivate investors to consider short straddles to own ranges in CDX IG.
INDICES:Covered Shorts: Buying index protection and covering the short with the sale of an OTM payer/put is appealing today, and we advocate this idea in both the US IG and HY markets.
TRANCHES:Long Mezzanine Risk: We like owning mezzanine risk in IG indices to lever carry and roll-down in a low-vol
world.
Sivan Mahadevan, (212) 761-1349, [email protected]
Catalysts
Base Case / ThesisCDX IG 77bp. While it may feel like a higher volatility environment given rates gyrations, Fed tapering fears, and EM growth concerns, this has resulted in only a very modest rise in credit and equity volatility. While we are still living in a low vol
world, credit volatility is too expensive to buy after the recent modest spikes, and we favor monetizing volatility and consider more creative ways of hedging.Credit curves are too steep given the spread regime and we think the best opportunity for flatteners is in the front-end of CDX indices.We like junior mezzanine tranches in legacy indices for the spread and senior mezzanine tranches in new indices to cushion against dispersion and to lever carry and roll-down.
Bull Case Tighter spreads, lower volatility CDX IG 61bp. Second half growth surprises to the upside, particularly in the US and Europe. Rates find stability, allowing credit spreads to decline. Hedging flows remain light, as global growth scares abate in EM, and European sovereign risk remains at bay. The slow grind tighter is accompanied by a decline in global volatility.
Bear Case Recession, wider credit spreads, and higher volatilityCDX IG 82bp, The much anticipated rebound in global growth does not materialize, and greater than expected Fed tapering keeps risk premiums and volatility in corporate credit elevated.
Source: Morgan Stanley Research
What we're watching Why it matters
Credit Volatility The key debate on the volatility front is whether June was just a brief dislocation in an otherwise new low vol
regime, or if instead we are headed for a prolonged period of elevated volatility on the back
of economic and rates market uncertainty
Cash / CDS Basis The cash CDS basis is largely negative across the board today, given underperformance in the cash bond market. On the other hand, single name hedging could drive the basis more positive in certain names and sectors in a more idiosyncratic environment.
Index and Tranche Curves
Credit curves can move around a lot in times of stress, and the curve shape will be an important indicator for deciding the optimal maturity at which to implement directional (i.e., long/short) trades.
In the United States, portions of this report regarding non-US options are intended for Morgan Stanley’s Institutional Clients only.
Low Levels of Volatility in CDX IG and HY Make Entry Points Attractive for Various Hedging Strategies

M O R G A N S T A N L E Y R E S E A R C H
Global Debates PlaybookSeptember 15, 2013
44
Balances Point To Lower Prices into Year-End(Left axis: YoY
∆
in crude demand & supply, mmb/d; right axis: YoY
∆
in price, $/bbl)
Crude Oil Risk-Reward View
Catalysts
Source: IEA, Morgan Stanley Commodity Research estimates
What’s in the price?• Geopolitical tensions in the MENA once again with the Syrian conflict now in focus• Ongoing supply outages in Libya, West Africa and the North Sea• Saudi Arabia lifts production above 10 mmb/d
to offset supply losses from other
nations•
Higher crude prices eroding refinery margins portending to run cuts in front of the fall maintenance season
Base Case / Thesis 4Q13 = $105/bbl (Brent)Despite short term bullish events, we find Brent’s risk-reward unappealing heading into 4Q13. A combination of peak crude demand, supply outages and geopolitical concerns should support the Brent market in September. However, without new or persistent outages or a demand surprise, we struggle to get excited about upside from here. Crude supply is set to rise materially over the coming months, especially if current outages resolve, at the same time that crude demand is falling. Beyond eroding fundamentals, extended positioning not only limits upside but risks an overshoot to the downside in a correction. When coupled with Fed tapering and the potential for additional slowing in the EM, the implication is that downside risks outweigh upside risks going into 4Q13.
Supply issues supportive near term but shut-in streams slowly returning to the market. We count over 2.2 mmb/d
of supply offline for August –
the highest since mid-2011 –
which should keep physical markets tight in September at a minimum. However, some of these outages are slowly coming back to the market such as the North Sea, Sudan and Nigeria.
Lower crude demand is a clear headwind going forward. Crude demand is set to fall by 2.4 mmb/d
from Aug to Oct. Weak (and eroding) global refinery margins should work to reduce refinery runs. Even without run cuts, seasonal refinery maintenance will lower crude demand in the fall, especially in Europe where most Brent is consumed.
Supply visibility more limited, but bias is to the upside. With demand slowing, supply will become even more important for
price performance. However, the potential for supply growth is significant into year-end. We forecast global supply will increase 2.1 mmb/d
from Aug to Dec (vs. a 5Y avg
of ~860 kb/d), driven by fewer outages and production growth. Most non-OPEC outages were planned and should resolve over the coming months. OPEC supply remains a question (esp. Libya and Iraq), but our base case is that the situation improves somewhat over the coming weeks. The outages in Libya are a result of port worker strikes and appear to be resolving, while Iraq is taking steps to minimize disruptions from maintenance in September.
Where we could be wrong: An escalation of geopolitical tensions could lift the oil risk premium and keep prices bid despite weaker fundamentals. On the fundamental side, an improving macro, refinery start-ups or the need to rebuild distillate stocks before winter could
boost demand. At the same time, supply outages could be extended or worsen. OECD inventory trends appear supportive too, but underlying trends may be less bullish than headline numbers suggest.
What we're watching Why it matters
US/Euroil/China/Japan Fundamental Data
Provides timely confirmation of demand developments in the OECD –
weekly for the US and Japan, monthly for Europe and China. In addition,
inventory level updates help us evaluate our forecasts for supply and demand.
Physical Markets The structure of the forward curve, as well as crude and product
prices in the cash markets, provides color on what the fundamentals are saying
–
there is little influence from speculators in the cash markets.
The Middle East: OPEC and Geopolitical Tensions
OPEC must continue to produce at elevated levels to keep markets
balanced. Iran and Syria could quickly reignite supply fears tensions escalate further.
Bull Case 4Q13: $113/bblRenewed geopolitical risks reignite fears of supply disruption. In particular, if Iranian threats to close the Strait of Hormuz are realized, prices would rise sharply owing to the lack of alternate routes available to transport the 15-17 mmb/d
of crude flowing through the strait. Moreover, if non-OPEC supply disappoints again on elevated shut-ins and/or project delays, it would force OPEC to bring more barrels to the market and in turn, lower spare capacity.
Bear Case 4Q13: $98/bblGreater economic woes. DM policy errors, primarily from the US fiscal cliff, and debt contagion from Europe spread globally may damage an already weak economy. While not a repeat of 2008, we believe global oil demand growth could fall well below 2012 levels, with sluggish growth from the emerging market. If OPEC is slow to respond, large inventory builds could be realized.
Investor DebatesWill supply disruptions, especially in Libya, return before year-end?How will end-user demand cope with higher prices so far in Q313?
Will low distillate stocks in Europe ignite a rally heading into the winter heating season?
Adam Longson, (212) 761-4061, [email protected]
-1.5
-1.0
-0.5
0.0
0.5
1.0
1.5
2.0
2.5
Jan-
13
Feb-
13
Mar
-13
Apr
-13
May
-13
Jun-
13
Jul-1
3
Aug
-13
Sep
-13
Oct
-13
Nov
-13
Dec
-13
$(20)
$(15)
$(10)
$(5)
$-
$5
$10
Demand Supply Demand - Supply Price (RHS)
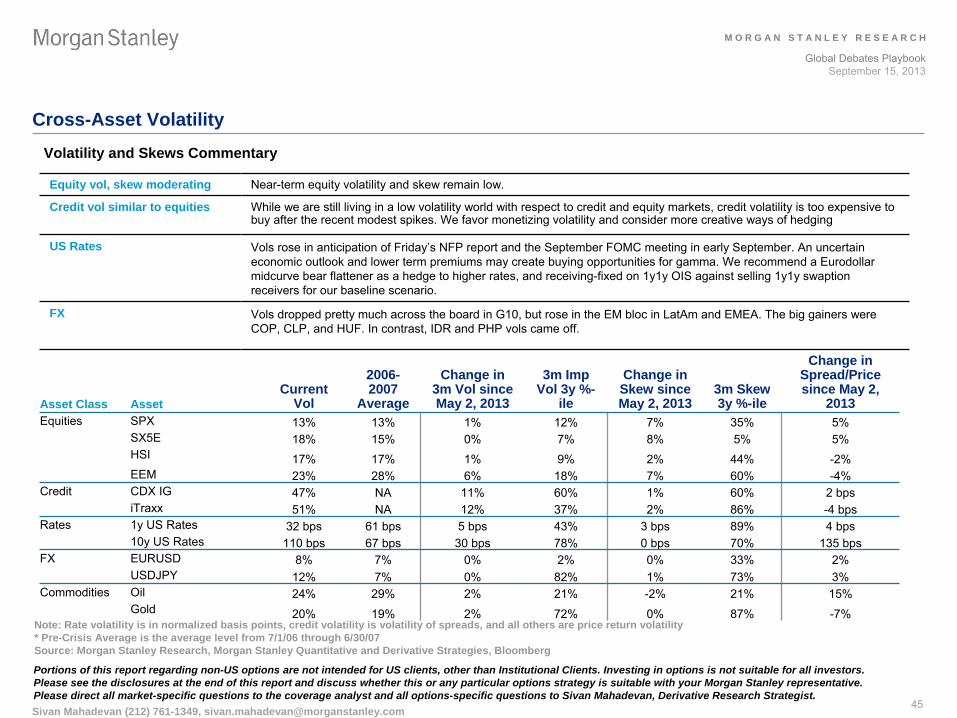
M O R G A N S T A N L E Y R E S E A R C H
Global Debates PlaybookSeptember 15, 2013
45
Cross-Asset Volatility
Volatility and Skews Commentary
Equity vol, skew moderating Near-term equity volatility and skew remain low.
Credit vol similar to equities While we are still living in a low volatility world with respect
to credit and equity markets, credit volatility is too expensive to buy after the recent modest spikes. We favor monetizing volatility and consider more creative ways of hedging
US Rates Vols
rose in anticipation of Friday’s NFP report and the September FOMC meeting in early September. An uncertain economic outlook and lower term premiums may create buying opportunities for gamma. We recommend a Eurodollar midcurve
bear flattener as a hedge to higher rates, and receiving-fixed on 1y1y OIS against selling 1y1y swaption
receivers for our baseline scenario.
FX Vols
dropped pretty much across the board in G10, but rose in the EM
bloc in LatAm
and EMEA. The big gainers were COP, CLP, and HUF. In contrast, IDR and PHP vols
came off.
Portions of this report regarding non-US options are not intended for US clients, other than Institutional Clients. Investing in options is not suitable for all investors. Please see the disclosures at the end of this report and discuss whether this or any particular options strategy is suitable with your Morgan Stanley representative. Please direct all market-specific questions to the coverage analyst and all options-specific questions to Sivan Mahadevan, Derivative Research Strategist.Sivan Mahadevan (212) 761-1349, [email protected]
Note: Rate volatility is in normalized basis points, credit volatility is volatility of spreads, and all others are price return volatility * Pre-Crisis Average is the average level from 7/1/06 through 6/30/07 Source: Morgan Stanley Research, Morgan Stanley Quantitative and Derivative Strategies, Bloomberg
Asset Class AssetCurrent
Vol
2006- 2007
Average
Change in 3m Vol since May 2, 2013
3m Imp Vol 3y %-
ile
Change in Skew since May 2, 2013
3m Skew 3y %-ile
Change in Spread/Price since May 2,
2013Equities SPX 13% 13% 1% 12% 7% 35% 5%
SX5E 18% 15% 0% 7% 8% 5% 5%HSI 17% 17% 1% 9% 2% 44% -2%EEM 23% 28% 6% 18% 7% 60% -4%
Credit CDX IG 47% NA 11% 60% 1% 60% 2 bpsiTraxx 51% NA 12% 37% 2% 86% -4 bps
Rates 1y US Rates 32 bps 61 bps 5 bps 43% 3 bps 89% 4 bps10y US Rates 110 bps 67 bps 30 bps 78% 0 bps 70% 135 bps
FX EURUSD 8% 7% 0% 2% 0% 33% 2%USDJPY 12% 7% 0% 82% 1% 73% 3%
Commodities Oil 24% 29% 2% 21% -2% 21% 15%Gold 20% 19% 2% 72% 0% 87% -7%
M O R G A N S T A N L E Y R E S E A R C H
Global Debates PlaybookSeptember 15, 2013
46
Disclosure SectionCollateralized mortgage obligations and other mortgage-related securities are not suitable for every investor and are subject to certain risks. The value and price of these securities is sensitive to conditions affecting the real estate market and the assets underlying these securities. Accordingly, changes in economic conditions, the value of underlying assets, credit conditions, interest rates, or other factors can cause these securities to diminish in value. In addition, residential mortgage-backed securities are subject to risks related to prepayment and clean-up call risk. When the obligations underlying these securities are prepaid at a faster pace than expected and the securities are called, an investor may have to reinvest in securities with a lower yield and/or fail to recover additional amounts (premiums) paid for securities with higher interest rates, resulting in an unexpected capital loss. The structure of these securities may be complex and less information may be available about them than other types of debt securities. The information and opinions in Morgan Stanley Research were prepared or are disseminated by Morgan Stanley & Co. LLC and/or Morgan Stanley C.T.V.M. S.A. and/or Morgan Stanley Mexico, Casa de Bolsa, S.A. de C.V. and/or Morgan Stanley & Co. International plc and/or RMB Morgan Stanley (Proprietary) Limited and/or Morgan Stanley MUFG Securities Co., Ltd. and/or Morgan Stanley Capital Group Japan Co., Ltd. and/or Morgan Stanley Asia Limited and/or Morgan Stanley Asia (Singapore) Pte. (Registration number 199206298Z) and/or Morgan Stanley Asia (Singapore) Securities Pte
Ltd (Registration number 200008434H), regulated by the Monetary
Authority of Singapore (which accepts legal responsibility for its contents and should be contacted with respect to any matters arising from, or
in connection with, Morgan Stanley Research) and/or Morgan Stanley Taiwan Limited and/or Morgan Stanley & Co International plc, Seoul Branch, and/or Morgan Stanley Australia
Limited (A.B.N. 67 003 734 576, holder of Australian financial services license No. 233742, which accepts responsibility for its contents), and/or Morgan Stanley Wealth Management Australia
Pty Ltd (A.B.N. 19 009 145 555, holder of Australian financial services license No. 240813, which accepts responsibility for its contents), and/or Morgan Stanley India Company Private Limited, and/or PT Morgan Stanley Asia Indonesia and their affiliates (collectively, "Morgan Stanley").For important disclosures, stock price charts and equity rating histories regarding companies that are the subject of this report, please see the Morgan Stanley Research Disclosure Website at www.morganstanley.com/researchdisclosures, or contact your investment representative or Morgan Stanley Research at 1585 Broadway, (Attention: Research Management), New York, NY, 10036 USA.For valuation methodology and risks associated with any price targets referenced in this research report, please email [email protected]
with a request for valuation methodology and risks on a particular stock or contact
your investment representative or Morgan Stanley Research at 1585 Broadway, (Attention: Research Management), New York, NY 10036 USA.Analyst Certification The following analysts hereby certify that their views about the
companies and their securities discussed in this report are accurately expressed and that they have not received and will not receive direct or indirect compensation in exchange for expressing specific recommendations or views in this report: Jason Draho. Unless otherwise stated, the individuals listed on the cover page of this report are research analysts.Global Research Conflict Management Policy Morgan Stanley Research has been published in accordance with our conflict management policy, which is available at www.morganstanley.com/institutional/research/conflictpolicies.Important US Regulatory Disclosures on Subject Companies Within the last 12 months, Morgan Stanley managed or co-managed a public offering (or 144A offering) of securities of GOVERNMENT OF JAPAN, ITALIAN GOVERNMENT, REPUBLIC OF FRANCE, UNITED KINGDOM OF GREAT BRITAIN AND NORTHERN IRELAND,
UNITED STATES OF AMERICA, FANNIE MAE, FREDDIE MAC.Within the last 12 months, Morgan Stanley has received compensation for investment banking services from GOVERNMENT OF MALAYSIA,
ITALIAN GOVERNMENT, REPUBLIC OF COLOMBIA, REPUBLIC OF FRANCE, UNITED KINGDOM OF GREAT BRITAIN AND NORTHERN IRELAND, FANNIE MAE, FREDDIE MAC.In the next 3 months, Morgan Stanley expects to receive or intends to seek compensation for investment banking services from FEDERAL REPUBLIC OF GERMANY, GOVERNMENT OF JAPAN, GOVERNMENT OF MALAYSIA, HUNGARY, ITALIAN GOVERNMENT, KINGDOM OF SPAIN, REPUBLIC OF COLOMBIA, REPUBLIC OF FRANCE, REPUBLIC
OF INDONESIA, REPUBLIC OF POLAND, UNITED KINGDOM OF GREAT BRITAIN AND NORTHERN
IRELAND, UNITED MEXICAN STATES, FANNIE MAE, FREDDIE MAC.Within the last 12 months, Morgan Stanley has received compensation for products and services other than investment banking services from GINNIE MAE, GOVERNMENT OF JAPAN, GOVERNMENT OF MALAYSIA, ITALIAN GOVERNMENT, REPUBLIC OF FRANCE, REPUBLIC OF INDONESIA, REPUBLIC OF POLAND, UNITED KINGDOM OF GREAT BRITAIN AND NORTHERN IRELAND, FANNIE MAE, FREDDIE MAC.Within the last 12 months, Morgan Stanley has provided or is providing investment banking services to, or has an investment banking client relationship with, the following company: FEDERAL REPUBLIC OF GERMANY, GOVERNMENT OF JAPAN, GOVERNMENT OF MALAYSIA, HUNGARY, ITALIAN GOVERNMENT, KINGDOM OF SPAIN, REPUBLIC OF COLOMBIA, REPUBLIC OF FRANCE, REPUBLIC OF INDONESIA, REPUBLIC OF
POLAND, UNITED KINGDOM OF GREAT BRITAIN AND NORTHERN IRELAND, UNITED MEXICAN STATES, UNITED STATES OF AMERICA, FANNIE MAE, FREDDIE MAC.
M O R G A N S T A N L E Y R E S E A R C H
Global Debates PlaybookSeptember 15, 2013
47
Disclosure Section (Cont.)Within the last 12 months, Morgan Stanley has either provided or
is providing non-investment banking, securities-related services to and/or in the past has entered into an agreement to provide services or has a client relationship with the following
company: FEDERAL REPUBLIC OF GERMANY, GINNIE MAE, GOVERNMENT OF
JAPAN, GOVERNMENT OF MALAYSIA, HUNGARY, ITALIAN GOVERNMENT, KINGDOM OF SPAIN, REPUBLIC OF FRANCE, REPUBLIC OF INDONESIA, REPUBLIC OF POLAND, UNITED KINGDOM OF GREAT BRITAIN AND NORTHERN IRELAND, UNITED MEXICAN STATES, FANNIE MAE, FREDDIE
MAC.Morgan Stanley & Co. LLC makes a market in the securities of UNITED KINGDOM OF GREAT BRITAIN AND NORTHERN IRELAND.The equity research analysts or strategists principally responsible for the preparation of Morgan Stanley Research have received
compensation based upon various factors, including quality of research, investor client feedback, stock picking, competitive factors, firm revenues and overall investment banking revenues.Morgan Stanley and its affiliates do business that relates to companies/instruments covered in Morgan Stanley Research, including market making, providing liquidity and specialized trading, risk arbitrage and other proprietary trading, fund management, commercial banking, extension of credit, investment services and investment banking. Morgan Stanley sells to and buys from customers the securities/instruments of companies covered in Morgan Stanley Research on a principal basis. Morgan Stanley may have a position in the debt of the Company or instruments discussed in this report.Certain disclosures listed above are also for compliance with applicable regulations in non-US jurisdictions.STOCK RATINGS Morgan Stanley uses a relative rating system using terms such as
Overweight, Equal-weight, Not-Rated or Underweight (see definitions below). Morgan Stanley does not assign ratings of Buy, Hold or Sell to the stocks we cover. Overweight, Equal-weight, Not-Rated and Underweight are not the equivalent of buy, hold and sell. Investors should carefully read the definitions of all ratings used in Morgan Stanley Research. In addition, since Morgan Stanley Research contains more complete information concerning the analyst's views, investors should carefully read Morgan Stanley Research, in its entirety, and not infer the
contents from the rating alone. In any case, ratings (or research) should not be used or relied upon as investment advice. An investor's decision to buy or sell a stock should depend on individual circumstances (such as the investor's existing holdings) and other considerations.Global Stock Ratings Distribution (as of August 31, 2013) For disclosure purposes only (in accordance with NASD and NYSE requirements), we include the category headings of Buy, Hold, and
Sell alongside our ratings of Overweight, Equal-
weight, Not-Rated and Underweight. Morgan Stanley does not assign ratings of
Buy, Hold or Sell to the stocks we cover. Overweight, Equal-weight, Not-Rated and Underweight are not the equivalent of buy, hold, and sell but represent recommended relative weightings (see definitions below). To satisfy regulatory requirements, we correspond Overweight, our most positive stock rating, with a buy recommendation; we correspond Equal-weight and Not-Rated to hold and Underweight to sell recommendations, respectively.
Data include common stock and ADRs
currently assigned ratings. An investor's decision to buy or sell a stock should depend on individual circumstances (such as the investor's existing holdings) and other considerations. Investment Banking Clients are companies from whom Morgan Stanley received investment banking compensation in the last 12 months.Analyst Stock Ratings Overweight (O or Over) -
The stock's total return is expected to exceed the total return
of the relevant country MSCI Index or the average total return of the analyst's industry (or industry team's) coverage universe, on a risk-adjusted basis over the next 12-18 months.Equal-weight (E or Equal) -
The stock's total return is expected to be in line with the total return of the relevant country MSCI Index or the average total return of the analyst's industry (or industry team's) coverage universe, on a risk-adjusted basis over the next 12-18 months.
Coverage Universe Investment Banking Clients (IBC)
Stock Rating Category Count % of Total Count % of Total IBC % of Rating Category
Overweight/Buy 978 34% 400 38% 41%Equal-weight/Hold 1280 44% 491 46% 38%Not-Rated/Hold 114 4% 28 3% 25%Underweight/Sell 510 18% 137 13% 27%Total 2,882 1056

M O R G A N S T A N L E Y R E S E A R C H
Global Debates PlaybookSeptember 15, 2013
48
Disclosure Section (Cont.)Not-Rated (NR) -
Currently the analyst does not have adequate conviction about the stock's total return relative to the relevant country MSCI Index or the average total return of the analyst's industry (or industry team's) coverage universe, on a risk-adjusted basis, over the next 12-18 months.Underweight (U or Under) -
The stock's total return is expected to be below the total return of the relevant country MSCI Index or the average total return of the analyst's industry (or industry team's) coverage universe, on a risk-adjusted basis, over the next 12-18 months.Unless otherwise specified, the time frame for price targets included in Morgan Stanley Research is 12 to 18 months.Analyst Industry Views Attractive (A): The analyst expects the performance of his or her industry coverage universe over the next 12-18 months to be attractive vs. the relevant broad market benchmark, as indicated below.In-Line (I): The analyst expects the performance of his or her industry coverage universe over the next 12-18 months to be in line with the relevant broad market benchmark, as indicated below.Cautious (C): The analyst views the performance of his or her industry coverage universe over the next 12-18 months with caution vs. the relevant broad market benchmark, as indicated below.Benchmarks for each region are as follows: North America -
S&P 500; Latin America -
relevant MSCI country index or MSCI Latin America Index; Europe
-
MSCI Europe; Japan -
TOPIX; Asia -
relevant MSCI country index.Important Disclosures for Morgan Stanley Smith Barney LLC Customers Citi
Research publications may be available about the companies or topics that are the subject of Morgan Stanley Research. Ask your
Financial Advisor or use Research Center to view any available Citi
Research publications in addition to Morgan Stanley research reports.Important disclosures regarding the relationship between the companies that are the subject of Morgan Stanley Research and Morgan Stanley Smith Barney LLC or Morgan Stanley or any of their affiliates, are available on the Morgan Stanley Wealth Management disclosure website at www.morganstanley.com/online/researchdisclosures.For Morgan Stanley specific disclosures, you may refer to www.morganstanley.com/researchdisclosures.Each Morgan Stanley Equity Research report is reviewed and approved on behalf of Morgan Stanley Smith Barney LLC. This review and approval is conducted by the same person who reviews the Equity Research report on behalf of Morgan Stanley. This could create a conflict of interest.Other Important DisclosuresMorgan Stanley & Co. International PLC and its affiliates have a
significant financial interest in the debt securities of FEDERAL REPUBLIC OF GERMANY, GINNIE MAE, GOVERNMENT OF JAPAN, GOVERNMENT OF MALAYSIA, HUNGARY, KINGDOM OF SPAIN, REPUBLIC OF COLOMBIA, REPUBLIC OF FRANCE, REPUBLIC OF INDONESIA, REPUBLIC OF POLAND, UNITED KINGDOM OF GREAT BRITAIN AND NORTHERN IRELAND, UNITED MEXICAN STATES, UNITED STATES OF AMERICA, FANNIE MAE, FREDDIE MAC.Morgan Stanley is not acting as a municipal advisor and the opinions or views contained herein are not intended to be, and do not constitute, advice within the meaning of Section 975 of the Dodd-Frank Wall
Street Reform and Consumer Protection Act.Morgan Stanley produces an equity research product called a "Tactical Idea." Views contained in a "Tactical Idea" on a particular stock may be contrary to the recommendations or views expressed in research on the same stock. This may be the result of differing time horizons, methodologies, market events, or other factors. For all research available on a particular stock, please contact your sales representative or go to Matrix at http://www.morganstanley.com/matrix.Morgan Stanley will make certain research products and announcements available only on the Matrix platform. For access to Matrix, please contact your sales representative or go to Matrix at http://www.morganstanley.com/matrix.Any access and/or use of Morgan Stanley Research are subject to Morgan Stanley's Terms of Use (http://www.morganstanley.com/terms.html). By accessing and/or using Morgan Stanley Research, you are indicating that you have read and agree to be bound by our Terms of Use (http://www.morganstanley.com/terms.html). In addition you consent to Morgan Stanley processing your personal data and using cookies in accordance with our Privacy Policy and our Global Cookies Policy (http://www.morganstanley.com/privacy_pledge.html), including for the purposes of setting your preferences and to collect readership data so that we can deliver better and more personalised
service and products to you. To find out more information about
how Morgan Stanley processes personal data, how we use cookies and how to reject cookies see our Privacy Policy and our Global Cookies Policy (http://www.morganstanley.com/privacy_pledge.html).If you do not agree to our Terms of Use and/or if you do not wish to provide your consent to Morgan Stanley processing of your personal data or using cookies please do not access our research.

M O R G A N S T A N L E Y R E S E A R C H
Global Debates PlaybookSeptember 15, 2013
49
Disclosure Section (Cont.)Morgan Stanley Research does not provide individually tailored investment advice. Morgan Stanley Research has been prepared without regard to the circumstances and objectives of those who receive it. Morgan Stanley recommends that investors independently evaluate particular investments and strategies, and
encourages investors to seek the advice of a financial adviser. The appropriateness of an investment or strategy will depend on an investor's circumstances and objectives. The securities, instruments, or strategies discussed in Morgan Stanley Research may not be suitable for all investors, and certain investors may not be eligible to purchase or participate in some or all of them. Morgan Stanley Research is not an offer to buy or sell any security/instrument or to participate in any trading strategy. The value of and income from your investments may vary because of changes in interest rates, foreign exchange rates, default rates, prepayment rates, securities/instruments prices, market indexes, operational or financial conditions of companies
or other factors. There may be time limitations on the exercise of options or other rights in securities/instruments transactions. Past performance is not necessarily a guide to future performance. Estimates of future performance are based on assumptions that may not be realized. If provided, and unless otherwise stated, the closing price on the cover page is that of the primary exchange for the subject company's securities/instruments.The fixed income research analysts, strategists or economists principally responsible for the preparation of Morgan Stanley Research have received compensation based upon various factors, including quality, accuracy and value of research, firm
profitability or revenues (which include fixed income trading and capital markets profitability or revenues), client feedback and competitive factors. Fixed Income Research analysts', strategists' or economists' compensation is not linked to investment banking or capital markets transactions performed by Morgan Stanley or the profitability or revenues of particular trading desks.Morgan Stanley Research is not an offer to buy or sell or the solicitation of an offer to buy or sell any security/instrument or
to participate in any particular trading strategy. The "Important US Regulatory Disclosures on Subject Companies" section in Morgan Stanley Research lists all companies mentioned where Morgan Stanley owns 1% or more of a class of common equity securities of the companies. For all other companies mentioned in Morgan Stanley Research, Morgan Stanley may have an investment of less than 1% in securities/instruments or derivatives of securities/instruments of companies and may trade
them in ways different from those discussed in Morgan Stanley Research. Employees of Morgan Stanley not involved in the preparation of Morgan Stanley Research may have investments in securities/instruments or derivatives of securities/instruments of companies mentioned and may trade them in ways different from those discussed in Morgan Stanley Research. Derivatives may be issued by Morgan Stanley or associated persons.With the exception of information regarding Morgan Stanley, Morgan Stanley Research is based on public information. Morgan Stanley makes every effort to use reliable, comprehensive information, but we make no representation that it is accurate or complete. We have no obligation to tell you when opinions or information in Morgan Stanley Research change apart from when we intend to discontinue equity research coverage of a subject company. Facts and views presented in Morgan Stanley Research have not been reviewed by, and may not reflect information known to, professionals in other Morgan Stanley business areas, including investment banking personnel.Morgan Stanley Research personnel may participate in company events such as site visits and are generally prohibited from accepting payment by the company of associated expenses unless pre-approved by authorized members of Research management.Morgan Stanley may make investment decisions or take proprietary
positions that are inconsistent with the recommendations or views in this report.To our readers in Taiwan: Information on securities/instruments
that trade in Taiwan is distributed by Morgan Stanley Taiwan Limited ("MSTL"). Such information is for your reference only. The reader should independently evaluate the investment risks and is solely responsible for their investment decisions. Morgan Stanley Research may not be distributed to the public media or quoted or used by the public media without the express written consent of Morgan Stanley. Information on securities/instruments that do not trade in Taiwan is for informational purposes only and is not to be construed as a recommendation or a solicitation to trade in such securities/instruments. MSTL may not execute transactions for clients in these securities/instruments. To our readers in Hong Kong: Information is distributed in Hong Kong by and on behalf of, and is attributable to, Morgan Stanley
Asia Limited as part of its regulated activities in Hong Kong. If you have any queries concerning Morgan Stanley Research, please contact our Hong Kong sales representatives.Certain information in Morgan Stanley Research was sourced by employees of the Shanghai Representative Office of Morgan Stanley Asia Limited for the use of Morgan Stanley Asia Limited.Morgan Stanley is not incorporated under PRC law and the research in relation to this report is conducted outside the PRC. Morgan Stanley Research does not constitute an offer to sell or the solicitation of an offer to buy any securities in the PRC. PRC investors shall have the relevant qualifications to invest in such securities and shall be responsible for obtaining all relevant approvals, licenses, verifications and/or registrations from the
relevant governmental authorities themselves.Morgan Stanley Research is disseminated in Brazil by Morgan Stanley C.T.V.M. S.A.; in Japan by Morgan Stanley MUFG Securities Co., Ltd. and, for Commodities related research reports only, Morgan Stanley Capital Group Japan Co., Ltd; in Hong Kong by Morgan Stanley Asia Limited (which accepts responsibility for
its contents); in Singapore by Morgan Stanley Asia (Singapore) Pte. (Registration number 199206298Z) and/or Morgan Stanley Asia (Singapore) Securities Pte
Ltd (Registration number 200008434H), regulated by the Monetary
Authority of

M O R G A N S T A N L E Y R E S E A R C H
Global Debates PlaybookSeptember 15, 2013
50
Disclosure Section (Cont.)Singapore (which accepts legal responsibility for its contents and should be contacted with respect to any matters arising from,
or in connection with, Morgan Stanley Research); in Australia to "wholesale clients" within the meaning of the Australian Corporations Act by Morgan Stanley Australia Limited A.B.N. 67 003 734 576, holder of Australian financial services license No. 233742, which accepts responsibility for its contents; in Australia to "wholesale clients" and "retail clients" within the meaning of the Australian Corporations Act by Morgan Stanley Wealth Management Australia Pty Ltd (A.B.N. 19 009 145 555, holder of Australian financial services license No. 240813, which accepts responsibility for its contents; in Korea by Morgan Stanley & Co International plc, Seoul Branch; in India by Morgan Stanley
India Company Private Limited; in Indonesia by PT Morgan Stanley Asia Indonesia; in Canada by Morgan Stanley Canada Limited, which has approved of and takes responsibility for its contents in Canada; in Germany by Morgan Stanley Bank AG, Frankfurt am Main and Morgan Stanley Private Wealth Management Limited, Niederlassung
Deutschland, regulated by Bundesanstalt
fuer
Finanzdienstleistungsaufsicht
(BaFin); in Spain by Morgan Stanley, S.V., S.A., a Morgan Stanley group company, which is supervised by the Spanish Securities Markets Commission (CNMV) and states that Morgan Stanley Research has been written and distributed in accordance with the rules of conduct applicable to financial research as established
under Spanish regulations; in the US by Morgan Stanley & Co. LLC, which accepts responsibility for its contents. Morgan Stanley & Co. International plc, authorized by the Prudential Regulatory Authority and regulated by the Financial Conduct Authority and the Prudential Regulatory Authority, disseminates in the UK research that it has prepared, and approves solely for the purposes of section 21 of the Financial Services and Markets Act 2000, research which has been prepared by any of its affiliates. Morgan Stanley Private Wealth Management Limited, authorized and regulated by the Financial Conduct Authority, also disseminates Morgan Stanley Research in the UK. Private UK investors should obtain the advice of their Morgan Stanley & Co. International plc or Morgan Stanley Private Wealth Management representative about the investments concerned. RMB Morgan Stanley (Proprietary) Limited is a member of the JSE Limited and regulated by the Financial Services Board in South Africa. RMB Morgan Stanley (Proprietary) Limited is a joint venture owned equally by Morgan Stanley International Holdings Inc. and RMB Investment Advisory (Proprietary) Limited, which is wholly owned by FirstRand Limited.The information in Morgan Stanley Research is being communicated
by Morgan Stanley & Co. International plc (DIFC Branch), regulated by the Dubai Financial Services Authority (the DFSA), and is directed at Professional Clients only, as defined by the DFSA. The financial products or financial services to which this research relates will only be made available to a customer who we are satisfied meets the regulatory criteria to be a Professional Client.The information in Morgan Stanley Research is being communicated
by Morgan Stanley & Co. International plc (QFC Branch), regulated by the Qatar Financial Centre Regulatory Authority (the QFCRA), and is directed at business customers and market counterparties only and is not intended for Retail Customers as defined by the QFCRA.As required by the Capital Markets Board of Turkey, investment information, comments and recommendations stated here, are not within the scope of investment advisory activity. Investment advisory service is provided in accordance with a contract of engagement on investment advisory concluded between brokerage houses, portfolio management companies, non-
deposit banks and clients. Comments and recommendations stated here rely on the individual opinions of the ones providing these comments and recommendations. These opinions may not fit to your financial status, risk and return preferences. For this reason, to make an investment decision by relying solely
to this information stated here may not bring about outcomes that fit your expectations.The trademarks and service marks contained in Morgan Stanley Research are the property of their respective owners. Third-party data providers make no warranties or representations relating to the accuracy, completeness, or timeliness of the data they provide and shall not have liability for any damages relating to such data. The Global Industry Classification Standard (GICS) was developed by and is the exclusive property of MSCI and S&P. Morgan Stanley bases projections, opinions, forecasts and
trading strategies regarding the MSCI Country Index Series solely on public information. MSCI has not reviewed, approved or endorsed these projections, opinions, forecasts and trading strategies. Morgan Stanley has no influence on or control over MSCI's
index compilation decisions. Morgan Stanley Research or portions of it may not be reprinted, sold or redistributed without the written consent of Morgan Stanley. Morgan Stanley research is disseminated and available primarily electronically, and, in some cases, in printed form. Additional
information on recommended securities/instruments is available on request.Morgan Stanley has based its projections, opinions, forecasts and trading strategies regarding the MSCI Country Index Series solely on publicly available information. MSCI has not reviewed, approved or endorsed the projections, opinions, forecasts and trading strategies contained herein. Morgan Stanley has no influence on or control over MSCI's
index compilation decisions.Morgan Stanley Research, or any portion thereof may not be reprinted, sold or redistributed without the written consent of Morgan Stanley.Morgan Stanley Research is disseminated and available primarily electronically, and, in some cases, in printed form.Additional information on recommended securities/instruments is available on request.9-15-13 po/rc/wn

©2013 Morgan Stanley
The Americas
1585 BroadwayNew York, NY 10036-8293United States+1 212 761 4000
Europe
20 Bank Street, Canary WharfLondon E14 4ADUnited Kingdom+44 (0)20 7425 8000
Japan
4-20-3 Ebisu, Shibuya-kuTokyo 150-6008Japan+81 (0) 3 5424 5000
Asia/Pacific
1 Austin Road WestKowloonHong Kong+852 2848 5200