Lynne Thomson, PhD VP Research Director, TNS Global Market Research

Global Consumer Perception Research:Attitudes On Counterfeit Software
Microsoft commissioned TNS, a world-class market research firm, to conduct this work. TNS offers comprehensive industry knowledge within the Consumer, Technology, Finance, Automotive and Political & Social sectors. Delivering best-in-class service across more than 70 countries, TNS is part of Kantar, the world’s largest research, insight and consultancy network. Please visit http://www.tns-us.com for more information.

Key Finding #1: Consumers know the difference between genuine and counterfeit software; and that genuine software performs better
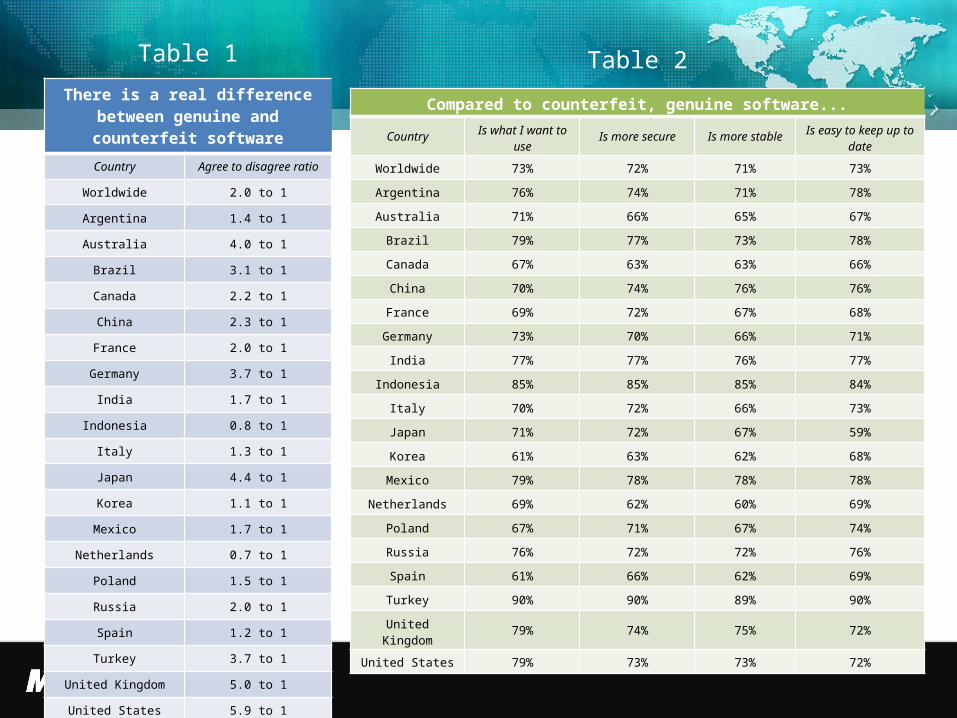
There is a real difference between counterfeit and
genuine software
Compared to counterfeit, genuine software...
All consumers agree
Is what I want to use 73%
Is more secure 72%
Is more stable 71%
Is easy to keep up to date 73%
By a 2:1 margin, consumers agree that there is a real
difference between counterfeit and genuine software.For country-specific data, please visit “Table 1” in the
Appendix For country-specific data, please visit “Table 2” in the Appendix

82% 18%
Key Finding #2: Consumers 4X more likely to recommend genuine than counterfeit software
Survey Question: If a friend or relative asked you for your opinion about whether to buy counterfeit or genuine software, which of the following are you most likely to advise them?
Buy the counterfeit software, as long as they are getting a
good price and know the risks
involved
Buy the genuine software, even if it costs more
For country-specific data, please visit “Table 3” in the Appendix

Key Finding #3: Consumers say there are risks with using counterfeit software
Consumers agree counterfeit software is not as safe to use
as genuine
Consumers express a range of concerns about counterfeit
software
Lose data; 26%
Identity theft; 23%
Funding crime; 15%
Other concerns; 15%
No concerns; 10%
DK; 10%
• 50% cite either data loss or identity theft• Only 10% say they have no concerns
By a 3:1 margin, consumers agree that counterfeit
software is not as safe to use as genuine software.
For country-specific data, please visit “Table 4” in the Appendix
For country-specific data, please visit “Table 5” in the Appendix

Key Finding #4: Consumers support action to cut down on counterfeit software
75% agree
ConsumersNeed ways to protect themselves from inadvertently buying counterfeit software
72% agree
Software companiesShould do more to stop their products from being counterfeited
65%
agree
GovernmentShould do more to reduce the amount of counterfeit software
For country-specific data, please visit “Table 6” in the Appendix

Key Finding #5: Consumers tell us they are doing their part – most often by checking the packaging and entering the product key
78%
72%
46%
72%
10%
19%
45%
22%
13%
9%
8%
6%
I did this I did not do this I can't recall
Checked the software packaging for evidence that
the software was genuine (e.g., seals, product key
numbers and so on)
Asked the sales person whether or not the software
was genuine
Checked the product description to make sure I was
buying genuine software
Entered the product key that came with the software to
activate it
60% of these checked the packaging instead
Bought in a
store
Bought online
Regardless of
where bought
For country-specific data, please visit “Table 7.1” in the Appendix
For country-specific data, please visit “Table 7.2” in the Appendix
For country-specific data, please visit “Table 7.3” in the Appendix
For country-specific data, please visit “Table 7.1” in the Appendix

• Online survey fielded in twenty countries from September 22-October 5, 2010.
• Over 38,000 consumers were polled online.
• Consumers were all over the age of 18, owned a PC in their homes, and were the primary decision makers for PC/software purchases.
• At the start of the survey consumers were given a description of genuine and counterfeit products:
– A genuine product is one made and sold by a company, either directly or through stores or the Internet.
– A counterfeit product is one that copies the genuine product and is sold either by the person who made the copy, or through stores or the Internet. Sometimes people buying counterfeit products know they are not genuine and other times they do not.
Methodology

Appendix
There is a real difference between genuine and counterfeit software
Country Agree to disagree ratio
Worldwide 2.0 to 1
Argentina 1.4 to 1
Australia 4.0 to 1
Brazil 3.1 to 1
Canada 2.2 to 1
China 2.3 to 1
France 2.0 to 1
Germany 3.7 to 1
India 1.7 to 1
Indonesia 0.8 to 1
Italy 1.3 to 1
Japan 4.4 to 1
Korea 1.1 to 1
Mexico 1.7 to 1
Netherlands 0.7 to 1
Poland 1.5 to 1
Russia 2.0 to 1
Spain 1.2 to 1
Turkey 3.7 to 1
United Kingdom 5.0 to 1
United States 5.9 to 1
Table 1 Table 2
Compared to counterfeit, genuine software...
Country Is what I want to use Is more secure Is more stable Is easy to keep up to
date
Worldwide 73% 72% 71% 73%
Argentina 76% 74% 71% 78%
Australia 71% 66% 65% 67%
Brazil 79% 77% 73% 78%
Canada 67% 63% 63% 66%
China 70% 74% 76% 76%
France 69% 72% 67% 68%
Germany 73% 70% 66% 71%
India 77% 77% 76% 77%
Indonesia 85% 85% 85% 84%
Italy 70% 72% 66% 73%
Japan 71% 72% 67% 59%
Korea 61% 63% 62% 68%
Mexico 79% 78% 78% 78%
Netherlands 69% 62% 60% 69%
Poland 67% 71% 67% 74%
Russia 76% 72% 72% 76%
Spain 61% 66% 62% 69%
Turkey 90% 90% 89% 90%
United Kingdom 79% 74% 75% 72%
United States 79% 73% 73% 72%

If a friend or relative asked you for your opinion about whether to buy counterfeit or genuine software, which of the following are you most likely to advise them?
Country Genuine CounterfeitWorldwide 82% 18%
Argentina 76% 24%
Australia 86% 14%
Brazil 84% 16%
Canada 81% 19%
China 57% 43%
France 87% 13%
Germany 90% 10%
India 86% 14%
Indonesia 82% 18%
Italy 80% 20%
Japan 95% 5%
Korea 70% 30%
Mexico 85% 15%
Netherlands 79% 21%
Poland 85% 15%
Russia 73% 27%
Spain 75% 25%
Turkey 90% 10%
United Kingdom 90% 10%
United States 92% 8%
Table 3

Consumers agree counterfeit software is not as safe to use as genuine
Country Agree to disagree ratioWorldwide 3.0 to 1
Argentina 1.9 to 1
Australia 4.5 to 1
Brazil 4.4 to 1
Canada 2.6 to 1
China 2.8 to 1
France 2.1 to 1
Germany 6.4 to 1
India 2.2 to 1
Indonesia 2.2 to 1
Italy 1.8 to 1
Japan 8.3 to 1
Korea 2.5 to 1
Mexico 3.5 to 1
Netherlands 2.6 to 1
Poland 2.3 to 1
Russia 1.8 to 1
Spain 2.2 to 1
Turkey 7.5 to 1
United Kingdom 6.3 to 1
United States 6.2 to 1
Table 4

Consumers express a range of concerns about counterfeit softwareCountry Data Loss Identity Theft Other Concerns No Concerns Unaware
Worldwide 26% 23% 30% 10% 10%
Argentina 23% 16% 23% 27% 10%
Australia 21% 33% 26% 8% 11%
Brazil 24% 18% 44% 10% 4%
Canada 20% 25% 29% 11% 15%
China 35% 25% 26% 8% 5%
France 24% 29% 29% 6% 11%
Germany 24% 28% 32% 4% 12%
India 32% 16% 36% 9% 7%
Indonesia 37% 16% 30% 10% 7%
Italy 24% 17% 35% 12% 12%
Japan 24% 29% 23% 4% 20%
Korea 33% 14% 35% 9% 9%
Mexico 28% 19% 40% 9% 4%
Netherlands 18% 20% 19% 21% 22%
Poland 20% 15% 45% 10% 10%
Russia 30% 18% 29% 19% 4%
Spain 37% 17% 20% 17% 9%
Turkey 27% 37% 30% 3% 2%
United Kingdom 22% 36% 27% 7% 9%
United States 23% 38% 19% 9% 12%
Table 5

Consumers support action to cut down on counterfeit software
Country Consumers needs ways to protect themselves
Software companies to stop their products from being counterfeited
Government to do more to reduce the amount of counterfeit software
Worldwide 75% 72% 65%
Argentina 77% 73% 62%
Australia 70% 65% 58%
Brazil 78% 80% 78%
Canada 68% 65% 54%
China 72% 74% 73%
France 77% 67% 63%
Germany 75% 65% 54%
India 79% 82% 76%
Indonesia 88% 87% 85%
Italy 70% 68% 61%
Japan 69% 73% 68%
Korea 63% 69% 65%
Mexico 85% 87% 81%
Netherlands 62% 66% 49%
Poland 75% 72% 62%
Russia 78% 73% 65%
Spain 69% 59% 50%
Turkey 85% 85% 85%
United Kingdom 76% 73% 63%
United States 76% 68% 52%
Table 6

When you buy software, do you check the software packaging for evidence that the
software was genuine?
Country Yes No Do not recall
Worldwide 46% 45% 8%
Argentina 57% 32% 12%
Australia 25% 63% 12%
Brazil 59% 34% 7%
Canada 26% 66% 8%
China 77% 19% 5%
France 29% 64% 8%
Germany 34% 56% 10%
India 83% 12% 4%
Indonesia 73% 22% 4%
Italy 43% 48% 9%
Japan 21% 69% 10%
Korea 57% 36% 7%
Mexico 55% 37% 7%
Netherlands 28% 63% 8%
Poland 52% 37% 11%
Russia 60% 29% 11%
Spain 32% 60% 7%
Turkey 54% 37% 8%
United Kingdom 19% 69% 13%
United States 15% 75% 10%
When you buy software, do you ask the retailer whether or not the software was genuine?
Country Yes No Do not recall
Worldwide 72% 22% 6%
Argentina 62% 31% 7%
Australia 66% 28% 6%
Brazil 77% 18% 5%
Canada 65% 29% 6%
China 76% 19% 5%
France 68% 27% 5%
Germany 68% 26% 6%
India 80% 16% 5%
Indonesia 81% 15% 3%
Italy 78% 16% 6%
Japan 48% 42% 10%
Korea 67% 29% 4%
Mexico 76% 19% 5%
Netherlands 68% 26% 7%
Poland 82% 12% 6%
Russia 81% 13% 5%
Spain 64% 30% 6%
Turkey 82% 14% 5%
United Kingdom 62% 31% 7%
United States 60% 33% 7%
Table 7.1

Checked the product description to make sure I was buying genuine software
Country Yes No Do not recall
Worldwide 72% 19% 9%
Argentina 62% 26% 12%
Australia 75% 15% 10%
Brazil 79% 15% 6%
Canada 66% 24% 10%
China 68% 24% 8%
France 69% 22% 9%
Germany 74% 18% 8%
India 87% 8% 5%
Indonesia 87% 11% 3%
Italy 82% 13% 4%
Japan 61% 25% 14%
Korea 63% 26% 12%
Mexico 73% 18% 8%
Netherlands 67% 23% 10%
Poland 75% 18% 8%
Russia 70% 20% 10%
Spain 74% 19% 7%
Turkey 70% 20% 10%
United Kingdom 75% 15% 10%
United States 72% 18% 10%
Table 7.2Entered the product key that came with the software to activate it
Country Yes No Do not recall
Worldwide 78% 10% 13%
Argentina 67% 12% 21%
Australia 81% 9% 11%
Brazil 79% 10% 11%
Canada 78% 11% 11%
China 74% 15% 10%
France 79% 7% 15%
Germany 82% 8% 10%
India 77% 11% 12%
Indonesia 79% 13% 9%
Italy 78% 8% 13%
Japan 62% 19% 20%
Korea 68% 18% 14%
Mexico 78% 8% 14%
Netherlands 78% 6% 16%
Poland 83% 7% 10%
Russia 86% 6% 8%
Spain 80% 8% 12%
Turkey 79% 7% 14%
United Kingdom 78% 8% 14%
United States 77% 9% 14%
Table 7.3

© 2010. Microsoft Corporation. All Rights Reserved.