Global Conference on Aquaculture 2010audio.enaca.org/global_aquaculture_2010/john_benzie.pdf ·...
20
Global Conference on Aquaculture 2010 Farming the waters for People and Food 22-25 September 2010, Phuket, Thailand Disclaimer This is an unedited presentation given at the Global Conference on Aquaculture 2010. The Organising Committee do not guarantee the accuracy or authenticity of the contents. Citations Please use the following citation sequence with citing this document: 1. Author. 2. Title. 3. Presented at the Global Conference on Aquaculture 22-25 September 2010, Phuket, Thailand.
Transcript of Global Conference on Aquaculture 2010audio.enaca.org/global_aquaculture_2010/john_benzie.pdf ·...

Global Conference on Aquaculture 2010
Farming the waters for People and Food
22-25 September 2010, Phuket, Thailand
Disclaimer
This is an unedited presentation given at the Global Conference on Aquaculture 2010. The Organising Committee do not guarantee the accuracy or authenticity of the contents.
Citations
Please use the following citation sequence with citing this document:
1. Author. 2. Title. 3. Presented at the Global Conference on Aquaculture 22-25 September 2010, Phuket, Thailand.

10/10/53
1
Expert Panel Presentation 3.1:Promoting responsible use and
conservation of aquatic biodiversity for sustainable aquaculture development
b D J h A H B iby Dr. John A. H. Benzie
AQUATIC GENETIC RESOURCES
Rich diversity of aquatic genetic resources aregenetic resources are available
How can this be exploited sustainably and wild resources protected?
What genetic knowledge or technologies are available to aid sustainable production?

10/10/53
2
AQUATIC GENETIC RESOURCES IN AQUACULTURE
PRODUCTIONhow aquatic genetic resources have been usedwhich genetic technologies have been applied what genetic changes occur in culture
IMPACTthe wild resource and evolutionary biologythe genetic impacts of aquaculturetechnologies/strategies for reducing impact
THREEFOLD INCREASE NEEDED IN AQUACULTURE PRODUCTION
10% annual growth in aquaculture achieved by accessing f d ti f i i dnew areas of production, farming new species and
increasing efficiencies

10/10/53
3
RESTRICTIONS ON AQUACULTURE EXPANSION
• SITES ARE FINITE• CONFLICT WITH OTHER USES• DEMANDS INCREASES IN EFFICIENCY, HUSBANDRY, DOMESTICATION,
GENETIC IMPROVEMENT
DOMESTICATION IN AGRICULTURE
Few centres of originCentres of production elsewhere

10/10/53
4
DOMESTICATION IN AGRICULTURE
RAPID SPREAD OF DOMESTICATED STOCKSRestricted wild distribution – one domestication eventBroader wild distribution – several domestication eventsBarriers to exchange – domestication of related speciesThose species domesticated were useful AND EASY to domesticate(Diamond 2002)
FEW DOMESTICATED SPECIES
Wild Domesticated
Major 90%
Higher plants 200,000 100 5
Large herbivores 148 14 <5
Diamond 2002

10/10/53
5
FEW FARMED AQUATIC SPECIESWild Cultured Production
Species* 99% 80%
Finfish 31,000 227 44 9
Molluscs 85,000 77 19 6
Crustaceans 47,000 35 11 4
Seaweeds 13,000 >20 2 2
Total 359 76 21Total 359 7621%
21 6%
*World Conservation Union (2010)
GERMPLASM MOVEMENT• Breeding programs often developed far from the source
and major production areas
ALL 76 SPECIES USED FOR MAJOR PRODUCTION HAVE BEEN SPREAD REGIONALLY, AND THE MAJORITY GLOBALLY
10/10/53
6
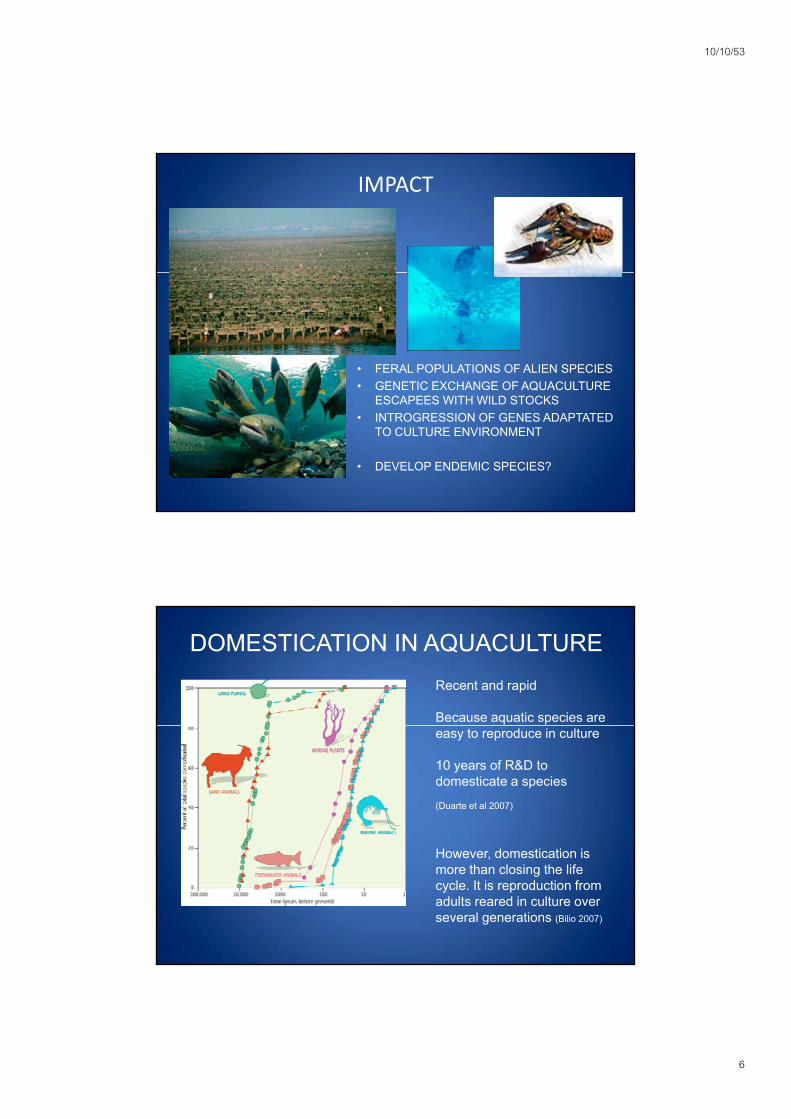
IMPACT
• FERAL POPULATIONS OF ALIEN SPECIES• GENETIC EXCHANGE OF AQUACULTURE
ESCAPEES WITH WILD STOCKS• INTROGRESSION OF GENES ADAPTATED
TO CULTURE ENVIRONMENT
• DEVELOP ENDEMIC SPECIES?
DOMESTICATION IN AQUACULTURERecent and rapid
Because aquatic species are easy to reproduce in culture
10 years of R&D to domesticate a species
(Duarte et al 2007)
However, domestication is more than closing the life cycle. It is reproduction from adults reared in culture over several generations (Bilio 2007)

10/10/53
7
BIOLOGICAL CONSTRAINTS TO AQUACULTURE DOMESTICATION
Proportion of aquaculture production, by weight, of major taxonomic groups over the last 20 years (1988-2008) is given to the nearest whole percent, after FAO (2000, 2009), using only data from production assigned to specific classes
CURRENT STATUS OF DOMESTICATION AND GENETIC IMPROVEMENT IN AQUACULTURE

10/10/53
8
SELECTIVE BREEDING IS CENTRAL• IMPROVEMENT IS DEPENDENT
ON WELL MANAGED BREEDING PROGRAMS
• THESE DEPEND ON QUANTITATIVE GENETICS APPROACHES
• ESTIMATION OF GENETIC PARAMETERS (HERITABILITY, GENETIC CORRELATION)
• CALCULATION OF BREEDING VALUES
MOLECULAR TOOLS
• SEX IDENTIFICATION• PARENT TRACKING
| ♀ | ♂ | ♀ | ♂ |♀| ♂
82
76
• GENE EXPRESSION CHANGES IN DIFFERENT SAMPLES (TISSUES, ENVIRONMENTS)
• RELATED CHANGES IN EXPRESSION IN GENE NETWORKS
• EST LIBRARIES ARE SOURCES OF SEQUENCE INFORMATION AND MARKERS
• MICROARRAYS AND TRANSCRIPTOMIC TOOLS TEST DIFFERENCES IN GENE EXPRESSION
• GENOME SEQUENCING

10/10/53
9
BENEFITS OF MOLECULAR TOOLS
• MARKER ASSISTED SELECTION
• MORE ACCURATE/EFFICIENT BREEDING FOR EXISTING TRAITS
• SELECTION ON ADDITIONAL TRAITS (SEXES WHERE THE PHENOTYPE IS NOT EXPRESSED, CHARACTERS DIFFICULT OR IMPOSSIBLE TO OBSERVE)
• WHOLE GENOME SELECTIONGENETIC MAP
PHYSICAL MAP –large insert libraries
CHROMOSOMESQTLs
CATTLE EXPERIENCEWHOLE GENOME SELECTION
• PEDIGREE FROM SNP ANALYSIS MORE ACCURATE THAN PAPER TRAIL(THOUSANDS OF MARKERS)
• SELECTION MORE ACCURATE EXCLUDING PHENOTYPIC DATA• POTENTIALLY SAVE COST OF OBTAINING PHENOTYPIC DATA FROM TEST
POPULATIONS
10/10/53
10
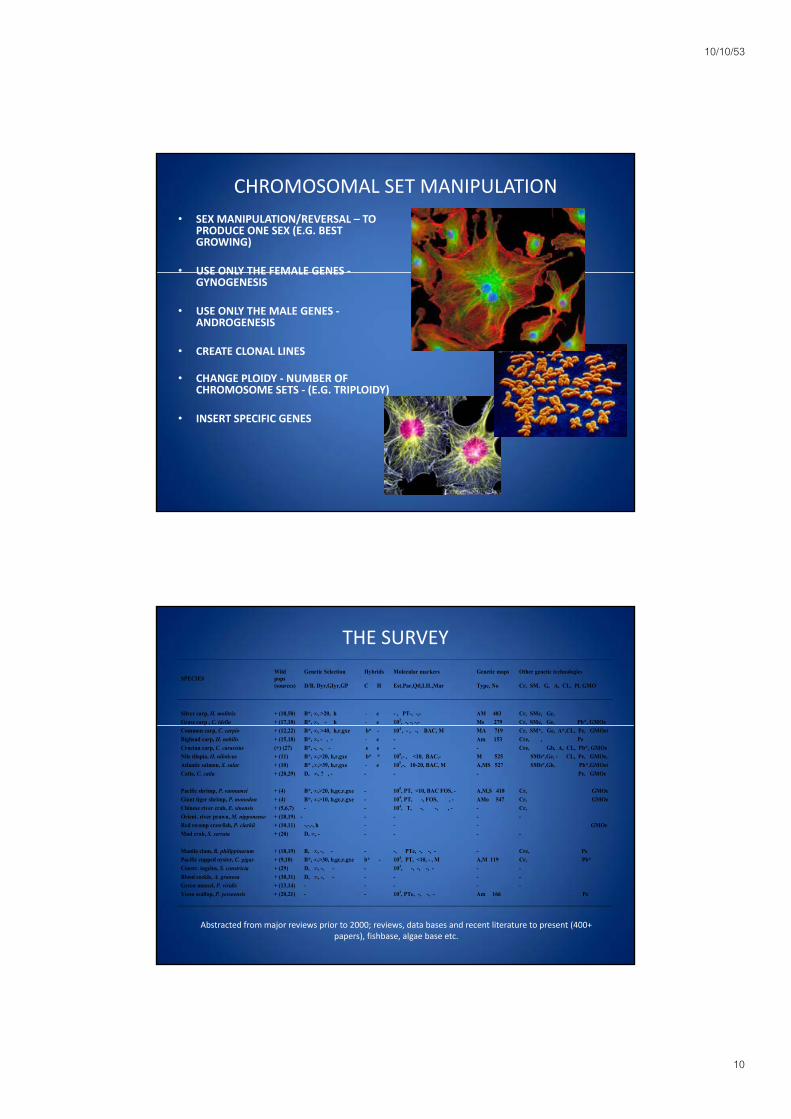
CHROMOSOMAL SET MANIPULATION• SEX MANIPULATION/REVERSAL – TO
PRODUCE ONE SEX (E.G. BEST GROWING)
• USE ONLY THE FEMALE GENES -USE ONLY THE FEMALE GENES GYNOGENESIS
• USE ONLY THE MALE GENES -ANDROGENESIS
• CREATE CLONAL LINES
• CHANGE PLOIDY - NUMBER OF CHROMOSOME SETS - (E.G. TRIPLOIDY)CHROMOSOME SETS (E.G. TRIPLOIDY)
• INSERT SPECIFIC GENES
THE SURVEY
SPECIES Wild pops
Genetic Selection Hybrids Molecular markers Genetic maps Other genetic technologies
(sources) D/B, Dyr,GIyr,GP C H Est,Par,Qtl,LIL,Mar Type, No Cr, SM, G, A, CL, Pl, GMO
Silver carp, H. molitrix + (18,50) B*, ∞, >20, h - e - , PT-, -,- AM 483 Cr, SMe, Ge, Grass carp , C. idella + (17,18) B*, ∞, - h - e 102, -, -, -,- Ms 279 Cr, SMe, Ge, Pb*, GMOe Common carp, C. carpio + (12,22) B*, ∞, >40, h,r,gxe b* - 104 , - , -, BAC, M MA 719 Cr, SM*, Ge, A*,CL, Pe, GMOet Bighead carp, H. nobilis + (15,18) B*, ∞, - , - - e - Am 153 Cre, , Pe Crucian carp, C. carassius (+) (27) B*, -, -, - e e - - Cre, Gb, A, CL, Pb*, GMOe Nile tilapia, O. niloticus + (11) B*, ∞,>20, h,r,gxe b* * 105,- , <10, BAC,- M 525 SMb*,Ge, - CL, Pe, GMOe, Atlantic salmon, S. salar + (10) B* ,∞,>39, h,r,gxe - e 105,-, 10-20, BAC, M A,MS 527 SMb*,Gb, Pb*,GMOet Catla, C. catla + (28,29) D, ∞, ? , - - - - Pe, GMOe Pacific shrimp, P. vannamei + (4) B*, ∞,>20, h,gc,r,gxe - 105, PT, <10, BAC FOS, - A,M,S 418 Cr, GMOe Giant tiger shrimp, P. monodon + (4) B*, ∞,>10, h,gc,r,gxe - 104, PT, -, FOS, , - AMo 547 Cr, GMOe Chinese river crab, E. sinensis + (5,6,7) - - 104, T, -, -, , - - Cr, Orient. river prawn, M. nipponense + (18,19) - - - - - Red swamp crawfish, P. clarkii + (10,11) -,-,-, h - - - GMOe Mud crab, S. serrata + (20) D, ∞, - - - - - Manila clam, R. philippinarum + (18,19) B, ∞, -, - - -, PTe, -, -, - - Cre, Pe Pacific cupped oyster, C. gigas + (9,10) B*, ∞,>30, h,gc,r,gxe b* - 104, PT, <10, - , M A,M 119 Cr, Pb* Constr. tagelus, S. constricta + (29) D, ∞, -, - - 103, -, -, -, - - - Blood cockle, A. granosa + (30,31) D, ∞, -, - - - - - Green mussel, P. viridis + (13,14) - - - - - Yesso scallop, P. yessoensis + (20,21) - - 103, PTe, -, -, - Am 166 Pe
Abstracted from major reviews prior to 2000; reviews, data bases and recent literature to present (400+ papers), fishbase, algae base etc.

10/10/53
11
Number domesticated
Cultured Domesticated
Finfish 227 91 40%Finfish 227 91 40%
Molluscs 77 30 39%
Crustaceans 35 19 54%
Seaweeds >20 6 30%
Total 359 136 37%
CRYOPRESERVATIONSEX MANIPULATION
GYNOGENESISANDROGENESIS
SELECTIVE BREEDING
GENETIC IMPROVEMENT TECHNOLOGIES
GENETIC MARKERSPARENT TRACKING
EST LIBRARIESANDROGENESISCLONAL LINES
PLOIDY MANIPULATIONDIRECT GENE TRANSFER
(GMO)
CROSS BREEDING
SB CB
GENETIC MAPSQTLs
LARGE INSERT LIBRARIESMICROARRAYS
Finfish (227) 68 24 42 44
Molluscs (77) 21 18 2 15
Crustaceans (35) 10 6 0 6
Seaweeds (20) 2 2 2 2
TOTAL (76) 40 (53%) 22 (29%) 19 (25%) 37 (33%)
TOTAL (359) 101 (28%) 50 (14%) 46 (13%) 67 (19%)
10/10/53
12
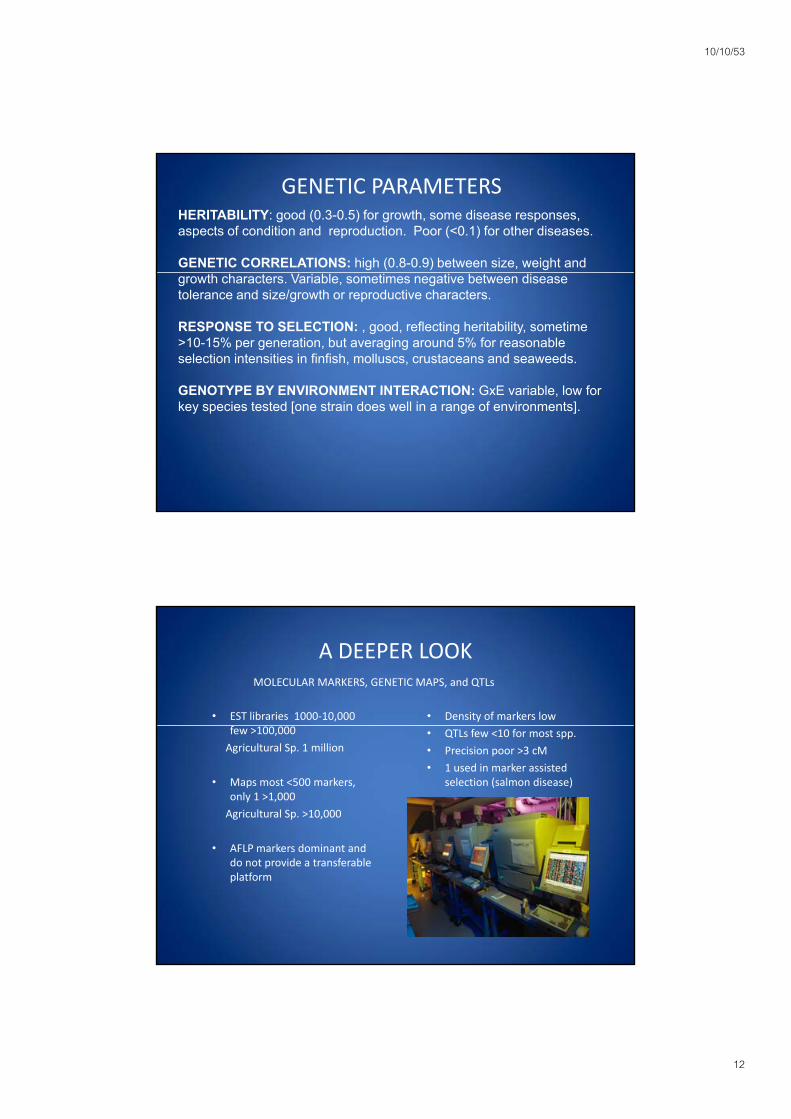
GENETIC PARAMETERSHERITABILITY: good (0.3-0.5) for growth, some disease responses, aspects of condition and reproduction. Poor (<0.1) for other diseases.
GENETIC CORRELATIONS: high (0.8-0.9) between size, weight and growth characters. Variable, sometimes negative between disease tolerance and size/growth or reproductive characters.
RESPONSE TO SELECTION: , good, reflecting heritability, sometime >10-15% per generation, but averaging around 5% for reasonable selection intensities in finfish, molluscs, crustaceans and seaweeds.
GENOTYPE BY ENVIRONMENT INTERACTION: GxE variable low forGENOTYPE BY ENVIRONMENT INTERACTION: GxE variable, low for key species tested [one strain does well in a range of environments].
A DEEPER LOOKMOLECULAR MARKERS, GENETIC MAPS, and QTLs
• EST libraries 1000-10,000 • Density of markers lowfew >100,000
Agricultural Sp. 1 million
• Maps most <500 markers, only 1 >1,000
Agricultural Sp. >10,000
AFLP k d i t d
• QTLs few <10 for most spp.
• Precision poor >3 cM
• 1 used in marker assisted selection (salmon disease)
• AFLP markers dominant and do not provide a transferable platform

10/10/53
13
A DEEPER LOOKOTHER TECHNOLOGIES
Limited penetration
Triploidy:
Salmonids (sterility)
Oysters (sterility, better growth and condition)
Gyn/Androgenesis in carp breed formation/ conservation
Cl l li 3 fi fi h ( )Clonal lines 3 spp finfish (carps)
GMOs 2 in trials
Only 1 near regulatory approval and production ready (Atlantic salmon)
A DEEPER LOOK
Few of significant scale:
10-12 finfish
3 mollusc
SELECTIVE BREEDING PROGRAMS
3 crustacean
Need integrated rearing and production technologies, distribution networks
ll h
SALMONIDSTILAPIACATFISHCARPSSEA BASSSEA BREAMSHRIMPSOYSTERAll have depended on a mix
of: government, private sector, NGOs, sustained investment
OYSTERCOD(developing)INTERNATIONAL EXCHANGE AND
COLLABORATION
NEED EFFECTIVE MECHANISMS OF EXCHANGE AND BENEFIT SHARING

10/10/53
14
UTILISATION OF GENETICS IN AQUACULTURE
• Twenty years ago <5% of aquaculture production was from genetically improved organisms
• Today it is much more (but the actual amount is difficult to estimate given
lack of statistics on strains and market penetration)
Estimates range from 38% to 73% of all production and 7% - 76% of finfish (depends on proportion of carp production assumed from improved stock - the lower figures are more realistic)
Upper limits of 15% of mollusc 67% of crustacean and 99% of seaweedUpper limits of 15% of mollusc, 67% of crustacean, and 99% of seaweedMore realistic limits of <10% of mollusc, 45% of crustacean
WILD GENETIC STRUCTURE
High genetic variationCryptic species
Geographic variationLocal adaptation

10/10/53
15
EVOLUTIONARY GENETICS
• IDENTIFYING STOCKS, ESCAPEES
• TRACKING GENE FLOW ANDTRACKING GENE FLOW AND ADAPTATION
• UNDERSTANDING RECRUITMENT, EFFECTIVE POPULATION SIZE, GENE EXCHANGE
• Variable effects of introduction• Variable effects of restocking• Evolution of a stock in culture
WILD GENETIC RESOURCE
Cultured Genetic data
on wild stock
Finfish 227 162 72%
Molluscs 77 65 84%
Crustaceans 35 28 80%
Seaweeds >20 6 30%
Total 359 261 73%Total 359 261 73%
BUT: many assay few populations, use poor markers, and assess diversity level only.
In depth studies with deep interpretation of population evolution and/or deep investigation of interaction with cultured stocks are few.

10/10/53
16
CULTURED SPECIES
Number of species cultured in each of the major taxonomic groupings for selected years between 1950 and 2006, where production was recorded for FAO statistics in that year (FAO Fish Stat Plus 2009).
DOMESTICATION AND GENETIC IMPROVEMENT
350
400
0
50
100
150
200
250
300
1 2 3 4 5 6 7
cultureddomesticatedselectively bred
1
10
100
1000
Log
num
ber o
f spe
ceis
cultured
domesticated
selectively bred
Rate: suggests 30 years for domestication, >60 for genetic improvement
11950 1960 1970 1980 1990 2000 2010

10/10/53
17
SUSTAINABLE AQUACULTURE
The responsible use and conservation of aquatic biodiversity for sustainable aquaculture requiresbiodiversity for sustainable aquaculture requires
• the use of efficient mechanisms for production: species choice, integrated technologies global cooperation; clarity of goals
• Use of technologies to minimise environmental and• Use of technologies to minimise environmental and genetic impact: containment, reduce/eliminate gene exchange, sterility;
• Conservation restocking; gene banking.
RECOMMENDATIONS1. Improve information on the state of aquatic genetic resources including
wild populations, cultured strains, rate of advance of selective breeding programs and of impacts on wild populations including theprograms, and of impacts on wild populations including the effectiveness of technologies designed to mitigate such effects.
2. Increase investment in genetic technology development with focused development of the well-founded selective breeding programs that provide the necessary foundation for application of a variety of other technologies, and their use in production.
3. Encourage exchange among the diverse groups needed to for better understanding of aquaculture and conservation activities, improved technology transfer, and effective investment and benefit sharing.
4. Continue dissemination of sound resource material and advice already available.

10/10/53
18
THANK YOU
DOMESTICATION AND GENETIC SELECTION
Domesticated Genetic
Parameters
Genetically Improved
Cross
breeding
Inter-species h b d
FOR SPECIES GIVING 99% OF PRODUCTION
Estimated hybrids
Finfish
(44)
29 17 14 8 15
Molluscs (19) 8 5 4 1 0
Crustaceans (11)
8 6 4 0 0(11)
Seaweeds (2) 2 2 2 2 2
TOTAL (76) 47 (62%) 30 (39%) 24 (32%) 11 (14%) 17 (22%)
10/10/53
19
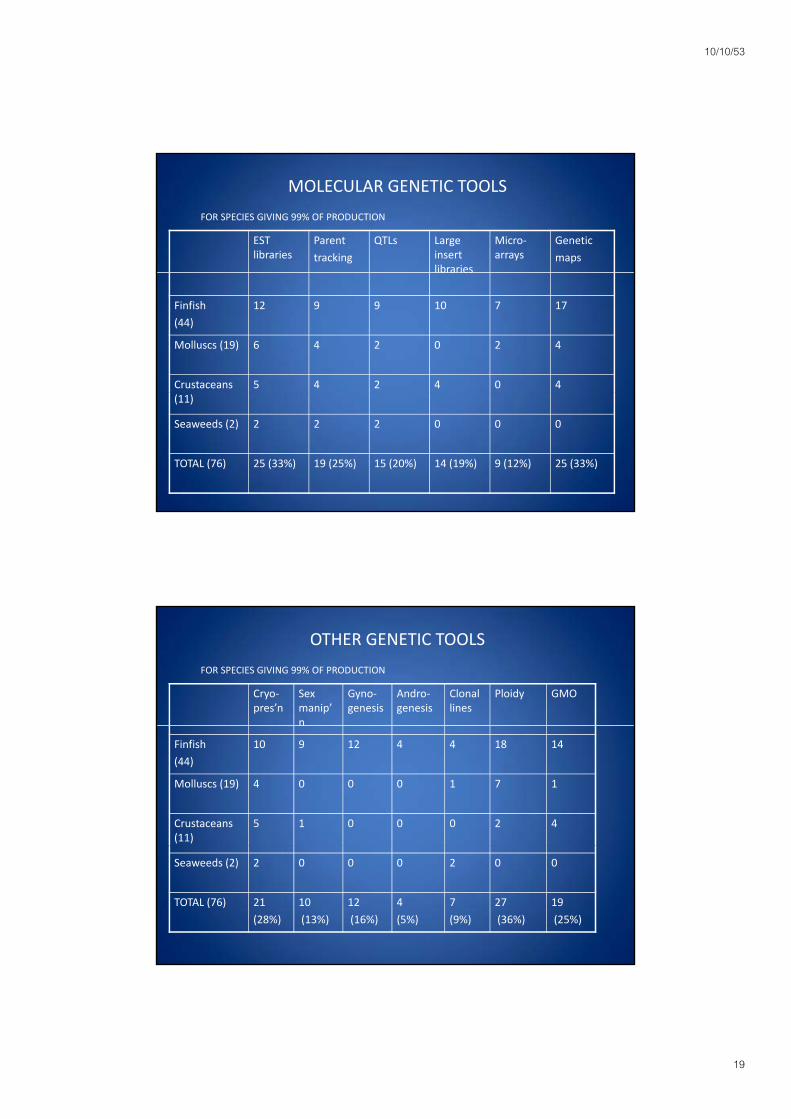
MOLECULAR GENETIC TOOLS
EST libraries
Parent
tracking
QTLs Large insert libraries
Micro-arrays
Genetic
maps
FOR SPECIES GIVING 99% OF PRODUCTION
libraries
Finfish
(44)
12 9 9 10 7 17
Molluscs (19) 6 4 2 0 2 4
Crustaceans 5 4 2 4 0 4(11)
Seaweeds (2) 2 2 2 0 0 0
TOTAL (76) 25 (33%) 19 (25%) 15 (20%) 14 (19%) 9 (12%) 25 (33%)
OTHER GENETIC TOOLS
Cryo-pres’n
Sex manip’n
Gyno-genesis
Andro-genesis
Clonal lines
Ploidy GMO
FOR SPECIES GIVING 99% OF PRODUCTION
n
Finfish
(44)
10 9 12 4 4 18 14
Molluscs (19) 4 0 0 0 1 7 1
Crustaceans (11)
5 1 0 0 0 2 4
Seaweeds (2) 2 0 0 0 2 0 0
TOTAL (76) 21
(28%)
10
(13%)
12
(16%)
4
(5%)
7
(9%)
27
(36%)
19
(25%)