Global CIO Report - Dynatrace
34
How to transform the way teams work to improve collaboration and drive better business outcomes Global CIO Report
Transcript of Global CIO Report - Dynatrace

How to transform the way teams work to improve collaboration and drive better business outcomes
Global CIO Report

©2021 Dynatrace 2Global CIO Report
Key findings
2020 was a year like no other. Organizations faced an urgent need to rapidly
pivot their go-to-market strategies and accelerate their digital transformation.
Consumer and employee demand for new digital capabilities and more connected
experiences radically impacted the way organizations deliver IT services. However,
this pressure shows no sign of abating. Already stretched IT teams need to find
new ways to collaborate with the wider business if they want to keep up and
deliver the outcomes that are expected in 2021.
This report examines the challenges IT departments face as they work to
accelerate digital innovation and keep up with the demands of the business,
its employees, and customers. These findings highlight how a platform-based
approach to multicloud observability, rooted in a common data model, can unite
teams around a single source of truth and drive better outcomes for the business.
Introduction
Organizations need to transform the way they work3
Siloed teams make it harder to succeed2
The pressure on IT continues to rise1
©2021 DynatraceGlobal CIO Report 3©2021 Dynatrace 3Global CIO Report
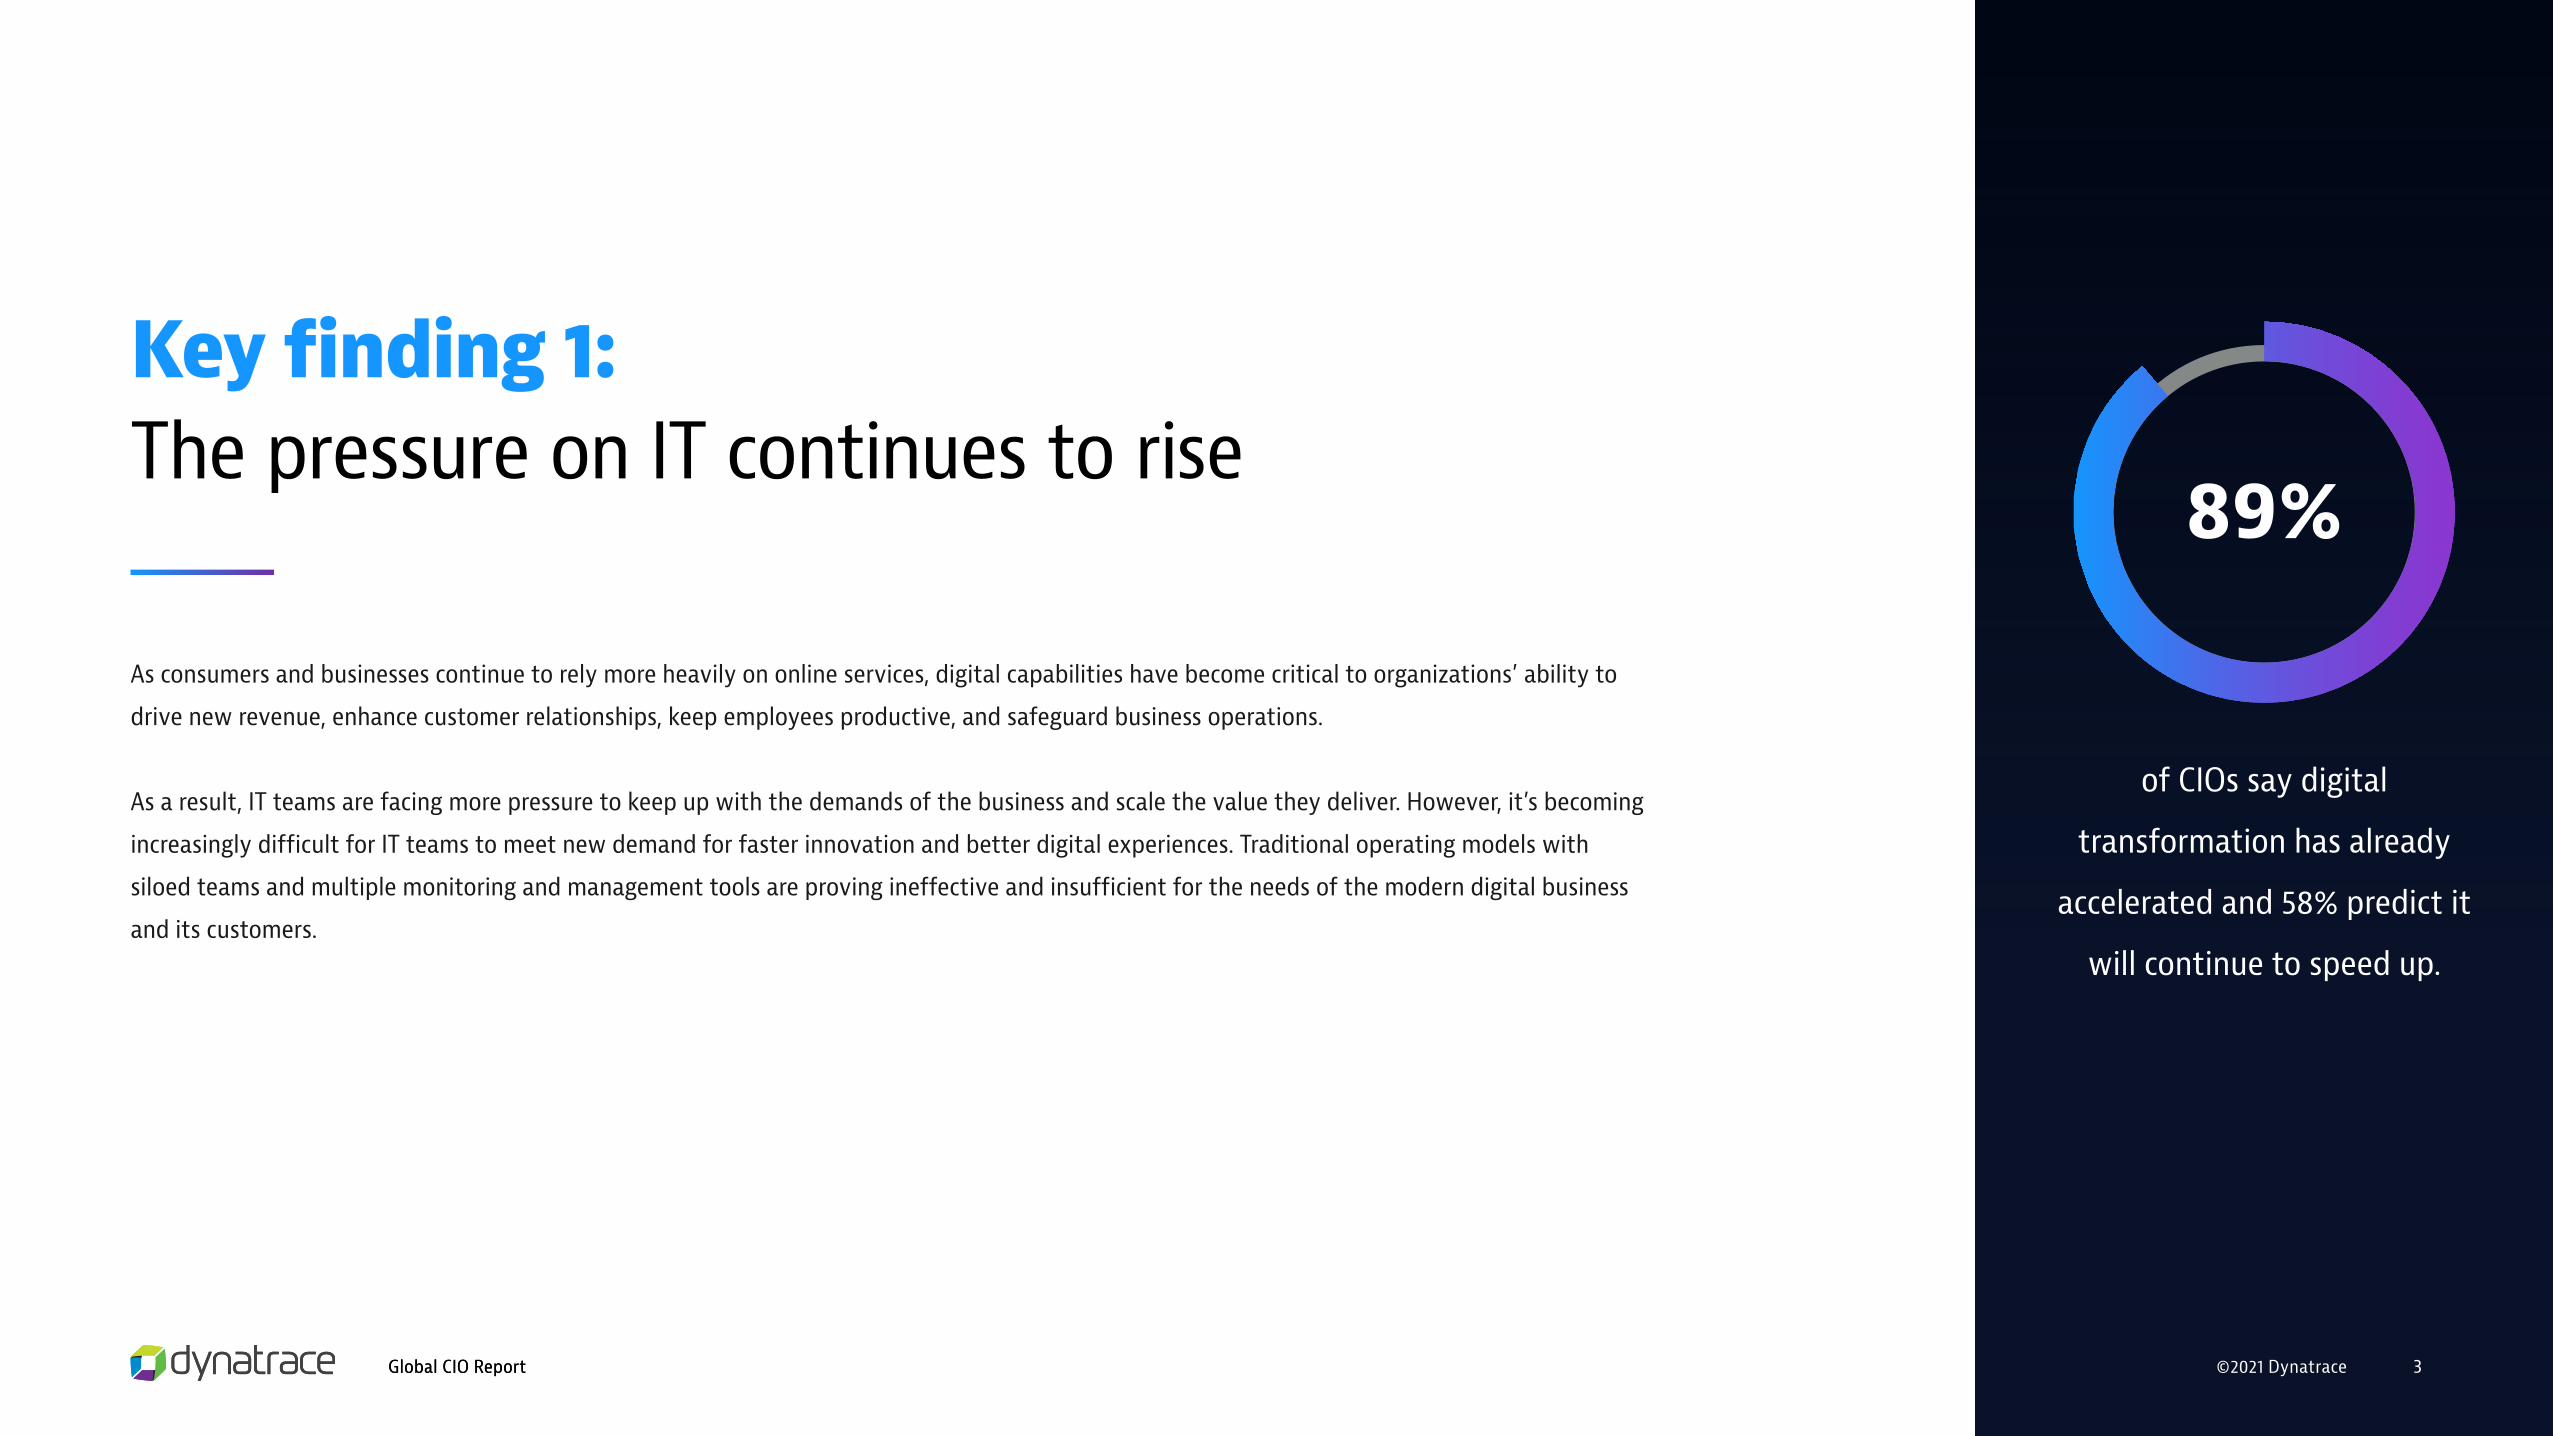
As consumers and businesses continue to rely more heavily on online services, digital capabilities have become critical to organizations’ ability to
drive new revenue, enhance customer relationships, keep employees productive, and safeguard business operations.
As a result, IT teams are facing more pressure to keep up with the demands of the business and scale the value they deliver. However, it’s becoming
increasingly difficult for IT teams to meet new demand for faster innovation and better digital experiences. Traditional operating models with
siloed teams and multiple monitoring and management tools are proving ineffective and insufficient for the needs of the modern digital business
and its customers.
of CIOs say digital
transformation has already
accelerated and 58% predict it
will continue to speed up.
89%
Key finding 1:The pressure on IT continues to rise

©2021 DynatraceGlobal CIO Report 4
Key finding 1:
The pressure on IT continues to rise
of CIOs say IT’s ability to maximize value for the business is hindered by challenges, including:
93%
IT and business teams working in silos
49% 49%Limited visibility and data into
users’ perspectives on how digital services are performing
Limited visibility into the business value that results from changes to digital services (e.g. impact of
software updates)
36%
©2021 Dynatrace 5Global CIO Report
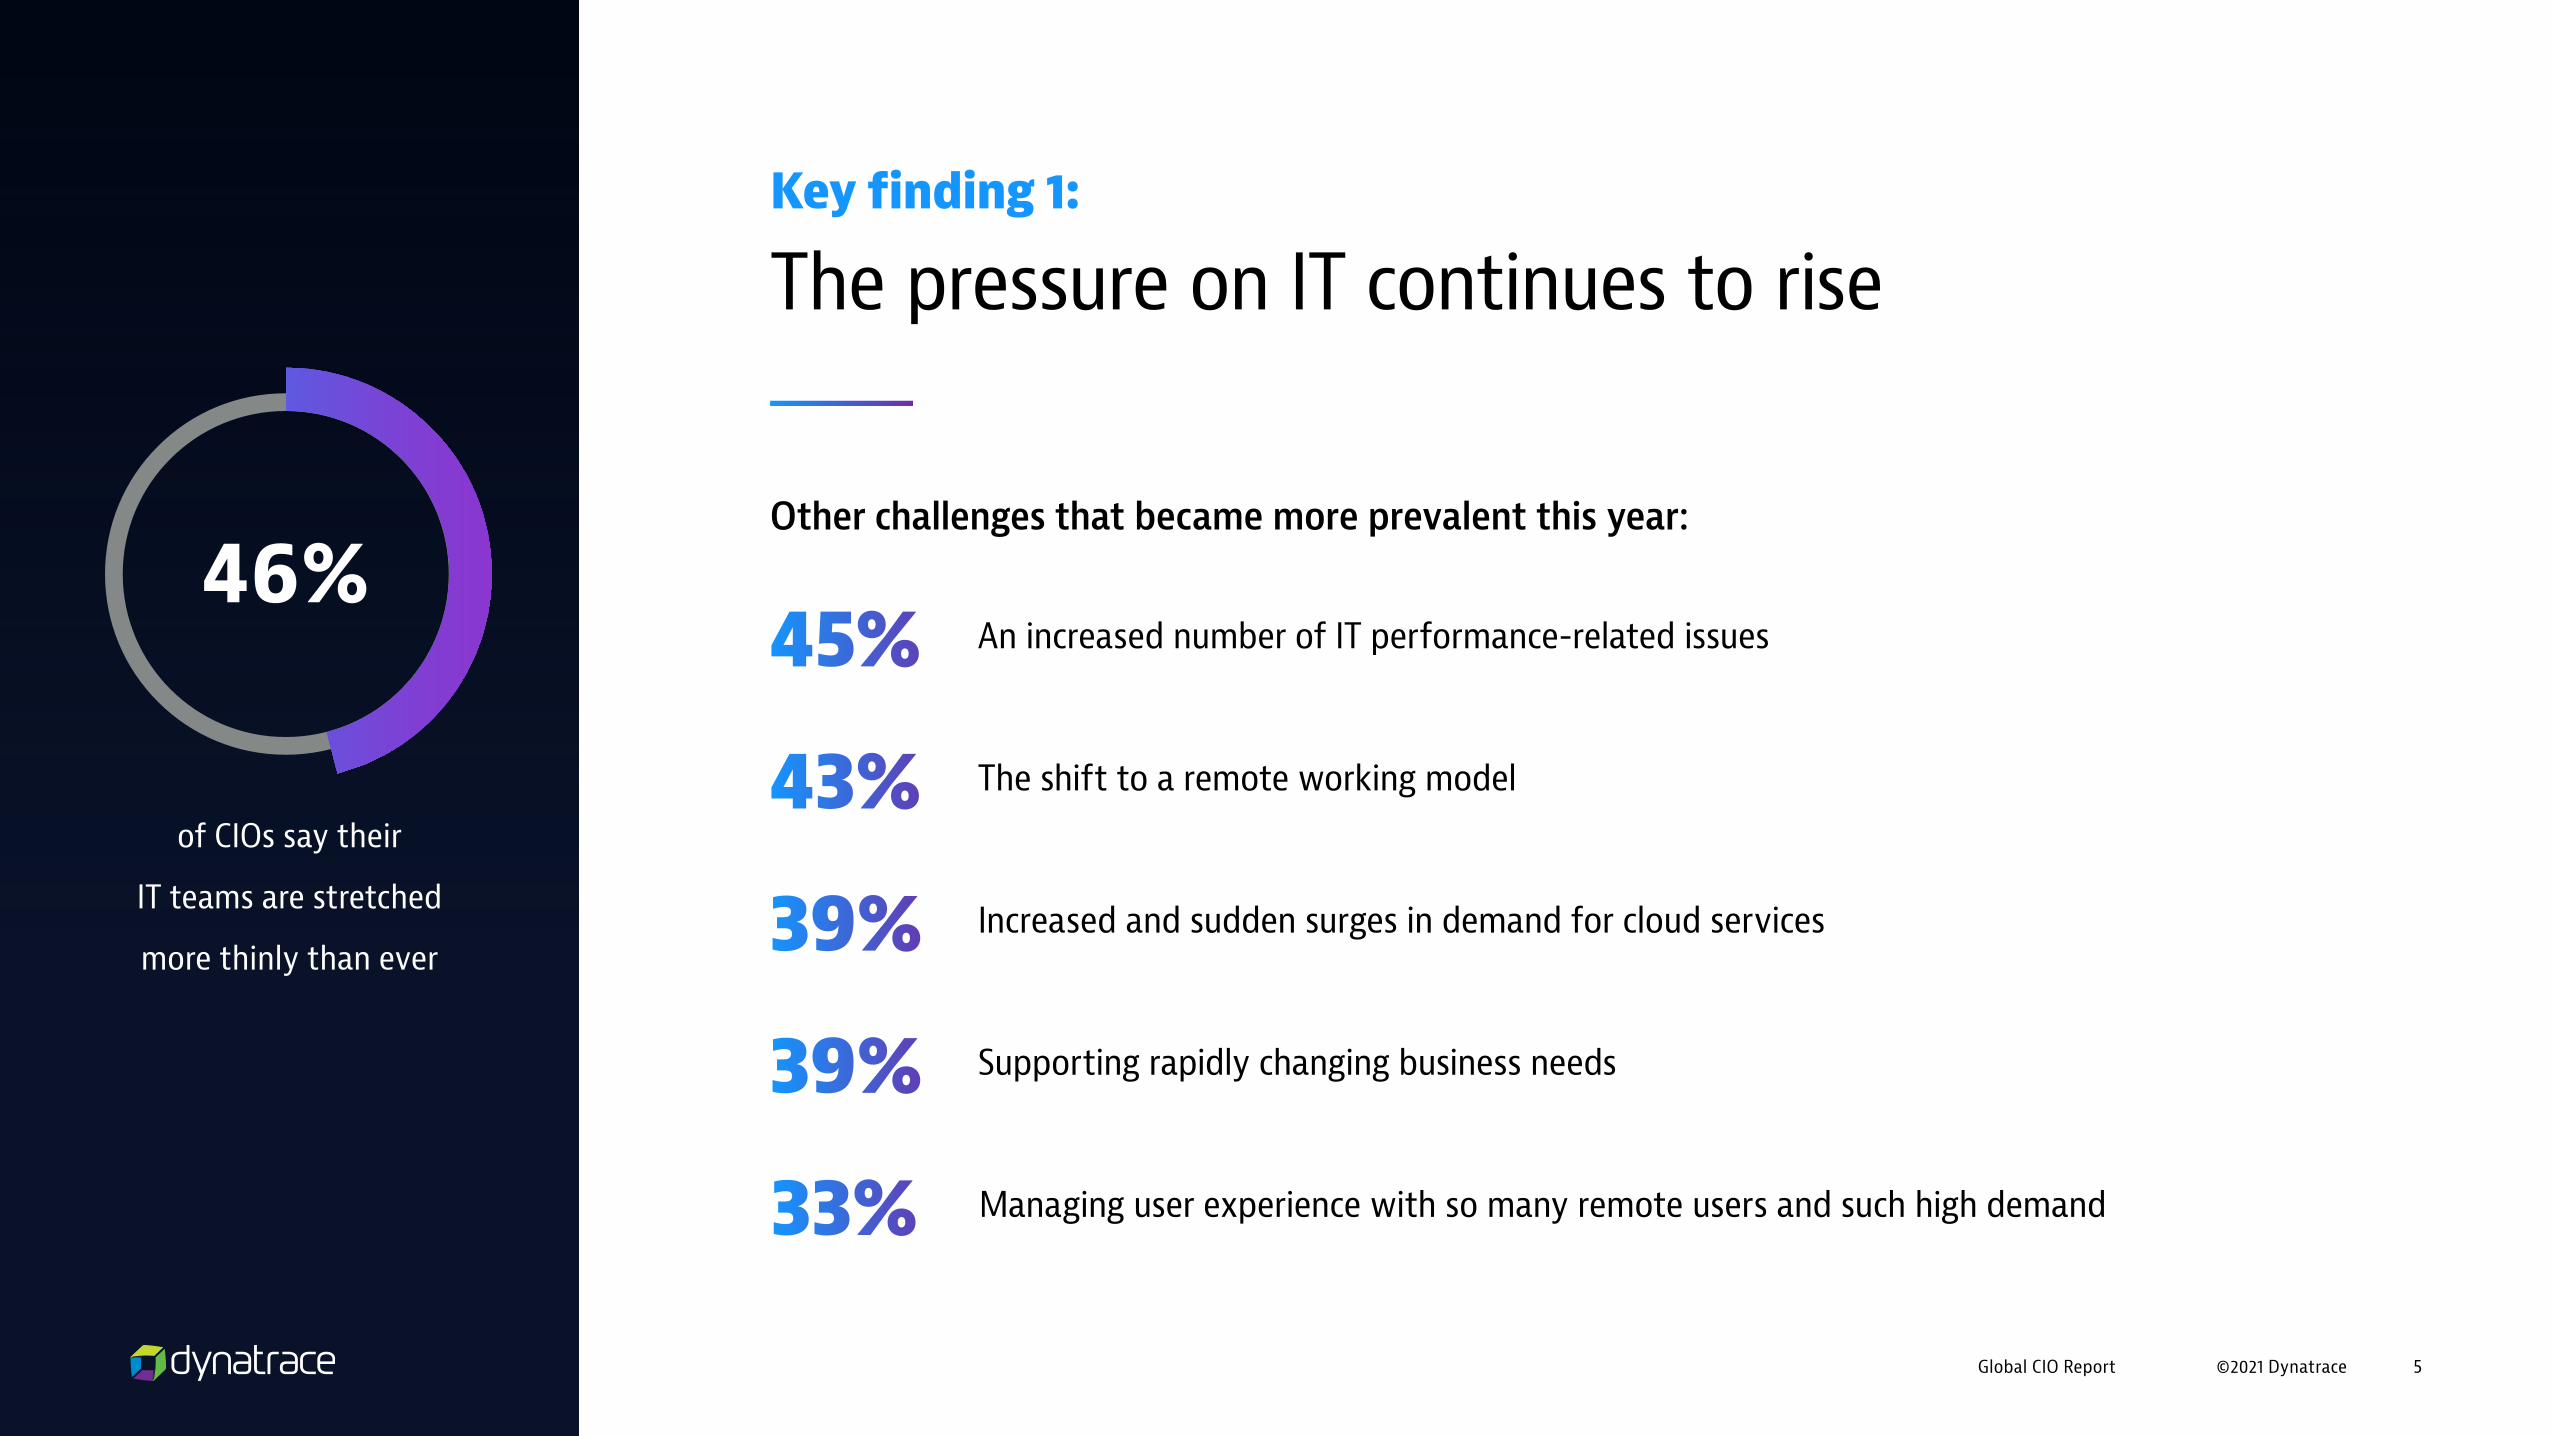
43% The shift to a remote working model
An increased number of IT performance-related issues45%
Increased and sudden surges in demand for cloud services39%Supporting rapidly changing business needs39%Managing user experience with so many remote users and such high demand33%
Key finding 1:
The pressure on IT continues to rise
of CIOs say their
IT teams are stretched
more thinly than ever
46%Other challenges that became more prevalent this year:
©2021 DynatraceGlobal CIO Report 6©2021 Dynatrace 6
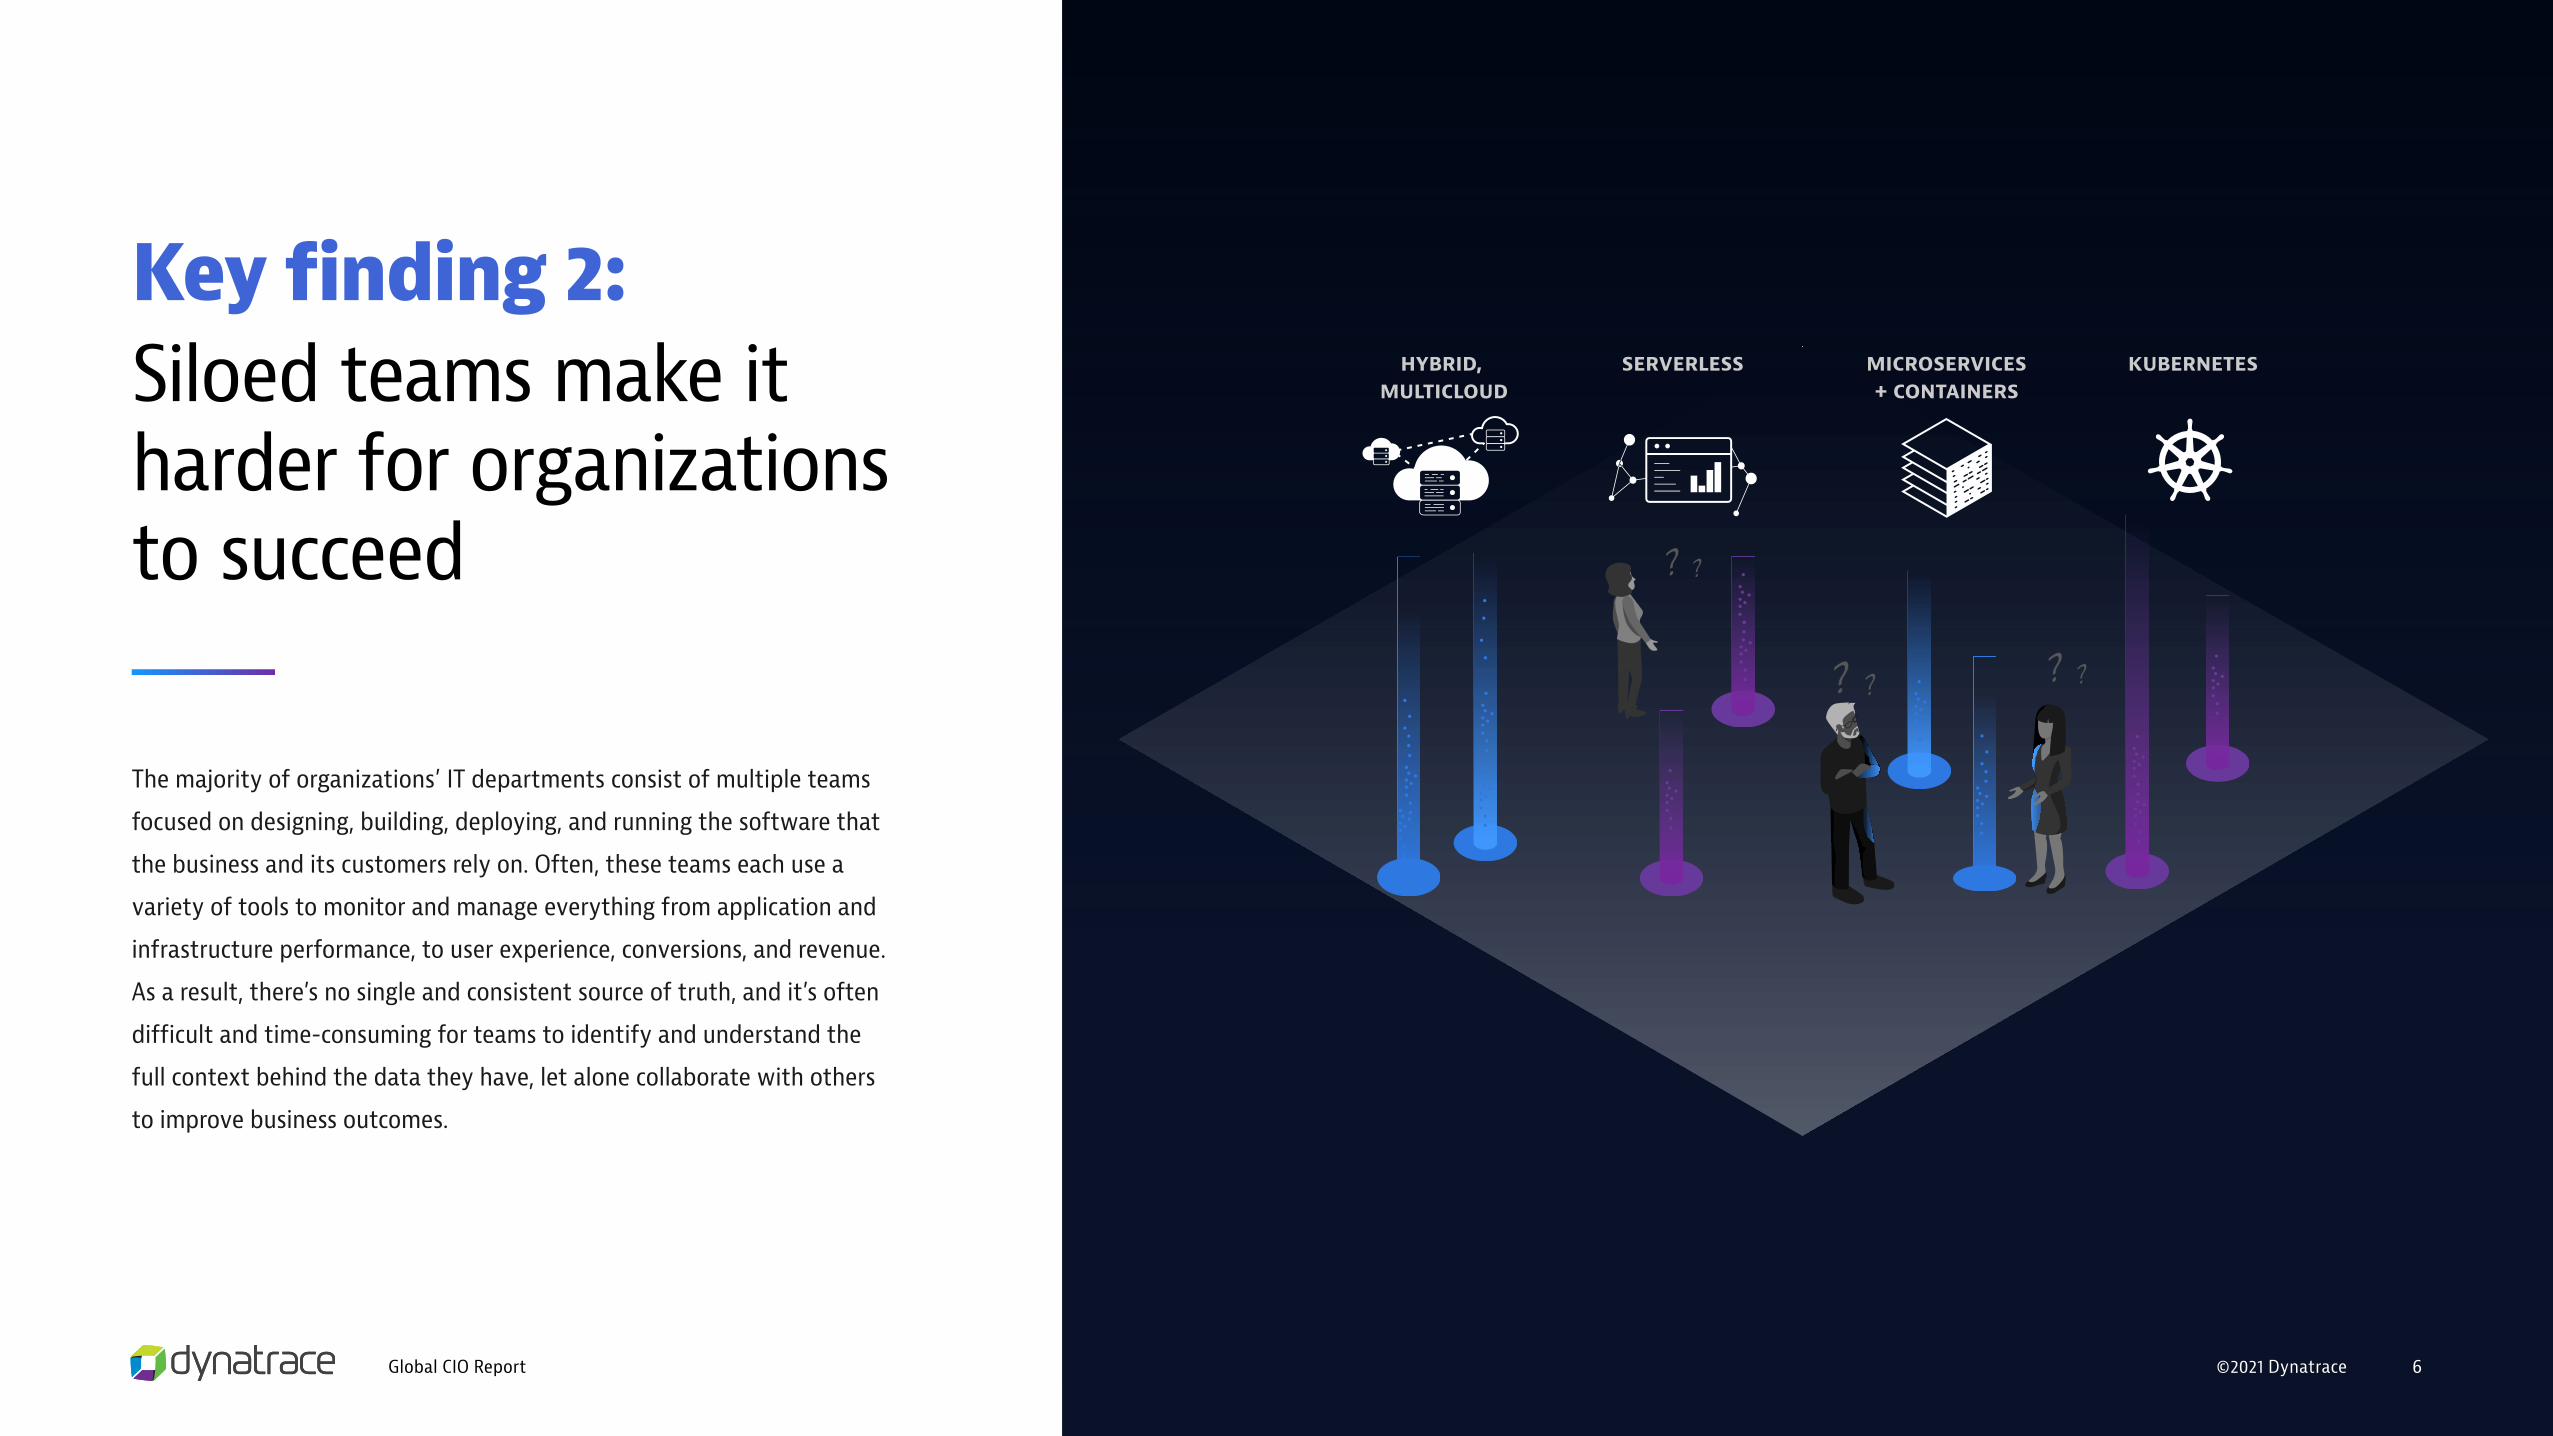
Key finding 2:Siloed teams make it harder for organizations to succeed
The majority of organizations’ IT departments consist of multiple teams
focused on designing, building, deploying, and running the software that
the business and its customers rely on. Often, these teams each use a
variety of tools to monitor and manage everything from application and
infrastructure performance, to user experience, conversions, and revenue.
As a result, there’s no single and consistent source of truth, and it’s often
difficult and time-consuming for teams to identify and understand the
full context behind the data they have, let alone collaborate with others
to improve business outcomes.
? ?
? ?
? ?
HYBRID, MULTICLOUD
MICROSERVICES+ CONTAINERS
SERVERLESS KUBERNETES

©2021 DynatraceGlobal CIO Report 7
Key finding 2:
Siloed teams make it harder for organizations to succeed
of CIOs say IT and business
teams work in silos
49%
of CIOs say limited collaboration across
BizDevOps teams disrupts IT’s ability to
respond quickly to sudden changes in
business needs
40%

©2021 DynatraceGlobal CIO Report 8©2021 DynatraceGlobal CIO Report 8
Key finding 2:
Siloed teams make it harder for organizations to succeed
40% Greater inefficiency in IT due to time wasted in war rooms or different teams playing ‘the blame game’
More difficulty identifying the severity of an issue and minimizing the overall business impact40%
Harder to understand whether the IT stack is delivering the service levels that are anticipated or required for business success39%
Inability to fully understand what the business and our customers need, making it difficult to maximize the business value of IT36%Lost revenues/conversions due to mistakes that could have been avoided31%
Other negative effects of limited collaboration between IT and business teams:
©2021 DynatraceGlobal CIO Report 9©2021 DynatraceGlobal CIO Report 9
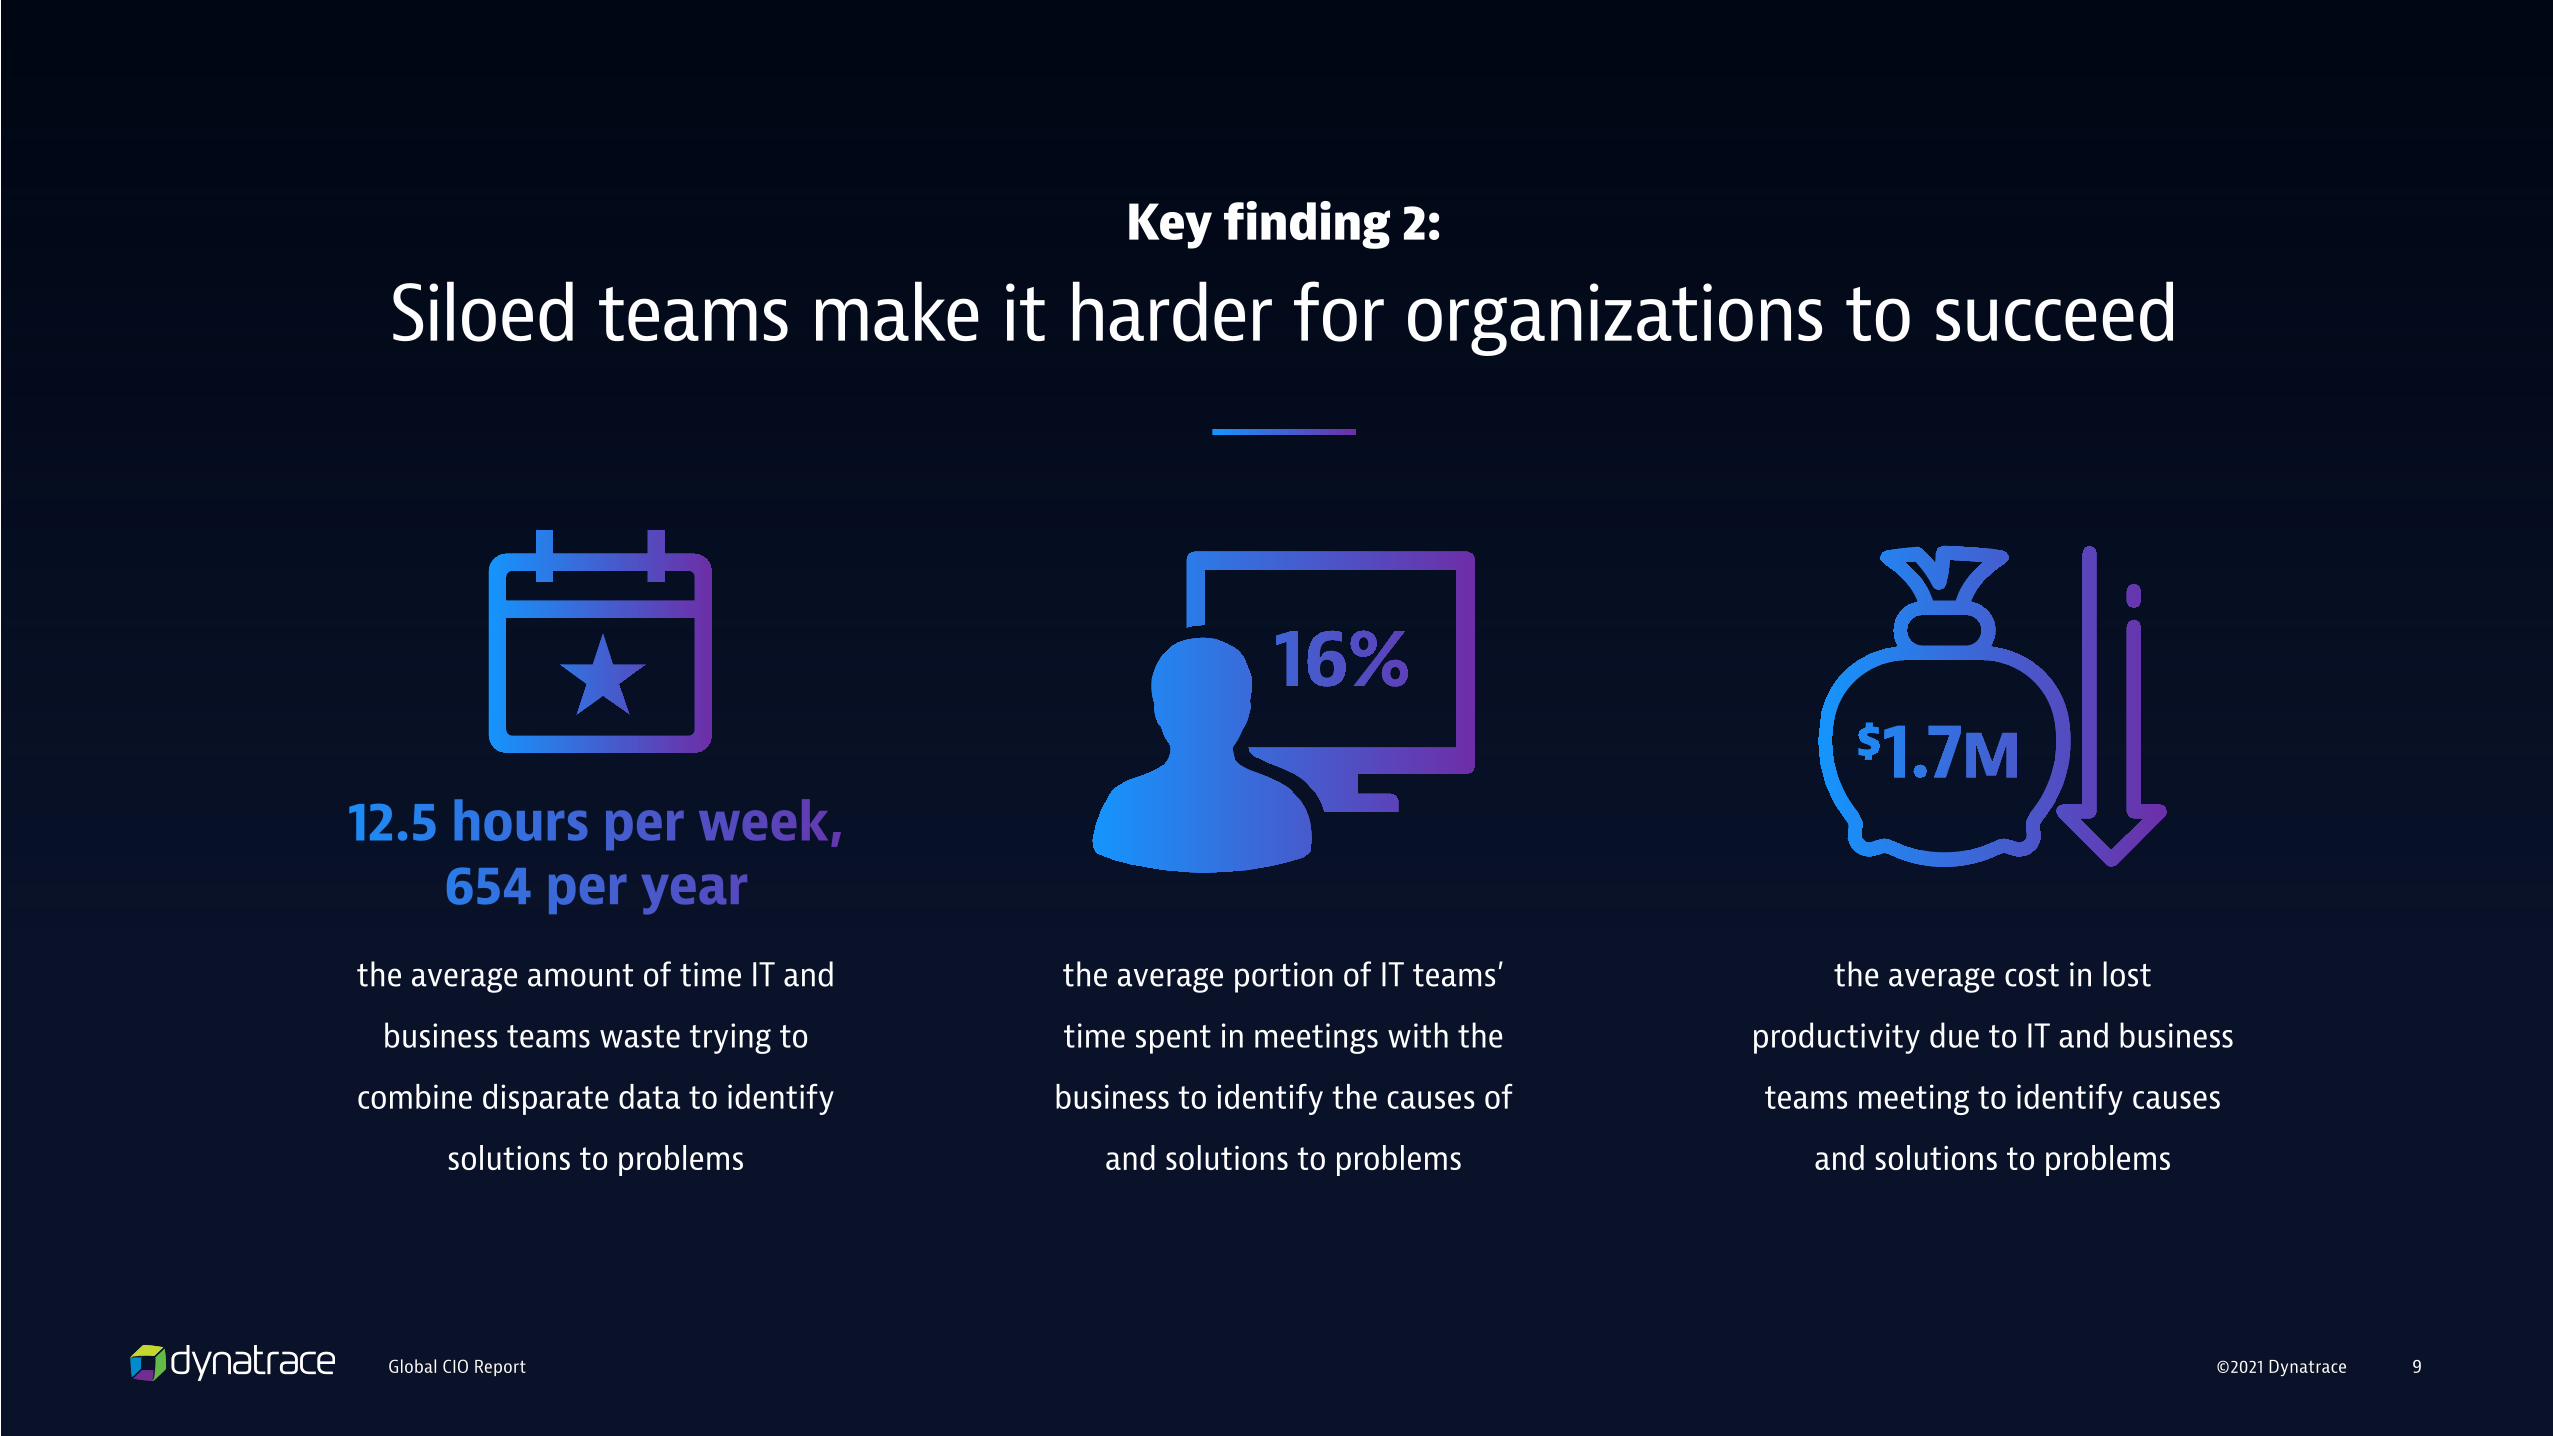
the average portion of IT teams’
time spent in meetings with the
business to identify the causes of
and solutions to problems
the average amount of time IT and
business teams waste trying to
combine disparate data to identify
solutions to problems
the average cost in lost
productivity due to IT and business
teams meeting to identify causes
and solutions to problems
Key finding 2:
Siloed teams make it harder for organizations to succeed
12.5 hours per week, 654 per year

©2021 DynatraceGlobal CIO Report 10©2021 Dynatrace 10
Key finding 3:Organizations need to transform the way they work
As the pressure to accelerate digital transformation continues to increase,
there’s no time for guessing or finger-pointing. To maintain productivity,
meet customer demands, and keep up with the competition, organizations
need to transform the way their teams work — enabling them to innovate
faster, collaborate more efficiently, and deliver greater business value. They
need to break down the silos between IT and the business, and bring their
teams together with a single, unifying language that enables more effective
collaboration.
of CIOs say IT investment
decisions need to be more
data-driven to ensure
maximum benefit to the
business as well as end-users
95%
of CIOs say they are fed
up with the need to piece
together data from multiple
tools to assess the impact of IT
investments on the business
74%
of organizations have a
single platform that enables
cross-team collaboration
and a true understanding of
IT’s business impact
14%
BUT JUST...
©2021 DynatraceGlobal CIO Report 11©2021 Dynatrace 11Global CIO Report
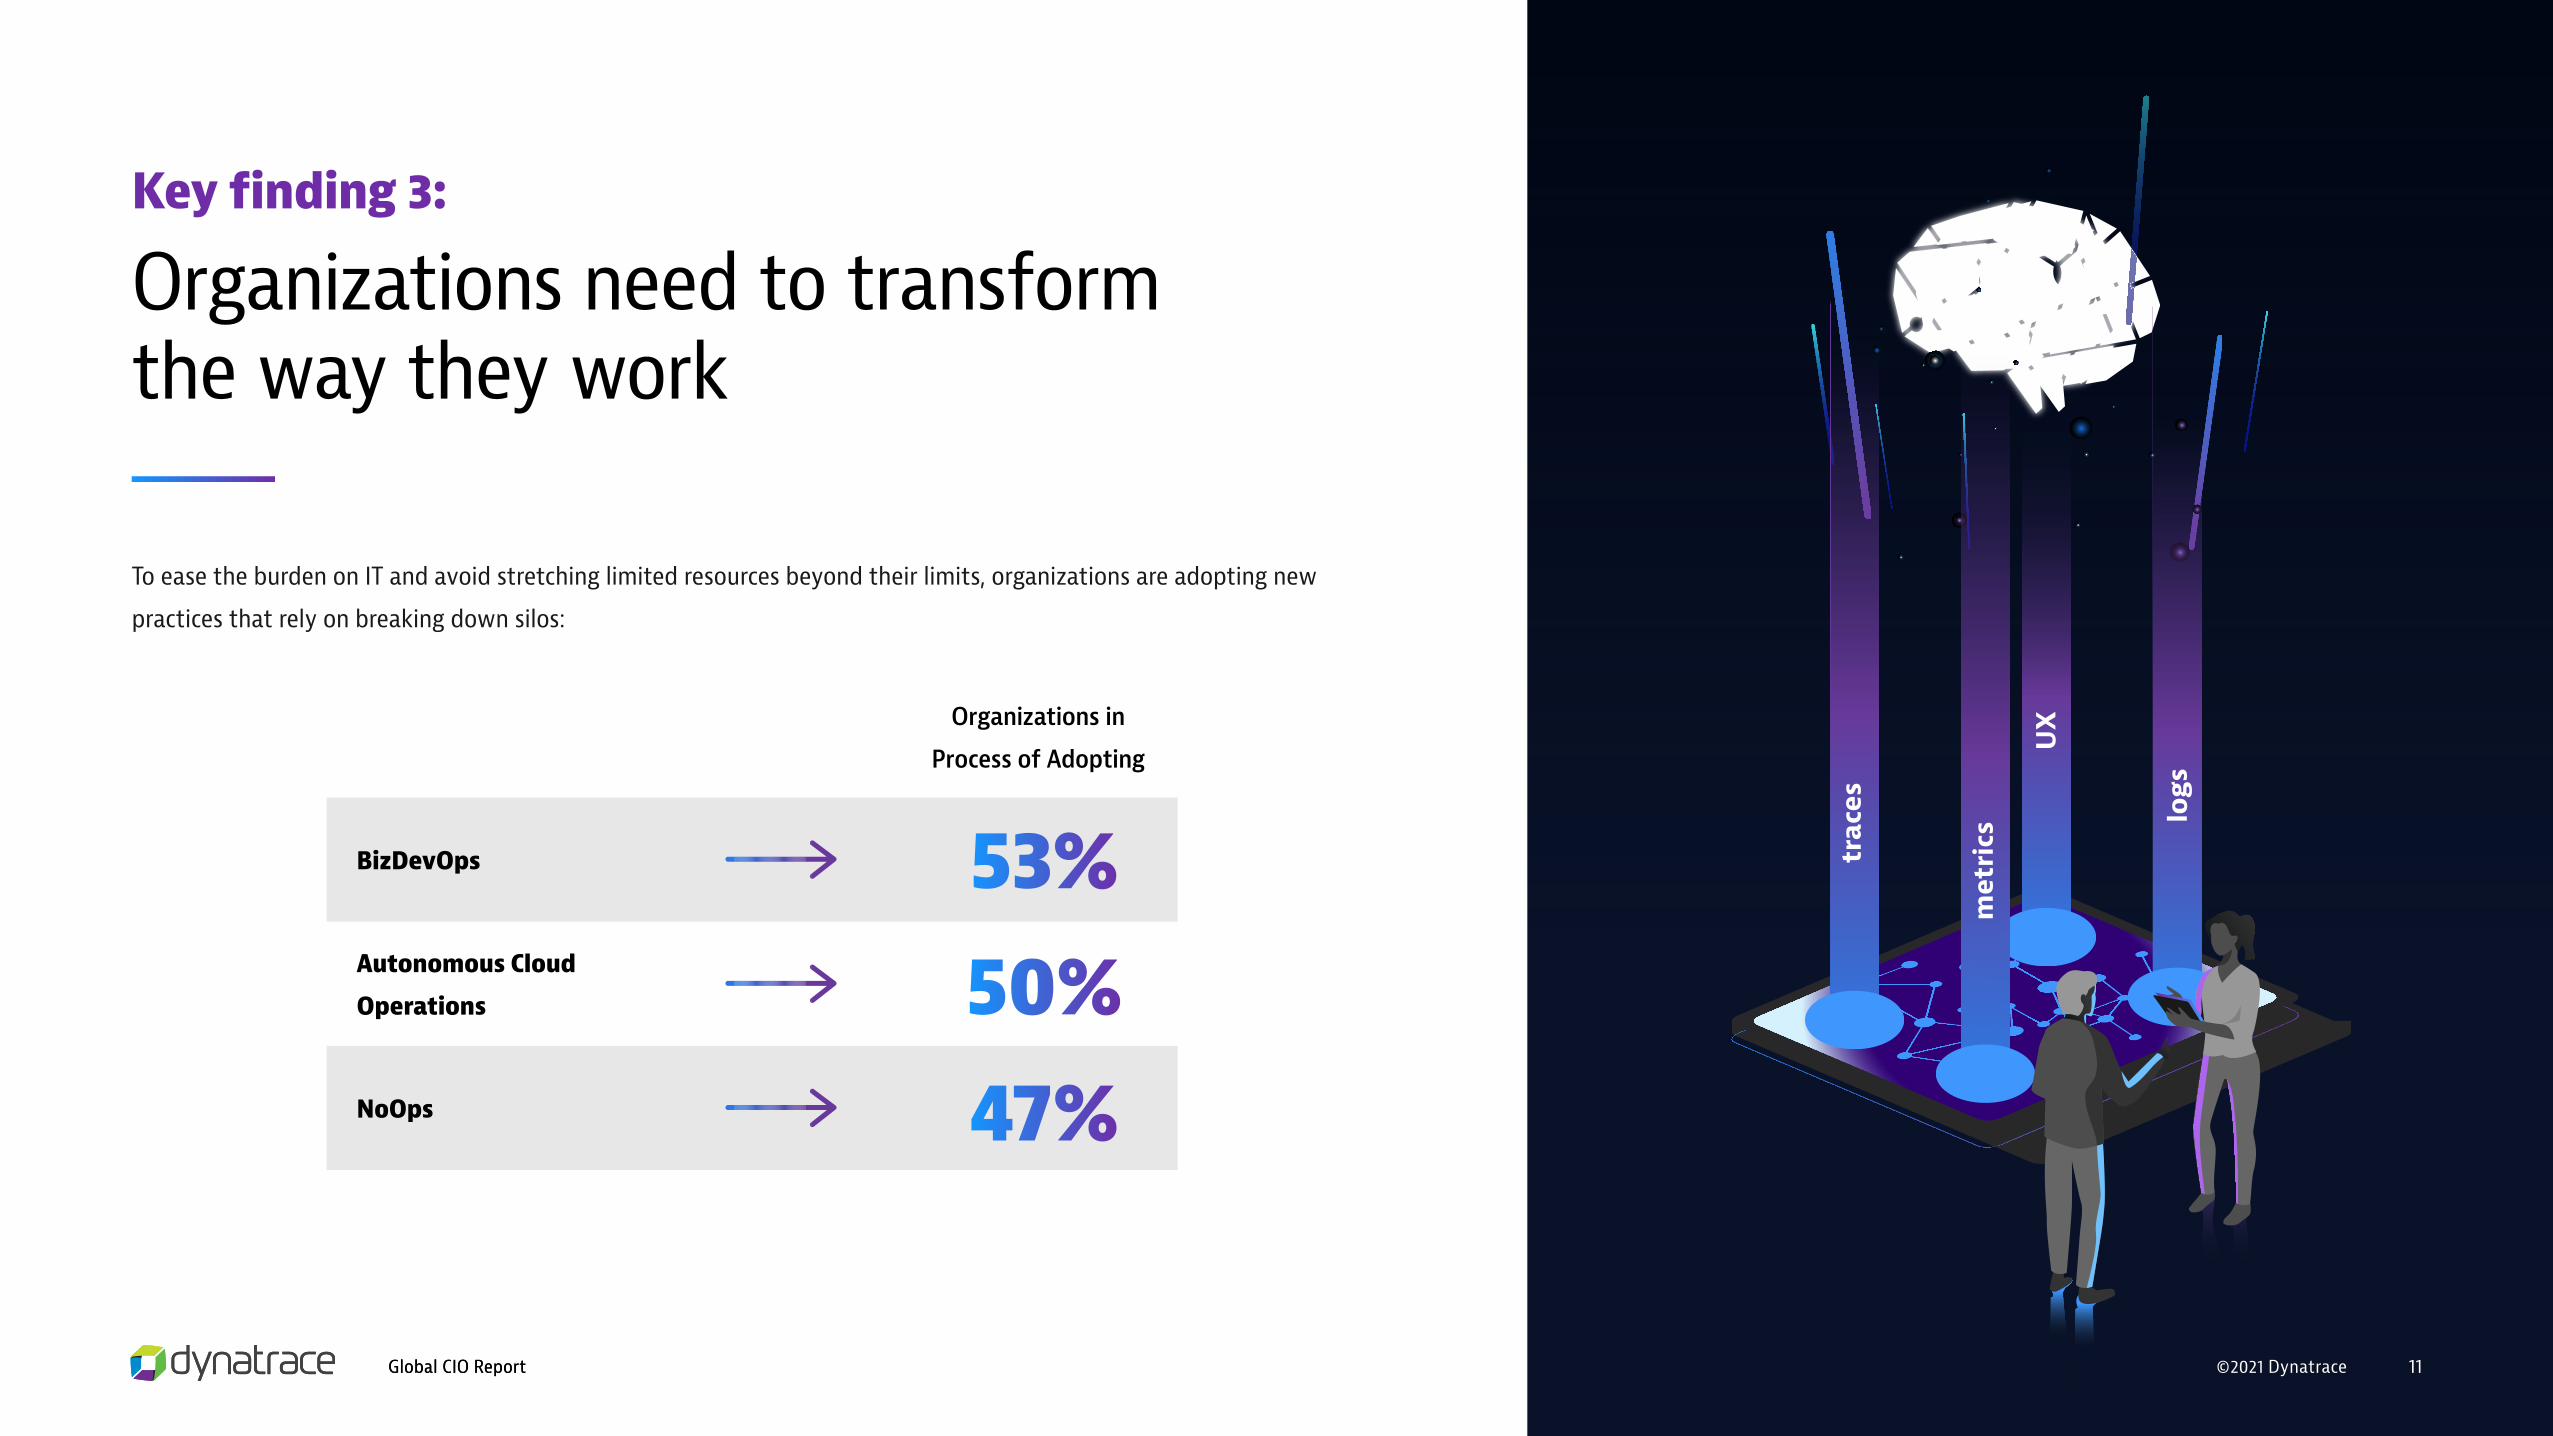
Key finding 3:
Organizations need to transform the way they work
logs
trac
es
UX
met
rics
To ease the burden on IT and avoid stretching limited resources beyond their limits, organizations are adopting new
practices that rely on breaking down silos:
Organizations in
Process of Adopting
BizDevOps
Autonomous Cloud
Operations
NoOps
53%50%47%
©2021 DynatraceGlobal CIO Report 12©2021 DynatraceGlobal CIO Report 12
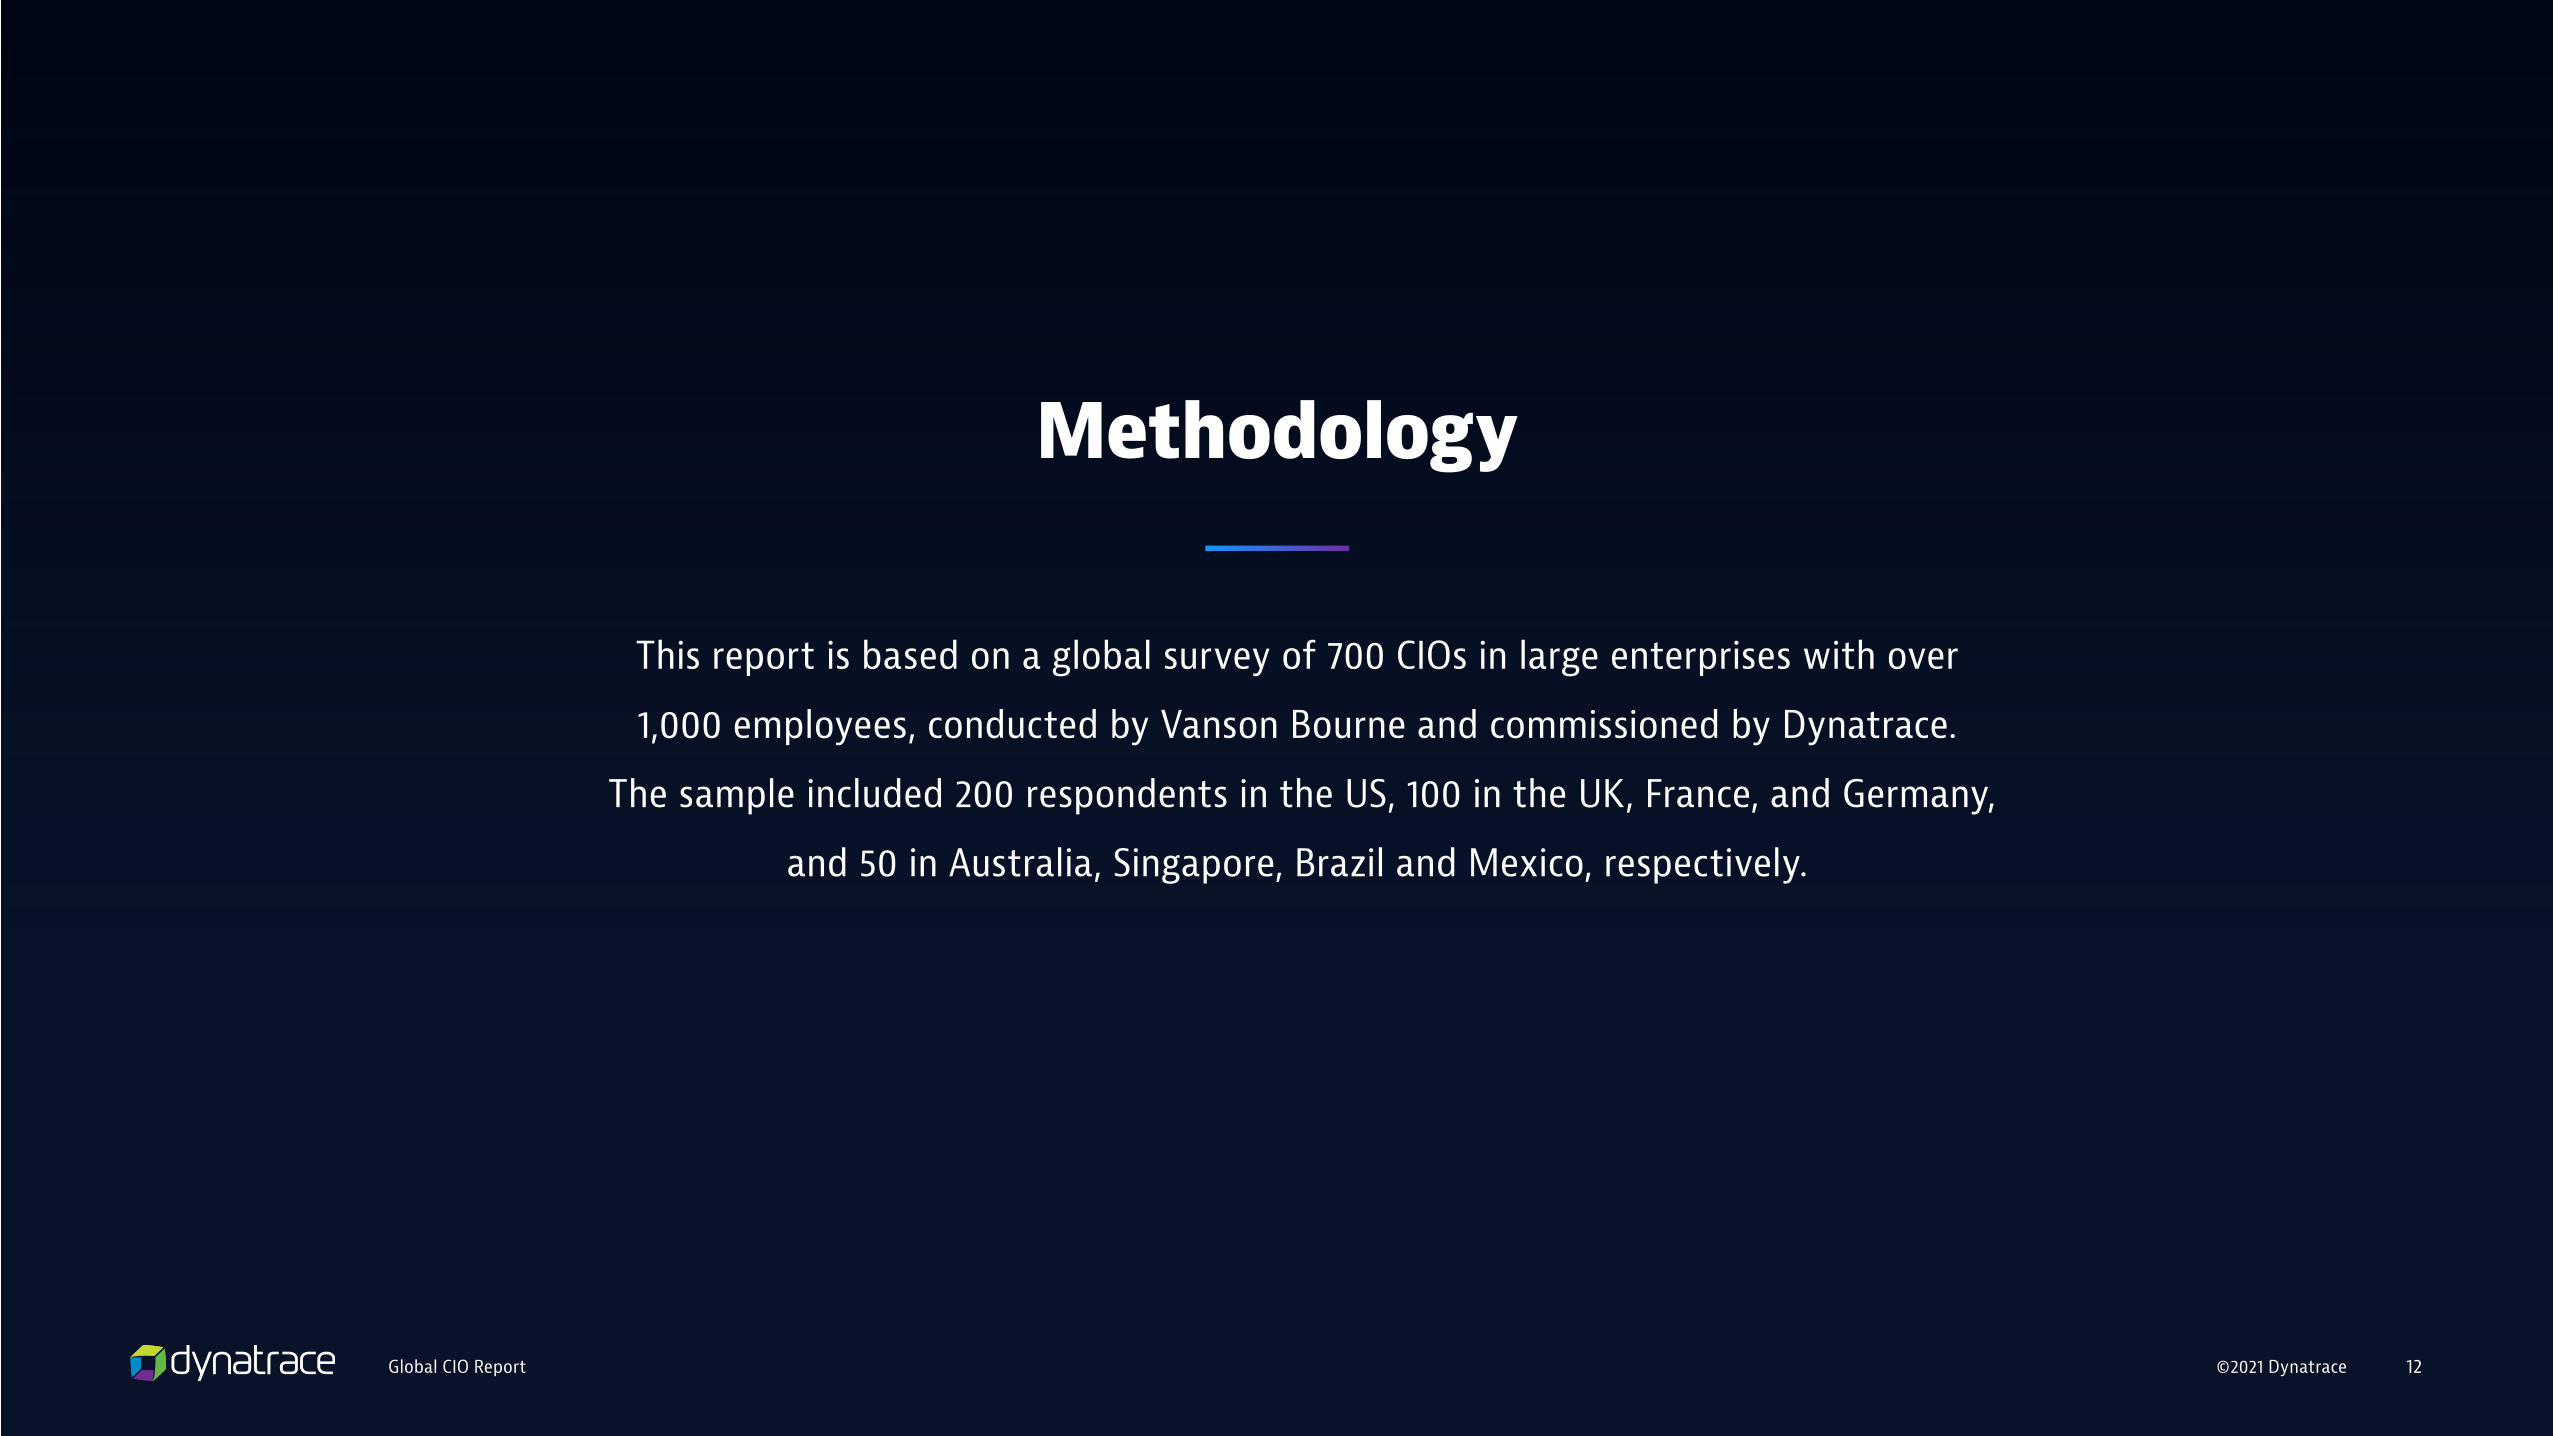
Methodology
This report is based on a global survey of 700 CIOs in large enterprises with over
1,000 employees, conducted by Vanson Bourne and commissioned by Dynatrace.
The sample included 200 respondents in the US, 100 in the UK, France, and Germany,
and 50 in Australia, Singapore, Brazil and Mexico, respectively.
©2021 DynatraceGlobal CIO Report 13©2021 DynatraceGlobal CIO Report 13
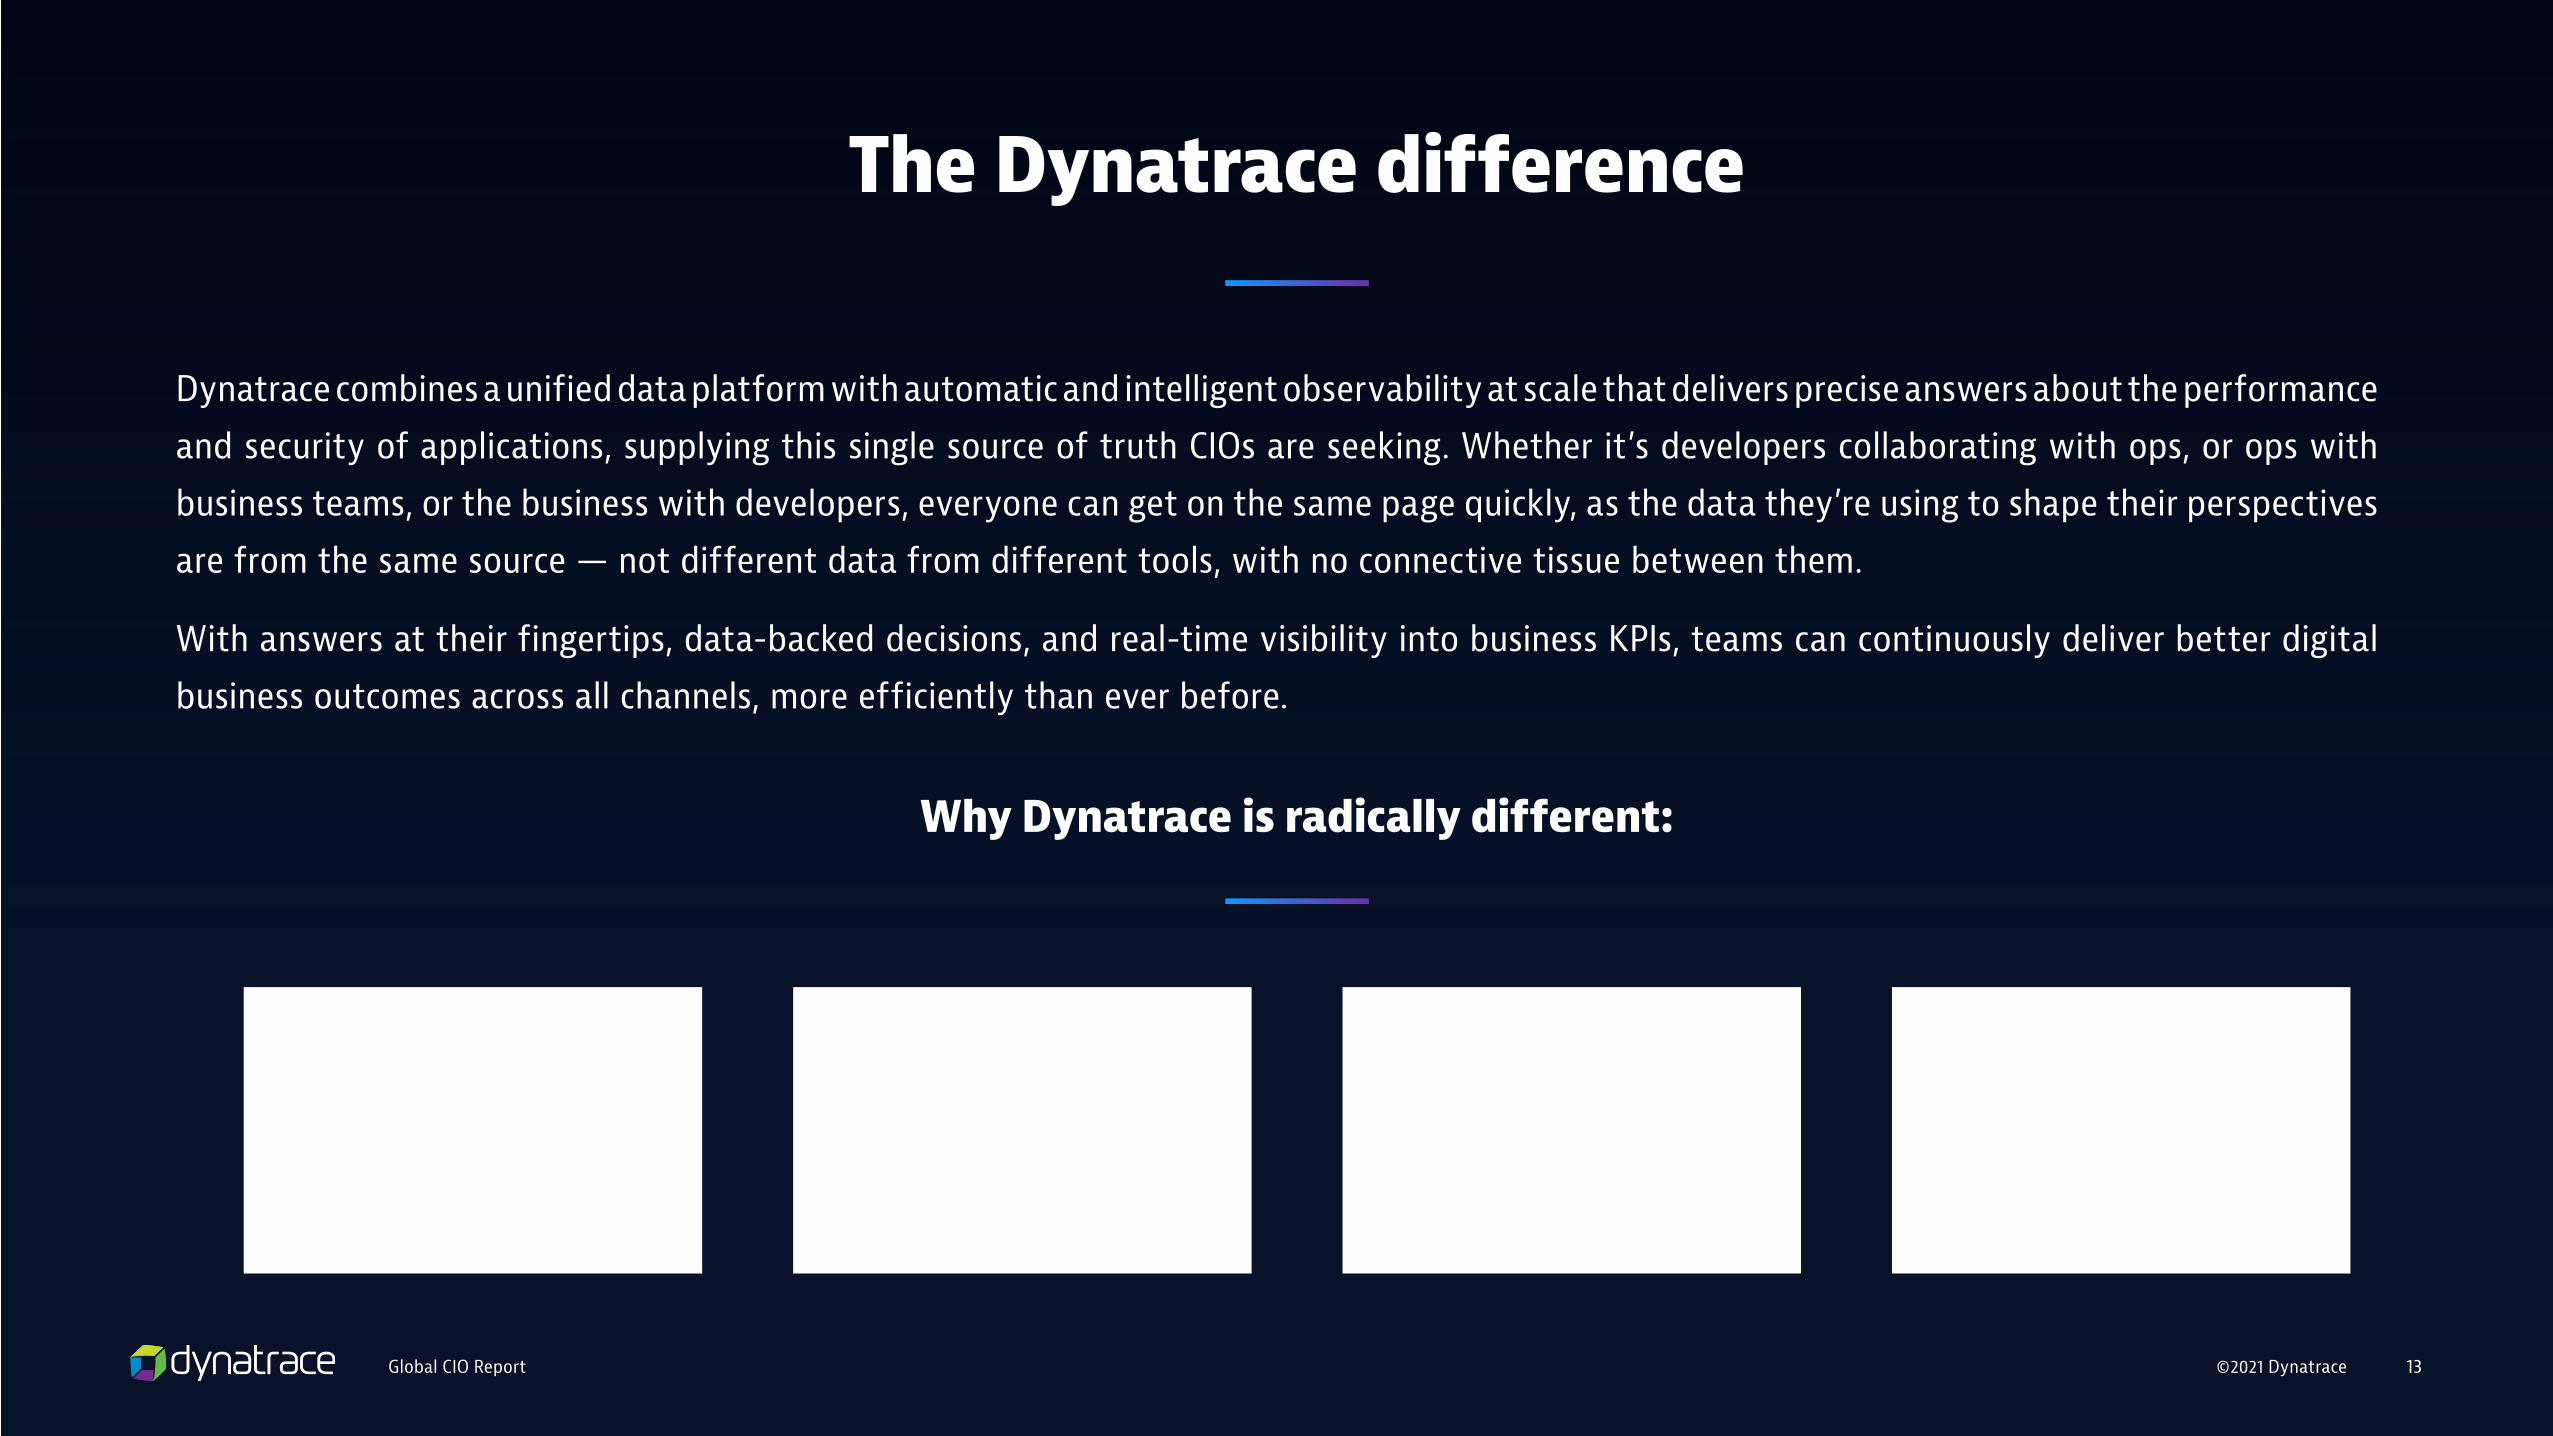
The Dynatrace difference
Dynatrace combines a unified data platform with automatic and intelligent observability at scale that delivers precise answers about the performance
and security of applications, supplying this single source of truth CIOs are seeking. Whether it’s developers collaborating with ops, or ops with
business teams, or the business with developers, everyone can get on the same page quickly, as the data they’re using to shape their perspectives
are from the same source — not different data from different tools, with no connective tissue between them.
With answers at their fingertips, data-backed decisions, and real-time visibility into business KPIs, teams can continuously deliver better digital
business outcomes across all channels, more efficiently than ever before.
Why Dynatrace is radically different:
Automatic
Zero-touch configuration, continuous discovery and topology mapping in real-time, instant answers and
precise causation.
Full-stack
Explainable AI engine, Davis™, which is built into the core of the Dynatrace® platform,
processes billions of dependencies for instantly precise answers, — prioritized by business
impact and with root-cause determinization.
Intelligent
Understand all the relationships and interdependencies, top to
bottom, from end-user experience to infrastructure health.
Enterprise-scale
Scale out cloud-native architecture, role-based governance for large global teams, and automatic enterprise-wide
deployment.

©2021 DynatraceGlobal CIO Report 14
Appendix
Country CIOs say the challenges they face became more prevalent in 2020
CIOs say that IT’s ability to maximize value for the business is hindered by challenges
US 96% 90%
UK 98% 94%
France 99% 94%
Germany 99% 99%
Australia 100% 96%
Singapore 100% 94%
Brazil 98% 90%
Mexico 96% 92%
Global Data Summary

©2021 DynatraceGlobal CIO Report 15
Appendix
Challenge
IT teams being stretched more thinly than ever 43%
An increased number of IT performance-related issues 41%
The shift to a remote working model 37%
Increased and sudden surges in demand for cloud services 39%
Supporting rapidly changing business needs 40%
Managing user-experience with so many remote users and such high demand 33%
US
Challenge
IT teams being stretched more thinly than ever 45%
An increased number of IT performance-related issues 39%
The shift to a remote working model 46%
Increased and sudden surges in demand for cloud services 39%
Supporting rapidly changing business needs 37%
Managing user-experience with so many remote users and such high demand 35%
UK

©2021 DynatraceGlobal CIO Report 16
Appendix
Challenge
IT teams being stretched more thinly than ever 37%
An increased number of IT performance-related issues 39%
The shift to a remote working model 44%
Increased and sudden surges in demand for cloud services 38%
Supporting rapidly changing business needs 44%
Managing user-experience with so many remote users and such high demand 30%
France
Challenge
IT teams being stretched more thinly than ever 42%
An increased number of IT performance-related issues 51%
The shift to a remote working model 35%
Increased and sudden surges in demand for cloud services 42%
Supporting rapidly changing business needs 34%
Managing user-experience with so many remote users and such high demand 32%
Germany
©2021 DynatraceGlobal CIO Report 17
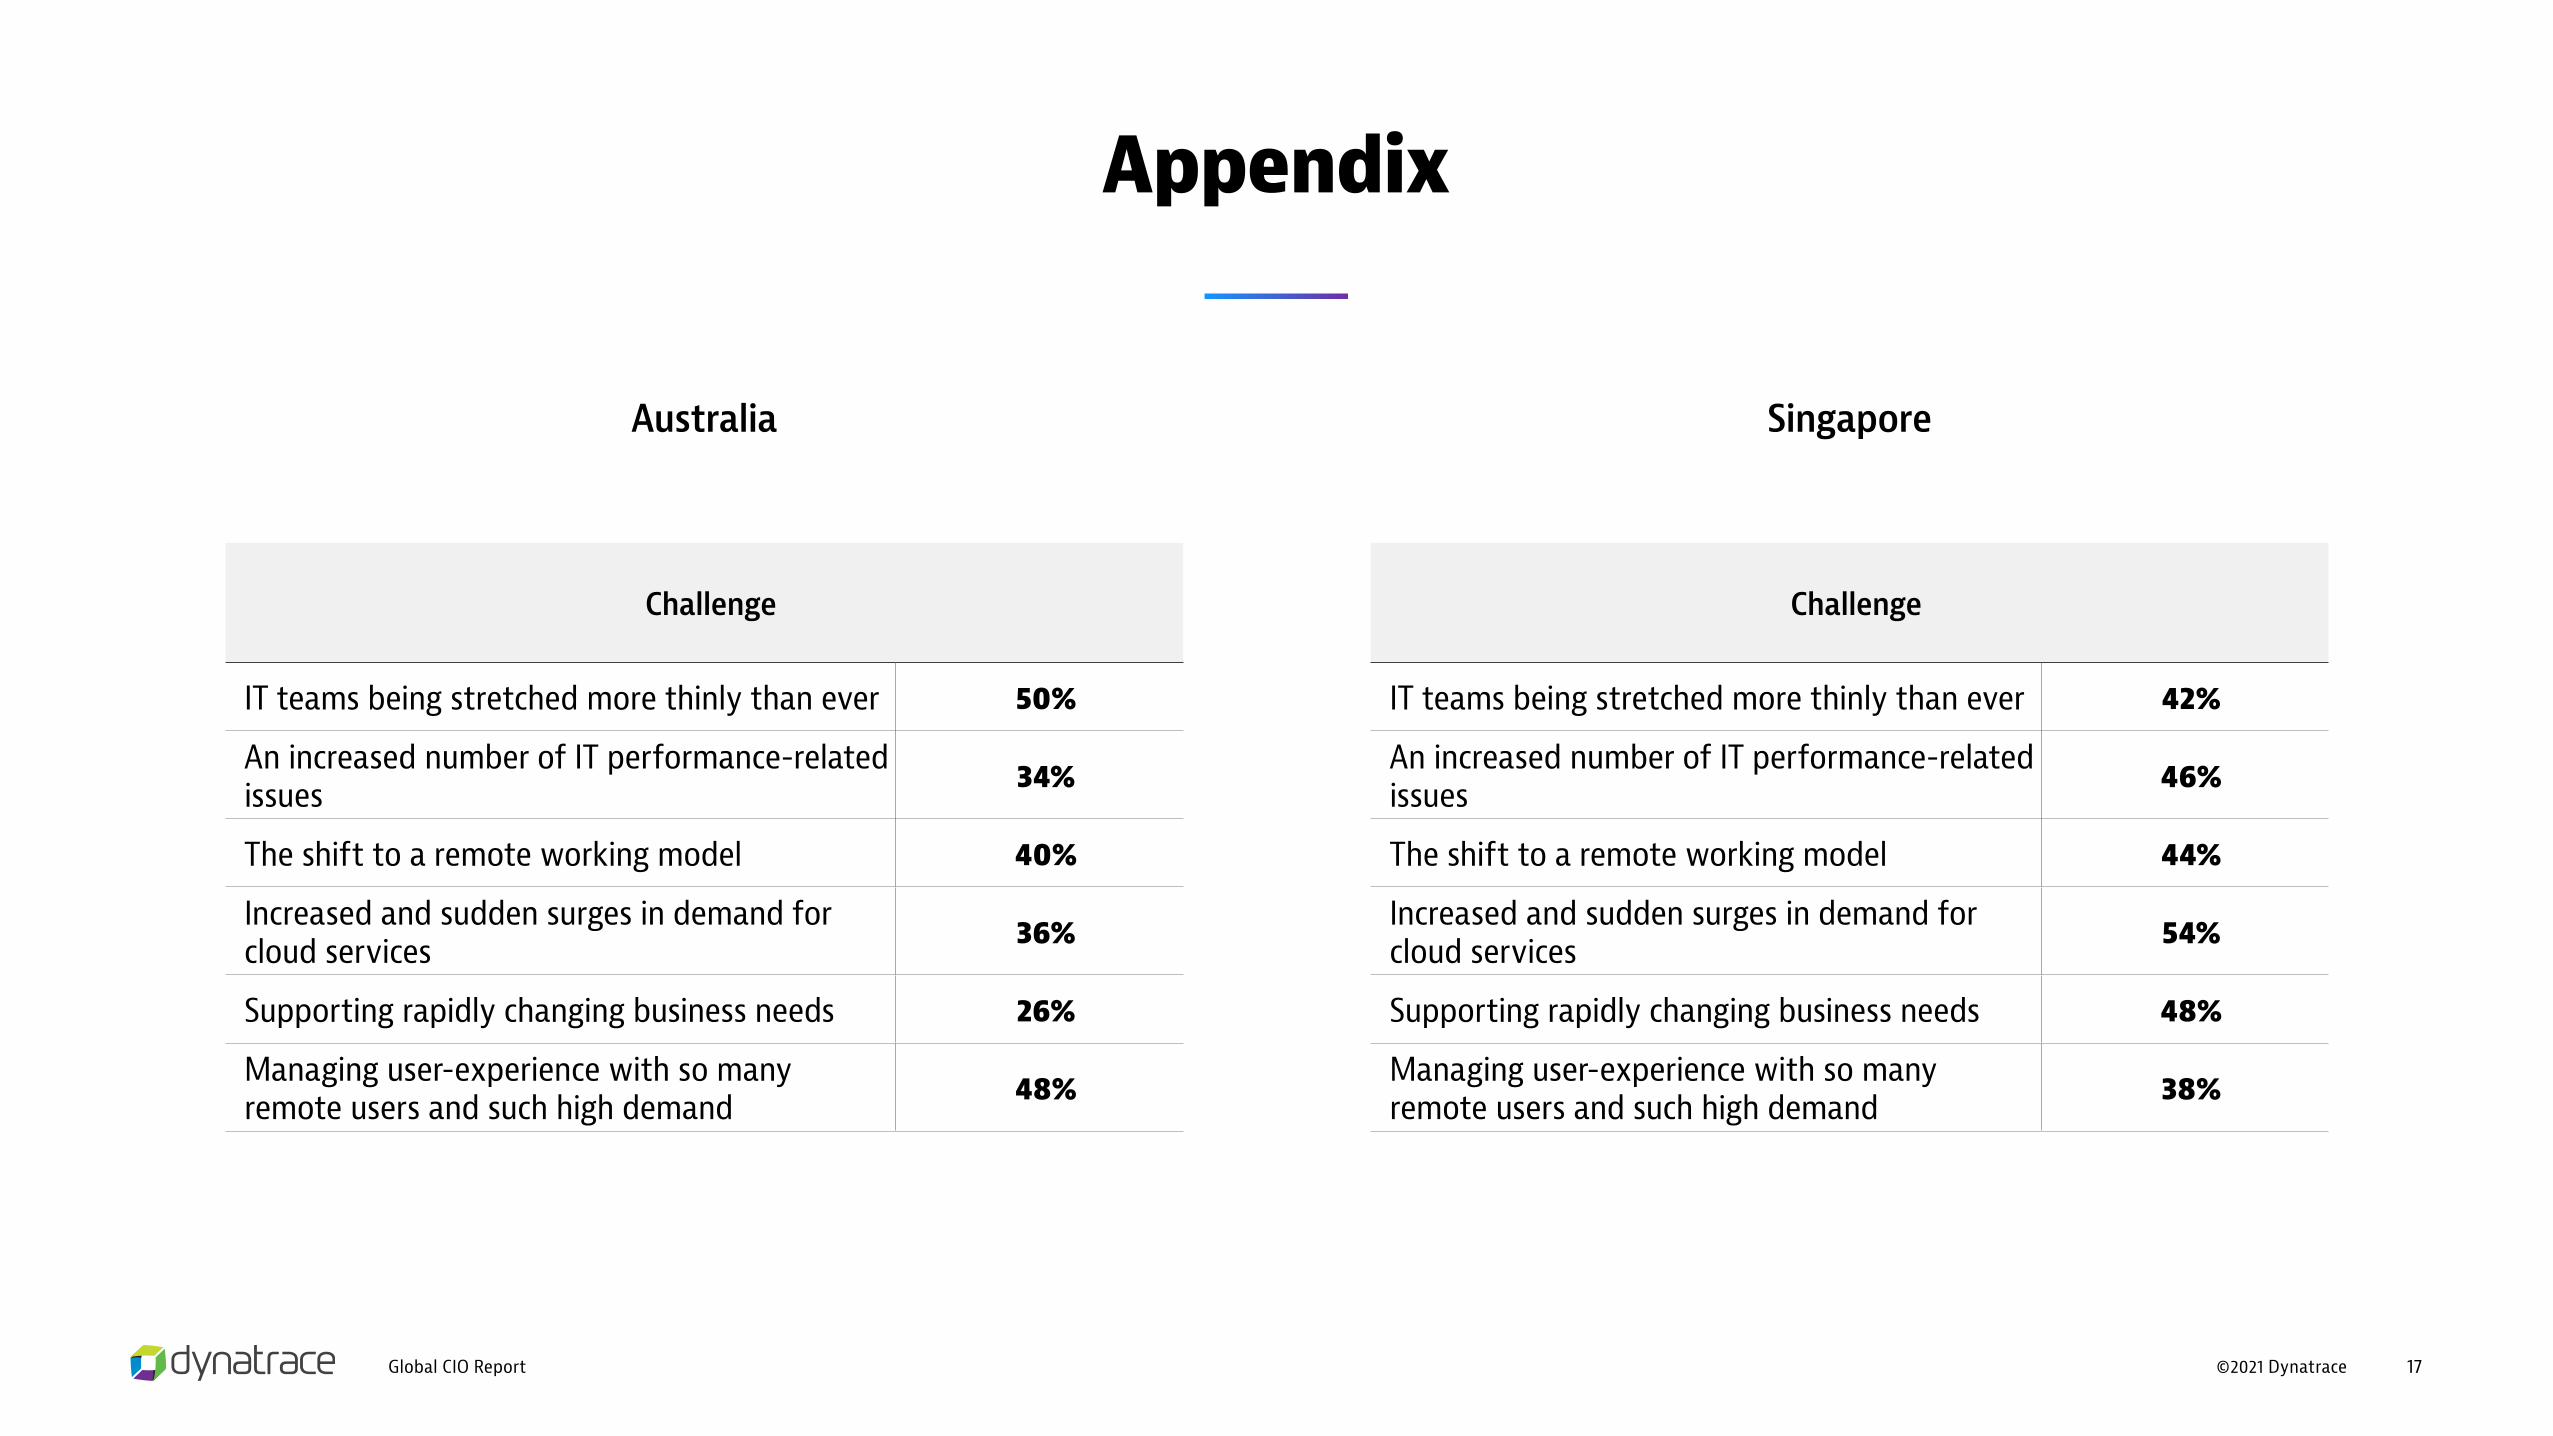
Appendix
Challenge
IT teams being stretched more thinly than ever 50%
An increased number of IT performance-related issues 34%
The shift to a remote working model 40%
Increased and sudden surges in demand for cloud services 36%
Supporting rapidly changing business needs 26%
Managing user-experience with so many remote users and such high demand 48%
Australia
Challenge
IT teams being stretched more thinly than ever 42%
An increased number of IT performance-related issues 46%
The shift to a remote working model 44%
Increased and sudden surges in demand for cloud services 54%
Supporting rapidly changing business needs 48%
Managing user-experience with so many remote users and such high demand 38%
Singapore

©2021 DynatraceGlobal CIO Report 18
Appendix
Challenge
IT teams being stretched more thinly than ever 56%
An increased number of IT performance-related issues 34%
The shift to a remote working model 30%
Increased and sudden surges in demand for cloud services 28%
Supporting rapidly changing business needs 44%
Managing user-experience with so many remote users and such high demand 16%
Brazil
Challenge
IT teams being stretched more thinly than ever 26%
An increased number of IT performance-related issues 38%
The shift to a remote working model 40%
Increased and sudden surges in demand for cloud services 40%
Supporting rapidly changing business needs 36%
Managing user-experience with so many remote users and such high demand 36%
Mexico

©2021 DynatraceGlobal CIO Report 19
Appendix
Challenge
IT and business teams working in silos 40%
Data from monitoring tools often being stored in silos 47%
Limited visibility and data into users’ perspectives on how digital services are performing
44%
Limited visibility into the business value that results from changes to digital services (e.g. impact of software updates)
38%
US
Challenge
IT and business teams working in silos 55%
Data from monitoring tools often being stored in silos 47%
Limited visibility and data into users’ perspectives on how digital services are performing
46%
Limited visibility into the business value that results from changes to digital services (e.g. impact of software updates)
40%
UK
©2021 DynatraceGlobal CIO Report 20
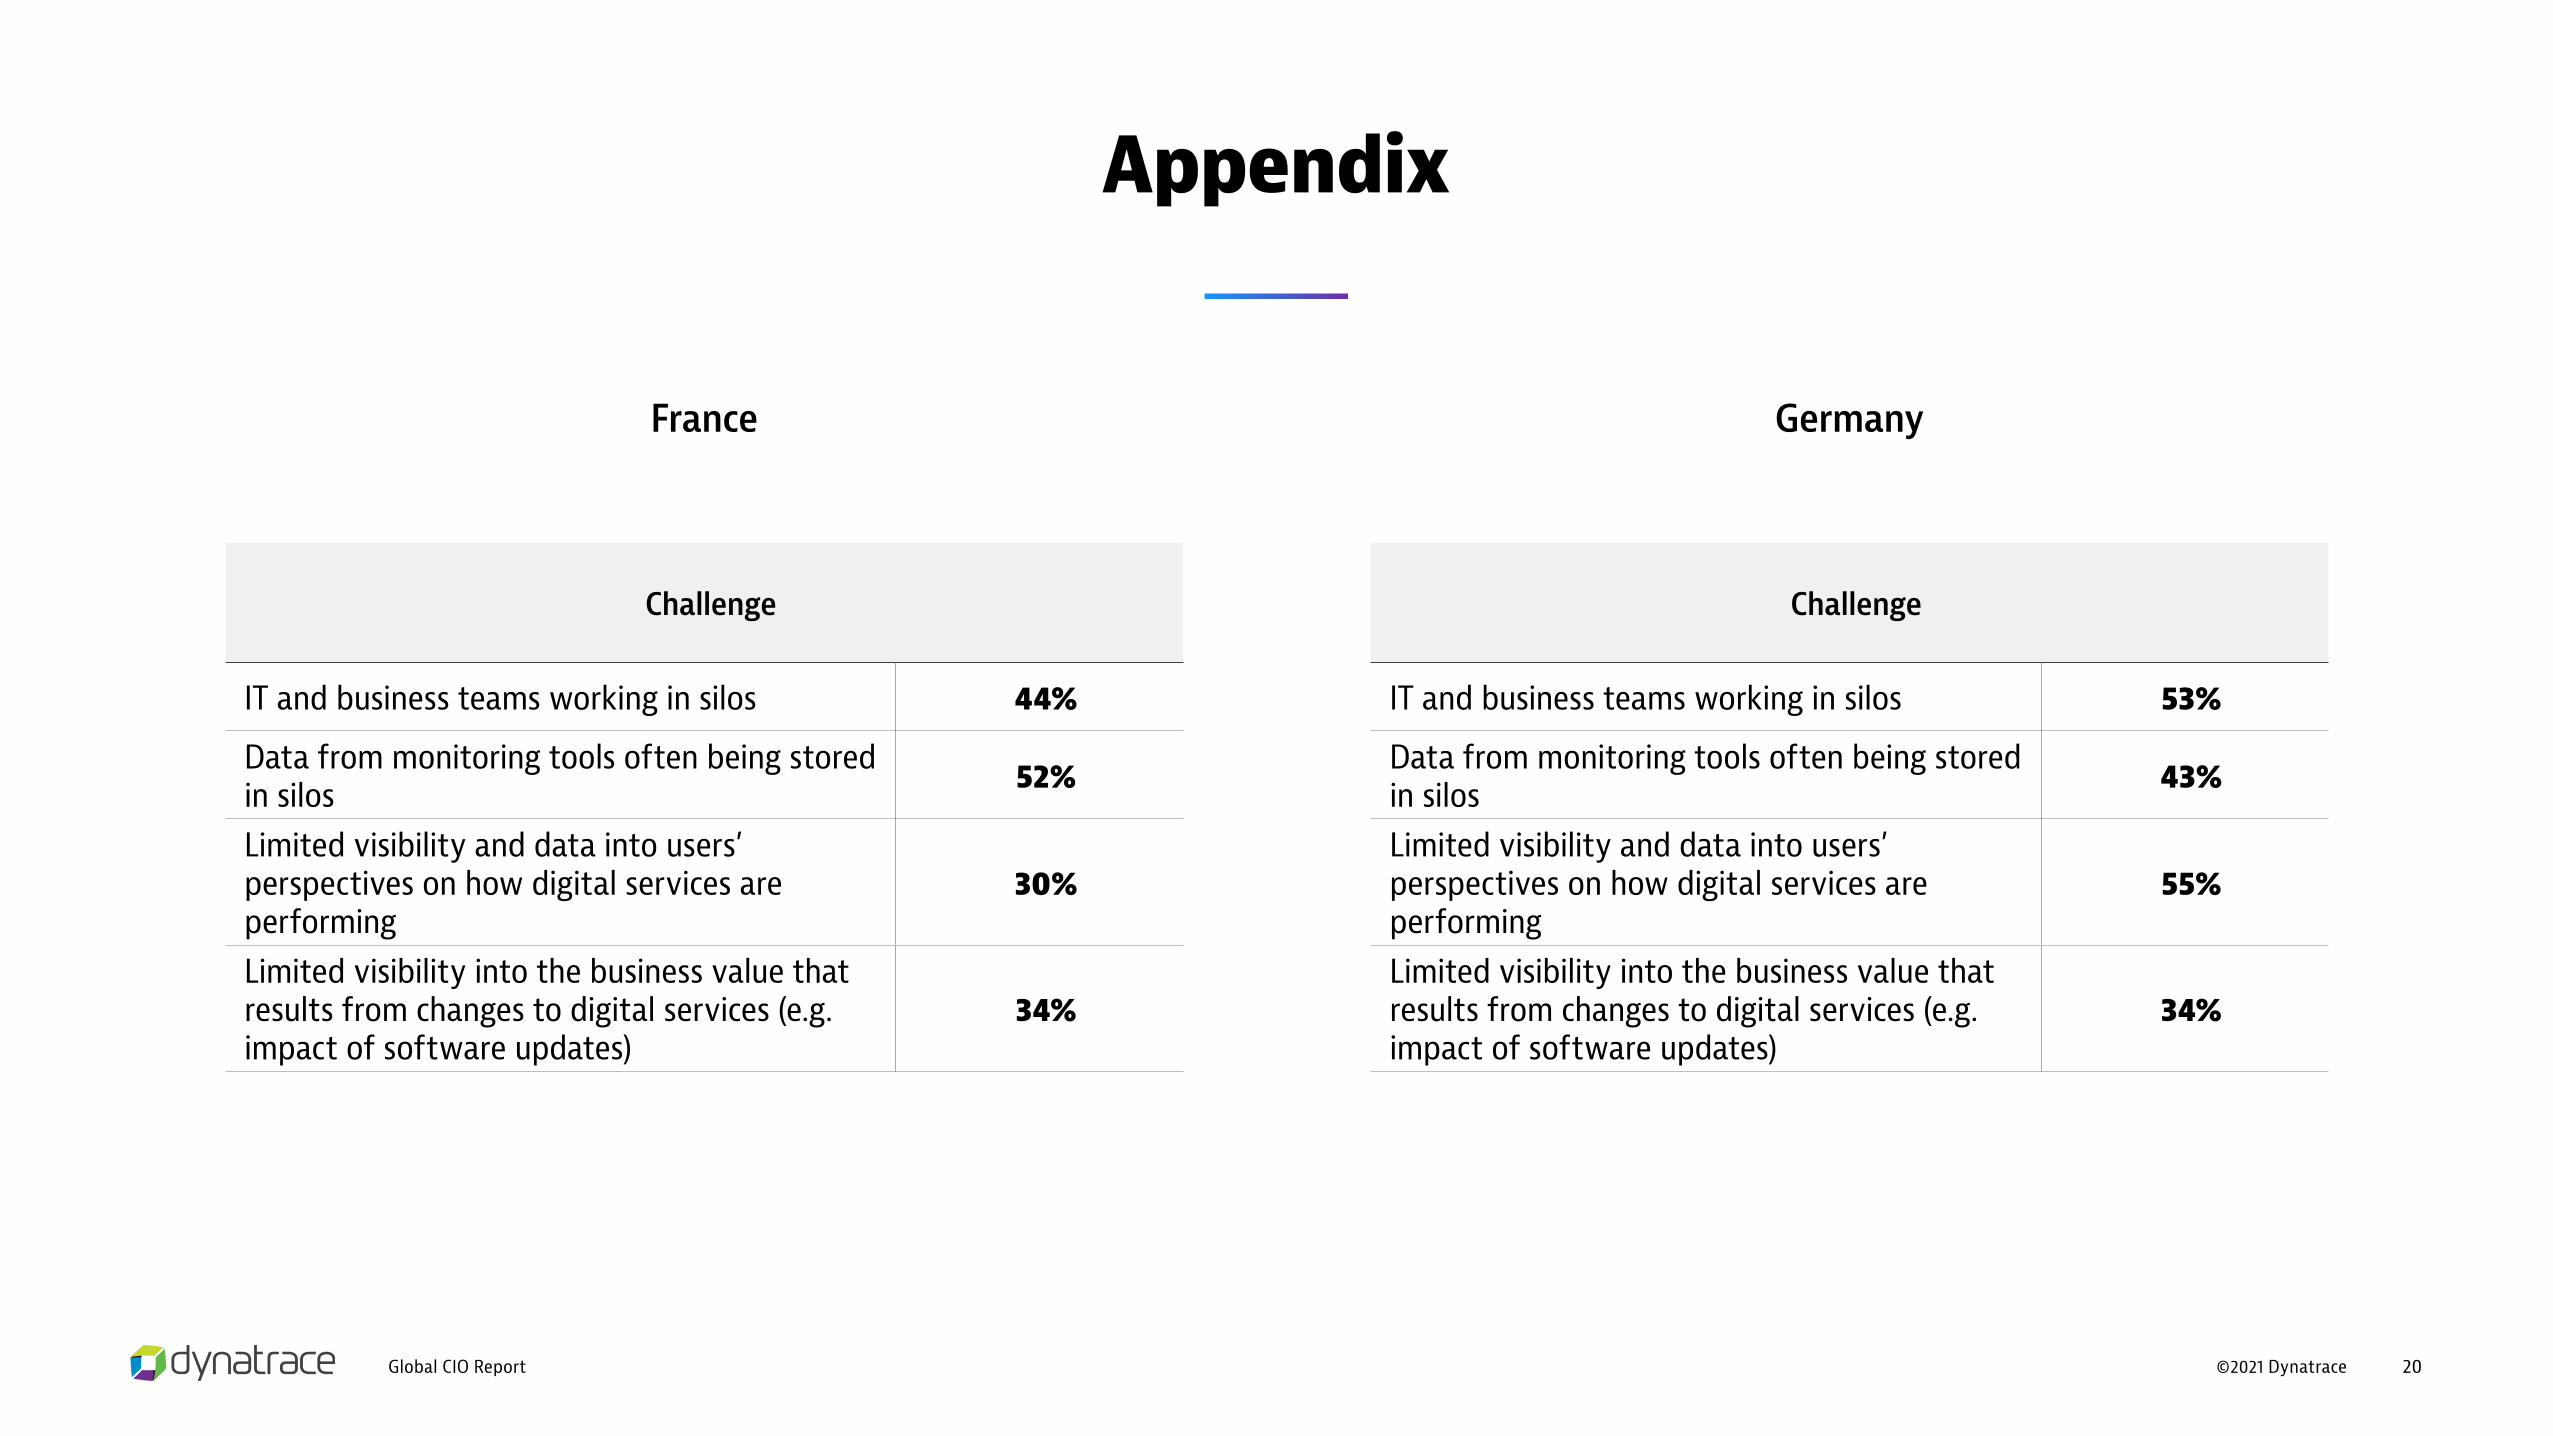
Appendix
Challenge
IT and business teams working in silos 44%
Data from monitoring tools often being stored in silos 52%
Limited visibility and data into users’ perspectives on how digital services are performing
30%
Limited visibility into the business value that results from changes to digital services (e.g. impact of software updates)
34%
France
Challenge
IT and business teams working in silos 53%
Data from monitoring tools often being stored in silos 43%
Limited visibility and data into users’ perspectives on how digital services are performing
55%
Limited visibility into the business value that results from changes to digital services (e.g. impact of software updates)
34%
Germany

©2021 DynatraceGlobal CIO Report 21
Appendix
Challenge
IT and business teams working in silos 50%
Data from monitoring tools often being stored in silos 38%
Limited visibility and data into users’ perspectives on how digital services are performing
56%
Limited visibility into the business value that results from changes to digital services (e.g. impact of software updates)
36%
Australia
Challenge
IT and business teams working in silos 54%
Data from monitoring tools often being stored in silos 42%
Limited visibility and data into users’ perspectives on how digital services are performing
48%
Limited visibility into the business value that results from changes to digital services (e.g. impact of software updates)
44%
Singapore

©2021 DynatraceGlobal CIO Report 22
Appendix
Challenge
IT and business teams working in silos 38%
Data from monitoring tools often being stored in silos 40%
Limited visibility and data into users’ perspectives on how digital services are performing
44%
Limited visibility into the business value that results from changes to digital services (e.g. impact of software updates)
34%
Brazil
Challenge
IT and business teams working in silos 30%
Data from monitoring tools often being stored in silos 42%
Limited visibility and data into users’ perspectives on how digital services are performing
44%
Limited visibility into the business value that results from changes to digital services (e.g. impact of software updates)
26%
Mexico
©2021 DynatraceGlobal CIO Report 23
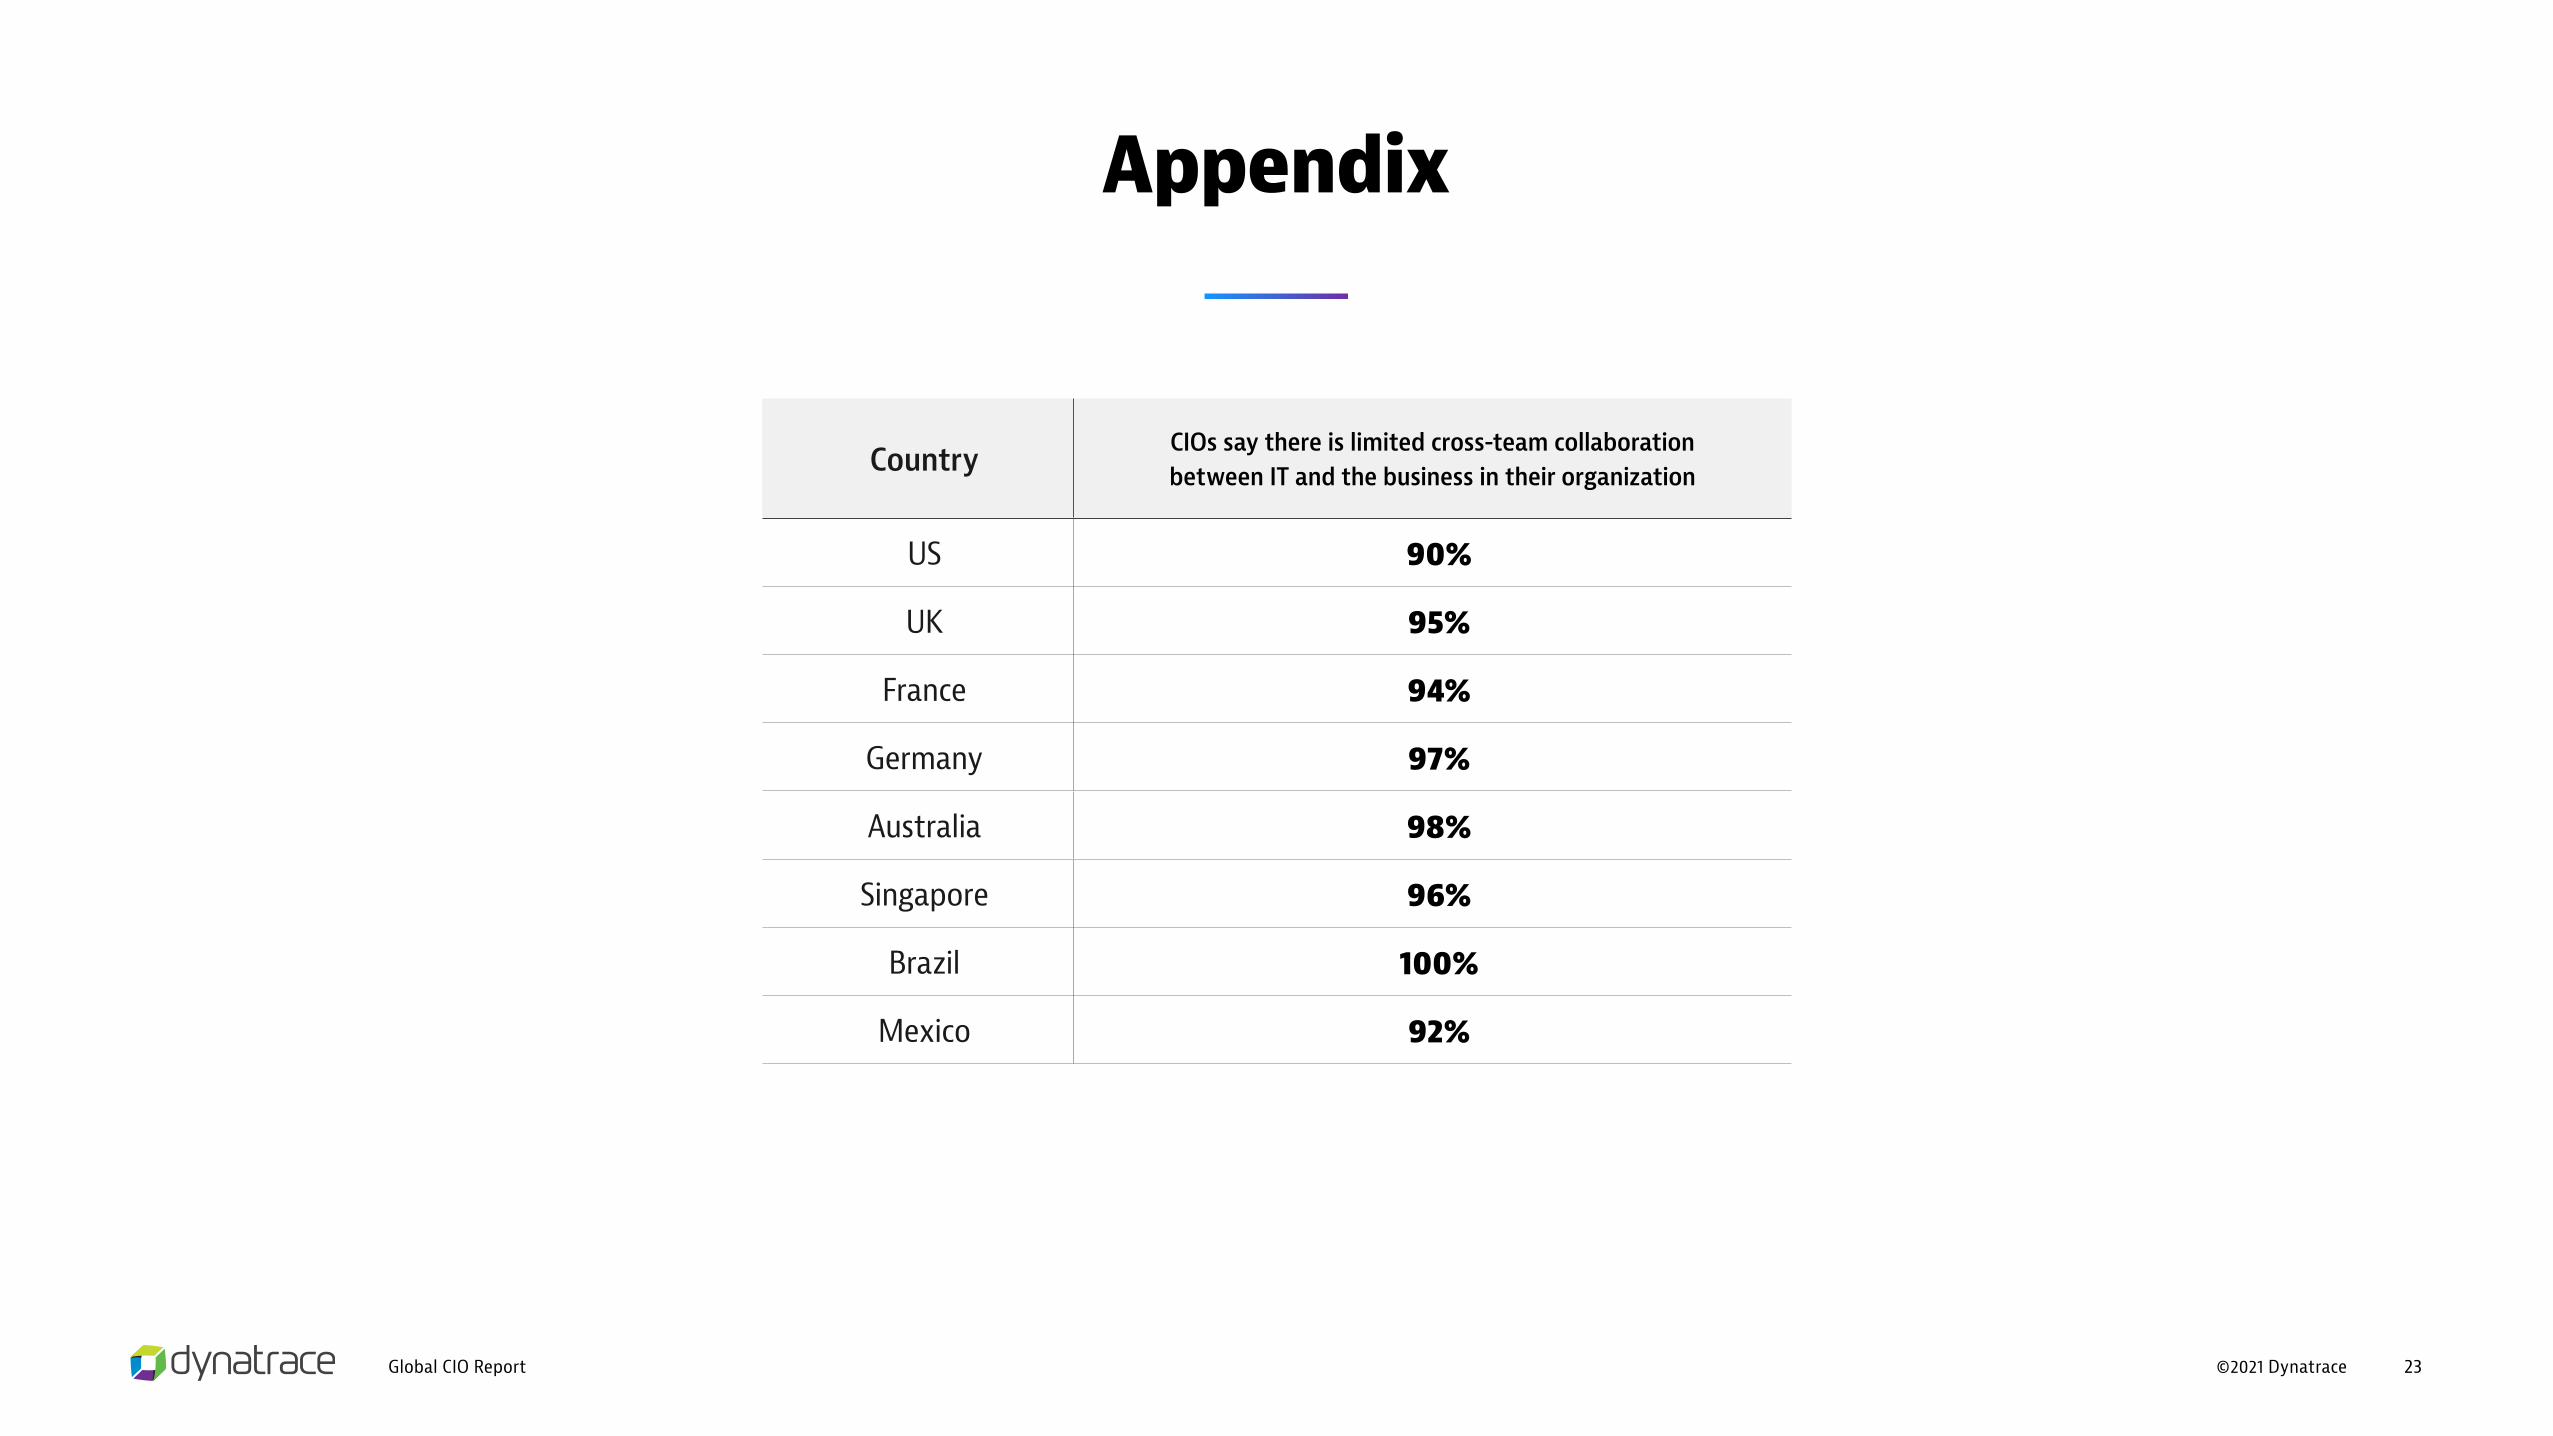
Appendix
Country CIOs say there is limited cross-team collaboration between IT and the business in their organization
US 90%
UK 95%
France 94%
Germany 97%
Australia 98%
Singapore 96%
Brazil 100%
Mexico 92%
©2021 DynatraceGlobal CIO Report 24
Appendix
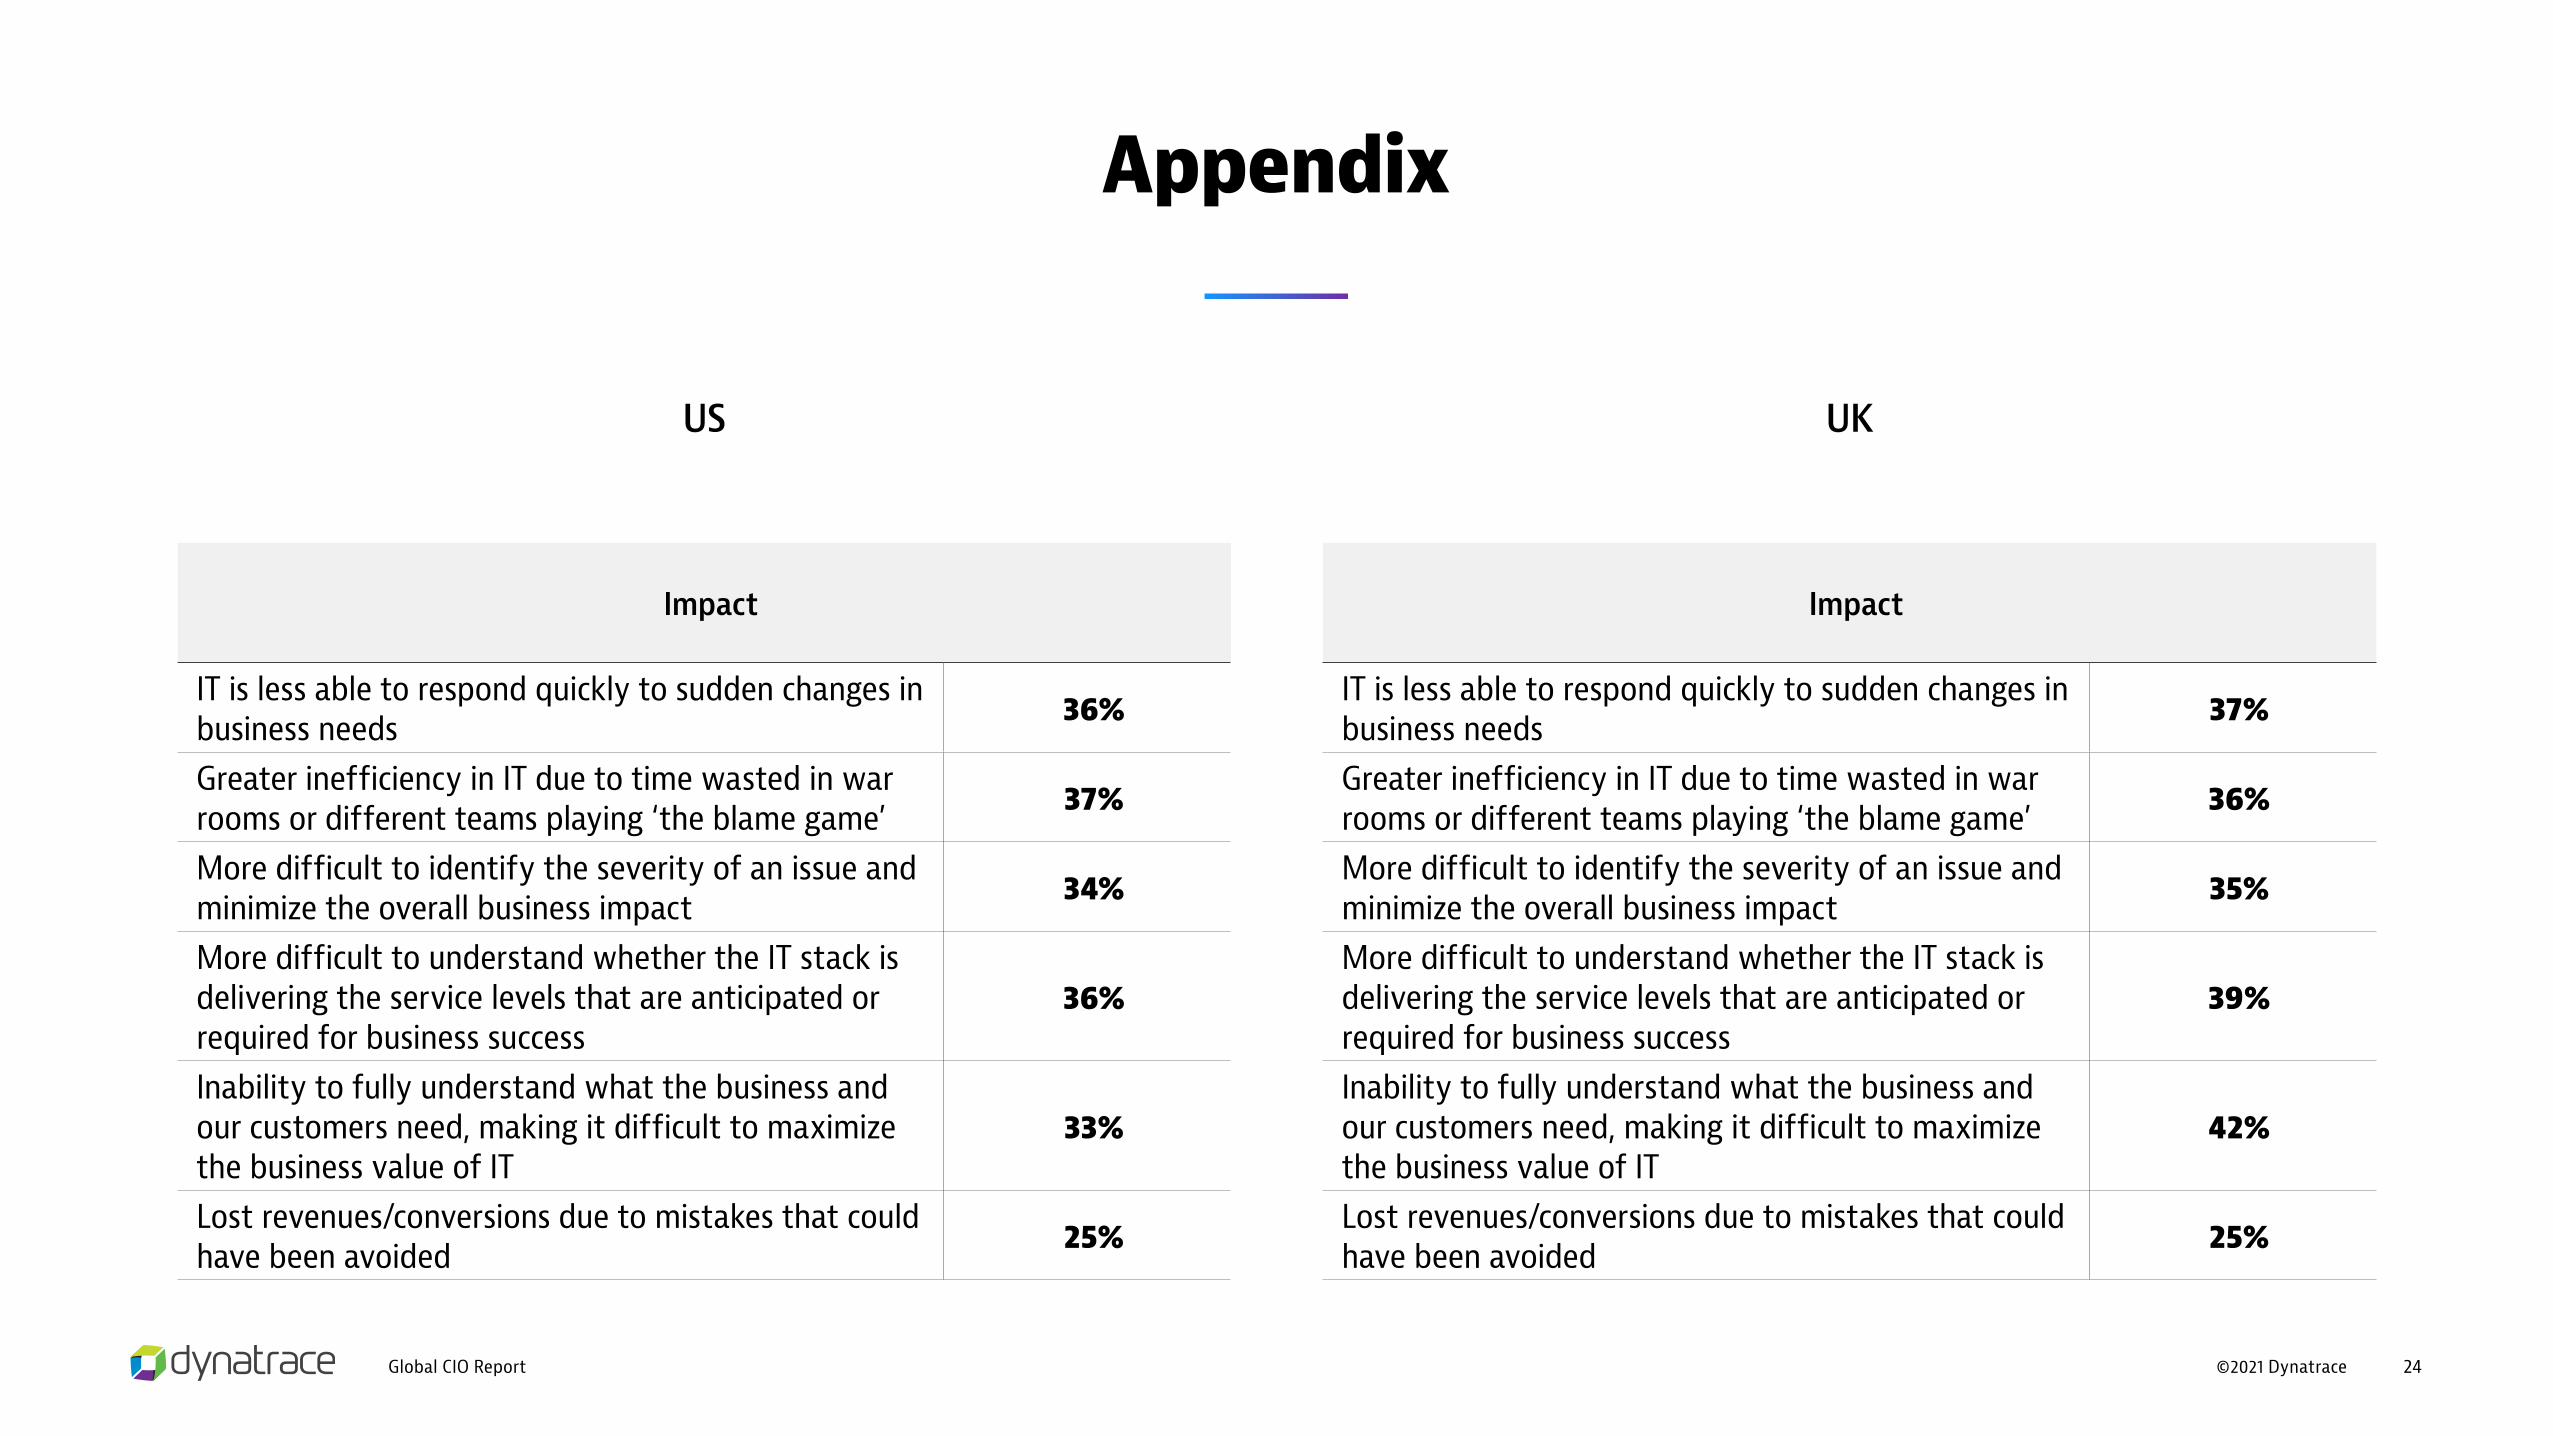
Impact
IT is less able to respond quickly to sudden changes in business needs 36%
Greater inefficiency in IT due to time wasted in war rooms or different teams playing ‘the blame game’ 37%
More difficult to identify the severity of an issue and minimize the overall business impact 34%
More difficult to understand whether the IT stack is delivering the service levels that are anticipated or required for business success
36%
Inability to fully understand what the business and our customers need, making it difficult to maximize the business value of IT
33%
Lost revenues/conversions due to mistakes that could have been avoided 25%
US
Impact
IT is less able to respond quickly to sudden changes in business needs 37%
Greater inefficiency in IT due to time wasted in war rooms or different teams playing ‘the blame game’ 36%
More difficult to identify the severity of an issue and minimize the overall business impact 35%
More difficult to understand whether the IT stack is delivering the service levels that are anticipated or required for business success
39%
Inability to fully understand what the business and our customers need, making it difficult to maximize the business value of IT
42%
Lost revenues/conversions due to mistakes that could have been avoided 25%
UK
©2021 DynatraceGlobal CIO Report 25
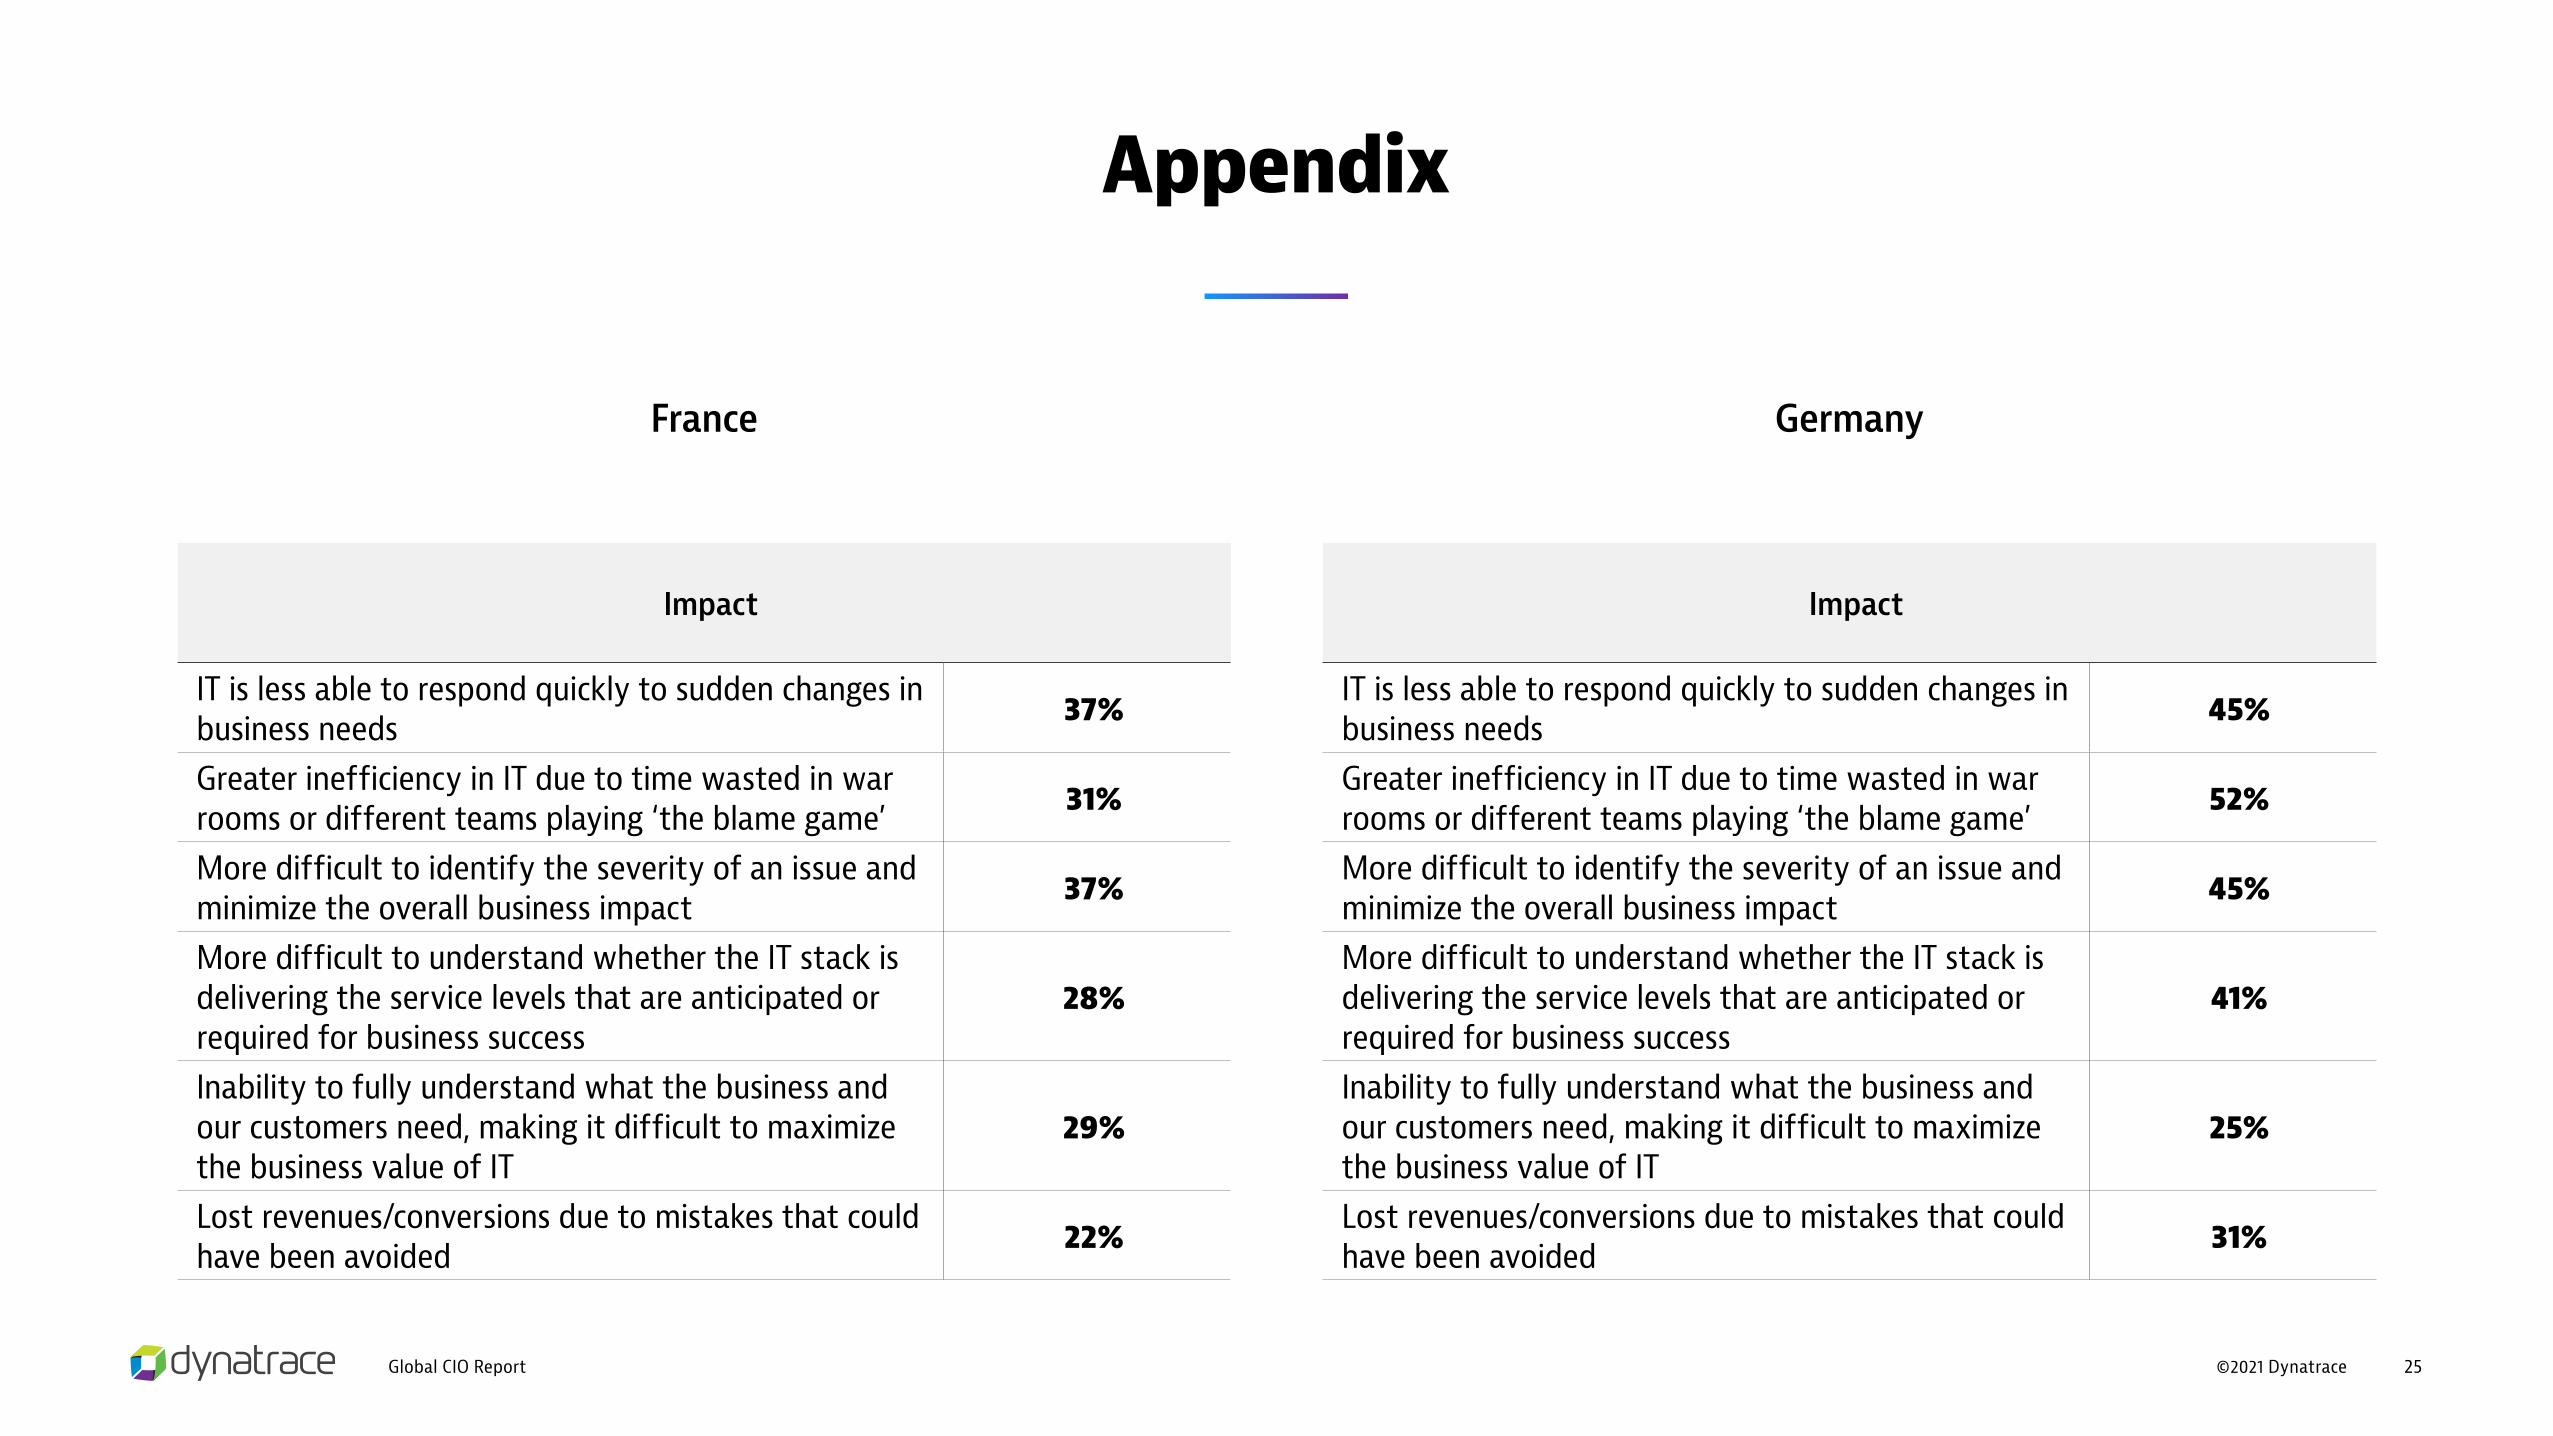
Appendix
Impact
IT is less able to respond quickly to sudden changes in business needs 37%
Greater inefficiency in IT due to time wasted in war rooms or different teams playing ‘the blame game’ 31%
More difficult to identify the severity of an issue and minimize the overall business impact 37%
More difficult to understand whether the IT stack is delivering the service levels that are anticipated or required for business success
28%
Inability to fully understand what the business and our customers need, making it difficult to maximize the business value of IT
29%
Lost revenues/conversions due to mistakes that could have been avoided 22%
France
Impact
IT is less able to respond quickly to sudden changes in business needs 45%
Greater inefficiency in IT due to time wasted in war rooms or different teams playing ‘the blame game’ 52%
More difficult to identify the severity of an issue and minimize the overall business impact 45%
More difficult to understand whether the IT stack is delivering the service levels that are anticipated or required for business success
41%
Inability to fully understand what the business and our customers need, making it difficult to maximize the business value of IT
25%
Lost revenues/conversions due to mistakes that could have been avoided 31%
Germany

©2021 DynatraceGlobal CIO Report 26
Appendix
Impact
IT is less able to respond quickly to sudden changes in business needs 48%
Greater inefficiency in IT due to time wasted in war rooms or different teams playing ‘the blame game’ 34%
More difficult to identify the severity of an issue and minimize the overall business impact 38%
More difficult to understand whether the IT stack is delivering the service levels that are anticipated or required for business success
26%
Inability to fully understand what the business and our customers need, making it difficult to maximize the business value of IT
38%
Lost revenues/conversions due to mistakes that could have been avoided 32%
Australia
Impact
IT is less able to respond quickly to sudden changes in business needs 38%
Greater inefficiency in IT due to time wasted in war rooms or different teams playing ‘the blame game’ 34%
More difficult to identify the severity of an issue and minimize the overall business impact 44%
More difficult to understand whether the IT stack is delivering the service levels that are anticipated or required for business success
42%
Inability to fully understand what the business and our customers need, making it difficult to maximize the business value of IT
36%
Lost revenues/conversions due to mistakes that could have been avoided 36%
Singapore

©2021 DynatraceGlobal CIO Report 27
Appendix
Impact
IT is less able to respond quickly to sudden changes in business needs 20%
Greater inefficiency in IT due to time wasted in war rooms or different teams playing ‘the blame game’ 44%
More difficult to identify the severity of an issue and minimize the overall business impact 42%
More difficult to understand whether the IT stack is delivering the service levels that are anticipated or required for business success
50%
Inability to fully understand what the business and our customers need, making it difficult to maximize the business value of IT
38%
Lost revenues/conversions due to mistakes that could have been avoided 42%
Brazil
Impact
IT is less able to respond quickly to sudden changes in business needs 38%
Greater inefficiency in IT due to time wasted in war rooms or different teams playing ‘the blame game’ 24%
More difficult to identify the severity of an issue and minimize the overall business impact 26%
More difficult to understand whether the IT stack is delivering the service levels that are anticipated or required for business success
24%
Inability to fully understand what the business and our customers need, making it difficult to maximize the business value of IT
34%
Lost revenues/conversions due to mistakes that could have been avoided 24%
Mexico
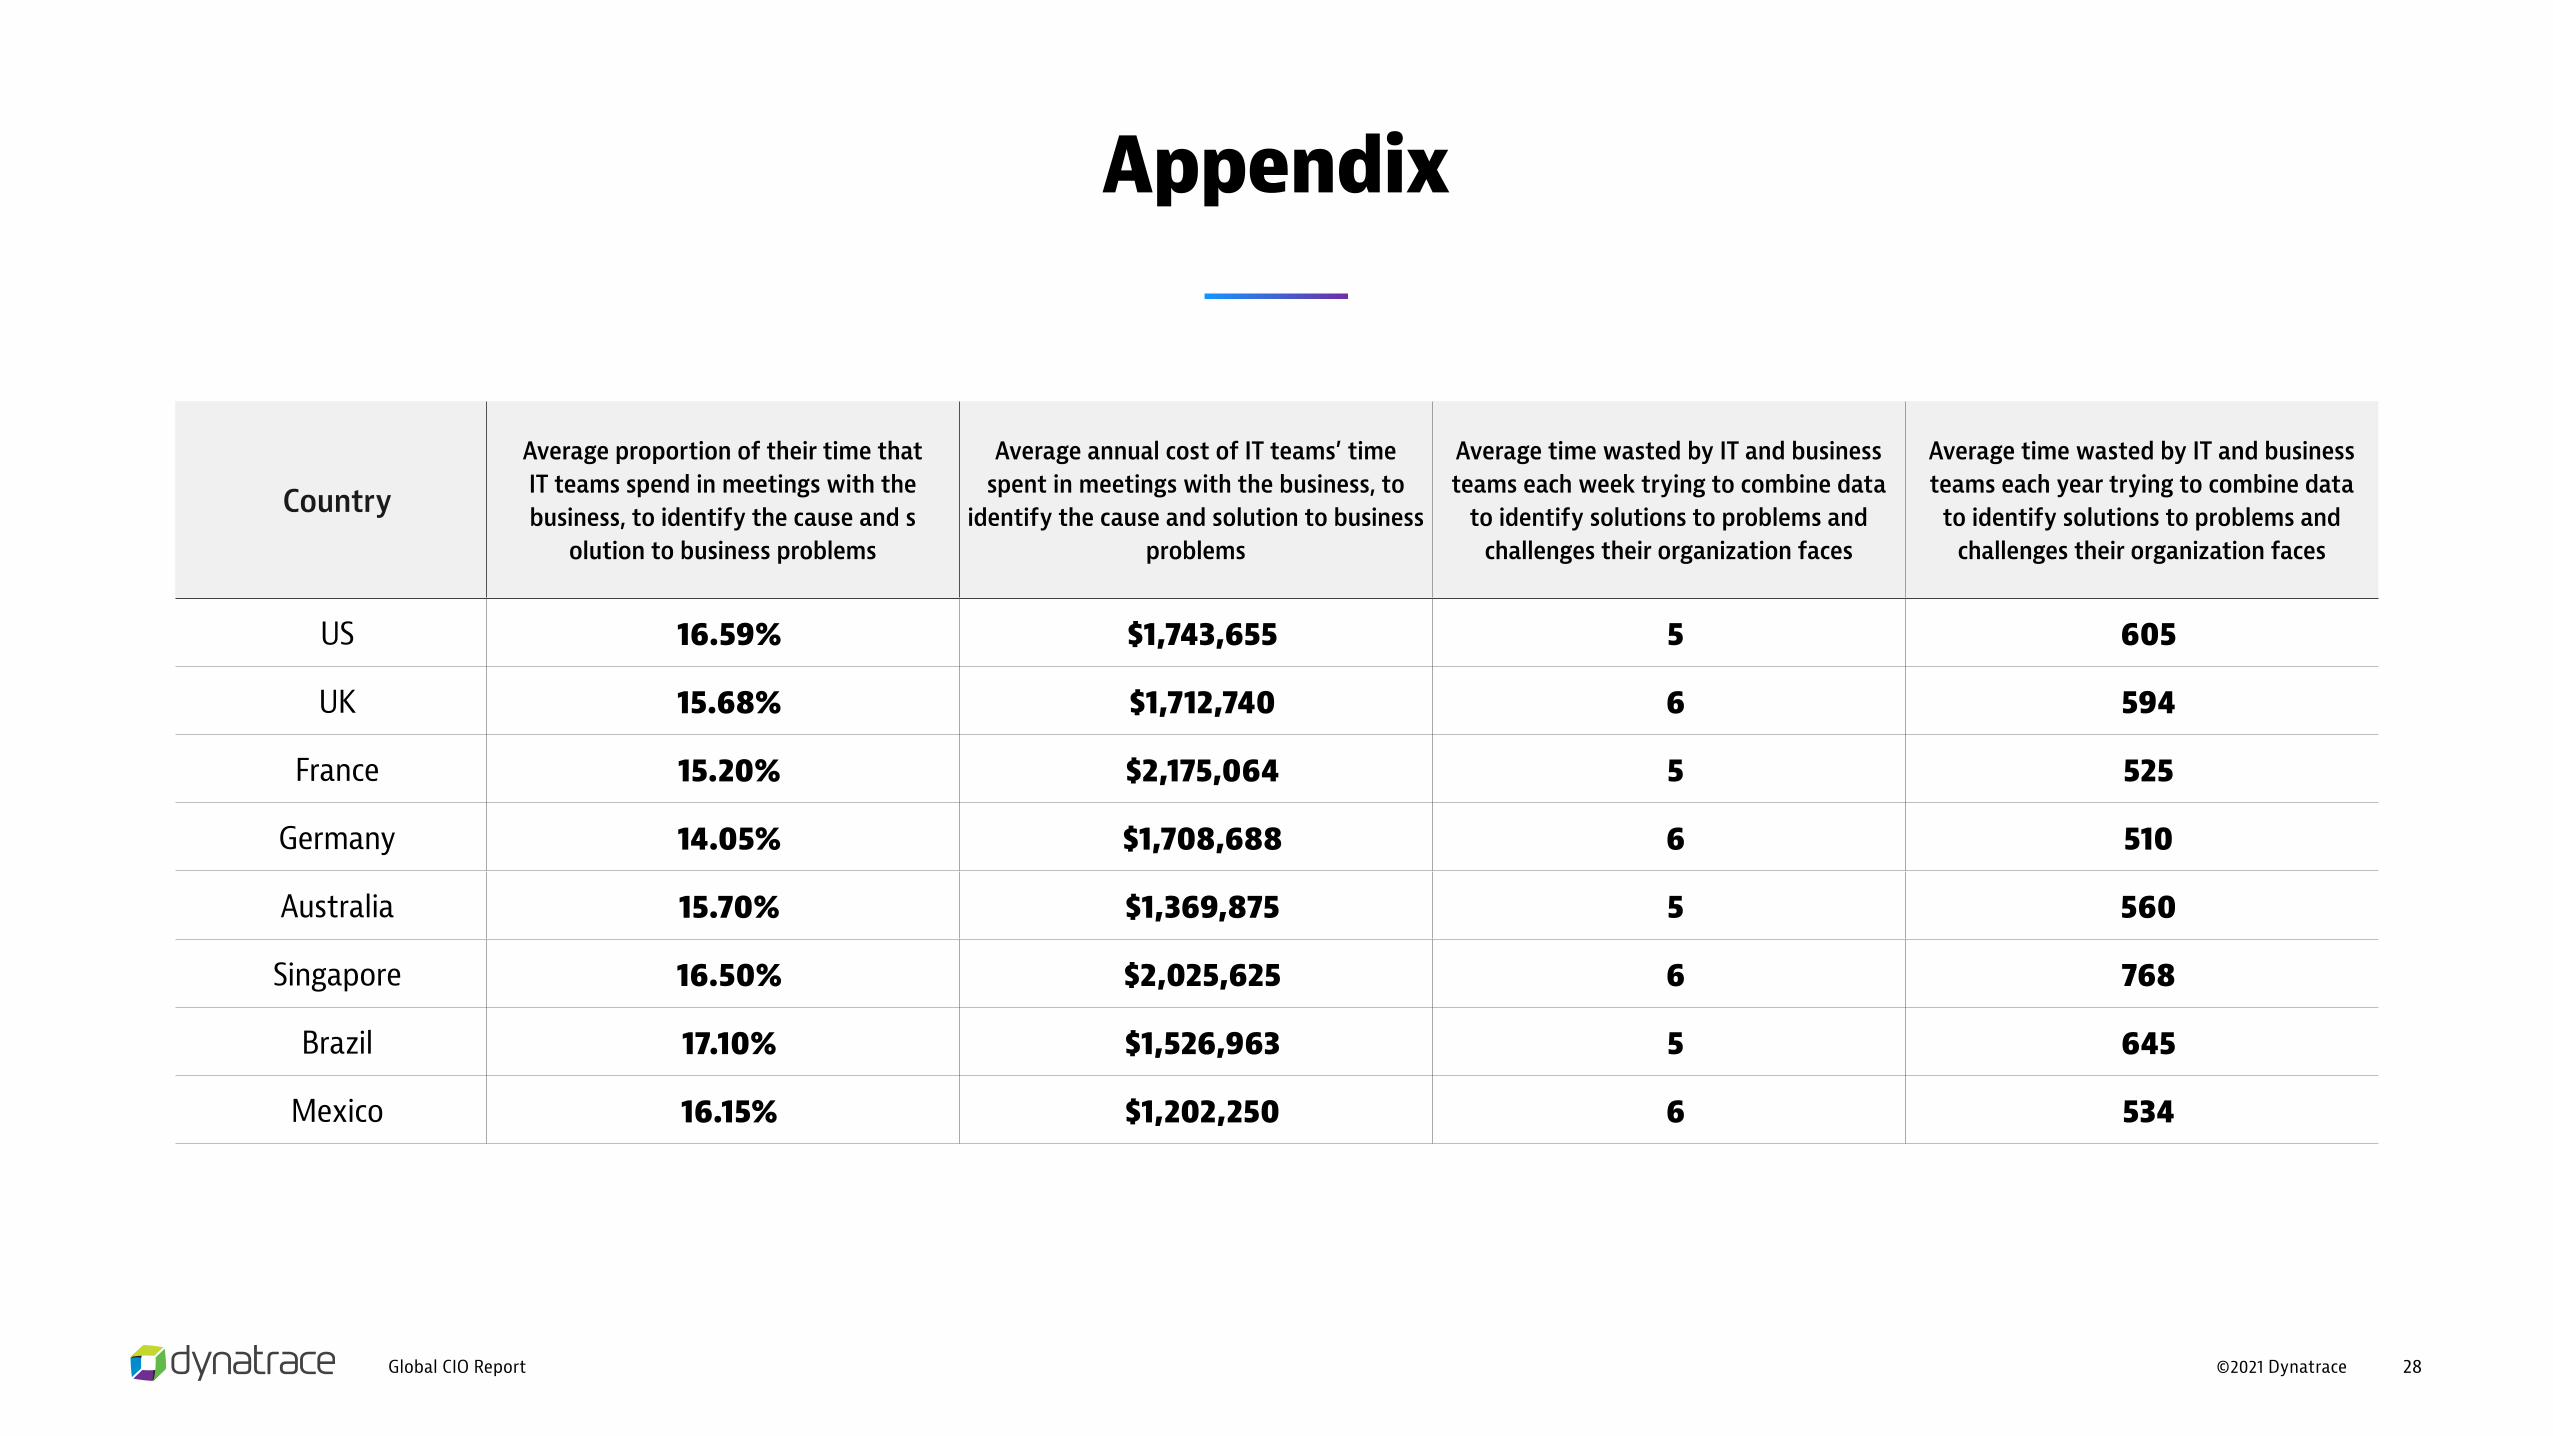
©2021 DynatraceGlobal CIO Report 28
Appendix
Country
Average proportion of their time that IT teams spend in meetings with the business, to identify the cause and s
olution to business problems
Average annual cost of IT teams’ time spent in meetings with the business, to
identify the cause and solution to business problems
Average time wasted by IT and business teams each week trying to combine data
to identify solutions to problems and challenges their organization faces
Average time wasted by IT and business teams each year trying to combine data
to identify solutions to problems and challenges their organization faces
US 16.59% $1,743,655 5 605
UK 15.68% $1,712,740 6 594
France 15.20% $2,175,064 5 525
Germany 14.05% $1,708,688 6 510
Australia 15.70% $1,369,875 5 560
Singapore 16.50% $2,025,625 6 768
Brazil 17.10% $1,526,963 5 645
Mexico 16.15% $1,202,250 6 534
©2021 DynatraceGlobal CIO Report 29
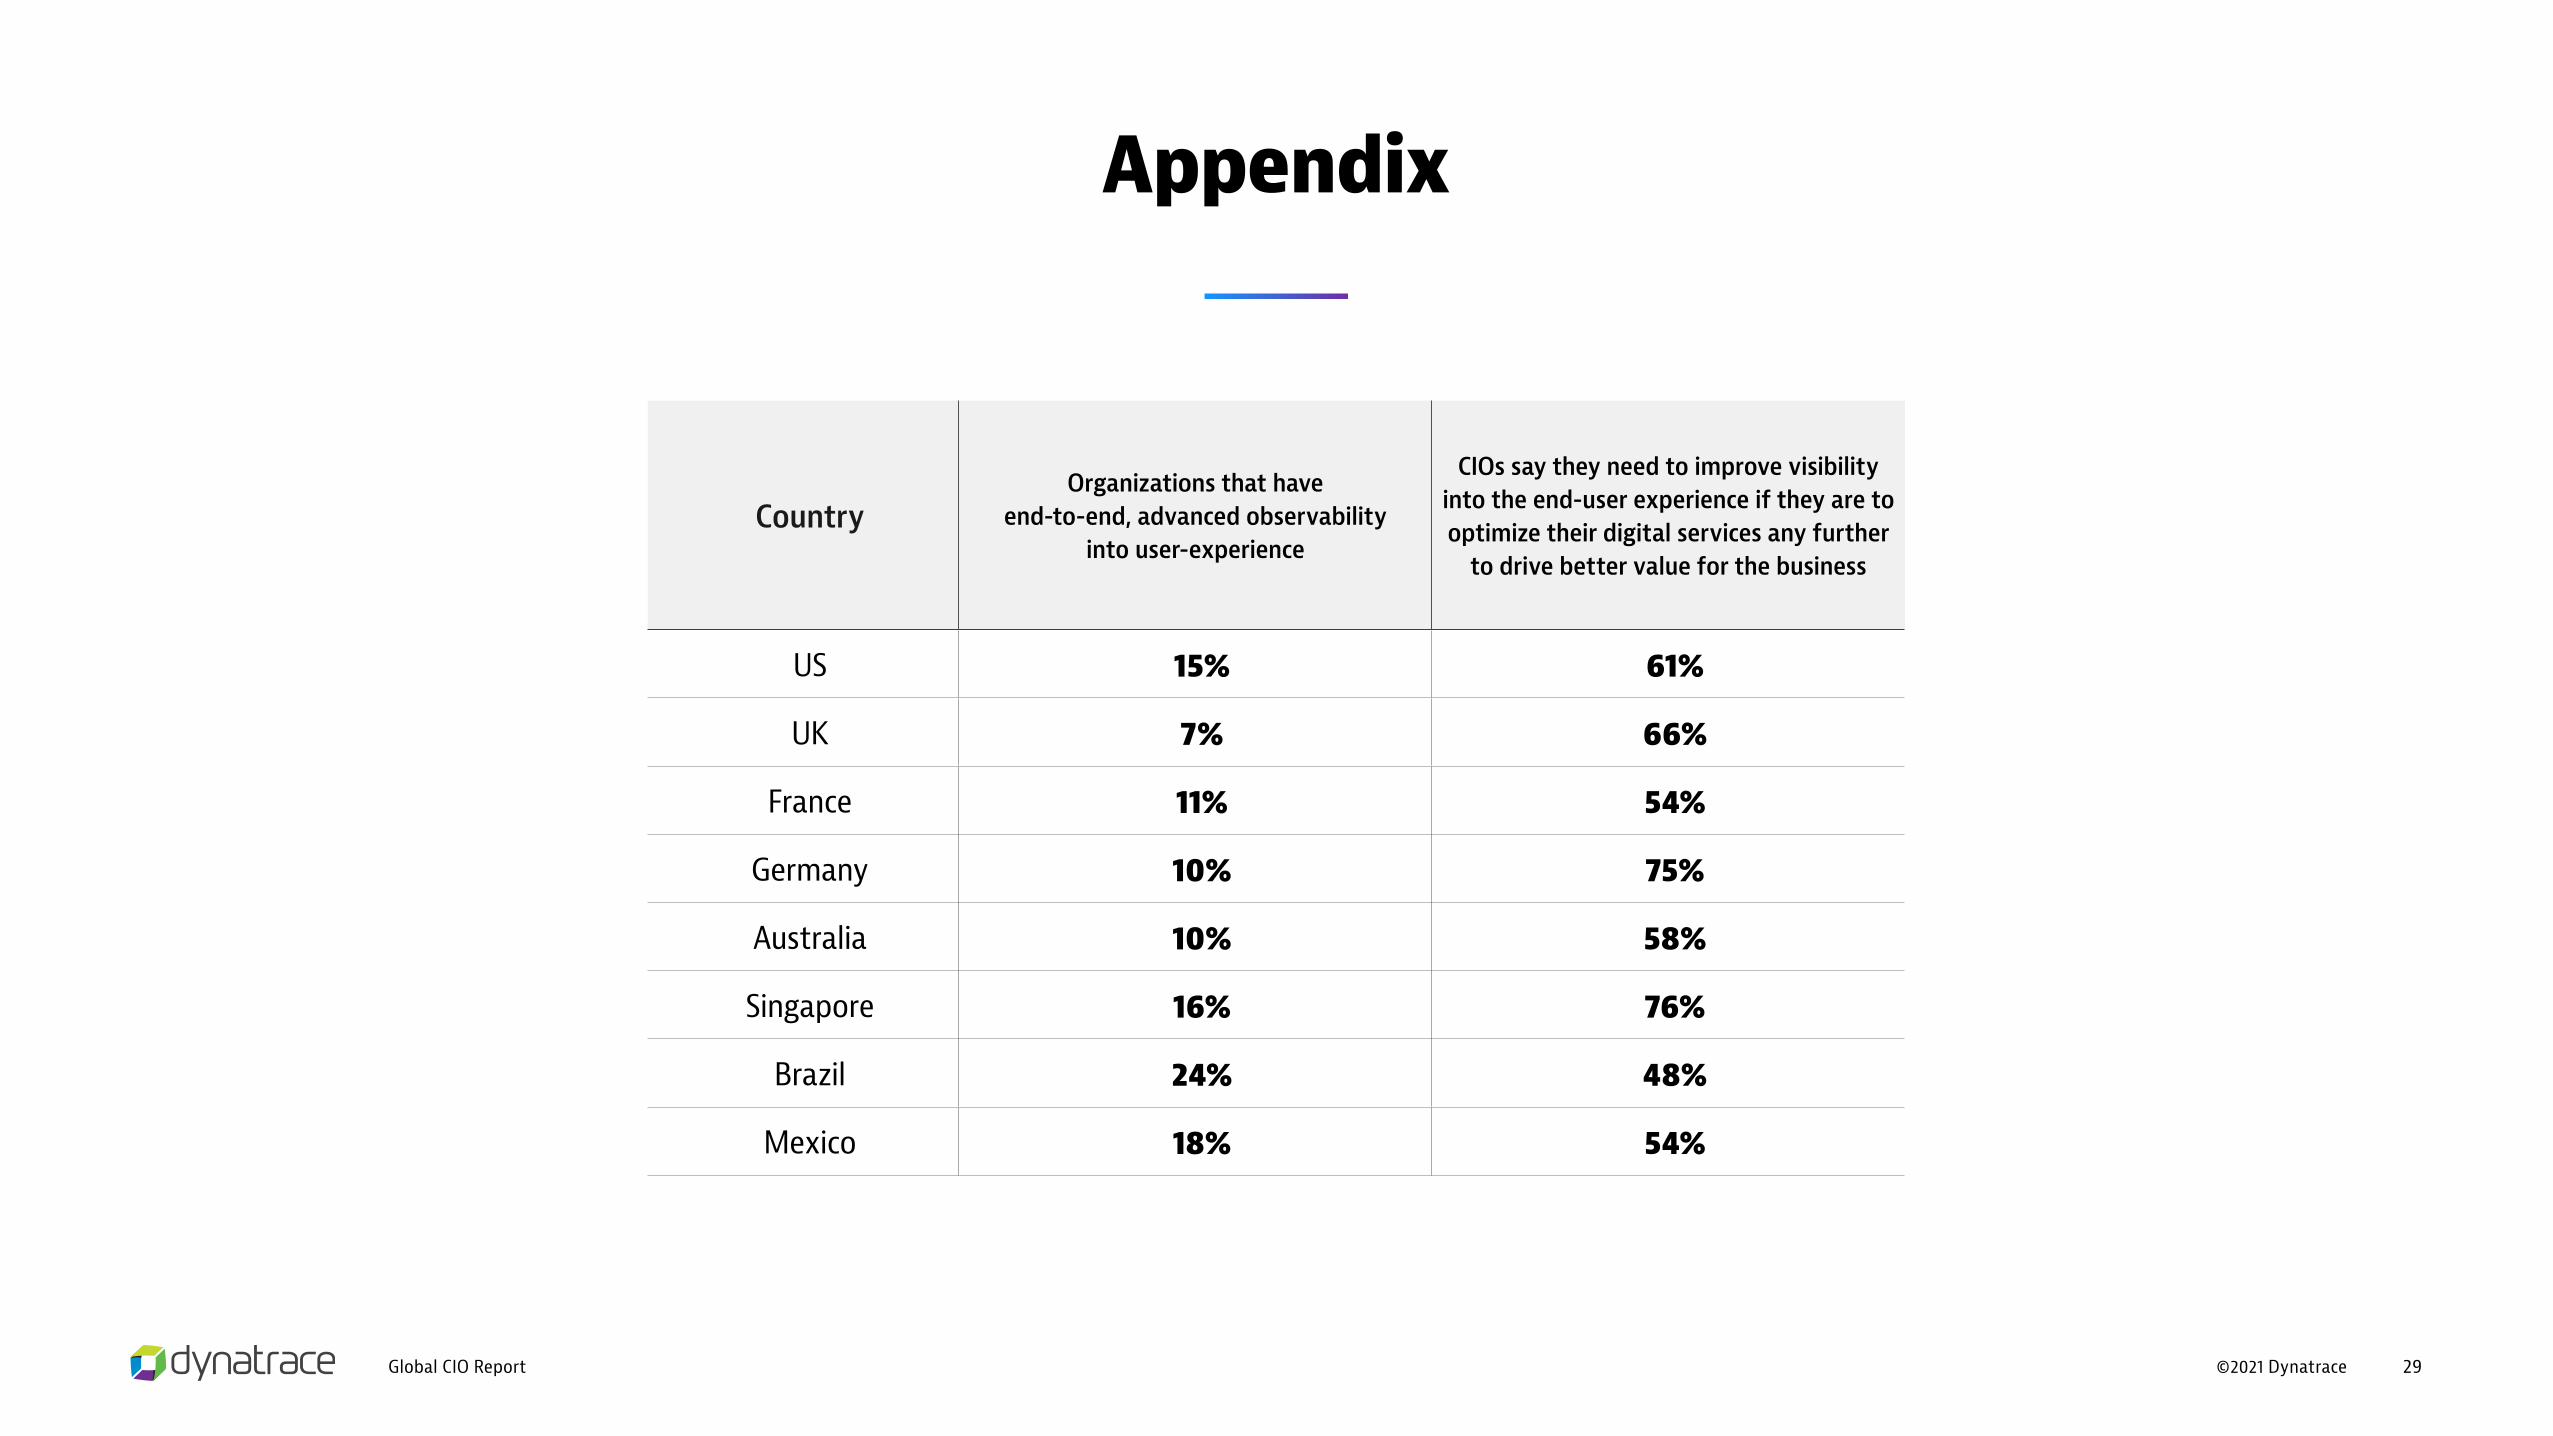
Appendix
CountryOrganizations that have
end-to-end, advanced observability into user-experience
CIOs say they need to improve visibility into the end-user experience if they are to optimize their digital services any further
to drive better value for the business
US 15% 61%
UK 7% 66%
France 11% 54%
Germany 10% 75%
Australia 10% 58%
Singapore 16% 76%
Brazil 24% 48%
Mexico 18% 54%
©2021 DynatraceGlobal CIO Report 30
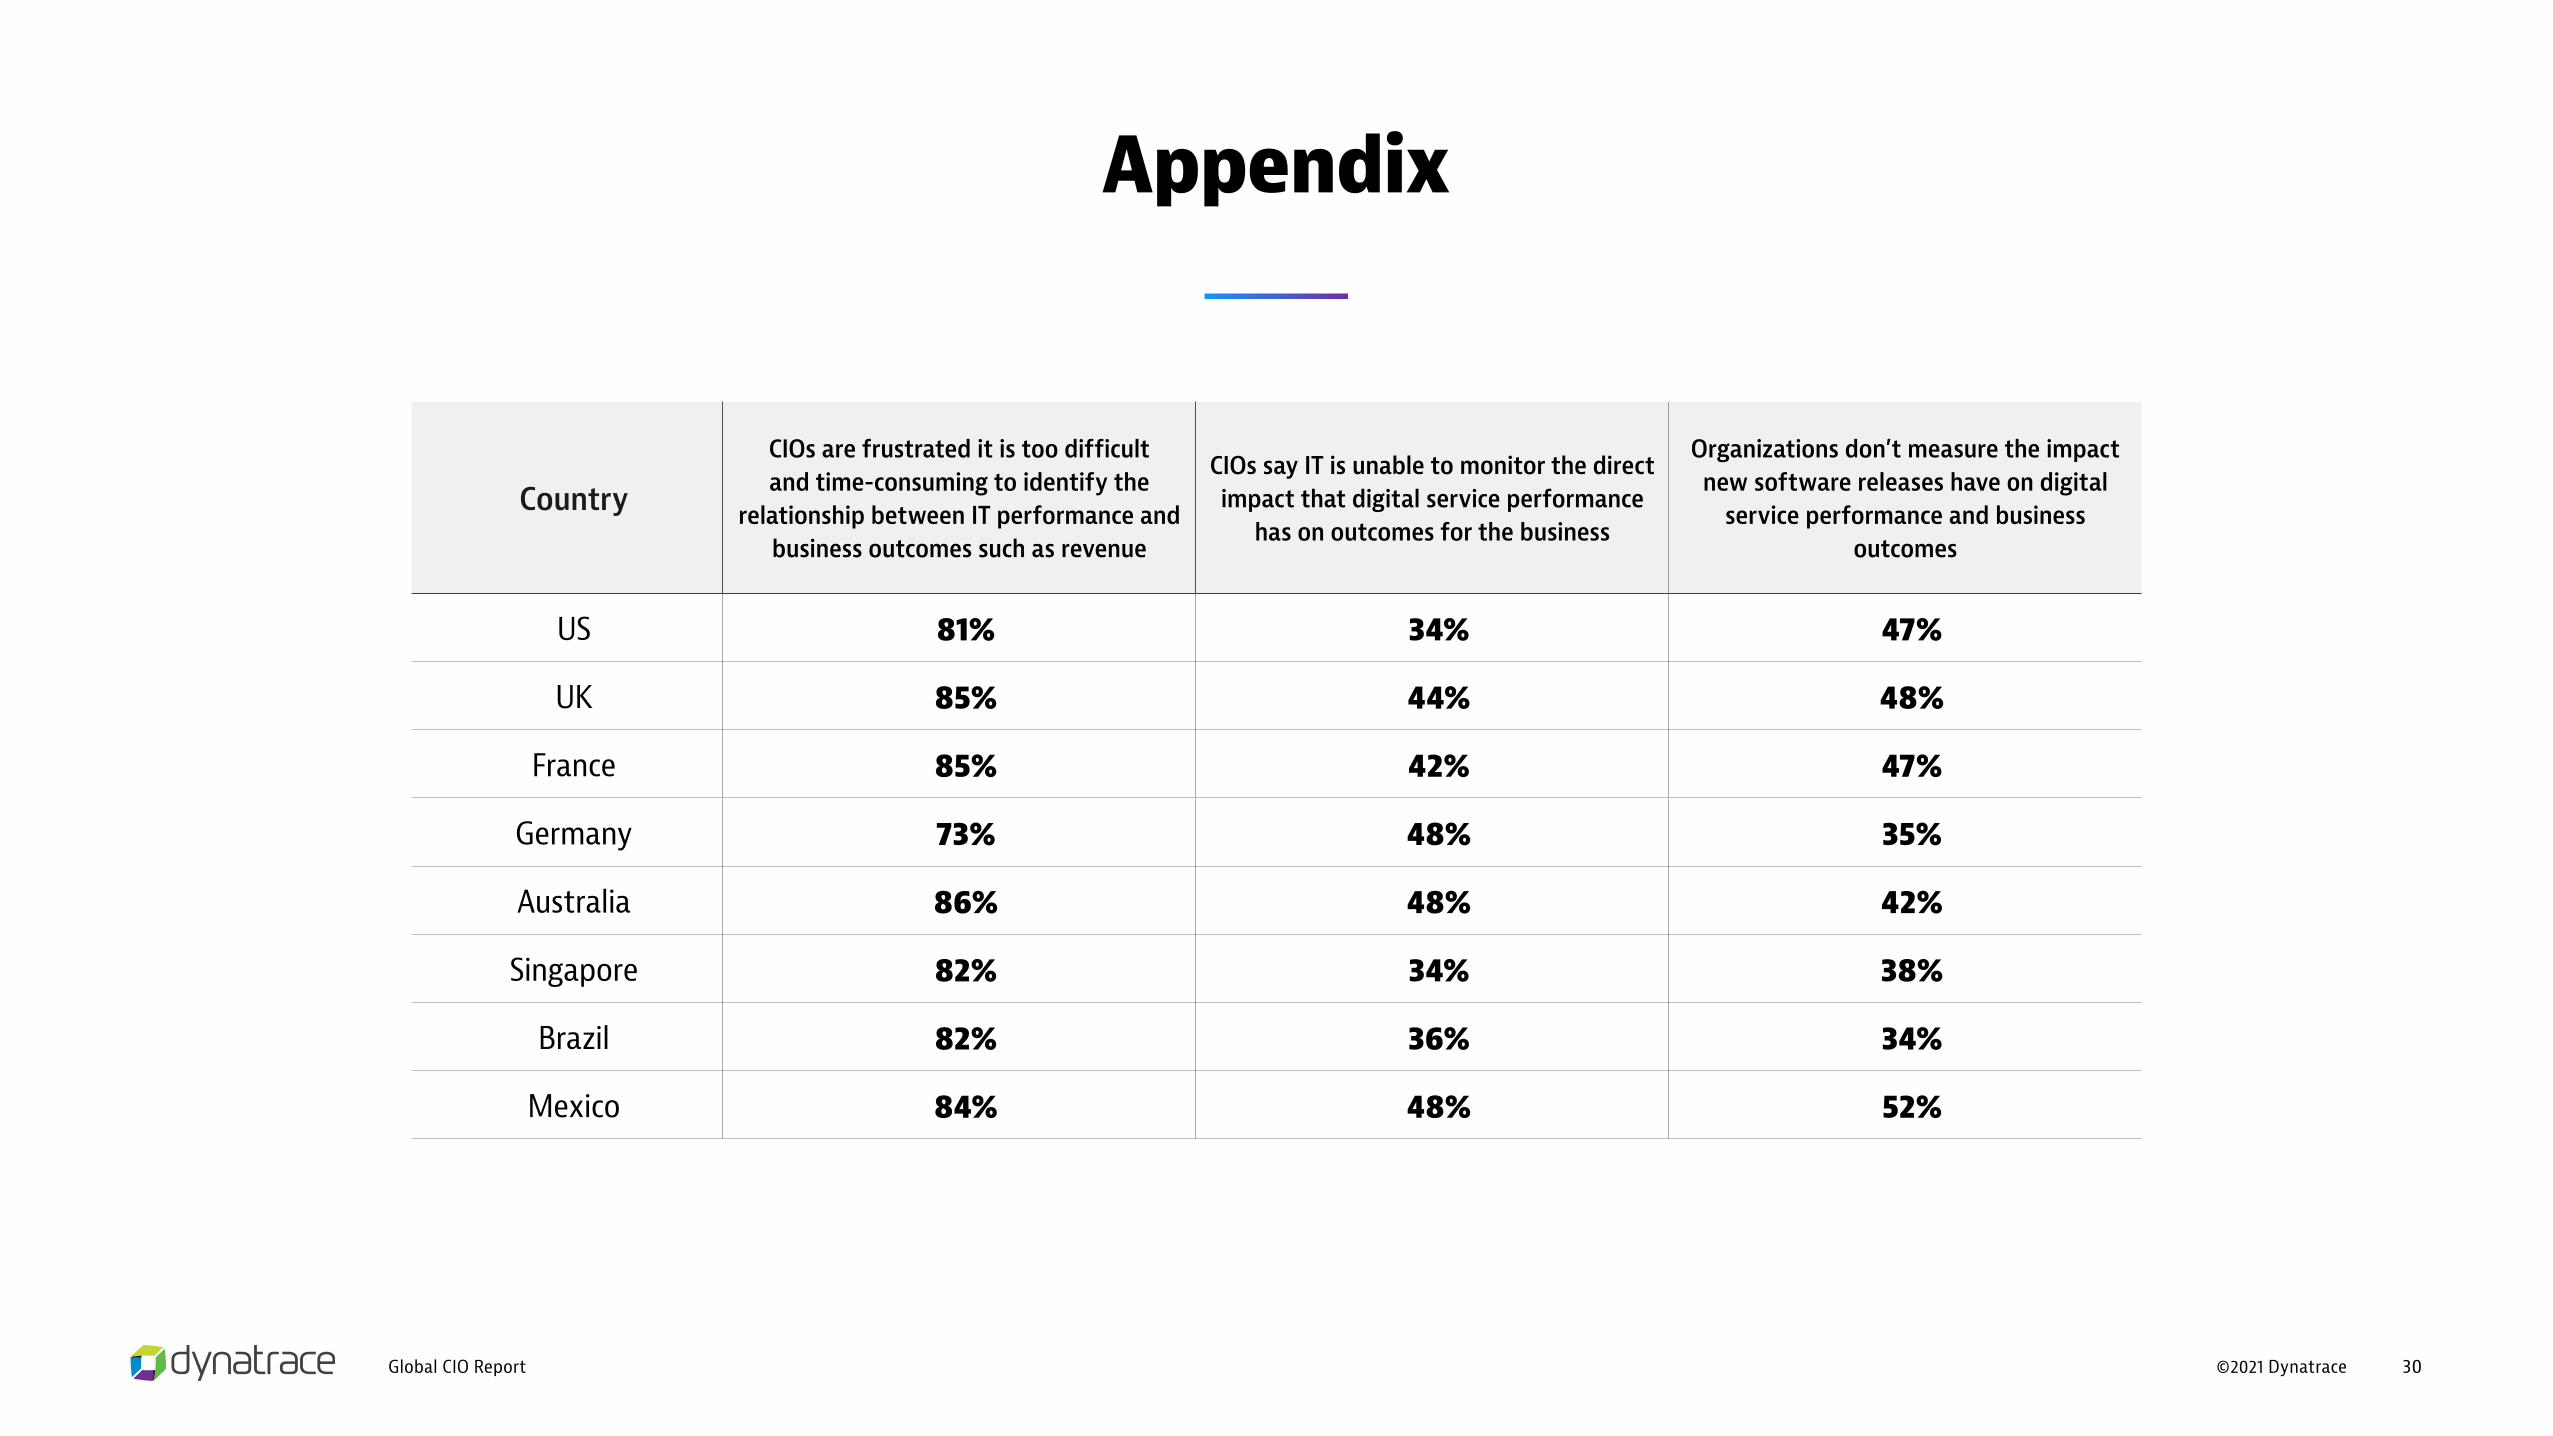
Appendix
Country
CIOs are frustrated it is too difficult and time-consuming to identify the
relationship between IT performance and business outcomes such as revenue
CIOs say IT is unable to monitor the direct impact that digital service performance
has on outcomes for the business
Organizations don’t measure the impact new software releases have on digital
service performance and business outcomes
US 81% 34% 47%
UK 85% 44% 48%
France 85% 42% 47%
Germany 73% 48% 35%
Australia 86% 48% 42%
Singapore 82% 34% 38%
Brazil 82% 36% 34%
Mexico 84% 48% 52%

©2021 DynatraceGlobal CIO Report 31
Appendix
Country
CIOs say they need to start making more data-driven decisions about the investments they make in IT to ensure
that they’re maximizing the benefit to the business and end-users
CIOs say they are fed up with the need to piece together data from a mixed bag of
tools to understand and measure the impact that their investments in
IT have on the business
Organizations have a single platform that enables all teams to collaborate
to understand the impact that IT has on the business
US 96% 69% 17%
UK 94% 79% 2%
France 92% 80% 23%
Germany 99% 87% 11%
Australia 86% 64% 6%
Singapore 100% 76% 12%
Brazil 98% 62% 22%
Mexico 96% 60% 16%
©2021 DynatraceGlobal CIO Report 32
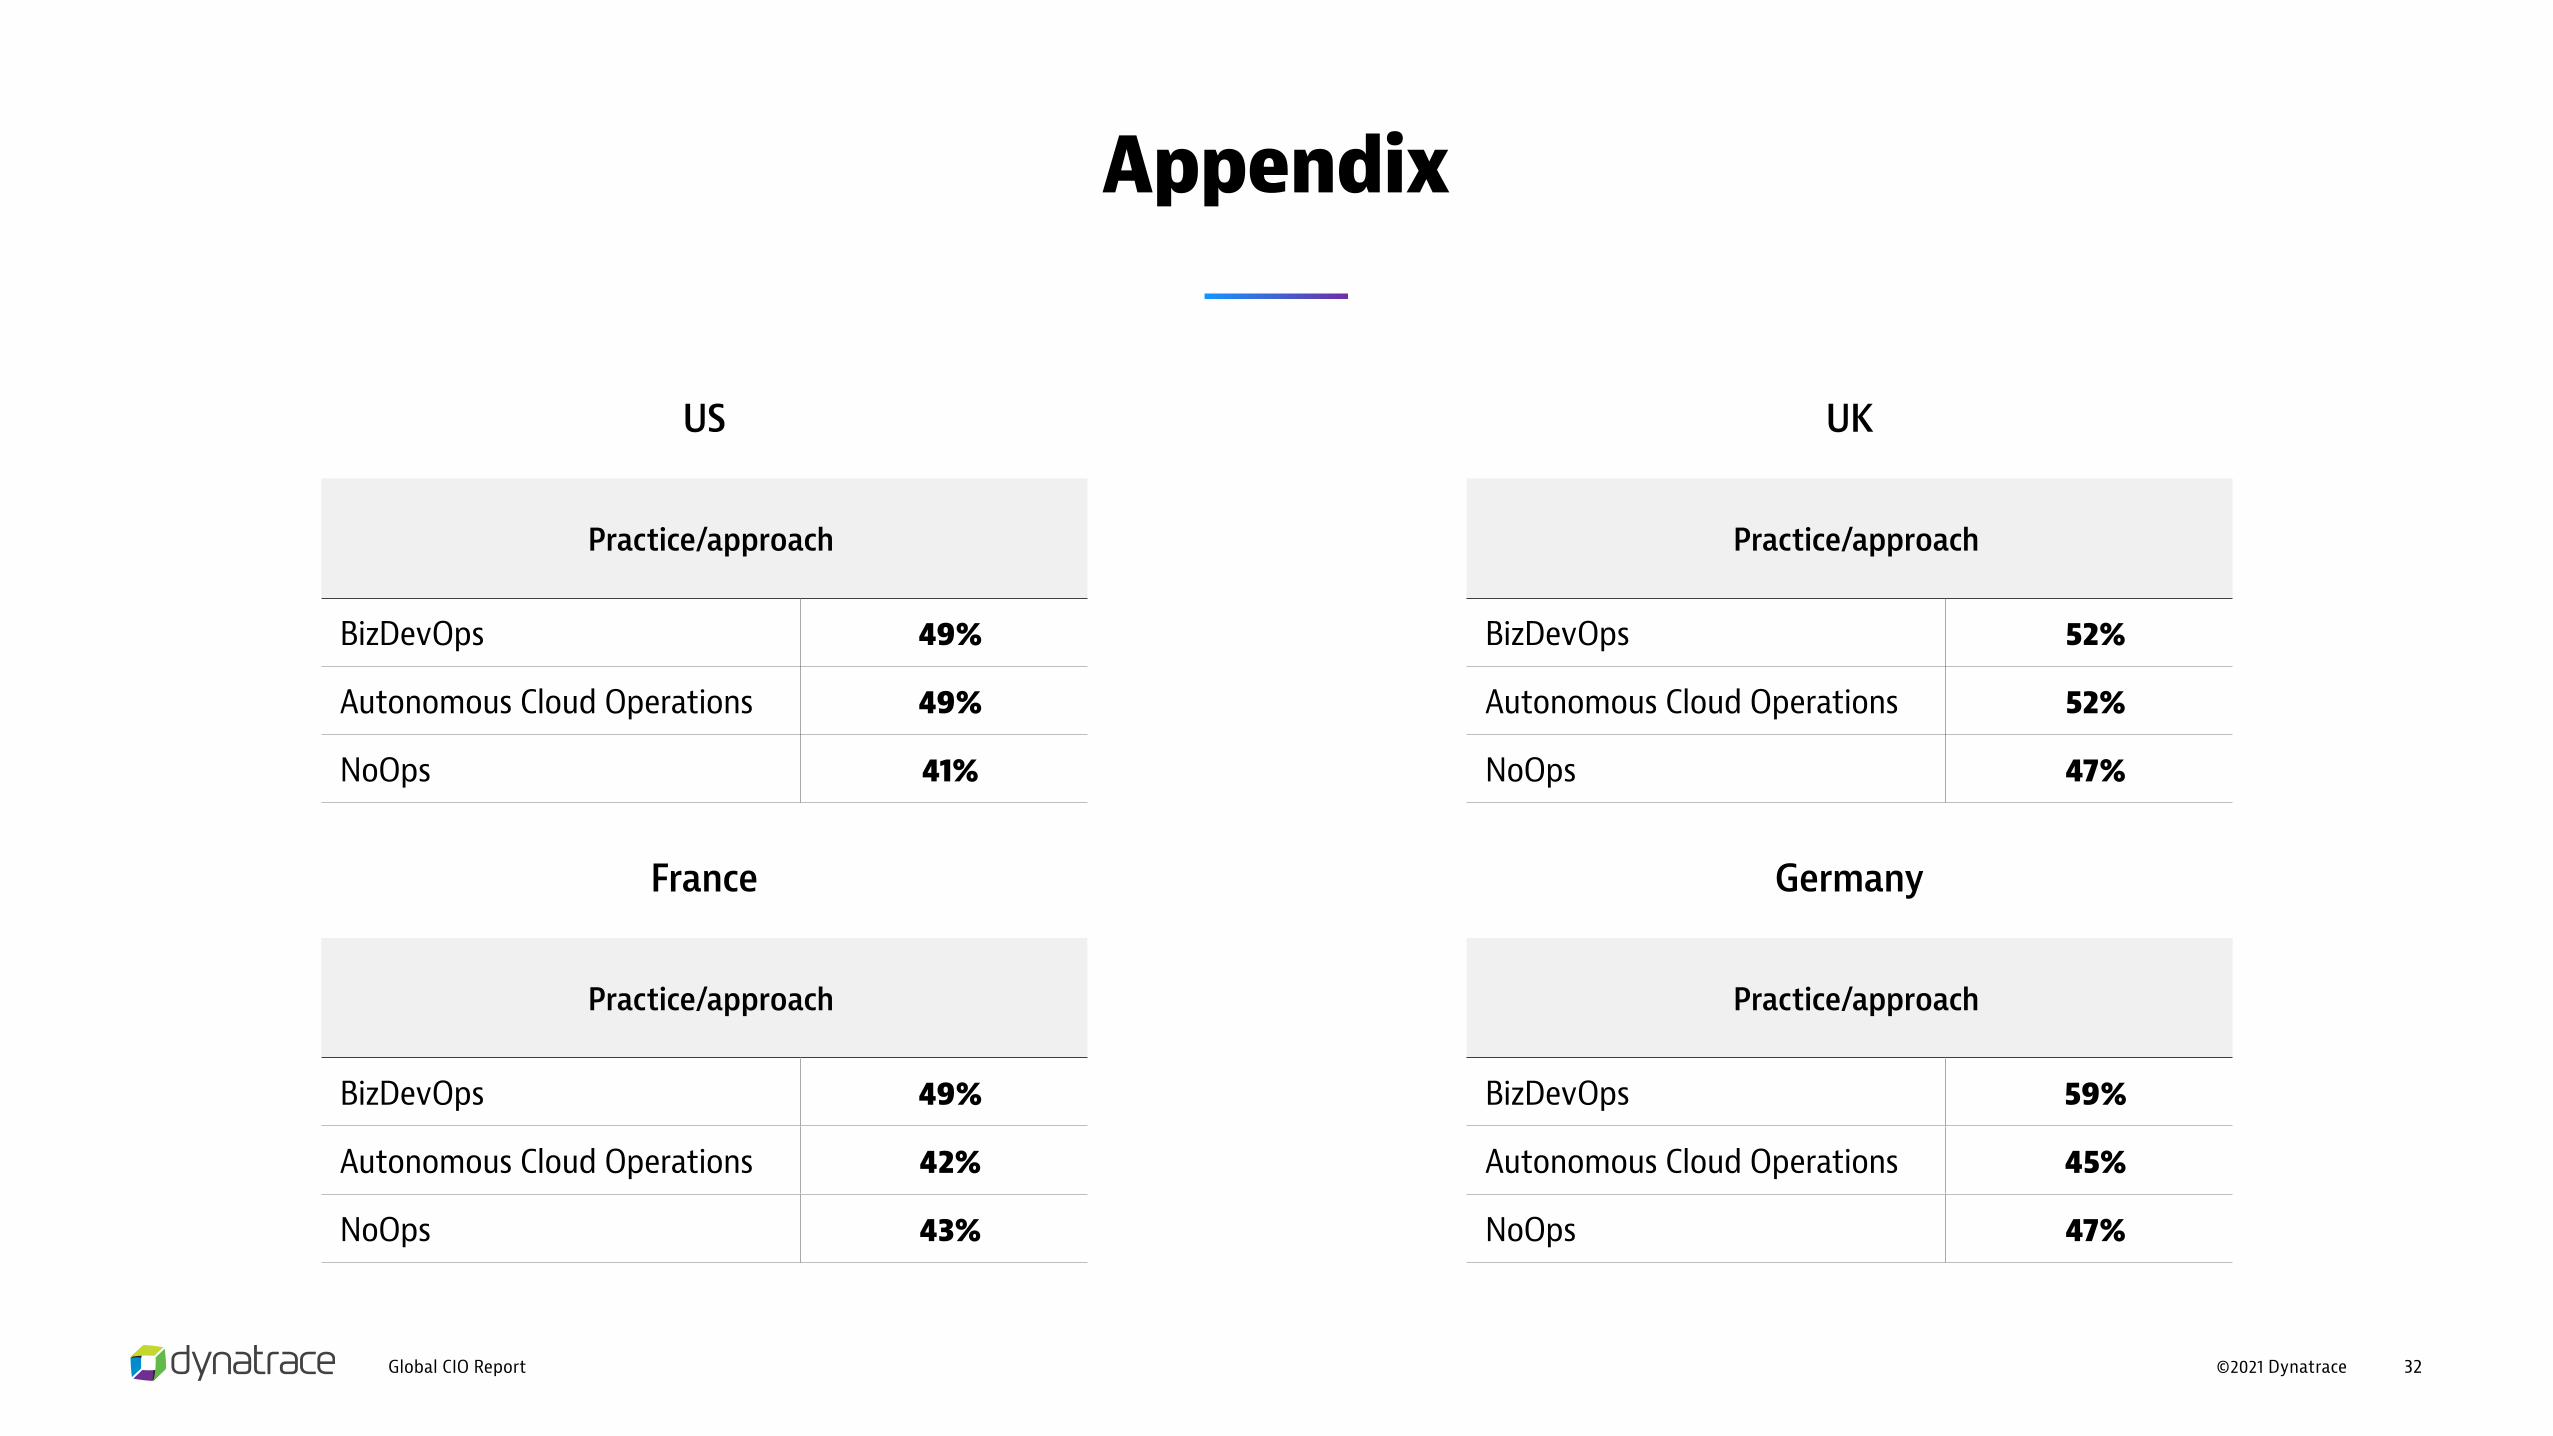
Appendix
Practice/approach
BizDevOps 49%
Autonomous Cloud Operations 49%
NoOps 41%
US
Practice/approach
BizDevOps 52%
Autonomous Cloud Operations 52%
NoOps 47%
UK
Practice/approach
BizDevOps 49%
Autonomous Cloud Operations 42%
NoOps 43%
France
Practice/approach
BizDevOps 59%
Autonomous Cloud Operations 45%
NoOps 47%
Germany
©2021 DynatraceGlobal CIO Report 33
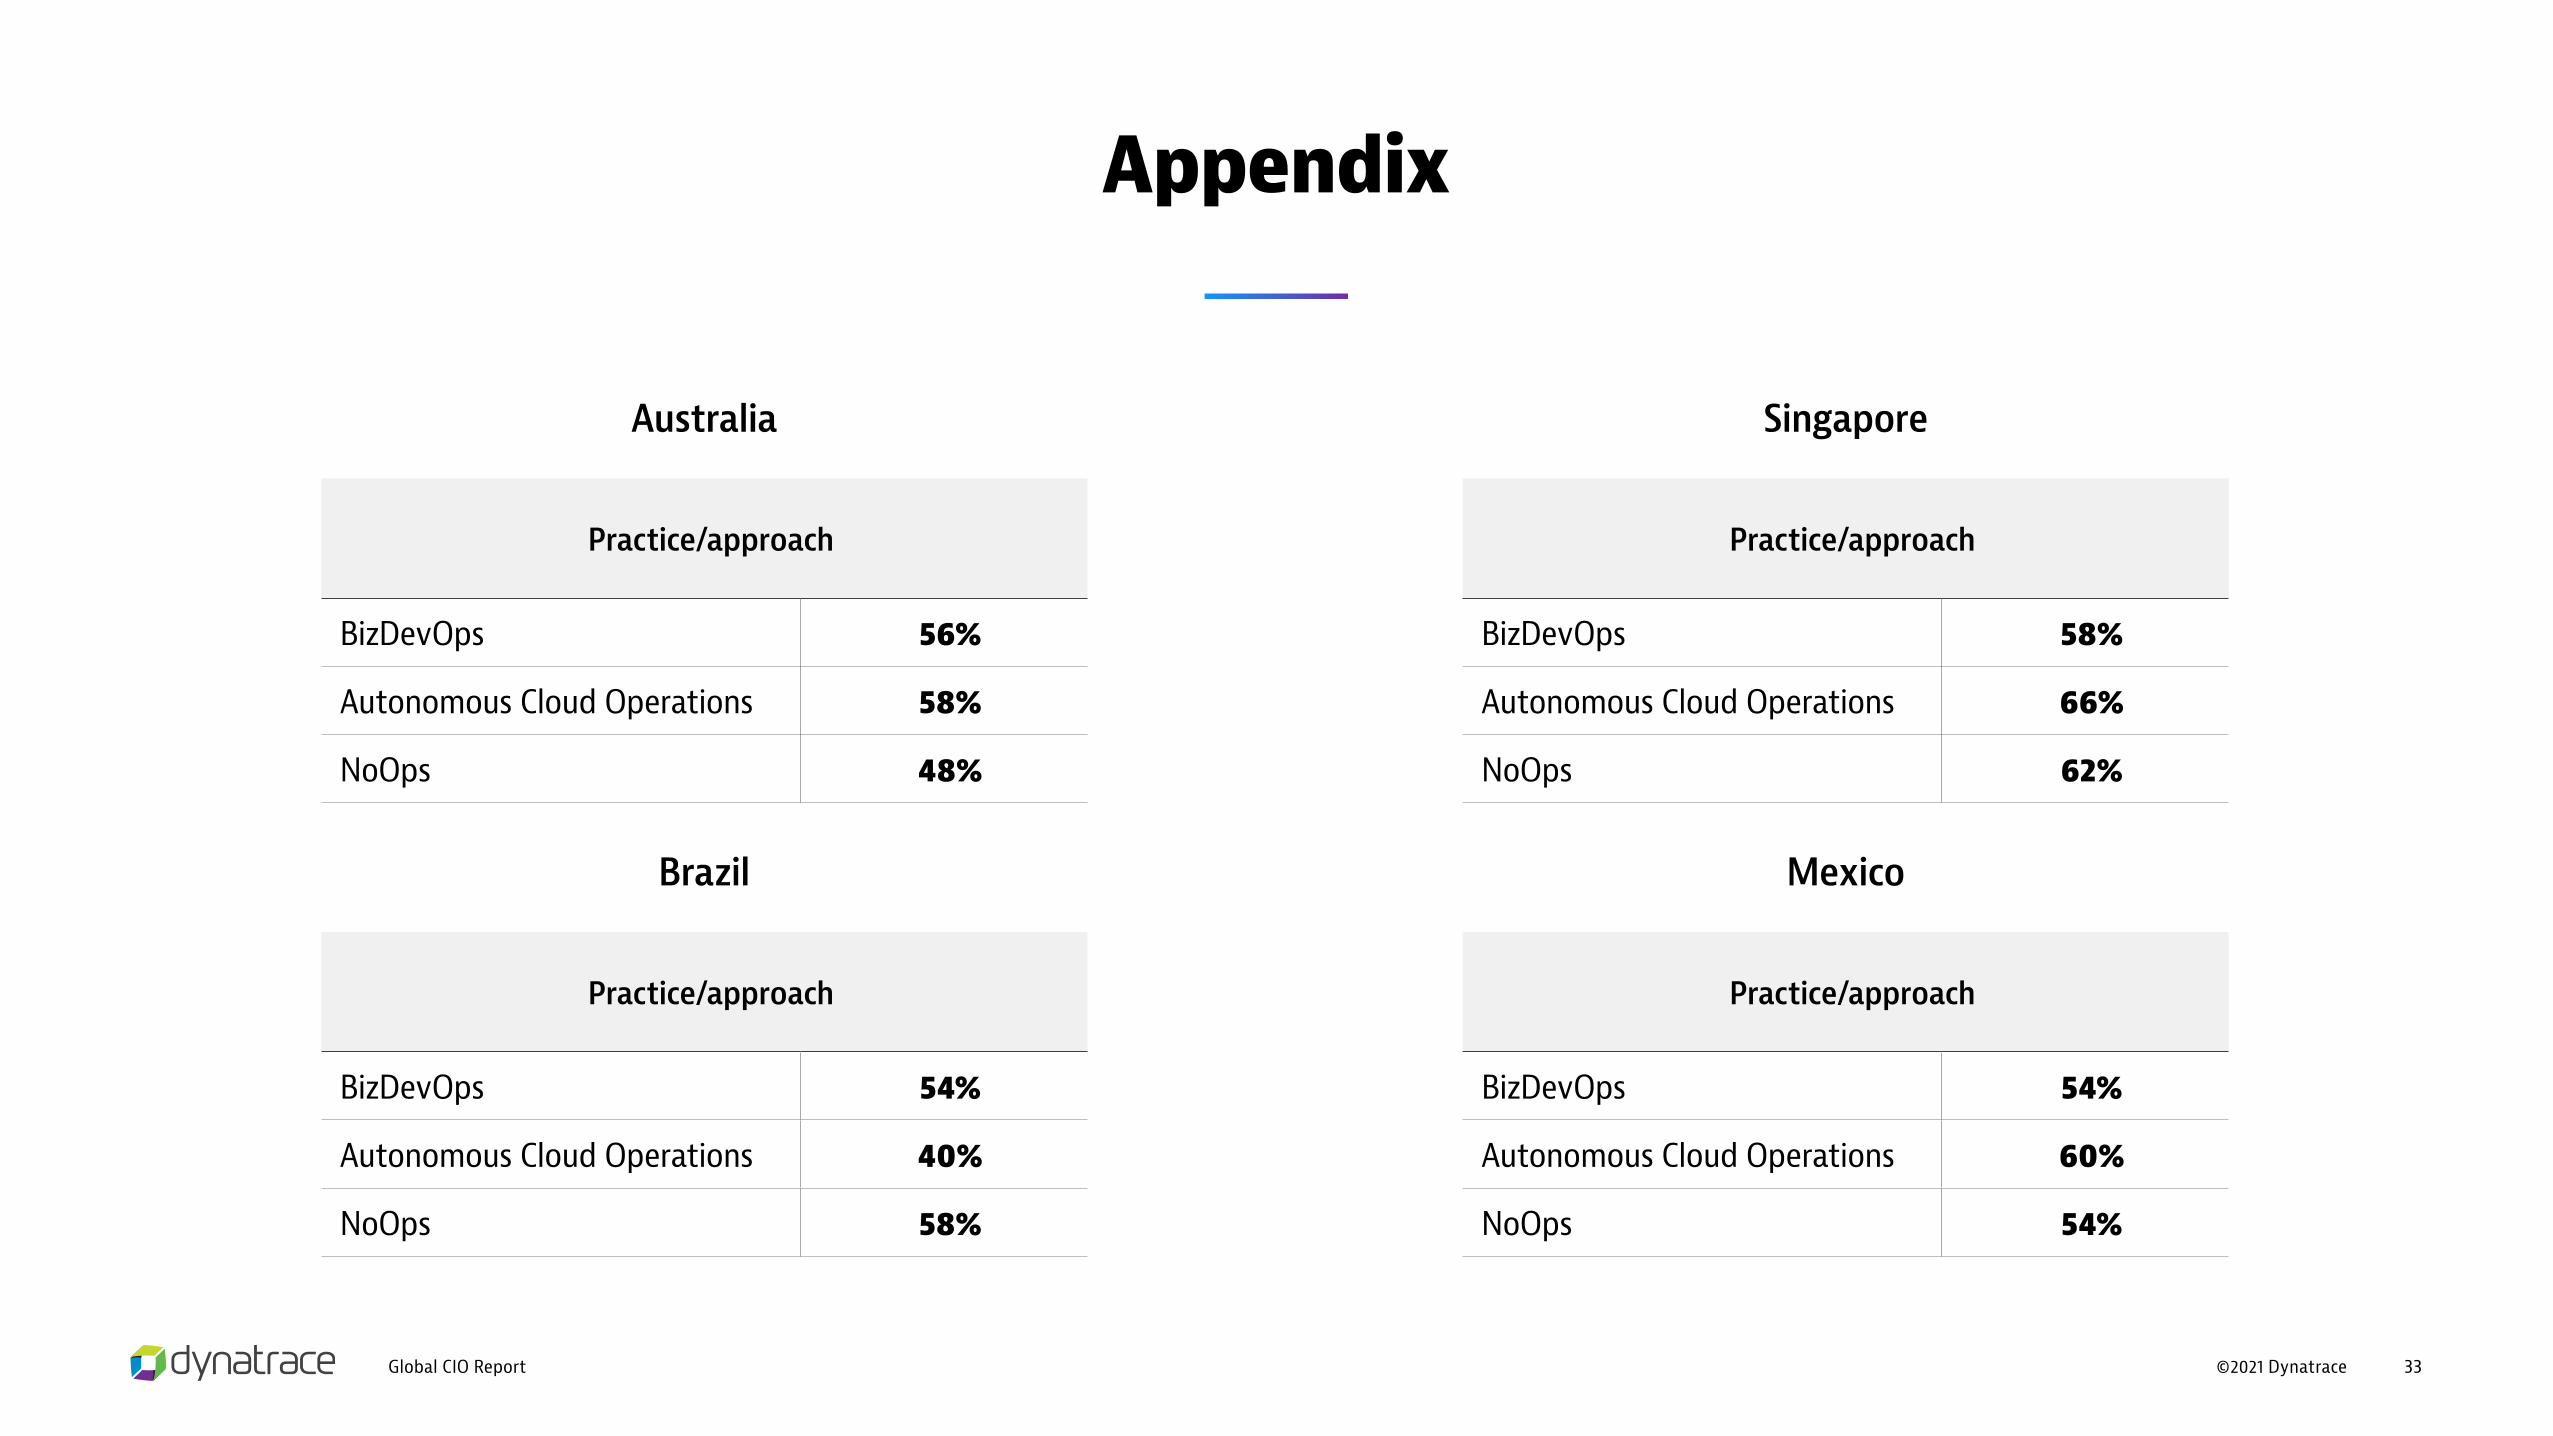
Appendix
Practice/approach
BizDevOps 56%
Autonomous Cloud Operations 58%
NoOps 48%
Australia
Practice/approach
BizDevOps 58%
Autonomous Cloud Operations 66%
NoOps 62%
Singapore
Practice/approach
BizDevOps 54%
Autonomous Cloud Operations 60%
NoOps 54%
Mexico
Practice/approach
BizDevOps 54%
Autonomous Cloud Operations 40%
NoOps 58%
Brazil
About Dynatrace
Dynatrace provides software intelligence to simplify cloud complexity and accelerate digital transformation. With automatic and intelligent observability at scale, our all-in-one platform delivers precise answers about the performance and security of applications, the underlying infrastructure, and the experience of all users to enable organizations to innovate faster, collaborate more efficiently, and deliver more value with dramatically less effort. That’s why many of the world’s largest enterprises trust Dynatrace® to modernize and automate cloud operations, release better software faster, and deliver unrivalled digital experiences.
blog @dynatrace
©2021 Dynatrace
If you are ready to learn more, please visit dynatrace.com/platform for assets, resources, and a free 15-day trial.Learn more
Transform faster with automatic and intelligent observability
We hope this ebook has inspired you to take the next step in your digital journey.
Dynatrace delivers software intelligence to help DevSecOps teams across every industry tame cloud complexity and accelerate digital transformation.
01.15.20 10833_EBK_jw