Global burden of neural tube defects, risk factors ... · Global burden of neural tube defects,...
24
Global burden of neural tube defects, risk factors, prevention, and the role of folic acid National Center on Birth Defects and Developmental Disabilities Division of Birth Defects and Developmental Disabilities Joe Sniezek, MD, MPH Amy Cordero, MPA Prevention Research Branch National Center for Birth Defects and Developmental Disabilities
Transcript of Global burden of neural tube defects, risk factors ... · Global burden of neural tube defects,...

Global burden of neural tube defects, risk factors, prevention, and the role of folic acid
National Center on Birth Defects and Developmental Disabilities
Division of Birth Defects and Developmental Disabilities
Joe Sniezek, MD, MPH
Amy Cordero, MPA
Prevention Research Branch
National Center for Birth Defects and Developmental Disabilities
Outline
Definition of birth defects
Global burden
Neural tube defects
Global burden
Risk Factors
Prevention strategies with folic acid
SEARO/CDC collaboration
Defining Birth Defects
Structural or functional abnormalities that are present from birth
Potential for serious adverse effect on health, development, or functional ability
Can be caused by single gene defects, chromosomal disorders, multifactorial inheritance, environmental teratogens or micronutrient deficiencies
Often also referred to as congenital anomalies or congenital malformations

Burden of Birth Defects
1 in 33 infants has a birth defect (~3%)
4.8 million infants globally
1 in 260 infants dies because of a birth defect
0.6 million infants globally
Underestimated
Spontaneous abortion
Stillbirths
Elective Termination of Pregnancy for Fetal Anomaly (ETOPFA)

Birth Defects: Overall Global Burden
3.0 %
340,000
470,000
540,000
820,000
1,130,000
1,500,000
0 500,000 1,000,000 1,500,000
EUROPE
AMERICAS
EAST-MEDITER
WEST PACIFIC
SOUTH-EAST-ASIA
AFRICA
4,800,000 Globally =
Data of Total Births 2010 from WHO Statistics Website

March of Dimes Global Report on Birth Defects (2006): A Paucity of Data
“There is a paucity of data on the birth prevalence of birth defects in middle- and low-income countries”
Why?
Constrained diagnostic capability
Poor health-related statistics
Lack of birth defect surveillance and registries
Reliance on hospital-based rather than population-based studies
Systematic underestimation of the toll of birth defects

Prevalence of Birth Defects (MoD estimates)
0
10
20
30
40
50
60
70
80
Pre
va
len
ce p
er
1,0
00
bir
ths Others ICD-10 Q00-Q99
Estimated number (per 1,000 – per year) of infants with birth defects (BD,Chrom, Single Gene, Genetic/Haemolysis/Jaundice)
Source: March of Dimes Global Report on Birth Defects, 2006

0
10
20
30
40
50
60
70
80
Pre
va
len
ce p
er
1,0
00
bir
ths
Others ICD-10 Q00-Q99
Estimated number (per 1,000 – per year) of infants with birth defects (BD, Chrom, Single Gene, Genetic-Haemolysis/Jaundice)
Source: March of Dimes Global Report on Birth Defects, 2006
• Congenital heart defects: 1,000,000
• Neural tube defects: 350,000
• Down syndrome: 220,000
Prevalence of Birth Defects (MoD estimates)

Under 5-year Mortality due to BDs by WHO regions: Rate, Percentage and Absolute Numbers
2.0
2.6
3.2
3.8
4.0
5.3
0.0 1.0 2.0 3.0 4.0 5.0 6.0
WEST PACIFIC
EUROPE
AMERICAS
SOUTH-EAST-ASIA
EAST-MEDITER
AFRICA
Rate U-5y-M per 1,000
Globally 3.9 per 1,000
29,000
49,000
56,000
71,000
143,000
263,000
0 50,000 100,000150,000200,000250,000300,000
EUROPE
AMERICAS
WEST PACIFIC
EAST-MEDITER
SOUTH-EAST-ASIA
AFRICA
Number of Deaths Under 5y
Globally 611,000
4.6%
6.7%
6.8%
11.9%
17.3%
18.6%
0.0% 5.0% 10.0% 15.0% 20.0%
AFRICA
EAST-MEDITER
SOUTH-EAST-ASIA
WEST PACIFIC
AMERICAS
EUROPE
% of U-5y death due to BD
Globally 6.2%
2010 Data from WHO Statistics Website

Overall Under 5-year Mortality (line) and % of Deaths due to BDs (bars) by WHO Region and Country Income
0%
10%
20%
30%
40%
0.0
20.0
40.0
60.0
80.0
100.0
120.0
140.0
160.0
180.0
De
ath
s d
ue
to
BD
s (%
)
Un
de
r-5
mo
rta
lity
ra
te (
pe
r 1
,00
0
bir
ths)
Birth defects Under-5 mortality rate
LegendCountries income: 1= High, 2=Upper-Middle, 3=Lower-Middle , 4=Low
WHO Regions: AFR=Africa, AM= Americas, EM=Eastern Mediterranean, EU=Europe, SE=South East Asia; WP=Western Pacific
World Health Statistics 2010 datahttp://apps.who.int/gho/data/node.main.1?lang=en http://apps.who.int/gho/data/node.main.1?lang=en
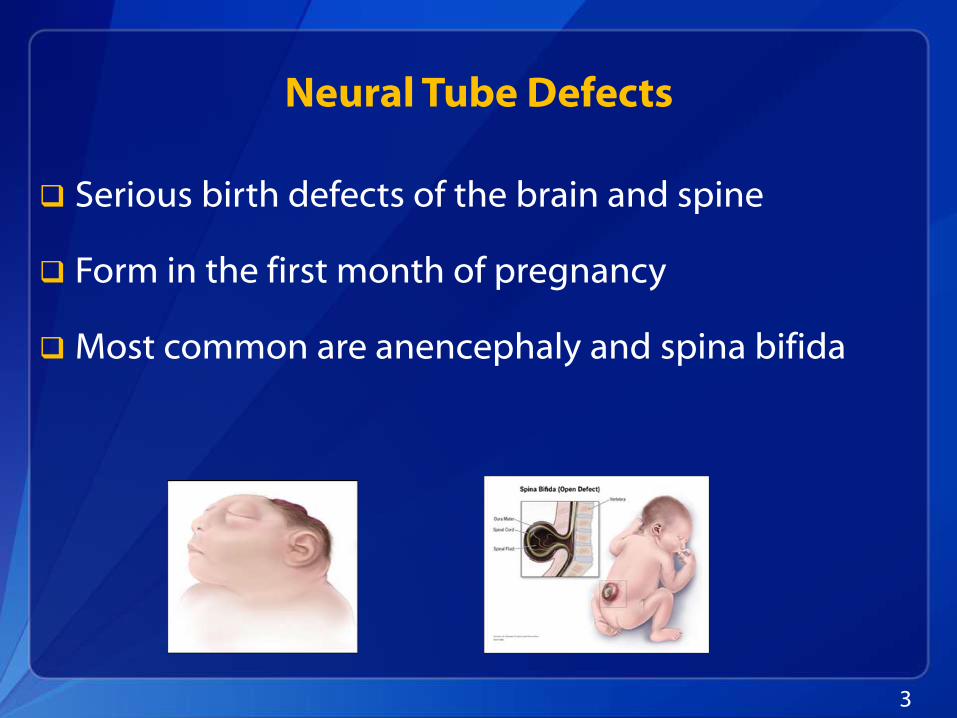
Serious birth defects of the brain and spine
Form in the first month of pregnancy
Most common are anencephaly and spina bifida
Neural Tube Defects
3

Global Burden of Neural Tube Defects
More than 300,000 neural tube defects each year worldwide*
Occur widely
Different geographical areas
Countries of varying levels of economic development
Among diverse populations
Remain a significant, preventablecause of mortality and morbidity worldwide
* Christianson A, Howson CP, Model B. March of Dimes Global Report on Birth Defects: the hidden toll of dying and disabled children. 2006. March of Dimes Birth Defects Foundation, New York.
7
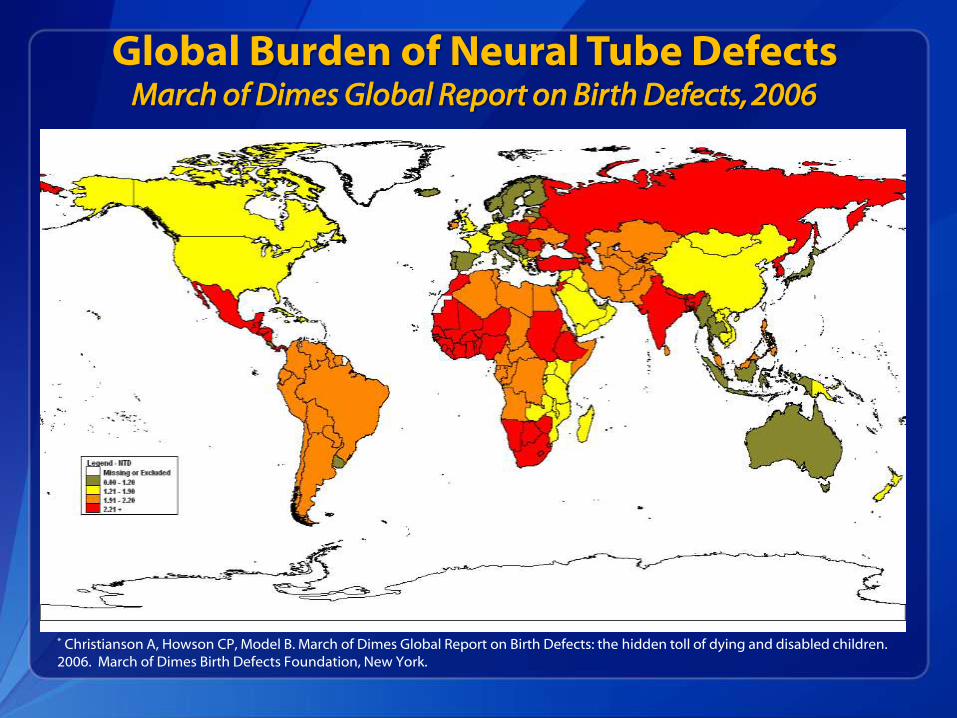
Global Burden of Neural Tube DefectsMarch of Dimes Global Report on Birth Defects, 2006
* Christianson A, Howson CP, Model B. March of Dimes Global Report on Birth Defects: the hidden toll of dying and disabled children. 2006. March of Dimes Birth Defects Foundation, New York.

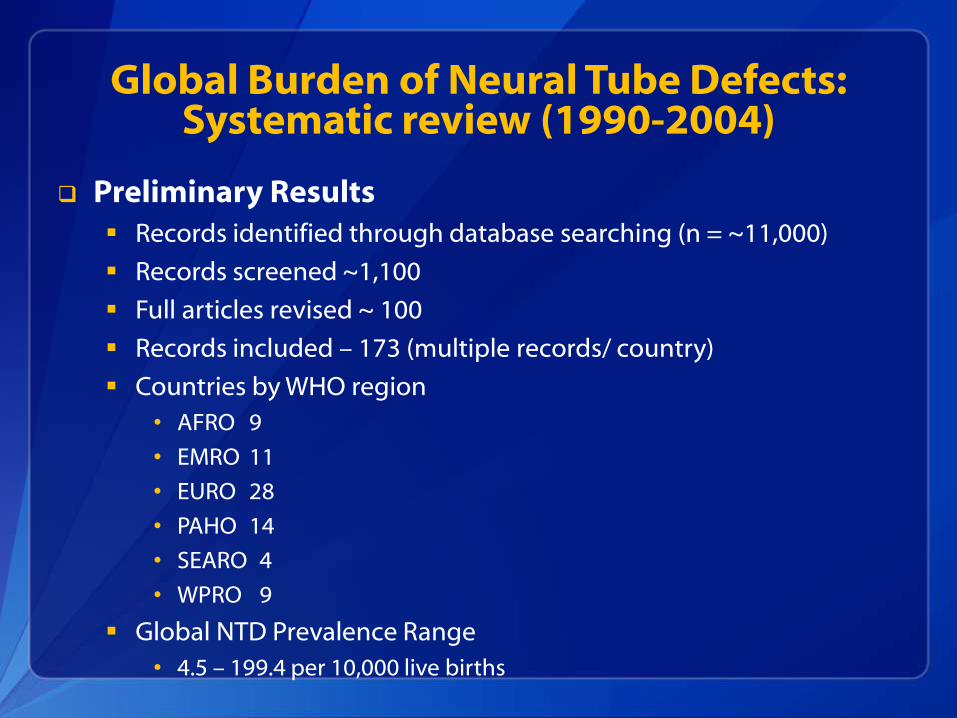
Global Burden of Neural Tube Defects:Systematic review (1990-2004)
Objectives
To assess the extent to which neural tube defects are a global public health problem
Summarize prevalence estimates of NTDs at the greatest population representation available
Assess differences in NTDs prevalence by WHO regions and country income level (low, medium and high)
Identify gaps in information

Global Burden of Neural Tube Defects:Systematic review (1990-2004)
Methods
Search• Database search of PubMed, Google Scholar, EUROCAT, ICBDSR
registries
• Observational studies and reports published during 1990 -2014
• Observational studies and registry reports and databases
Included studies• NTD diagnosis, reported number of cases and total number of births
• Reported at least spina bifida or total NTD cases
• Registries were pre-identified
Excluded: studies • No reported # NTD cases, mortality reports only, ≤ 5,000 live births per
year
Global Burden of Neural Tube Defects:Systematic review (1990-2004)
Preliminary Results Records identified through database searching (n = ~11,000)
Records screened ~1,100
Full articles revised ~ 100
Records included – 173 (multiple records/ country)
Countries by WHO region
• AFRO 9
• EMRO 11
• EURO 28
• PAHO 14
• SEARO 4
• WPRO 9
Global NTD Prevalence Range
• 4.5 – 199.4 per 10,000 live births
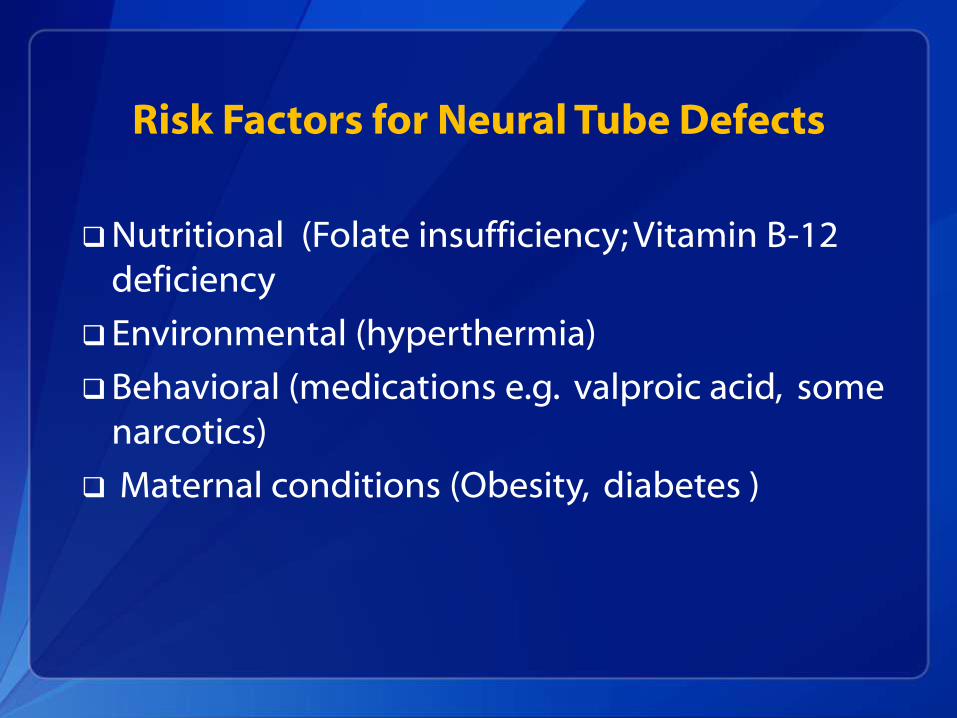
Risk Factors for Neural Tube Defects
Nutritional (Folate insufficiency; Vitamin B-12 deficiency
Environmental (hyperthermia)
Behavioral (medications e.g. valproic acid, some narcotics)
Maternal conditions (Obesity, diabetes )

Folic Acid and Neural Tube Defects Prevention
Role of folic acid in preventing neural tube defects is well known
The majority of neural tube defects can be prevented with 400 micrograms (mcg) of folic acid daily before and during early pregnancy
Globally many women of reproductive age do not consume enough folic acid for prevention
4CDC. www.cdc.gov/mmwr/mmwrrhtml/mmm5931a2.htm. CDC Grand Rounds: Additional Opportunities to Prevent NTD with Folic Acid Fortification

19
Diet…natural foods such as vegetables, fruits, beans, yeast, liver
Fortification … folic acid added to foods - flour, rice, pasta, breakfast cereals
Pills… folic acid-containing dietary supplements
Approaches to Increase Folate/Folic Acid Intake
Source: CDC. MMWR Recomm Rep 1992 Sep 11;41(RR-14):1-7

Neural Tube Defects Prevalence Changes:Before and After Folic Acid Fortification
10.8
15.817.1
9.7
14.1
6.9
8.6 8.6
6.3
9.8
0
5
10
15
20
US Canada Chile Costa Rica South Africa
Before fortification
After fortification
-31%
Sources: US: CDC. CDC grand rounds: additional opportunities to prevent neural tube defects with folic acid fortification. MMWR. 2010;59(31):980-4.Canada: De Wals et al. 2007. Reduction in neural-tube defects after folic acid fortification in Canada. N Engl J Med357: 135–142.Chile: Cortes F et al. Wheat flour fortification with folic acid: changes in neural tube defects rates in Chile. Amer Jnl Med Genet A. 2012 Aug;158A(8):1885-90. Costa Rica; Tacsan Chen L. The Costa Rican experience: Reduction of neural tube defects following food fortification program. Nutr Revs. 2004: 62(6):S40-S43.South Africa: Sayed AR. Decline in the prevalence of neural tube defects following folic acid fortification and its cost-benefit in South Africa. Birth Defects Res A Clin MolTeratol. 2008:82(4): 211-6.
Rate per 10,000 births
-36%-46% -50%
-35%
5

Year of Fortification
Return on Investment
South Africa 2003 30 to 1
Chile 1998 12 to 1
US 1996 150 to 1
Fortification: Cost Effectiveness
Sources:• South Africa – Sayed AR, et al. Decline in the prevalence of neural tube defects following folic acid fortification and its
cost-benefit in South Africa . Birth Defects Research Part a-Clinical and Molecular Teratology2008 Apr;82(4):211-6.• Chile – Llanos A, et al. Cost-effectiveness of a folic acid fortification program in Chile. Health Policy2007;83(2-3):295-303• US – Grosse S et al. Assessing the health and economic impacts of prevention: A case study of folic acid fortification in
the United States. Unpublished manuscript. 2014
6

Birth Defects COUNTCountries and Organizations United for Neural Tube Defects Prevention
CDC is working with partners to advance neural tube defects prevention globally through folic acid food fortification and supplementation
Contribute to the achievement of the Millennium Development Goal 4 (reduce under-5 mortality)
Support the 63rd World Health Assembly resolution on birth defects
Focus on regions where prevention opportunities will have greatest impact
South-East Asia and Africa
8

Birth Defects COUNTSouth-East Asia
WHO-SEARO and Member States working together to move forward birth defects prevention and surveillance
Regional Strategic Framework for Birth
Defects Prevention and Control 8 countries have held national meetings to adapt
into national action plan

The findings and conclusions in this presentation are those of the presenters and do not necessarily represent the official position of the Centers for Disease Control and Prevention.
National Center on Birth Defects and Developmental Disabilities
Division of Birth Defects and Developmental Disabilities
Thank you
For more information please contact Centers for Disease Control and Prevention
1600 Clifton Road NE, Atlanta, GA 30333
Telephone: 1-800-CDC-INFO (232-4636)/TTY: 1-888-232-6348
E-mail: [email protected] Web: http://www.cdc.gov