Global Biodiversity Scenarios - agci.org · Global Biodiversity Scenarios ... and relevant stories...
38
Global Biodiversity Scenarios Socio-economic and ecological drivers affecting biodiversity change in the next century Osvaldo E. Sala Brown University Aspen Global Change Institute- 21-24 July 2005
Transcript of Global Biodiversity Scenarios - agci.org · Global Biodiversity Scenarios ... and relevant stories...

Global Biodiversity Scenarios
Socio-economic and ecological drivers affectingbiodiversity change in the next century
Osvaldo E. SalaBrown University
Aspen Global Change Institute- 21-24 July 2005

ScenariosScenarios are plausible, challenging,and relevant stories about how thefuture may unfold that can be told bothin words and numbersScenarios are not forecasts, projectionsor predictionsScenarios illuminate costs and benefitsof different pathsScenarios should provide guidance foraction

MODELS
SCENARIOS
STORIES
QUALITATIVE
QUANTITATIVE
Naki_enovi_ et al. 2000

Conceptual FrameworkHuman
Behavior
EcosystemFunctioning
Biodiversity
DirectDrivers
Indirect Drivers
Human Well-being *
*
DIRECT DRIVERS
CHANGES IN:
• LAND USE• CLIMATE• ATMOSPHERIC COMPOSITON• NITROGEN DEPOSITION• BIOTIC EXCHANGE
INDIRECT DRIVERS
• POPULATION GROWTH• DEGREE OF GLOBALIZATION• SOCIO-ECONOMIC DEVELOPMENT• TECHNOLOGICAL PROGRESS

First approximation
“Business-as-usual” socio-economicscenario
Different scenarios respond to currentecological uncertainty

Expected changes in drivers
0
1
2
3
4
5
Arctic
Alpine
Boreal
Grassla
nd
Savan
naMed
Desert
N Temp
S TempTro
pic
Impa
ct o
n bi
odiv
ersi
ty
Land-useClimate N depositionBiot ExchCO2
Sala et al. 2000 Science 287:1770

Biome Sensitivity
0
1
2
3
4
5Ar
ctic
Alpi
neBo
real
Gra
ssla
ndSa
vann
aM
edDe
sert
N te
mp
S te
mp
Trop
ic
Impa
ct o
n B
iodi
vers
ity
Land-use
Climate
N-deposition
CO2
Sala et al. 2000 Science 287:1770

DRIVERS
ΔCO2
ΔClimate
ΔLandUse
ΔN
ΔBiotic Ex
ΔBiodiversity
Biome
SensitivityCO2
SensitivityClimate
SensitivityLand Use
SensitivityN
SensitivityBiotic Ex
NO INTERACTIONS (SUM)
ΔBiodiversity
ΔBiodiversity
ΔBiodiversity
ΔBiodiversity
ΔBiodiversity
BIOMESENSITIVITY

ANTAGONISTIC (MAX)DRIVERS
ΔCO2
ΔClimate
ΔLandUse
ΔN
ΔBiotic Ex
ΔBiodiversity
Biome
SensitivityCO2
SensitivityClimate
SensitivityLand Use
SensitivityN
SensitivityBiotic Ex
ΔBiodiversity
ΔBiodiversity
ΔBiodiversity
ΔBiodiversity
ΔBiodiversity
BIOMESENSITIVITY
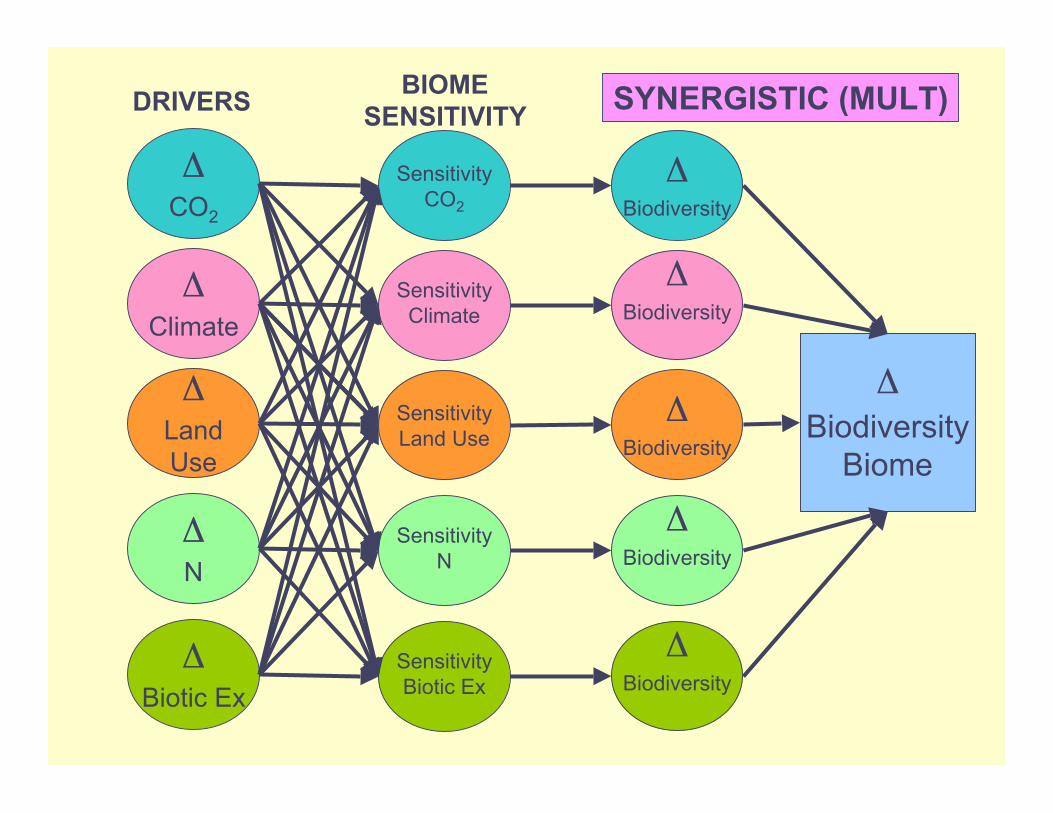
SYNERGISTIC (MULT)DRIVERS
ΔCO2
ΔClimate
ΔLandUse
ΔN
ΔBiotic Ex
ΔBiodiversity
Biome
SensitivityCO2
SensitivityClimate
SensitivityLand Use
SensitivityN
SensitivityBiotic Ex
ΔBiodiversity
ΔBiodiversity
ΔBiodiversity
ΔBiodiversity
ΔBiodiversity
BIOMESENSITIVITY

Relative effects of drivers
0
0.2
0.4
0.6
0.8
1
Land use
Climate
N deposit
ion
Biotic Exc
hange
Atmos C
O 2
Rel
ativ
e ef
fect
of d
river
s
Sala et al. 2000 Science 287:1770

Differences among biomes
0.2
Tropical
0
0.40.60.81
Savanna
00.20.40.60.8
1
S Temp
00.20.40.60.8
1
N Temp
00.20.40.60.81
00.20.40.60.8
1 Grassland
Boreal
00.20.40.60.8
1 Alpine
00.20.40.60.8
1Desert
00.2
0.40.60.8
1
Mediterranean
00.2
0.40.60.8
1 Arctic
00.2
0.60.8
1
0.4
Rel
ativ
e B
iodi
vers
ity C
hang
e
Land
use
Atm
os C
O 2
N De
posi
tion
Clim
ate
Biot
ic E
xcha
nge
Land
use
Atm
os C
O 2
N De
posi
tion
Clim
ate
Biot
ic E
xcha
nge
Land
use
Atm
os C
O 2
N De
posi
tion
Clim
ate
Biot
ic E
xcha
nge
Land
use
Atm
os C
O 2
N De
posi
tion
Clim
ate
Biot
ic E
xcha
nge
Land
use
Atm
os C
O 2
N De
posi
tion
Clim
ate
Biot
ic E
xcha
nge
Land
use
Atm
os C
O 2
N De
posi
tion
Clim
ate
Biot
ic E
xcha
nge
Sala et al. 2000 Science 287:1770

Relative Biodiversity ChangeNo Interactions
Sala et al. 2000 Science 287:1770

Sala et al. 2000 Science 287:1770
Relative Biodiversity ChangeAntagonistic Interactions

Sala et al. 2000 Science 287:1770
Relative Biodiversity ChangeSynergistic Interactions

Limitations
Single socio-economic path
Coarse scale of analysis

Second approximation
Millennium Assessment Scenarios
Multiple socio-economic paths Finer spatial scale than previous exercise

Millenium Assessment Scenarios
4 types of scenarios OS – Order from Strength GO – Global Orchestration TG – Technogarden AM – Adaptive Mosaic

Relationships and Interactions of People and Nature
connected
disaggregated
responsive proactive
Global Orchestration
Order from Strength
Technogarden
Adaptive Mosaic
Scenarios Framework
Adaptive Mosaic
•Local and regional flexibility•Adaptation and innovation to manage ecosystem services
Technogarden
•Technological innovation the most common approach for addressing human needs and ecosystem services
Order from Strength
•Security leads the rich to protect their borders•A world of conflict and poverty outside the borders•Negative consequences for ecosystem services
Global Orchestration
•Fair global policies for economics and environmental commons

Fair Global Local/Regional
Technological
TECHNOGARDENTECHNOGARDEN
GLOBAL GLOBAL ORCHESTRATIONORCHESTRATION ADAPTIVE MOSAICADAPTIVE MOSAIC

Population drivers MA Scenarios
4000
6000
8000
10000
12000
1995 2020 2050 2100Year
Popu
latio
n (m
illio
ns)
Order from StrengthGlobal OrchestrationTechnogardenAdaptive Mosaic

Rate of disappearance of forest landMA Scenarios
0.2
0.3
0.4
0.5
0.6
0.7
1995 2020 2050 2100Year
Perc
ent p
er y
ear
Order from StrengthGlobal OrchestrationTechnogardenAdaptive Mosaic

Development of MABiodiversity Scenarios
Direct Drivers
Land-UseChange
Climate Change
Biodiversity Scenarios

0
500
1000
1500
2000
2500
3000
0 200 400 600 800
Area (km2)
No.
of s
peci
es S = C * Az
Species Area Relationship (SAR)
UNKNOWNS• Δ A = changes in area
• C = Original speciesdensity
• Z = slope of the species-area curve

1970 2050 : Global Orchestration
2050: Order from Strength
Land cover change in IMAGEscenarios

Species numbers of vascular plants
Source: Barthlott et al., University of Bonn
Estimate species density foreach combination of IMAGE region and each biome type
18 regions
14 biomes
Matrix

Sala et al., in press, Millennium Assessment
Species-area relationships ofvascular plants

Biodiversity loss for MA scenarios
Sala et al., in press, Millennium Assessment
80%
85%
90%
95%
100%
1970 1990 2010 2030 2050
Rem
aini
ng d
iver
sity
Order from Strength
Global Orchestration
Techno Garden
Adaptive Mosaic

Loss of biodiversity in vascular plantsScenario: Order from Strength
Sala et al., in press, Millennium Assessment
RegionalBiome
0
5
10
15
20
25
Tundra
Boreal
Forest
Cool C
onife
r
Temp.
Mixed
Temp.
Decid.
Warm
Mixe
dStep
peDes
ertScru
b
Savan
na
Trop. W
oodla
nd
Trop. F
orest
% b
iodi
vers
ity lo
st
2050
2020
0
5
10
15
20
25
30
Austra
lasia
Afrotro
pic
Indo-M
alaya
n
Neoarc
tic
Neotro
pic
Palearc
tic
% b
iodi
vers
ity lo
st
2050
2020

Species’ loss rates of MA scenarioscompared to historic rates
Sala et al., in press, Millennium Assessment

Climate change
Sala et al., in press, Millennium Assessment
CURRENTVEGETATION
No species loss if actual vegetation area remains the same
FUTUREVEGETATION
If area shrinks --- loss of species
FUTUREVEGETATION

Effects of climate changeMA Scenarios
Sala et al., in press, Millennium Assessment

Comparison of major drivers on biodiversity loss
Sala et al., in press, Millennium Assessment
Total
0
0.25
0.5
0.75
1
Habitat Loss Climate Change
Bio
dive
rsity
impa
ct
Tundra
0
0.25
0.5
0.75
1
Habitat Loss Climate ChangeB
iodi
vers
ity im
pact
Boreal Forest
0
0.25
0.5
0.75
1
Habitat Loss Climate Change
Bio
dive
rsity
impa
ct
Tropical Forest
0
0.25
0.5
0.75
1
Habitat Loss Climate Change
Bio
dive
rsity
impa
ct
Temperate Forest
0
0.25
0.5
0.75
1
Habitat Loss Climate Change
Bio
dive
rsity
impa
ct
Warm Mixed
0
0.25
0.5
0.75
1
Habitat Loss Climate Change
Bio
dive
rsity
impa
ctOS GO TG AM

ConclusionsDiversity of vascular plants sharply declinedin all four MA scenarios during the 2000-2050-time period.Order from Strength was the scenario thatexperienced the largest losses of vascular-plant species whereas Technogarden andAdaptive Mosaic were the scenarios with thesmallest losses.The different biomes and regions of the Earthlost species at different rates during the 2000-2050 period.

ConclusionsBiodiversity Millennium Development Goals(MDG) not met by Order from Strength and Global
Orchestration barely met by Technogarden and Adaptive Mosaic
At the global level and across all scenarios,land-use change was the dominant driver ofbiodiversity changeScenarios could be a powerful tool to assistpolicy makers and communicate to thegeneral public


Layers of uncertaintyClimate
Data 20% of precipitation
trend due to instrumentchange
Emission scenariosClimate sensitivity threshold responses? clouds?
Models 3°C difference in model
output for sameemission scenario
BiologyData sampling gaps (space &
time) bias (taxon, observer) data absence = real
absence?Basic knowledge (lack ofknowledge of processes)Models
output

Layers of uncertaintyClimate
Data 20% of
precipitation trenddue to instrumentchange
Emission scenariosClimate sensitivity threshold
responses? clouds?
Models 3°C difference in
model output forsame emissionscenario
BiologyData sampling gaps
(space & time)
bias (taxon,observer)
data absence =real
absence?Basic knowledge(lack of knowledgeof processes)Models
output
Human Behavior
Pop growth
Degree of Glob
Socio-eco develop
TechnologicalProgress