
Global Best Practices in Residential Electric Rate Design · Global Best Practices in Residential...
38
The Regulatory Assistance Project 50 State Street, Suite 3 Montpelier, VT 05602 Phone: 802-223-8199 web: www.raponline.org Global Best Practices in Residential Electric Rate Design Jim Lazar Senior Advisor May, 2013
Transcript of Global Best Practices in Residential Electric Rate Design · Global Best Practices in Residential...
The Regulatory Assistance Project 50 State Street, Suite 3 Montpelier, VT 05602
Phone: 802-223-8199 web: www.raponline.org
Global Best Practices in Residential Electric Rate Design
Jim Lazar Senior Advisor
May, 2013
2
Global Best Practices
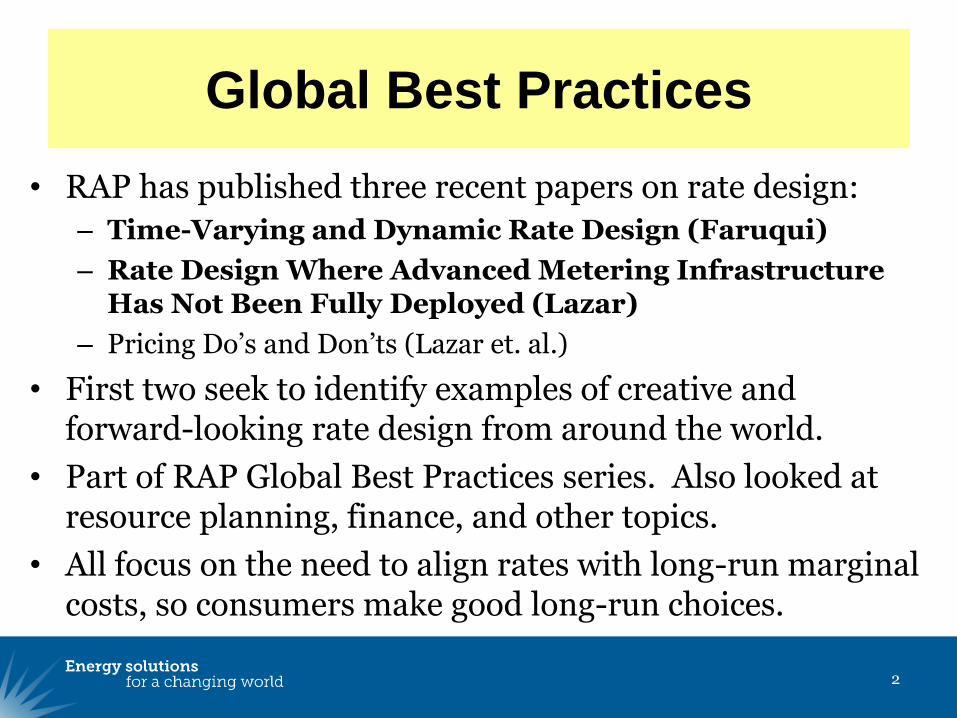
• RAP has published three recent papers on rate design:
– Time-Varying and Dynamic Rate Design (Faruqui)
– Rate Design Where Advanced Metering Infrastructure Has Not Been Fully Deployed (Lazar)
– Pricing Do’s and Don’ts (Lazar et. al.)
• First two seek to identify examples of creative and forward-looking rate design from around the world.
• Part of RAP Global Best Practices series. Also looked at resource planning, finance, and other topics.
• All focus on the need to align rates with long-run marginal costs, so consumers make good long-run choices.

From Simple to Complex
• Residential Rate Types
– Flat Rate: Uniform rate per kWh for all usage
– Inclining Block: two or more blocks of usage, with incremental usage at a higher price.
– TOU: Two or more time of use periods, with higher prices during higher-cost periods
– TOU with Inclining Block: A TOU rate that includes a lower price for lower levels of usage.
– Critical Peak: A TOU price that has a much higher price for a limited number of hours that are not known until 1 day ahead.
3

4
Peak Load Benefits of Different
Residential Rate Designs

5
Usage Impacts of Rate Design
Start With Example Bill Frequency
Bills
kWh Usage
by Customers
Ending in
Block
% of Sales to
Customer Using
More than Block
Total Block
Sales Including
Sales to
Customers
Exceeding
Block Limit
% of Sales In
Block
0 - 250 154,281 22,705,353 92% 118,791,853 42%
250 - 500 176,985 64,370,066 69% 71,964,066 25%
500 - 750 94,209 57,617,207 49% 38,800,707 14%
750 - 1,000 49,741 42,864,074 34% 21,411,074 8%
>1,000 63,411 95,831,158 0% 32,420,158 11%
538,627 283,387,858 283,387,858

6
Flat vs. Inclining Block
Flat Rate Design
Total Sales 283,387,858
Flat Rate: 0.15$
Revenue 42,508,179$
Inclining Block Rate Design, 2 blocks, 1 : 1.5 Ratio
Block Sales Rate Revenue
0 - 250 118,791,853 0.11624$ 13,808,643$
>250 164,596,005 0.17436$ 28,699,536$
Total: 42,508,179$

7
Elasticity Impact of Inclining
Block Rate Design
Elasticity Effect of 2 Block Rate
Block
Sales Subject
to End Block
Rate Change
From Flat
Rate % Rate Change
Change In
Usage With
-0.2 Elasticity
0 - 250 22,705,353 (0.0338)$ -22.5% 1,021,973
>250 260,682,505 0.0244$ 16.2% -8,468,186
Net Impact on Consumption: -7,446,213
% Change in Consumption -2.6%
Inclining Block Rate with Constant Elasticity of -0.20 for Both Blocks
8
Effect of a
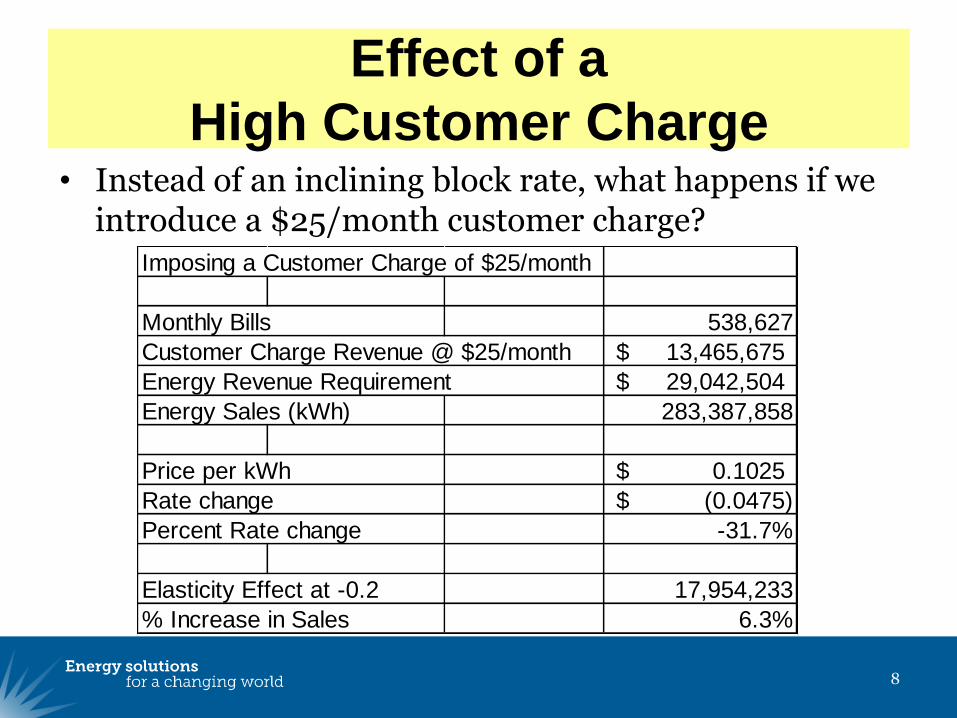
High Customer Charge • Instead of an inclining block rate, what happens if we
introduce a $25/month customer charge?
Imposing a Customer Charge of $25/month
Monthly Bills 538,627
Customer Charge Revenue @ $25/month 13,465,675$
Energy Revenue Requirement 29,042,504$
Energy Sales (kWh) 283,387,858
Price per kWh 0.1025$
Rate change (0.0475)$
Percent Rate change -31.7%
Elasticity Effect at -0.2 17,954,233
% Increase in Sales 6.3%
9
The Most Common Residential
Rate Design: Inclining Block
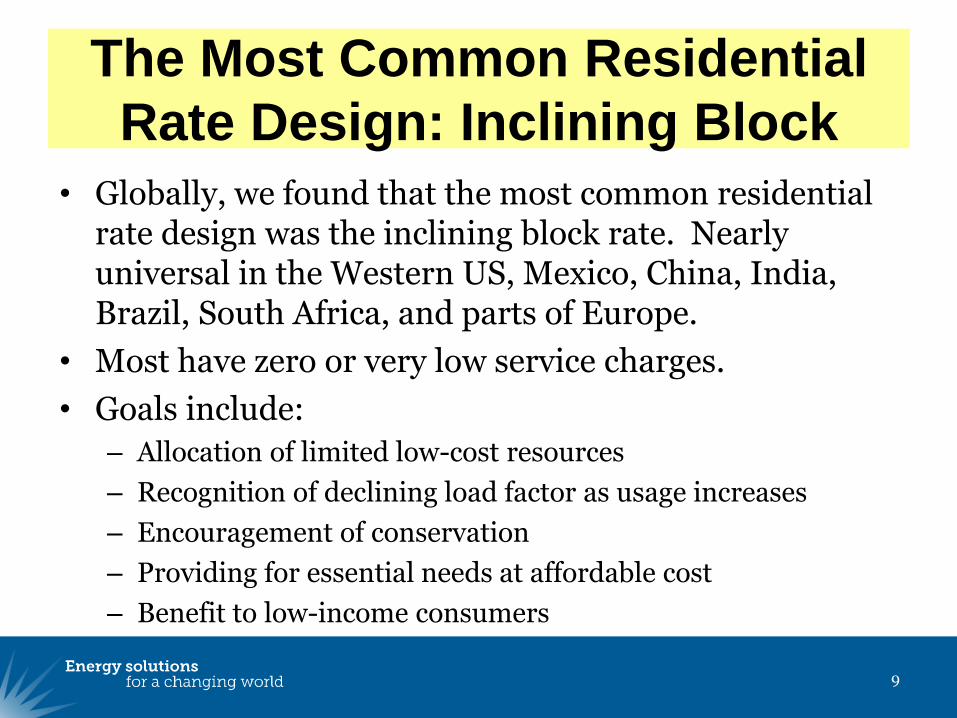
• Globally, we found that the most common residential rate design was the inclining block rate. Nearly universal in the Western US, Mexico, China, India, Brazil, South Africa, and parts of Europe.
• Most have zero or very low service charges.
• Goals include:
– Allocation of limited low-cost resources
– Recognition of declining load factor as usage increases
– Encouragement of conservation
– Providing for essential needs at affordable cost
– Benefit to low-income consumers

What Does This Rate Design Say?
The average cost of ice cream is $1.50/scoop, $1.125/scoop, and $.9167/scoop? Or:
10
Eat more ice cream!
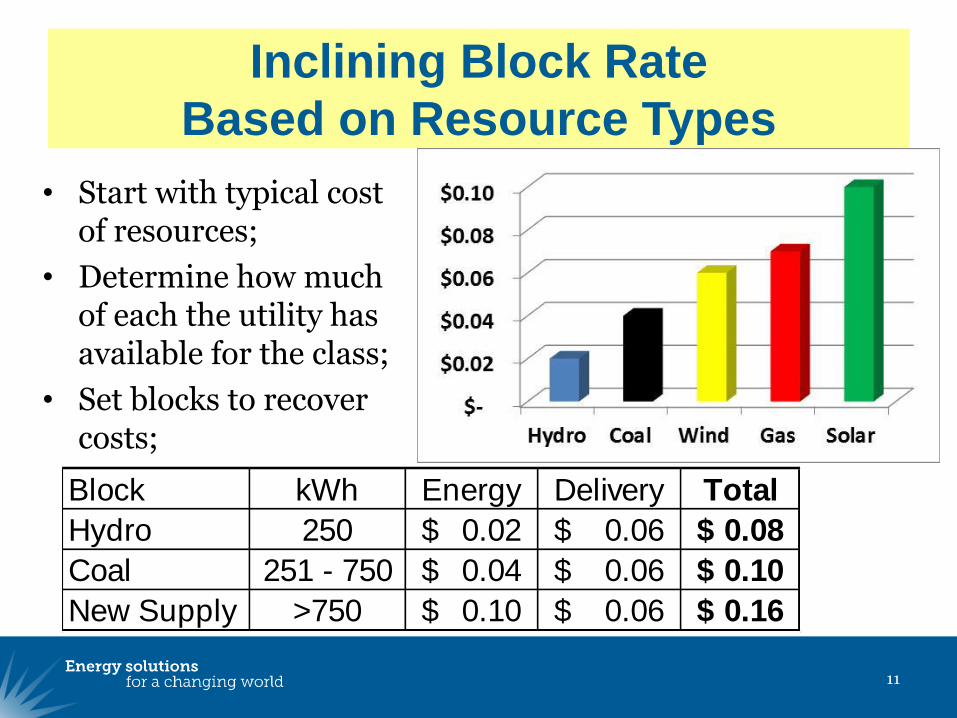
Inclining Block Rate
Based on Resource Types
• Start with typical cost of resources;
• Determine how much of each the utility has available for the class;
• Set blocks to recover costs;
11
Block kWh Energy Delivery Total
Hydro 250 0.02$ 0.06$ 0.08$
Coal 251 - 750 0.04$ 0.06$ 0.10$
New Supply >750 0.10$ 0.06$ 0.16$
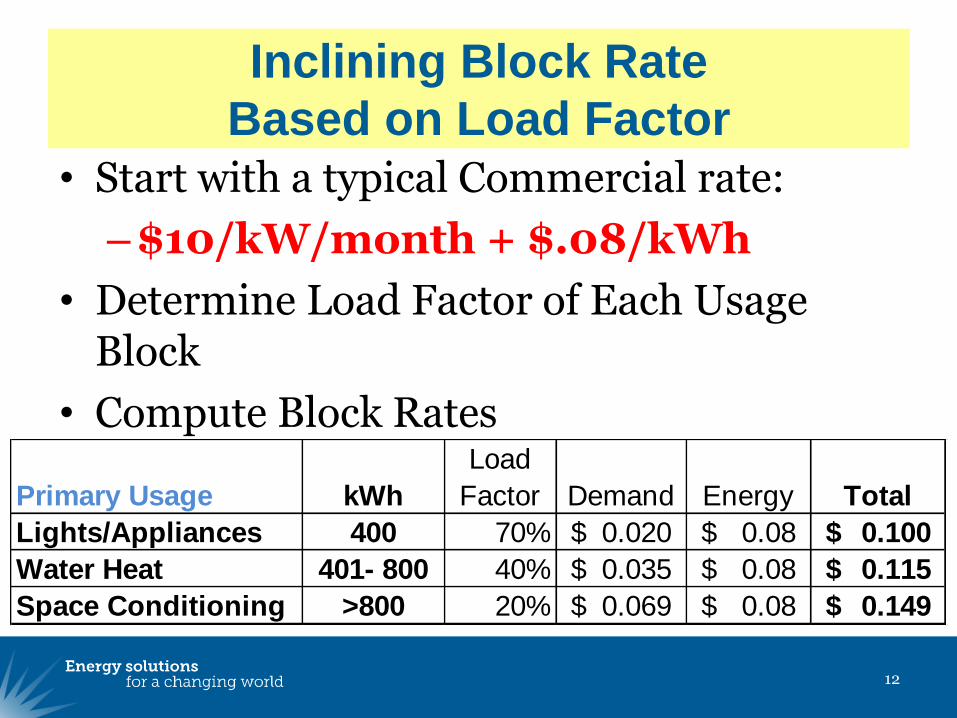
Inclining Block Rate
Based on Load Factor
• Start with a typical Commercial rate:
–$10/kW/month + $.08/kWh
• Determine Load Factor of Each Usage Block
• Compute Block Rates
12
Primary Usage kWh
Load
Factor Demand Energy Total
Lights/Appliances 400 70% 0.020$ 0.08$ 0.100$
Water Heat 401- 800 40% 0.035$ 0.08$ 0.115$
Space Conditioning >800 20% 0.069$ 0.08$ 0.149$
13
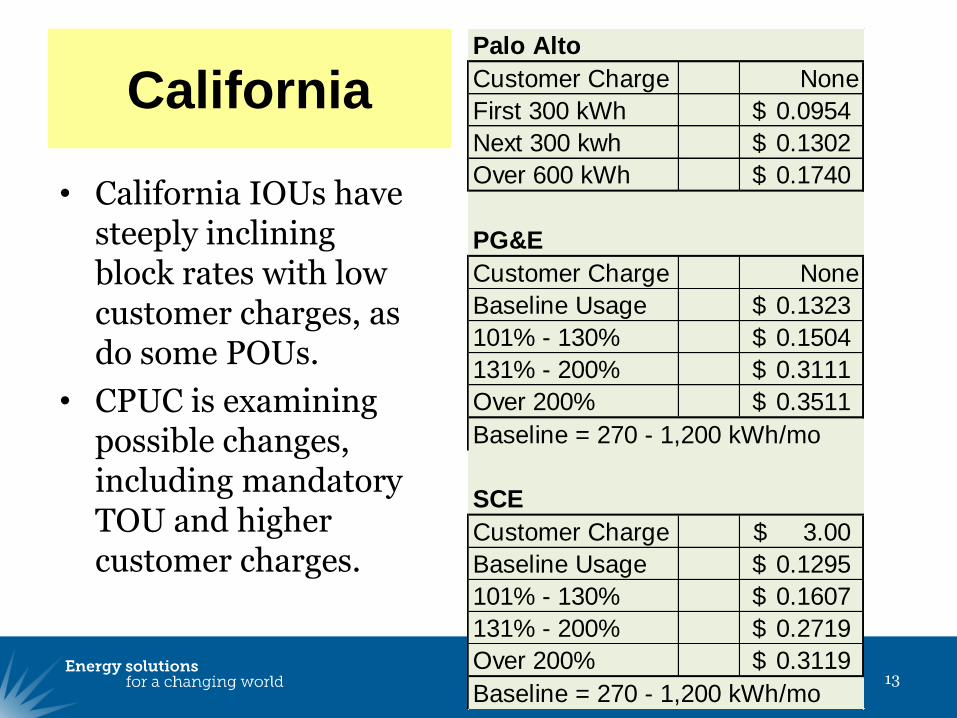
California
• California IOUs have steeply inclining block rates with low customer charges, as do some POUs.
• CPUC is examining possible changes, including mandatory TOU and higher customer charges.
Palo Alto
Customer Charge None
First 300 kWh 0.0954$
Next 300 kwh 0.1302$
Over 600 kWh 0.1740$
PG&E
Customer Charge None
Baseline Usage 0.1323$
101% - 130% 0.1504$
131% - 200% 0.3111$
Over 200% 0.3511$
Baseline = 270 - 1,200 kWh/mo
SCE
Customer Charge 3.00$
Baseline Usage 0.1295$
101% - 130% 0.1607$
131% - 200% 0.2719$
Over 200% 0.3119$
Baseline = 270 - 1,200 kWh/mo
14
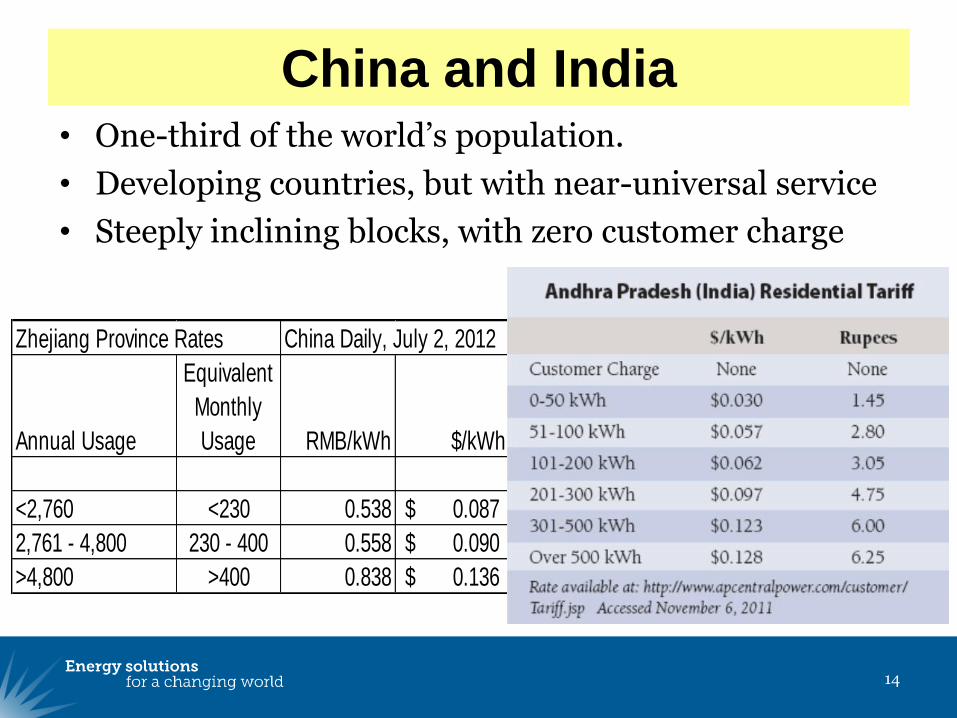
China and India • One-third of the world’s population.
• Developing countries, but with near-universal service
• Steeply inclining blocks, with zero customer charge
Zhejiang Province Rates China Daily, July 2, 2012
Annual Usage
Equivalent
Monthly
Usage RMB/kWh $/kWh
<2,760 <230 0.538 0.087$
2,761 - 4,800 230 - 400 0.558 0.090$
>4,800 >400 0.838 0.136$

15
South Africa • Half of electricity consumption in Africa
• Very sophisticated utility; moving to TOU and CPP
16
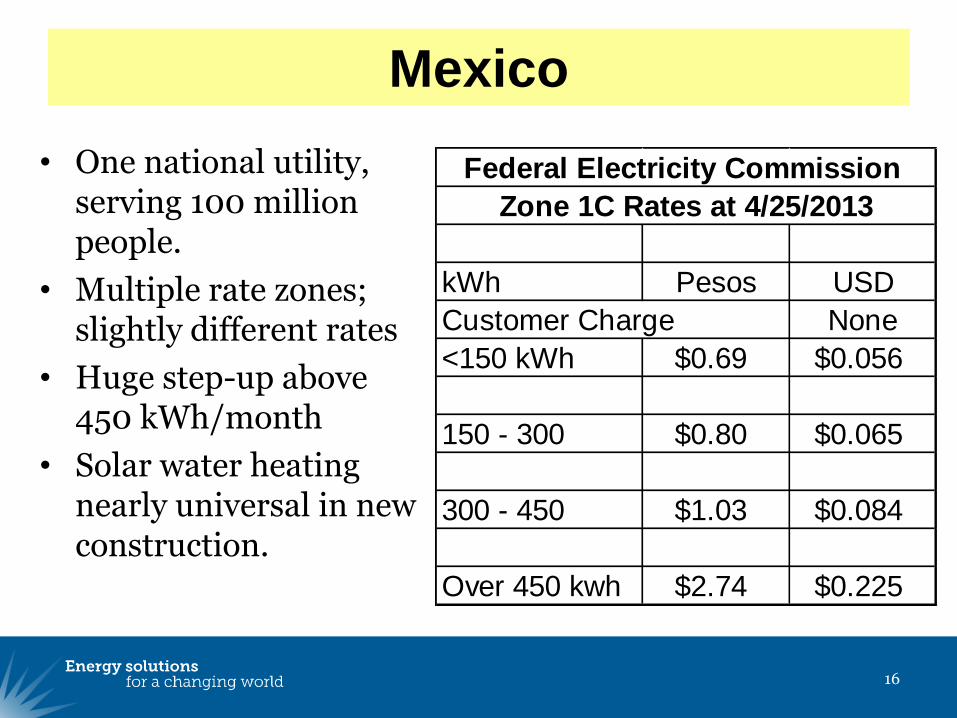
Mexico
• One national utility, serving 100 million people.
• Multiple rate zones; slightly different rates
• Huge step-up above 450 kWh/month
• Solar water heating nearly universal in new construction.
Federal Electricity Commission
Zone 1C Rates at 4/25/2013
kWh Pesos USD
Customer Charge None
<150 kWh $0.69 $0.056
150 - 300 $0.80 $0.065
300 - 450 $1.03 $0.084
Over 450 kwh $2.74 $0.225
17
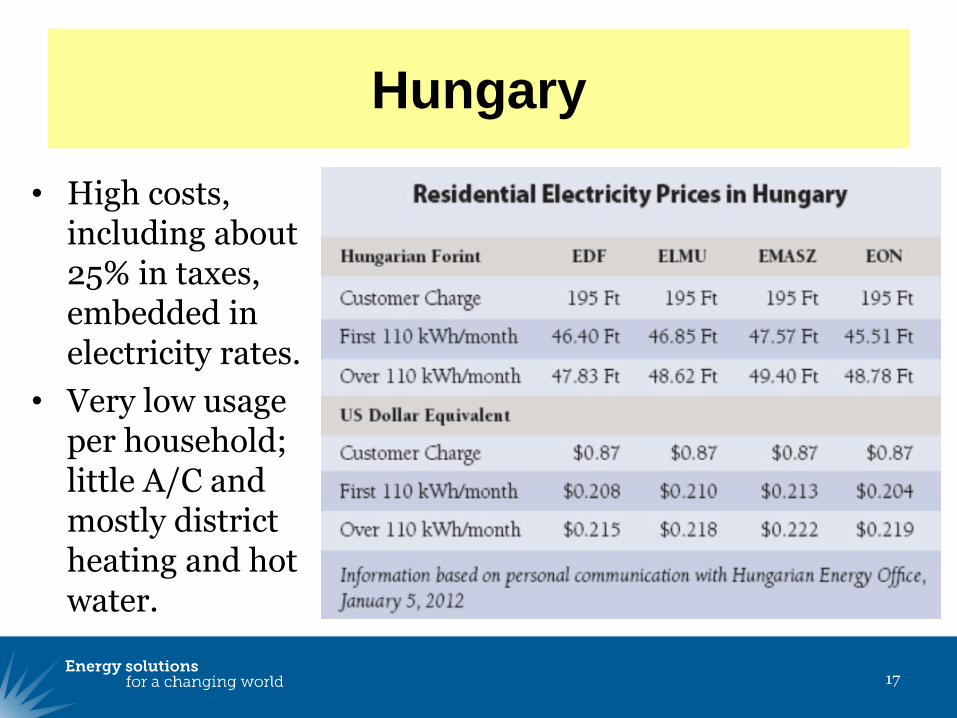
Hungary
• High costs, including about 25% in taxes, embedded in electricity rates.
• Very low usage per household; little A/C and mostly district heating and hot water.
18
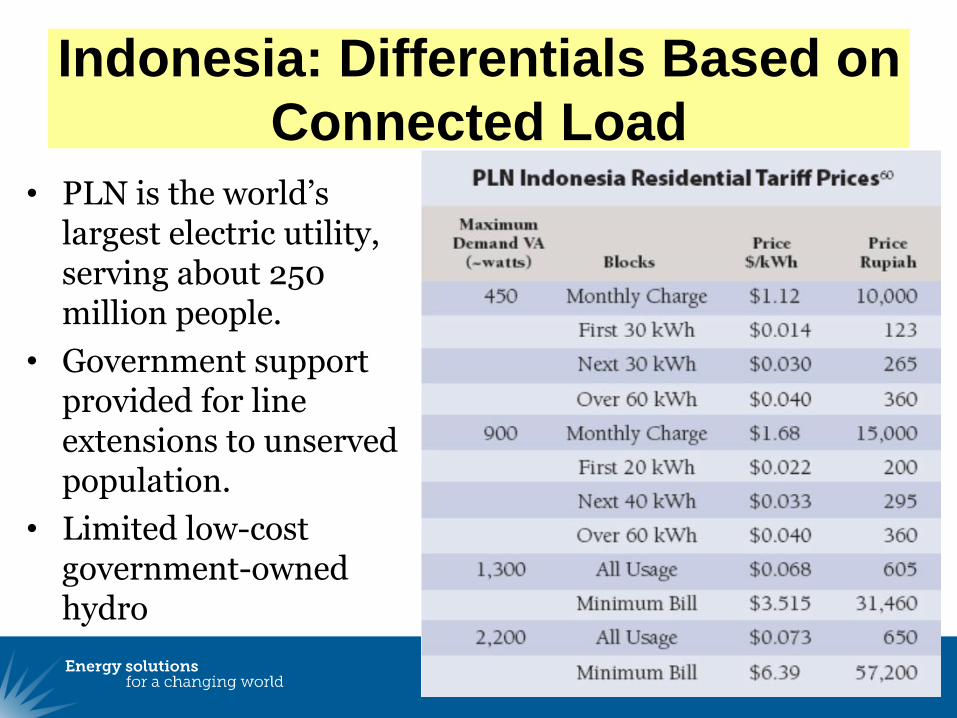
Indonesia: Differentials Based on
Connected Load
• PLN is the world’s largest electric utility, serving about 250 million people.
• Government support provided for line extensions to unserved population.
• Limited low-cost government-owned hydro

19
Arizona Public Service
Seasonal + Inclining Block • Arizona has a very distinct summer daytime peak,
driven by air conditioning load.
• Load-Factor Based Inclining Block Rate
• Optional TOU Rate Available
Arizona Public Service Company
Standard Plan (Optional TOU Available)
Winter Summer
0 - 400 kWh 0.0942$ 0.0969$
401 - 800 kWh 0.0942$ 0.1382$
801 - 3,000 kWh 0.0942$ 0.1617$
Over 3,000 kWh 0.0942$ 0.1726$

20
Fixed Period TOU Rates • Many utilities have introduced fixed-period TOU rates.
• These require interval meters, but not AMI
• France (70% nuclear) has been a leader.
• Annual subscription is a 100% demand ratchet
EDF Heures
Rate:
21
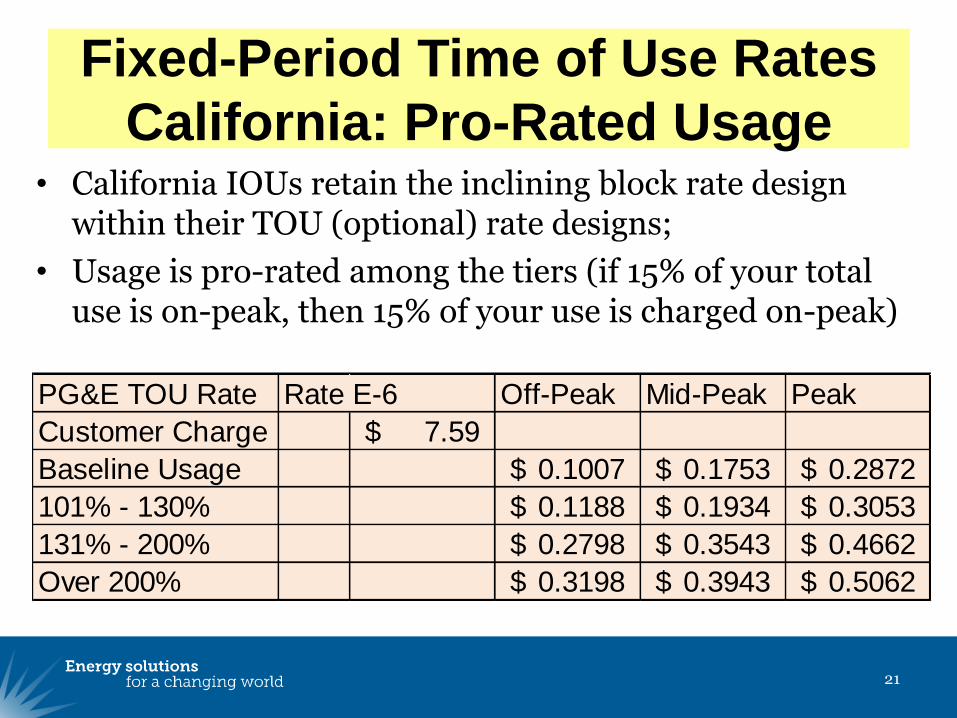
Fixed-Period Time of Use Rates
California: Pro-Rated Usage • California IOUs retain the inclining block rate design
within their TOU (optional) rate designs;
• Usage is pro-rated among the tiers (if 15% of your total use is on-peak, then 15% of your use is charged on-peak)
PG&E TOU Rate Rate E-6 Off-Peak Mid-Peak Peak
Customer Charge 7.59$
Baseline Usage 0.1007$ 0.1753$ 0.2872$
101% - 130% 0.1188$ 0.1934$ 0.3053$
131% - 200% 0.2798$ 0.3543$ 0.4662$
Over 200% 0.3198$ 0.3943$ 0.5062$
22
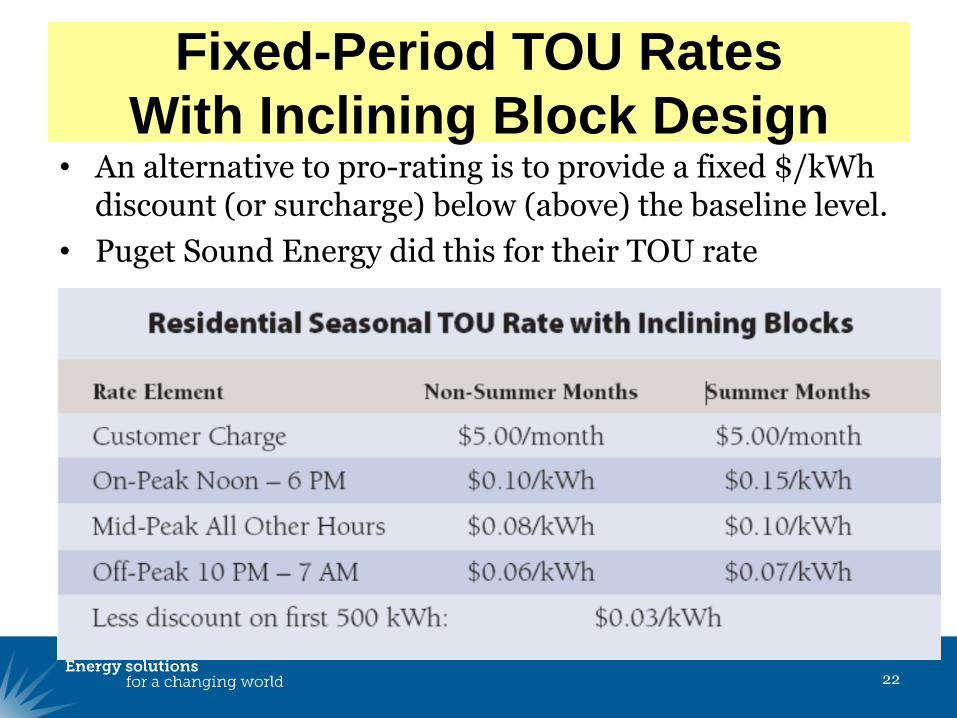
Fixed-Period TOU Rates
With Inclining Block Design • An alternative to pro-rating is to provide a fixed $/kWh
discount (or surcharge) below (above) the baseline level.
• Puget Sound Energy did this for their TOU rate

23
Peak Load Management
Without AMI • Many utilities
have peak interruption programs controlled by the utility.
• Midwest coops often REQUIRE that electric water heaters be under utility control.

24
Rates That Require AMI
PTR; CPP; VPP; RTP
• Peak-Time Rebate: A customer gets a credit if they reduce their usage during peak events. No penalty if they do not.
• Critical Peak Price: A high price defined in advance that takes effect on a day-ahead notice basis.
• Variable Peak Price: A price that is set one day ahead that takes effect when noticed by the utility
• Real-Time Price: A price that is set by the market, and may change with one-hour notice.

25
Peak Time Rebate (PTR)
• Risk-Free: Customer can win, but cannot lose.
• Events are noticed, generally day-ahead
• San Diego Gas and Electric “Reduce Your Use” Rate
– A “Use Less Than” amount is set at program signup
– Email or Text notification when events occur
– 11 AM to 6 PM time period
– $.75/kWh for manual reduction
– $1.25/kWh for technology-enabled reduction
– No minimum or maximum periods per year
• “Training wheels” for Critical Peak Pricing (CPP)
26
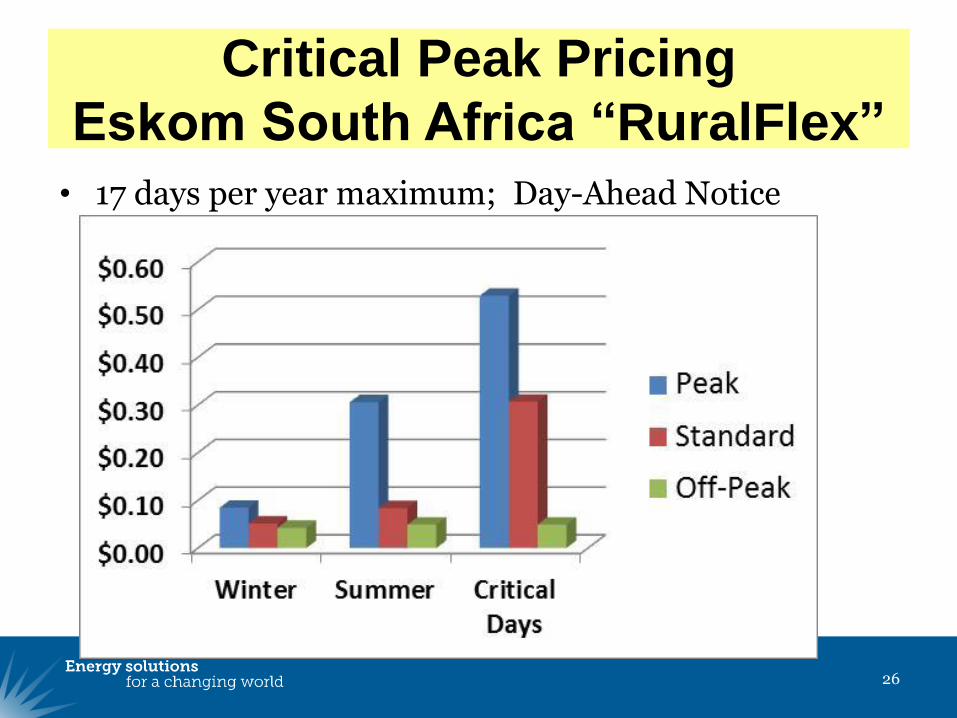
Critical Peak Pricing
Eskom South Africa “RuralFlex”
• 17 days per year maximum; Day-Ahead Notice

27
Critical Peak Pricing:
France: TEMPO • Tempo unit shows what price in effect
• All days have on-peak and off-peak
• Inclining customer charge tied to kVa
• Maximum 22 Red days per year
EDF Tempo
Rate

28
Enabling Technology
For CPP and RTP
• Installation of energy management devices that automatically adjust energy use when a price signal is received.
– Air conditioning
– Process and water heat
– Cold storage refrigeration
– Eventually, minor loads like refrigerators, freezers, and laundry equipment
29
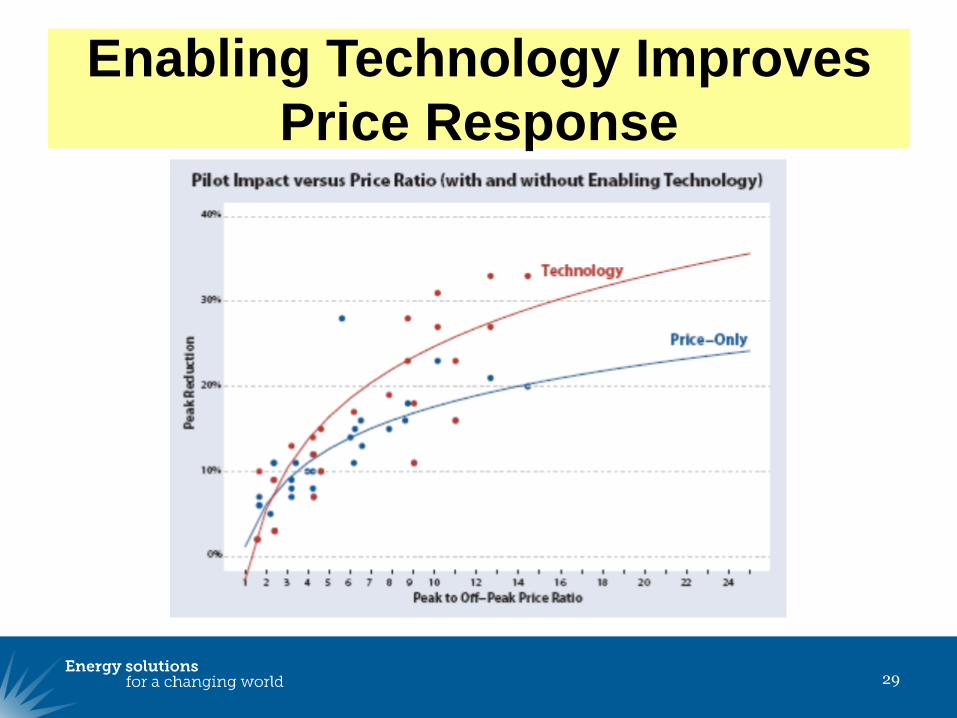
Enabling Technology Improves
Price Response

30
Peak Load Reduction
Varies by Pricing Approach

31
Peak Reduction vs.
Energy Reduction
• Inclining block rates produce the most overall reduction in energy usage. This occurs because incremental usage is most discretionary.
• Time-varying prices produce peak load reduction, but may or may not reduce total energy use
– Pre-cooling of buildings may increase total kWh usage
– Curtailment of A/C may lead customers to “not be home” at all, reducing other energy usage
• More complex rates work best with technology enablement.

32
Inclining Block Rates Save Energy
Complex Rates Save Peak
USEPA, Customer Incentives for Energy Efficiency Through Electric and Natural Gas Rate Design, September, 2009

Bill Simplification
33
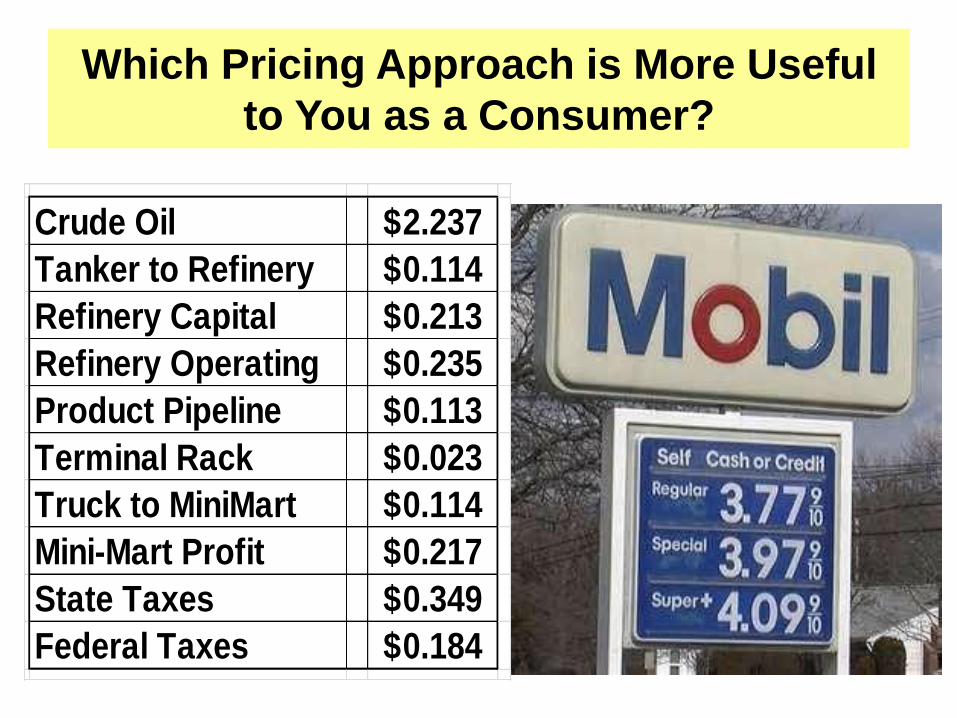
Which Pricing Approach is More Useful
to You as a Consumer?
Crude Oil 2.237$
Tanker to Refinery 0.114$
Refinery Capital 0.213$
Refinery Operating 0.235$
Product Pipeline 0.113$
Terminal Rack 0.023$
Truck to MiniMart 0.114$
Mini-Mart Profit 0.217$
State Taxes 0.349$
Federal Taxes 0.184$
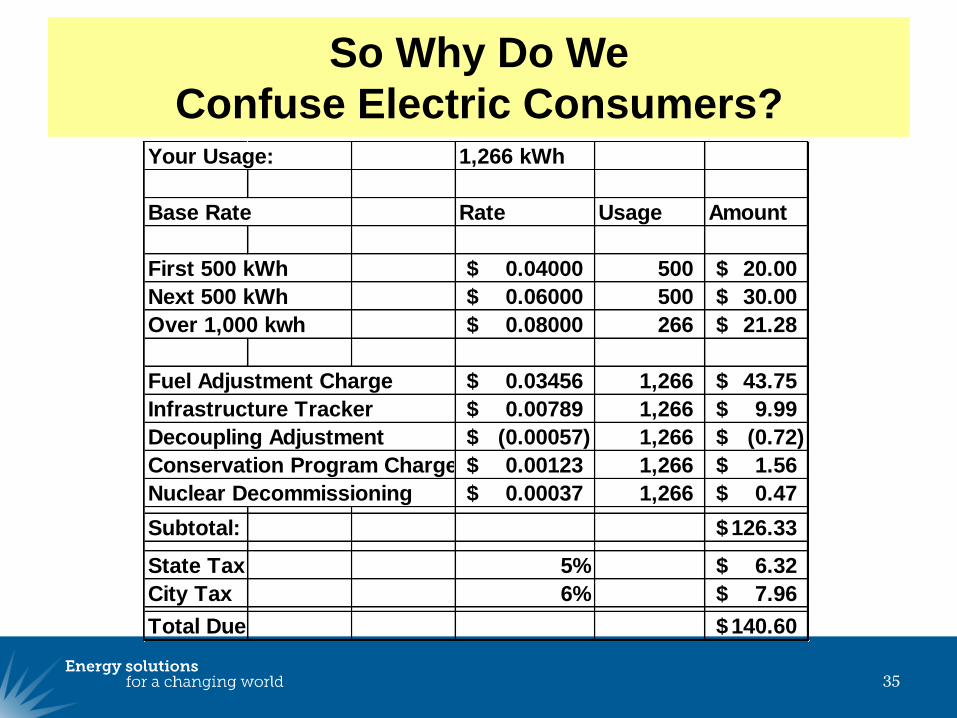
So Why Do We
Confuse Electric Consumers?
35
Your Usage: 1,266 kWh
Base Rate Rate Usage Amount
First 500 kWh 0.04000$ 500 20.00$
Next 500 kWh 0.06000$ 500 30.00$
Over 1,000 kwh 0.08000$ 266 21.28$
Fuel Adjustment Charge 0.03456$ 1,266 43.75$
Infrastructure Tracker 0.00789$ 1,266 9.99$
Decoupling Adjustment (0.00057)$ 1,266 (0.72)$
Conservation Program Charge 0.00123$ 1,266 1.56$
Nuclear Decommissioning 0.00037$ 1,266 0.47$
Subtotal: 126.33$
State Tax 5% 6.32$
City Tax 6% 7.96$
Total Due 140.60$
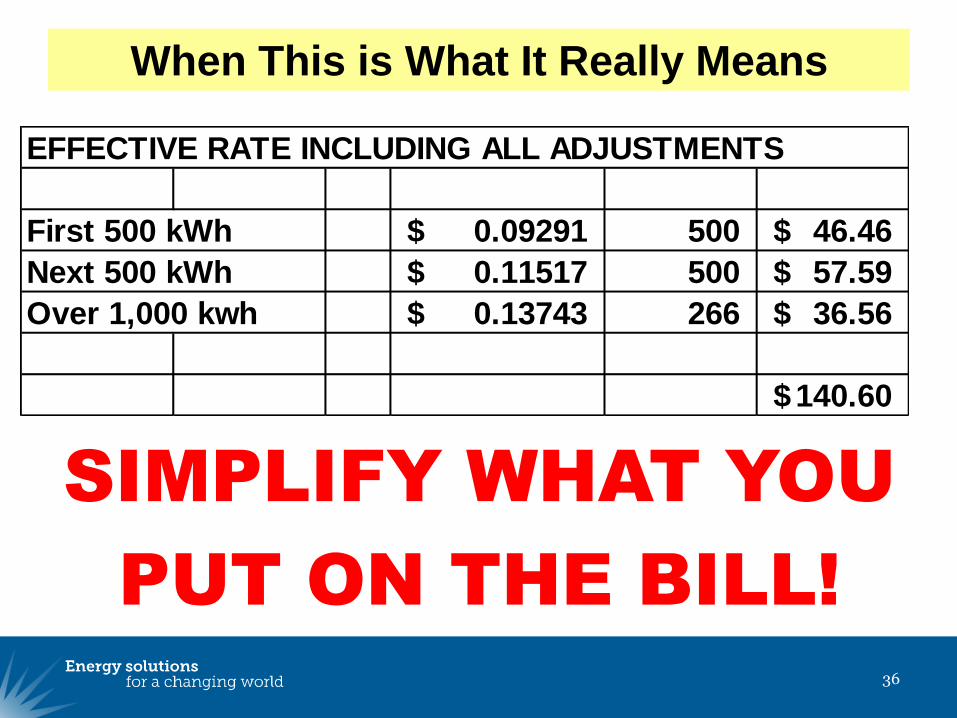
When This is What It Really Means
SIMPLIFY WHAT YOU
PUT ON THE BILL!
36
EFFECTIVE RATE INCLUDING ALL ADJUSTMENTS
First 500 kWh 0.09291$ 500 46.46$
Next 500 kWh 0.11517$ 500 57.59$
Over 1,000 kwh 0.13743$ 266 36.56$
140.60$

37
Recommended Publications
Rate Design Where Advanced Metering Infrastructure Has Not
Been Fully Deployed
http://www.raponline.org/document/download/id/6516
Time-Varying and Dynamic Rate Design
http://www.raponline.org/document/download/id/5131
Pricing Do's and Don'ts: Designing Retail Rates as if
Efficiency Counts
http://www.raponline.org/document/download/id/939
Customer Incentives for Energy Efficiency Through Electric
and Natural Gas Rate Design
http://www.epa.gov/cleanenergy/documents/suca/rate_design.

About RAP
The Regulatory Assistance Project (RAP) is a global, non-profit team of experts that focuses on the long-term economic and environmental sustainability of the power and natural gas sectors. RAP has deep expertise in regulatory and market policies that:
Promote economic efficiency Protect the environment Ensure system reliability Allocate system benefits fairly among all consumers
Learn more about RAP at www.raponline.org
Jim Lazar, RAP Senior Advisor