Global and Regional Climate Change
31
Global and Regional Climate Change Global and Regional Climate Change Dr. Susan Haseltine Associate Director for Biology U.S. Department of the Interior U.S. Geological Survey Interstate Oil and Gas Compact Commission 2009 Annual Meeting "Unconventional Potential: Setting Sensible State Policy“ Biloxi, Mississippi October 4-6, 2009
Transcript of Global and Regional Climate Change
Global and Regional Climate ChangeGlobal and Regional Climate Change
Dr. Susan HaseltineAssociate Director for Biology
U.S. Department of the InteriorU.S. Geological Survey
Interstate Oil and Gas Compact Commission2009 Annual Meeting
"Unconventional Potential: Setting Sensible State Policy“Biloxi, MississippiOctober 4-6, 2009

Intergovernmental Panel on Climate Change
U.S. Global Change Research Program
National, Regional, and Sectoral Assessments
IPCC Working Groups:WG I - Physical Climate ScienceWG II - Impacts, Adaptation and VulnerabilityWG III - Mitigation
Main SourcesMain Sources(USGCRP 2009)

-55
-50
-45
-40
-35
-30
-25
05101520
Tem
pera
ture
in C
entra
l Gre
enla
nd (C
)
Thousands of years before present
10°C increase in several decades at end of Younger Dryas interval (YD)
(based on Alley, 2000)
warmer
colder
YD
Past 20,000 Years:
© IPCC, 2007
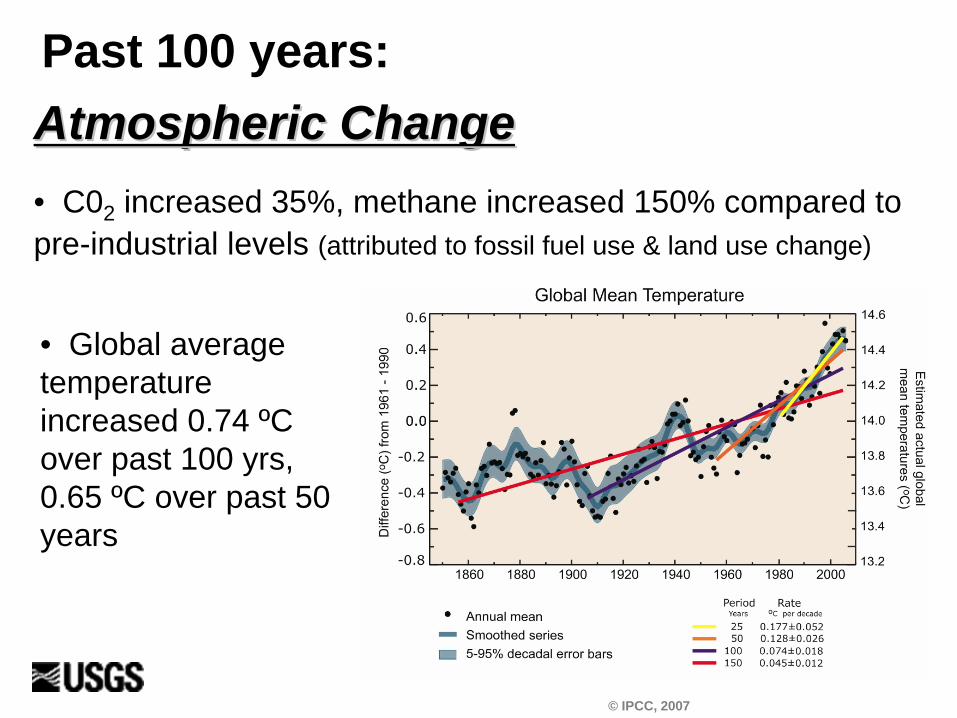
Atmospheric ChangeAtmospheric Change• C02 increased 35%, methane increased 150% compared to pre-industrial levels (attributed to fossil fuel use & land use change)
Past 100 years:
• Global average temperature increased 0.74 ºC over past 100 yrs, 0.65 ºC over past 50 years

© IPCC, 2007
Atmospheric ChangeAtmospheric Change
Global Average Trend in Monthly Palmer Drought Severity Index
(1900 to 2002)
• Atmospheric water vapor increased (consistent with T increase)
• Total volume and intensity of rainfall increased over most land areas -- but so did the number of dry days• Intensified droughts have occurred over wider geographical areas, especially the tropics and sub-tropics, since 1970• Severity of drought as measured by the Palmer Drought Severity Index (PDSI) rapidly increased from 1980 through 2002

• Ocean temperature increased from surface down to at least 3000 m
• Increase in N. Atlantic hurricane activity • Increase in ocean acidity
Geographic Variability in the Rate of
Sea Level Rise (1955 to 2003)
© IPCC, 2007
Ocean change:Ocean change:
(acceleration or natural variability?)
• Global sea level rise - 1.7 mm/yr during 20th century- 3.1 mm/yr during 1993-2003

Observed and Projected Global Average Temperatures
relative to the 1960-1979 average
(USG
CR
P 2009)

Projected surface temperature changes for the early and late 21st century relative to the period 1980–1999 (for 3 SRES emission scenarios and from an ensemble of AOGCMs).
© IPCC, 2007
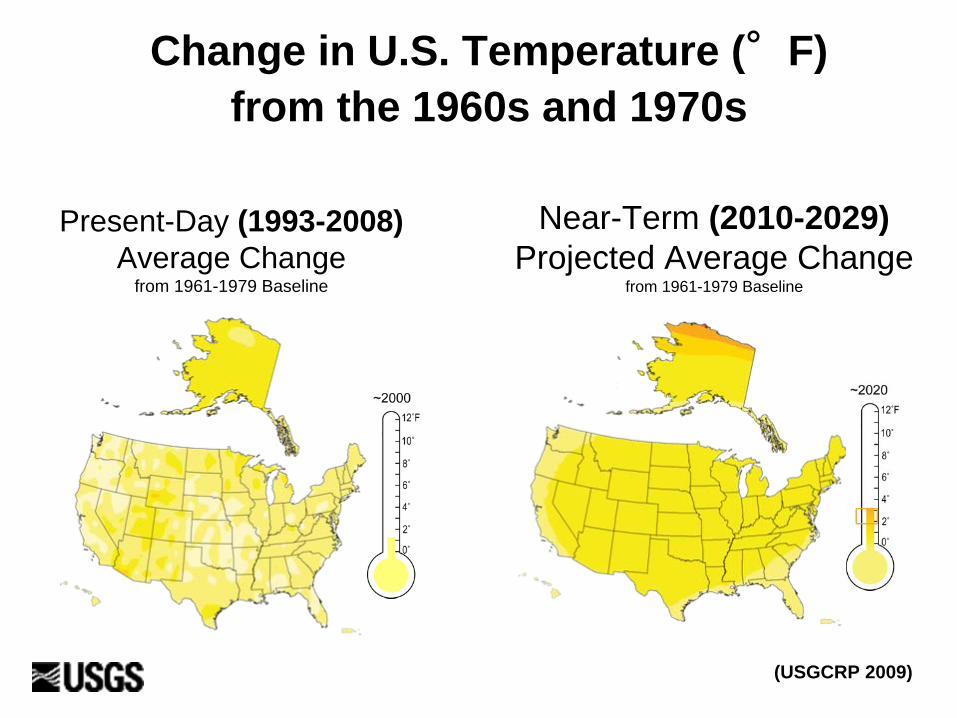
Present-Day (1993-2008) Average Change
from 1961-1979 Baseline
Near-Term (2010-2029) Projected Average Change
from 1961-1979 Baseline
Change in U.S. Temperature (°F) from the 1960s and 1970s
(USGCRP 2009)

Shifting plant hardiness zones
The plant hardiness zone for Dallas has already shifted to become more like Houston was in 1990.
(Source: Katharine Hayhoe, Texas Tech)
Dallas

Change in Number of Days Above 90°F
Recent Past (1961-1979 Average)
Projected End-of-Century Lower Emissions Scenario
(2080-2099 average)
Projected End-of-Century Higher Emissions Scenario
(2080-2099 average)
(USGCRP 2009)
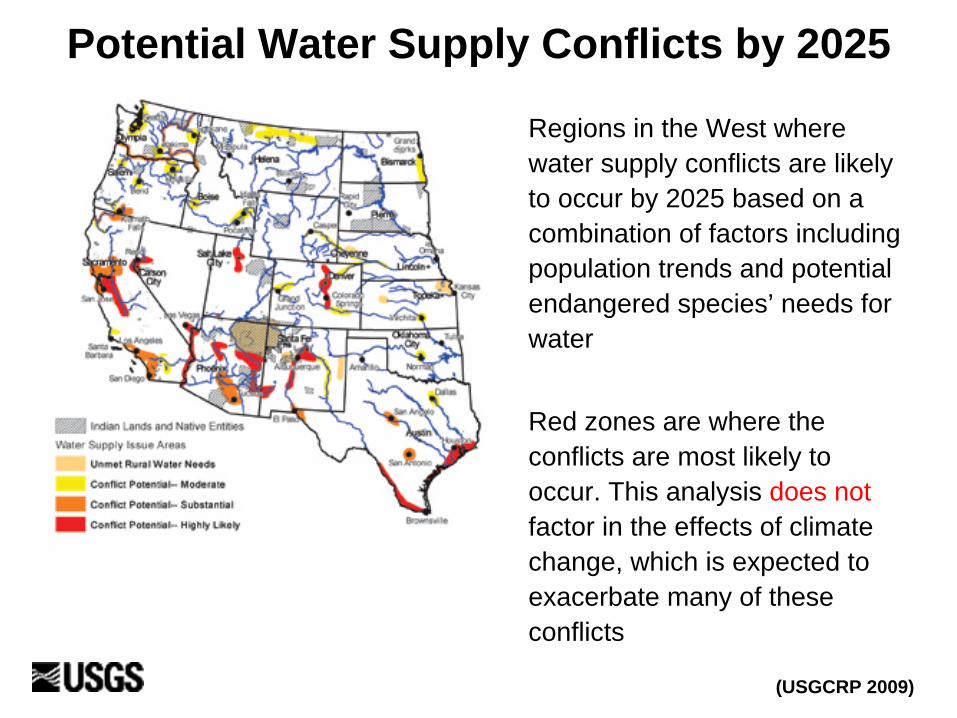
Potential Water Supply Conflicts by 2025
Regions in the West where water supply conflicts are likely to occur by 2025 based on a combination of factors including population trends and potential endangered species’ needs for water
Red zones are where the conflicts are most likely to occur. This analysis does not factor in the effects of climate change, which is expected to exacerbate many of these conflicts
(USGCRP 2009)
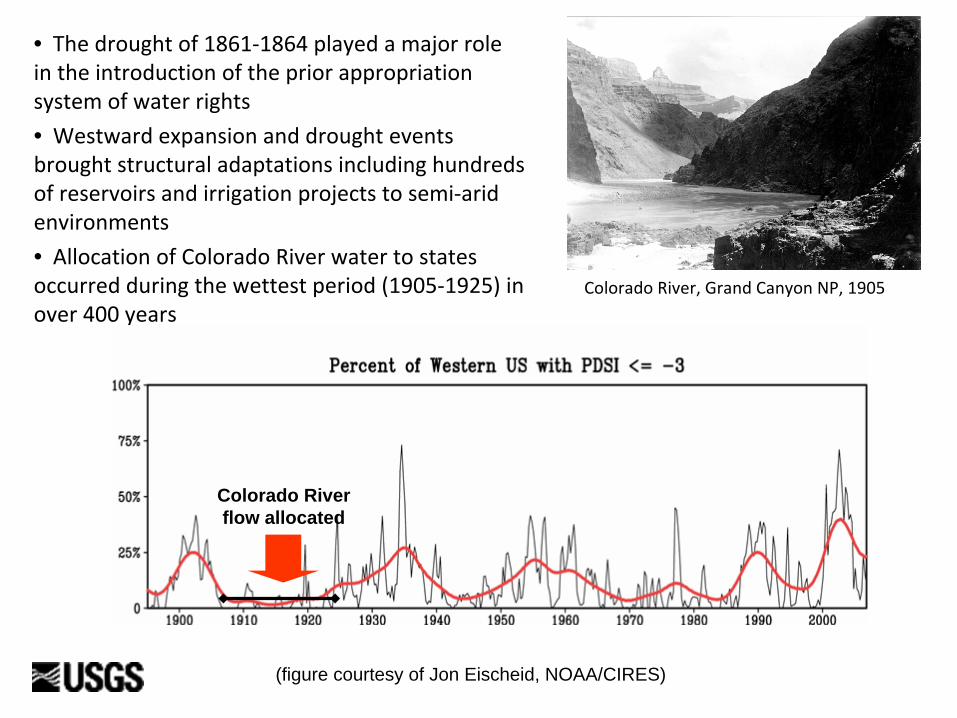
• The drought of 1861‐1864 played a major role
in the introduction of the prior appropriation
system of water rights
• Westward expansion and drought events
brought structural adaptations including hundreds
of reservoirs and irrigation projects to semi‐arid
environments
• Allocation of Colorado River water to states
occurred during the wettest period (1905‐1925) in
over 400 years
Colorado River, Grand Canyon NP, 1905
(figure courtesy of Jon Eischeid, NOAA/CIRES)
Colorado River flow allocated
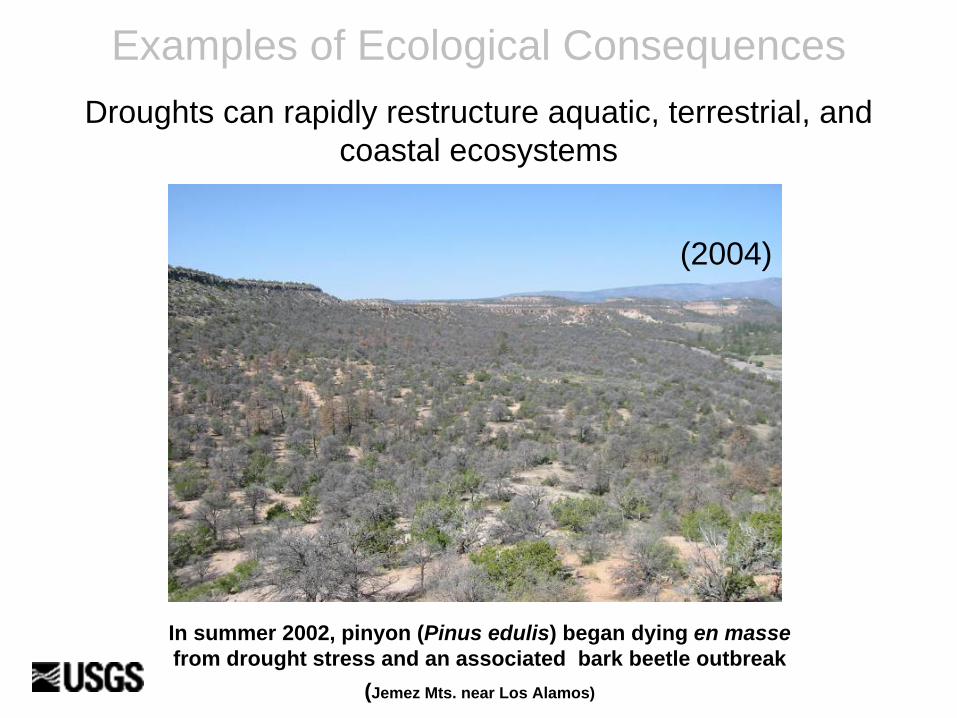
In summer 2002, pinyon (Pinus edulis) began dying en masse from drought stress and an associated bark beetle outbreak
(Jemez Mts. near Los Alamos)
(2004)
Droughts can rapidly restructure aquatic, terrestrial, and coastal ecosystems
Examples of Ecological Consequences

Lower soil moisture leads to more intense, frequent, and widespread wildfires
Wildfire trend in western USA since 1970 correlates with observed higher temperatures and reduced moisture availability.
Source: Westerling, Hidalgo, Cayan and Swetnam, Science (2006)
Wildfires lead to erosion, flash flooding, and habitat loss
Rill erosion on a burned hill slope after the Buffalo Creek Fire (Photo by John A. Moody)
Examples of Ecological Consequences

© IPCC, 2007
Climate Change Drivers in Coastal Systems

Church, J.A. and White, N.J. (2006) http://maps.grida.no/go/graphic/trends-in-sea-level-1870-2006
Global Mean Sea Level Rise, 1870-2006

is a combination of global sea level rise and regional or local land surface elevation change (such as subsidence)
2.14 mm/yr
6.5 mm/yr
9.85 mm/yr
Historical Tide Gauge Data (1900-2000)
“Relative sea level rise”
As the oceans warm and land ice declines, sea level rise is expected to accelerate
The Greenland Ice Sheet Dominates
Land Ice in the Arctic
Over the past two decades, the melt area on the Greenland ice
sheet has increased on average by about
0.7%/year (or about 20% from 1979 to 2005).
The Greenland Ice Sheet Dominates
Land Ice in the Arctic
Over the past two decades, the melt area on the Greenland ice
sheet has increased on average by about
0.7%/year (or about 20% from 1979 to 2005).
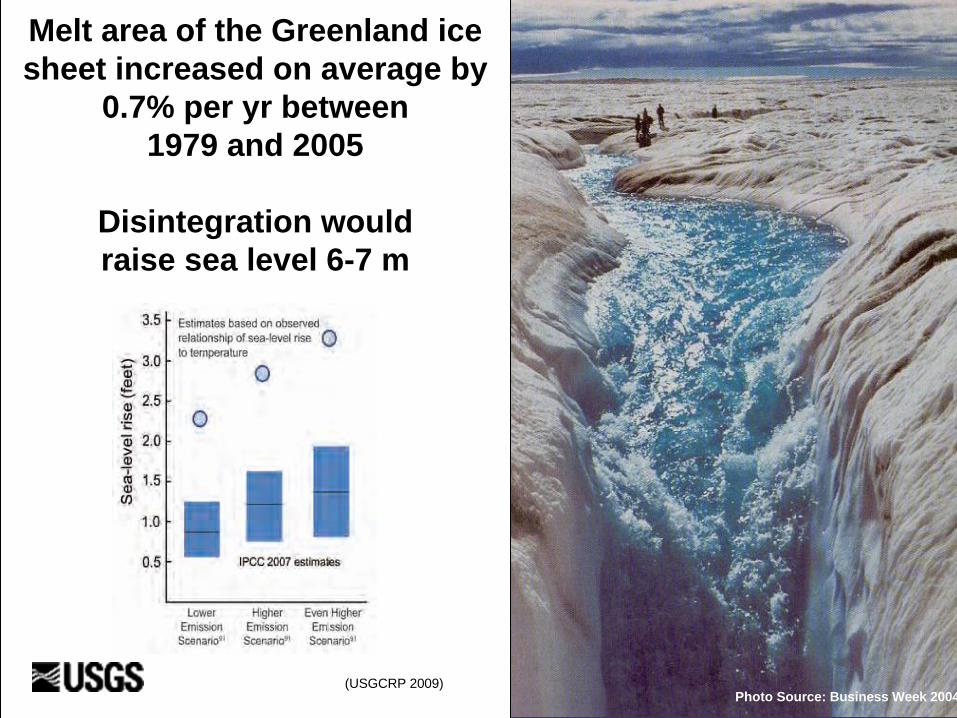
Photo Source: Business Week 2004
Melt area of the Greenland ice sheet increased on average by
0.7% per yr between 1979 and 2005
Disintegration would raise sea level 6-7 m
(USG
CR
P 2009)
(USGCRP 2009)

Hurricane Katrina converted 2172 mi of Wetlands and Land to Open Water in Southeast LA
New Orleans
Chandeleur Island Chain

As sea level rise accelerates -- shoreline erosion, wetland submergence, and salinity increase along
low-lying coasts
Examples of Ecological Consequences

As sea ice disappears
Change in optimal polar bear habitat
2041-2050 minus
2001-2010
Change in optimal polar bear habitat
2041-2050 minus
2001-2010
Examples of Ecological Consequences

Examples of impacts on oil and gas operations
Port Fourchon, LA
Onshore oil and gas facilities will likely be more difficult to permit, construct, and maintain

Examples of impacts on oil and gas operationsSea level rise and/or increase in tropical storm intensity will affect oil and
gas infrastructure (offshore and onshore)
Rig damage during Hurricane Lilli
off the LA coast, Eugene Island area
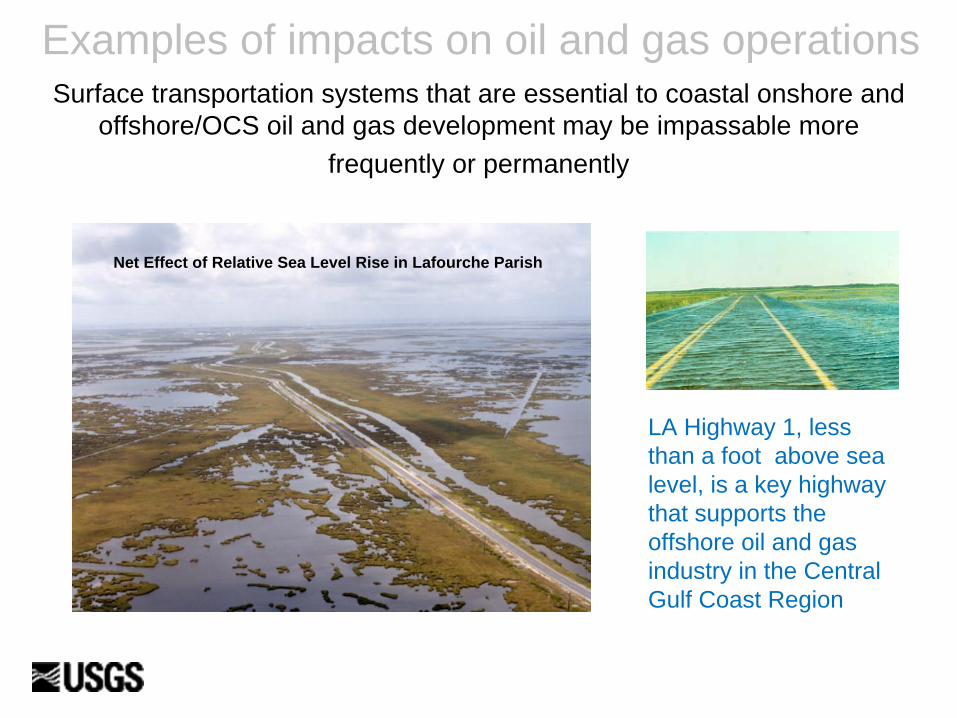
Surface transportation systems that are essential to coastal onshore and offshore/OCS oil and gas development may be impassable more
frequently or permanently
Net Effect of Relative Sea Level Rise in Lafourche Parish
LA Highway 1, less than a foot above sea level, is a key highway that supports the offshore oil and gas industry in the Central Gulf Coast Region
Examples of impacts on oil and gas operations
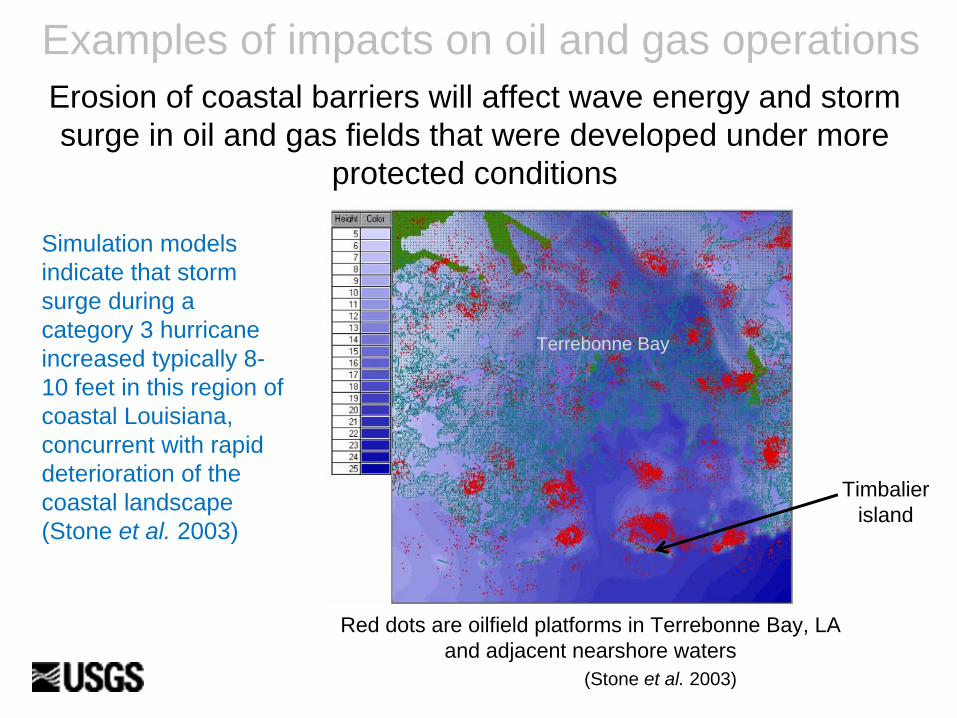
Erosion of coastal barriers will affect wave energy and storm surge in oil and gas fields that were developed under more
protected conditions
(Stone et al. 2003)
Red dots are oilfield platforms in Terrebonne Bay, LA and adjacent nearshore waters
Simulation models indicate that storm surge during a category 3 hurricane increased typically 8- 10 feet in this region of coastal Louisiana, concurrent with rapid deterioration of the coastal landscape (Stone et al. 2003)
Timbalier island
Terrebonne Bay
Examples of impacts on oil and gas operations
Exposed offshore pipelines are vulnerable to lateral and vertical displacement during storms, exposure to vessel traffic,
or rupture by currents
(Stone et al. 2003)
Distribution of oil and gas pipelines superimposed on the 1990’s Maximum Storm Surge Elevation and Maximum Significant Wave Height composite (source Stone et al., 2003)
Terrebonne Bay
Examples of impacts on oil and gas operations
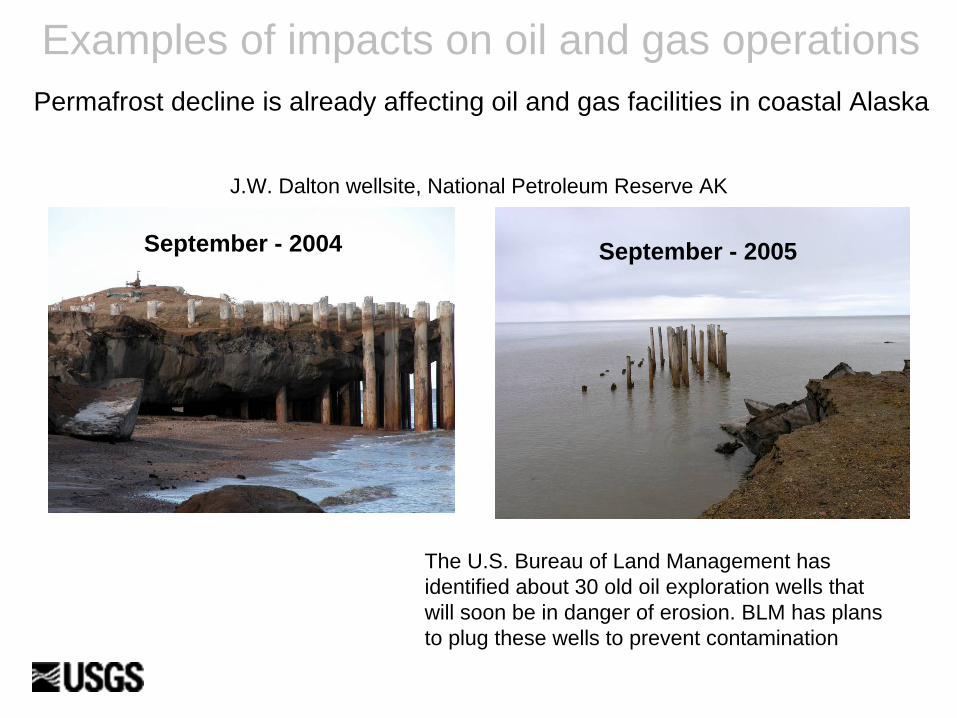
Permafrost decline is already affecting oil and gas facilities in coastal Alaska
The U.S. Bureau of Land Management has identified about 30 old oil exploration wells that will soon be in danger of erosion. BLM has plans to plug these wells to prevent contamination
J.W. Dalton wellsite, National Petroleum Reserve AK
September - 2005September - 2004
Examples of impacts on oil and gas operations

Hazards associated with the formation of thermokarst lakes in the coastal zone and the stability of shelf sediments due to thawing ice in sediments
and the release of gas from clathrates
Accelerated land loss and formation of thermokarst lakes
along Alaska Beaufort Sea coast
John (Lyle) Mars, Dave Houseknecht, & Chris Garrity, USGS
Examples of impacts on oil and gas operations

Navigation routes through the Northwest and Northeast Passages may be opened, even if ice simply thins to the point that shipping lanes can be mechanically maintained by icebreakers. Longer ice free season for
exploration and development
Arctic Summer Sea Icesource: NASA GSFC
1979
2007
Examples of impacts on oil and gas operations

Mitigation +
Adaptation =
Climate Response