Global and Local Healthcare Market Trends - Australian Self
33
ASMI 2012 Conference: Global and Local Healthcare Market Trends Francine Nieto Global Marketing Director, Consumer Health IMS Health
Transcript of Global and Local Healthcare Market Trends - Australian Self

ASMI 2012 Conference: Global and Local Healthcare Market Trends Francine Nieto
Global Marketing Director, Consumer Health
IMS Health

AGENDA
• Global OTC Context
• Local Trends
• Focus on the Consumer & Channel
• Highlights & Conclusions
Global and Local Healthcare Market Trends © IMS Health 2
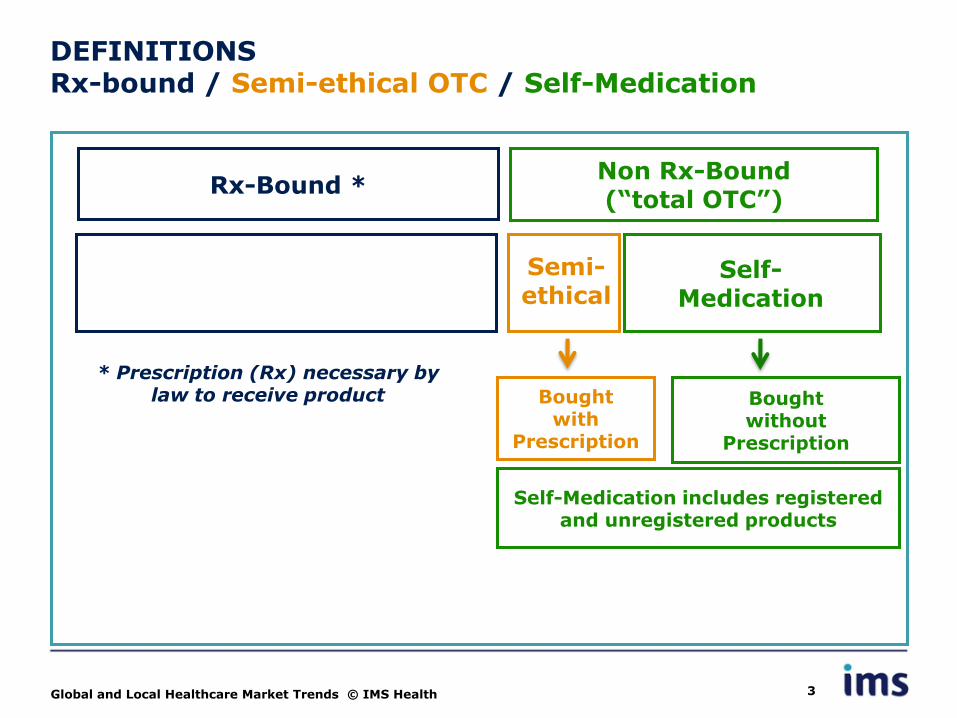
DEFINITIONS Rx-bound / Semi-ethical OTC / Self-Medication
Global and Local Healthcare Market Trends © IMS Health 3
Non Rx-Bound (“total OTC”)
Rx-Bound *
Self-Medication includes registered
and unregistered products
Bought with
Prescription
Bought without
Prescription
Self-Medication
* Prescription (Rx) necessary by law to receive product
Semi-ethical
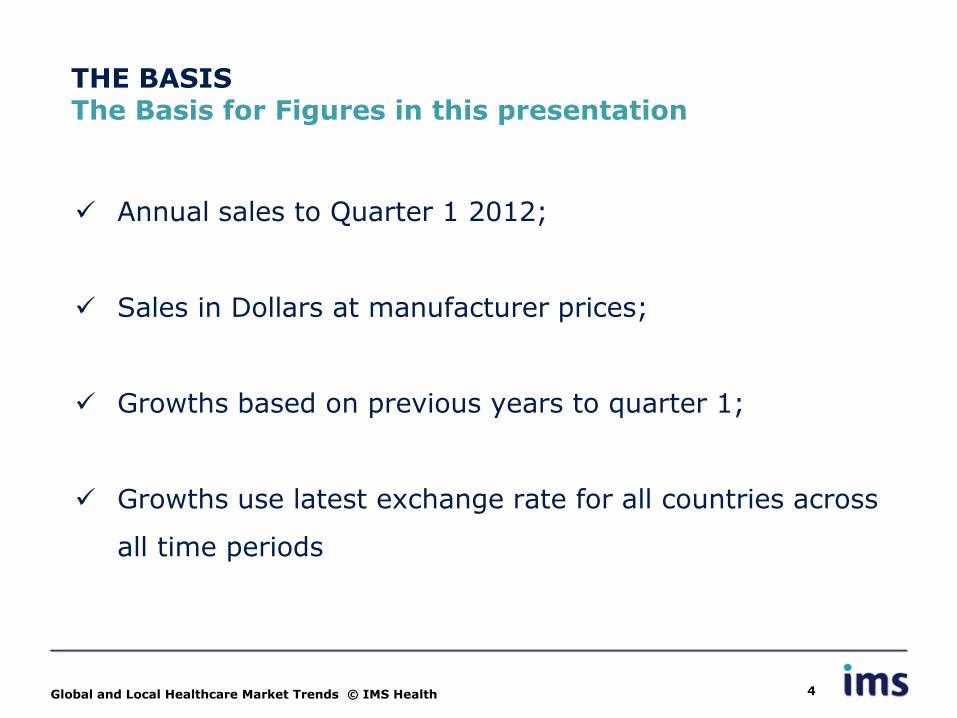
THE BASIS The Basis for Figures in this presentation
Annual sales to Quarter 1 2012;
Sales in Dollars at manufacturer prices;
Growths based on previous years to quarter 1;
Growths use latest exchange rate for all countries across
all time periods
Global and Local Healthcare Market Trends © IMS Health 4
AGENDA
• Global OTC Context
• Local Trends
• Focus on the Consumer & Channel
• Highlights & Conclusions
Global and Local Healthcare Market Trends © IMS Health 5
Global and Local Healthcare Market Trends © IMS Health 6
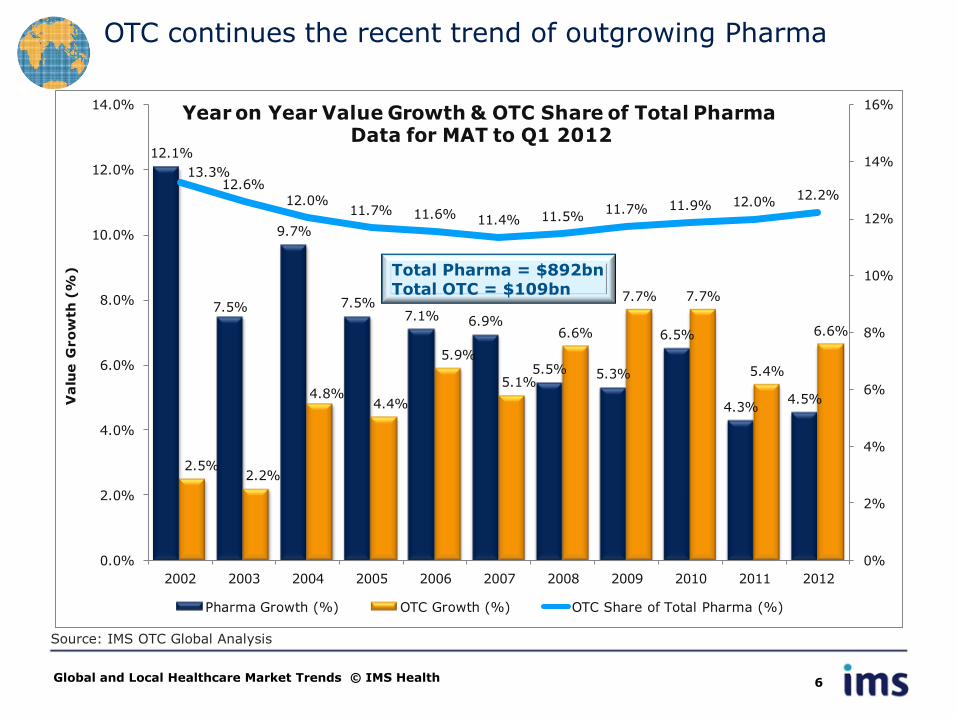
OTC continues the recent trend of outgrowing Pharma
Source: IMS OTC Global Analysis
12.1%
7.5%
9.7%
7.5%7.1% 6.9%
5.5% 5.3%
6.5%
4.3%4.5%
2.5%2.2%
4.8%4.4%
5.9%
5.1%
6.6%
7.7% 7.7%
5.4%
6.6%
13.3%12.6%
12.0%11.7% 11.6% 11.4% 11.5%
11.7% 11.9% 12.0%12.2%
0%
2%
4%
6%
8%
10%
12%
14%
16%
0.0%
2.0%
4.0%
6.0%
8.0%
10.0%
12.0%
14.0%
2002 2003 2004 2005 2006 2007 2008 2009 2010 2011 2012
Va
lue
Gro
wth
(%
)
Year on Year Value Growth & OTC Share of Total Pharma Data for MAT to Q1 2012
Pharma Growth (%) OTC Growth (%) OTC Share of Total Pharma (%)
Total Pharma = $892bn Total OTC = $109bn

While Pharma growth experiences a number of constraints … OTC still benefits from a range of growth drivers
Global and Local Healthcare Market Trends © IMS Health 7
Top Corps contribution to growth falling rapidly
Low number and quality output from R&D
Generics dominating large therapy areas
Demand constrained by payers
Key players building strong brand identities
Payers keen to promote self medication
Emerging markets have the critical mass to influence growth
Companies seek to exploit switch opportunities
Increasing access through new channels
PHARMA
OTC
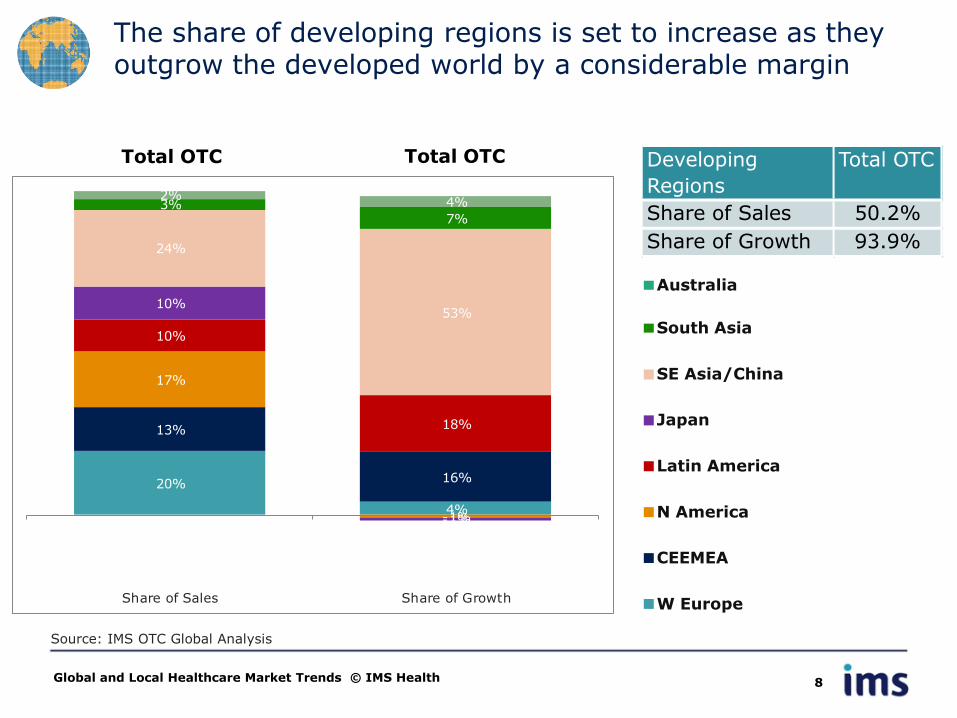
The share of developing regions is set to increase as they outgrow the developed world by a considerable margin
Global and Local Healthcare Market Trends © IMS Health 8
Source: IMS OTC Global Analysis
South Asia
SE Asia/China
Japan
Latin America
N America
CEEMEA
W Europe
Australia
20%
4%
13%
16%
17%
-1%
10%
18%
10%
-1%
24%
53%
3%7%
2%4%
Share of Sales Share of Growth
Total OTC Total OTC Developing
Regions
Total OTC
Share of Sales 50.2%
Share of Growth 93.9%
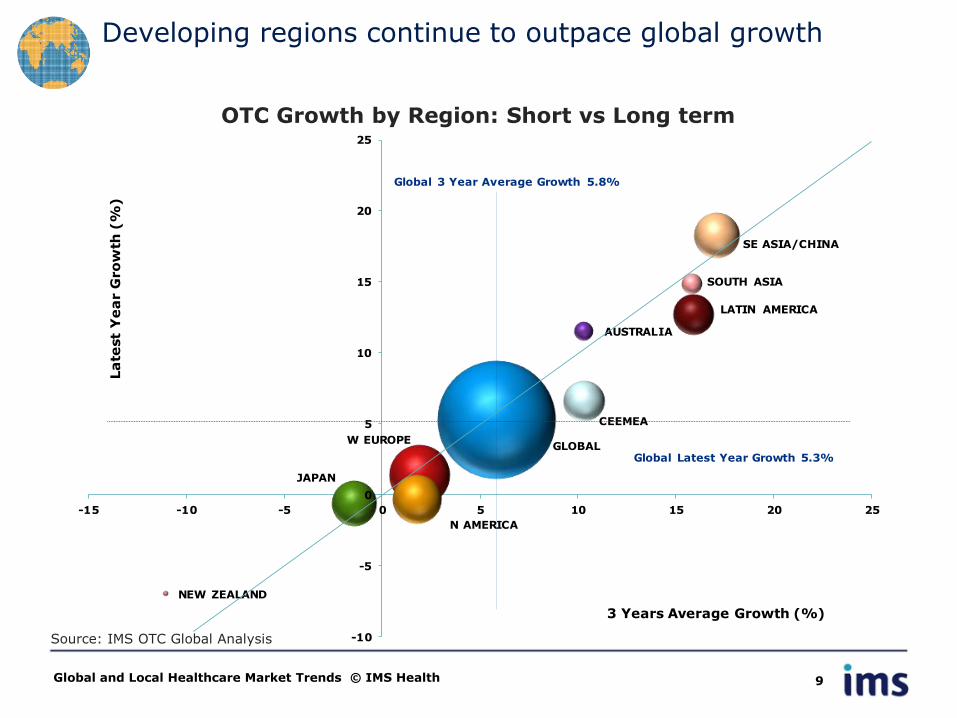
Developing regions continue to outpace global growth
Global and Local Healthcare Market Trends © IMS Health 9
Source: IMS OTC Global Analysis
OTC Growth by Region: Short vs Long term
GLOBALW EUROPE
CEEMEA
N AMERICA
JAPAN
LATIN AMERICA
SE ASIA/CHINA
SOUTH ASIA
AUSTRALIA
NEW ZEALAND
-10
-5
0
5
10
15
20
25
-15 -10 -5 0 5 10 15 20 25
La
test
Ye
ar G
ro
wth
(%
)
3 Years Average Growth (%)
Global Latest Year Growth 5.3%
Global 3 Year Average Growth 5.8%
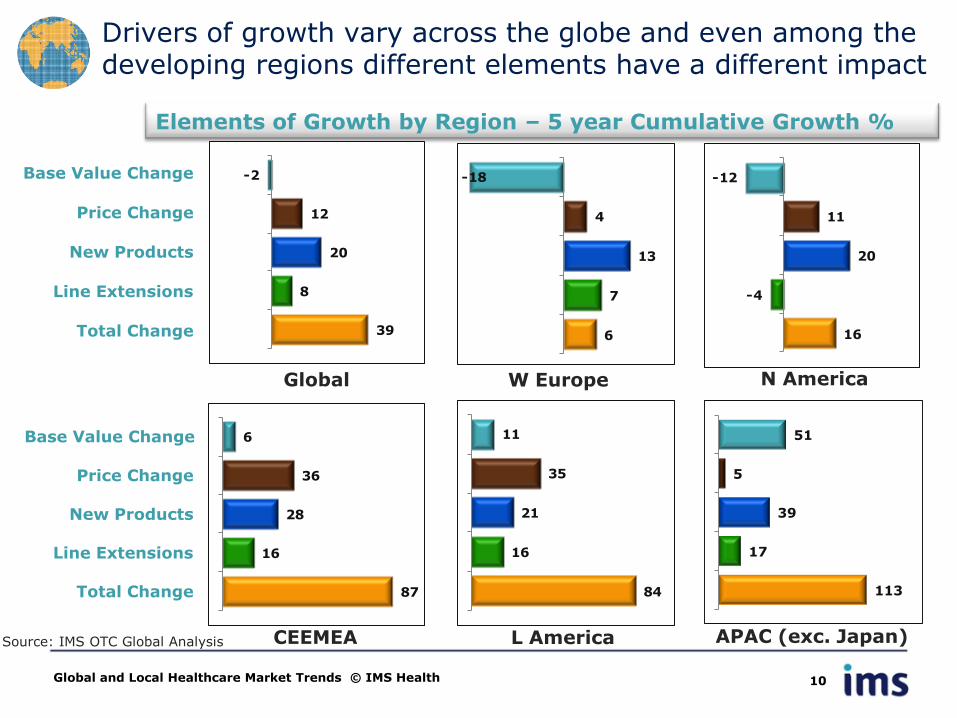
Drivers of growth vary across the globe and even among the developing regions different elements have a different impact
Global and Local Healthcare Market Trends © IMS Health 10
Base Value Change
Price Change
New Products
Line Extensions
Total Change
Base Value Change
Price Change
New Products
Line Extensions
Total Change
Global W Europe N America
CEEMEA L America APAC (exc. Japan) Source: IMS OTC Global Analysis
Elements of Growth by Region – 5 year Cumulative Growth %
39
8
20
12
-2
6
7
13
4
-18
16
-4
20
11
-12
87
16
28
36
6
84
16
21
35
11
113
17
39
5
51
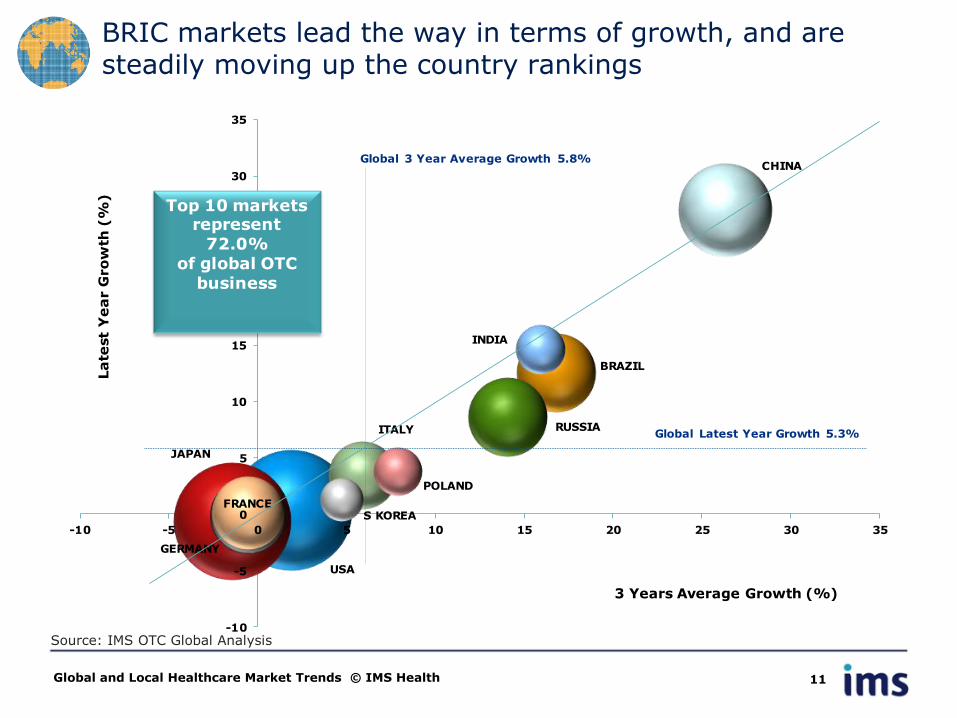
BRIC markets lead the way in terms of growth, and are steadily moving up the country rankings
Global and Local Healthcare Market Trends © IMS Health 11
Source: IMS OTC Global Analysis
USA
JAPAN
CHINA
BRAZIL
RUSSIA
GERMANY
FRANCE
ITALY
INDIA
POLAND
S KOREA
-10
-5
0
5
10
15
20
25
30
35
-10 -5 0 5 10 15 20 25 30 35
La
test
Ye
ar G
ro
wth
(%
)
3 Years Average Growth (%)
Global Latest Year Growth 5.3%
Global 3 Year Average Growth 5.8%
Top 10 markets represent
72.0%of global OTC
business
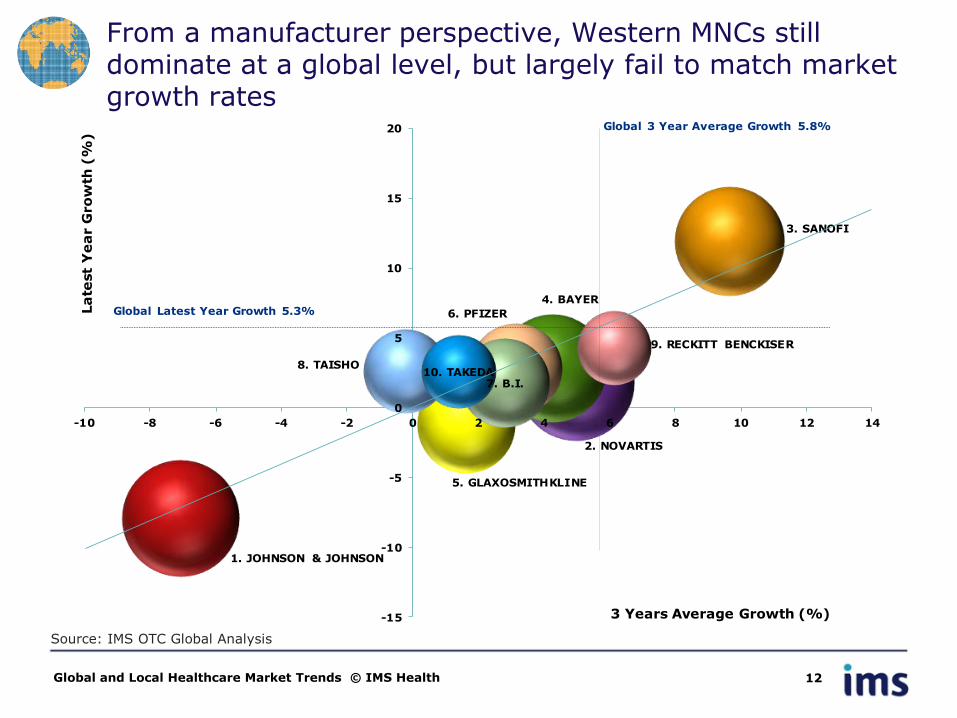
From a manufacturer perspective, Western MNCs still dominate at a global level, but largely fail to match market growth rates
Global and Local Healthcare Market Trends © IMS Health 12
Source: IMS OTC Global Analysis
1. JOHNSON & JOHNSON
2. NOVARTIS
3. SANOFI
4. BAYER
5. GLAXOSMITHKLINE
6. PFIZER
7. B.I.
8. TAISHO
9. RECKITT BENCKISER
10. TAKEDA
-15
-10
-5
0
5
10
15
20
-10 -8 -6 -4 -2 0 2 4 6 8 10 12 14
La
test
Ye
ar G
ro
wth
(%
)
3 Years Average Growth (%)
Global Latest Year Growth 5.3%
Global 3 Year Average Growth 5.8%
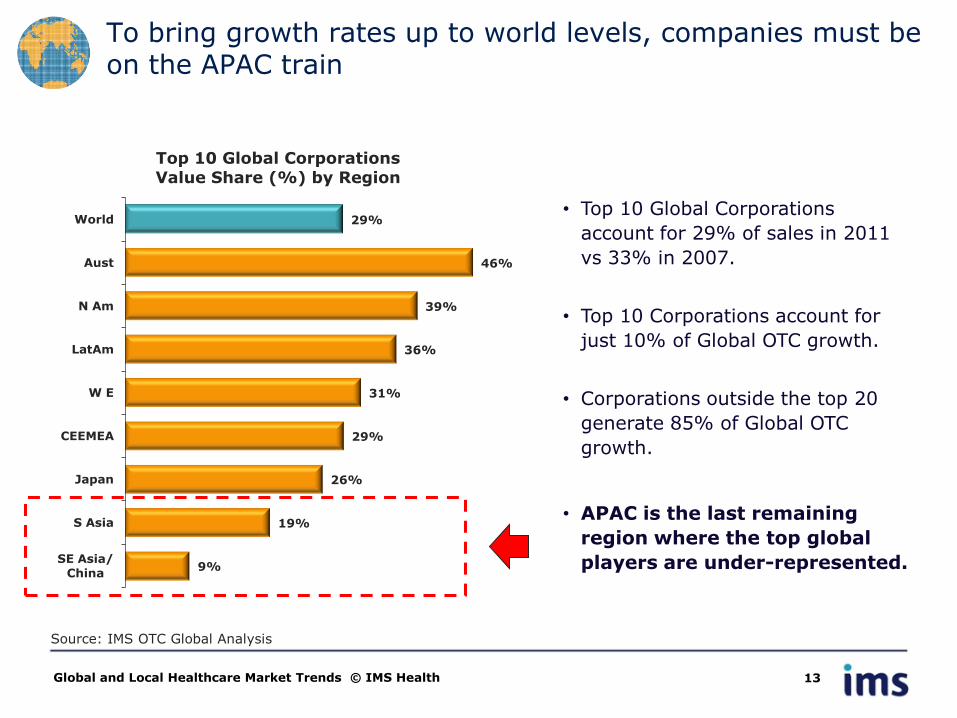
To bring growth rates up to world levels, companies must be on the APAC train
Global and Local Healthcare Market Trends © IMS Health 13
Source: IMS OTC Global Analysis
• Top 10 Global Corporations
account for 29% of sales in 2011
vs 33% in 2007.
• Top 10 Corporations account for
just 10% of Global OTC growth.
• Corporations outside the top 20
generate 85% of Global OTC
growth.
• APAC is the last remaining
region where the top global
players are under-represented.
29%
46%
39%
36%
31%
29%
26%
19%
9%
World
Aust
N Am
LatAm
W E
CEEMEA
Japan
S Asia
SE Asia/
China
Top 10 Global Corporations Value Share (%) by Region
AGENDA
• Global OTC Context
• Local Trends
• Focus on the Consumer & Channel
• Highlights & Conclusions
Global and Local Healthcare Market Trends © IMS Health 14
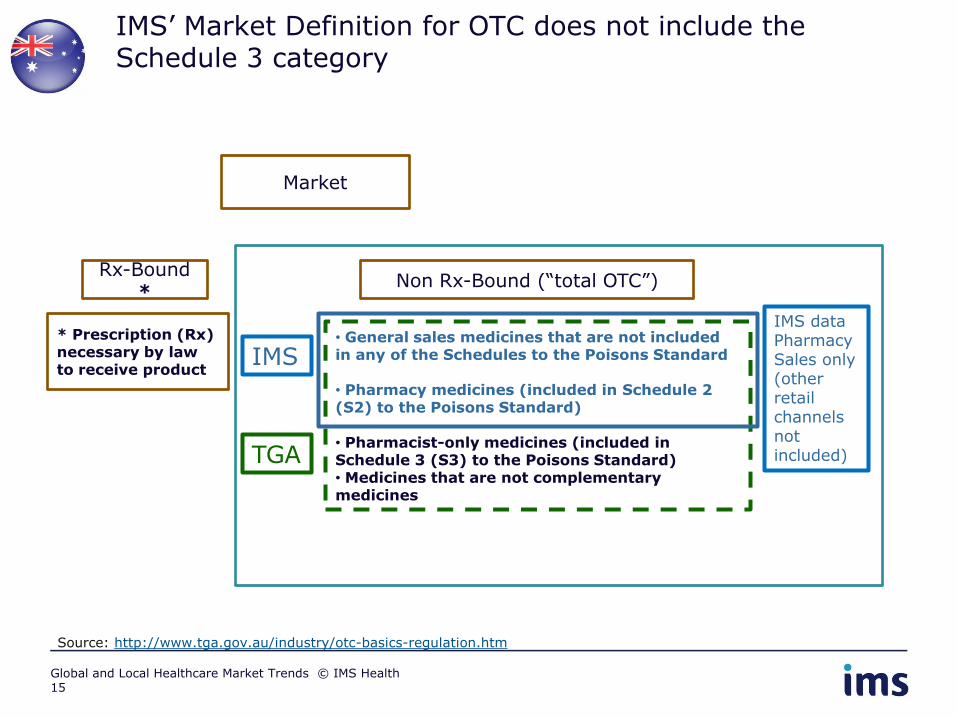
IMS’ Market Definition for OTC does not include the Schedule 3 category
Rx-Bound
*
Market
• General sales medicines that are not included in any of the Schedules to the Poisons Standard
• Pharmacy medicines (included in Schedule 2 (S2) to the Poisons Standard)
• Pharmacist-only medicines (included in Schedule 3 (S3) to the Poisons Standard) • Medicines that are not complementary medicines
* Prescription (Rx) necessary by law to receive product
Non Rx-Bound (“total OTC”)
Source: http://www.tga.gov.au/industry/otc-basics-regulation.htm
TGA
IMS
IMS data Pharmacy Sales only (other retail channels not included)
15 Global and Local Healthcare Market Trends © IMS Health
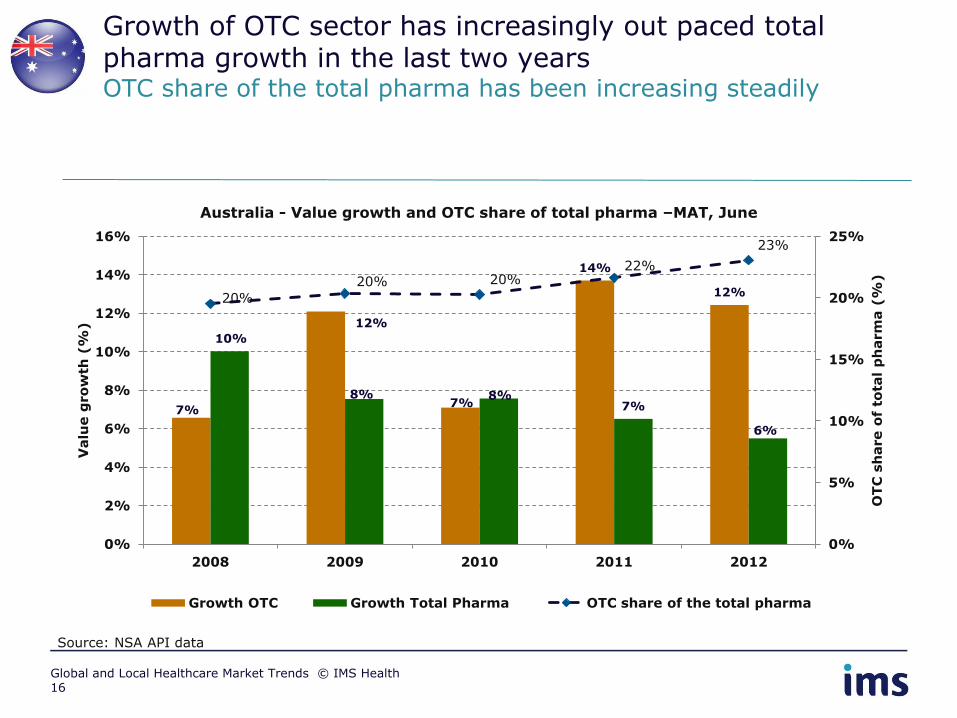
Growth of OTC sector has increasingly out paced total pharma growth in the last two years OTC share of the total pharma has been increasing steadily
Source: NSA API data
7%
12%
7%
14%
12%
10%
8% 8% 7%
6%
20%
20% 20% 22%
23%
0%
5%
10%
15%
20%
25%
0%
2%
4%
6%
8%
10%
12%
14%
16%
2008 2009 2010 2011 2012
OT
C s
hare o
f to
tal
ph
arm
a (
%)
Valu
e g
ro
wth
(%
)
Australia - Value growth and OTC share of total pharma –MAT, June
Growth OTC Growth Total Pharma OTC share of the total pharma
16 Global and Local Healthcare Market Trends © IMS Health
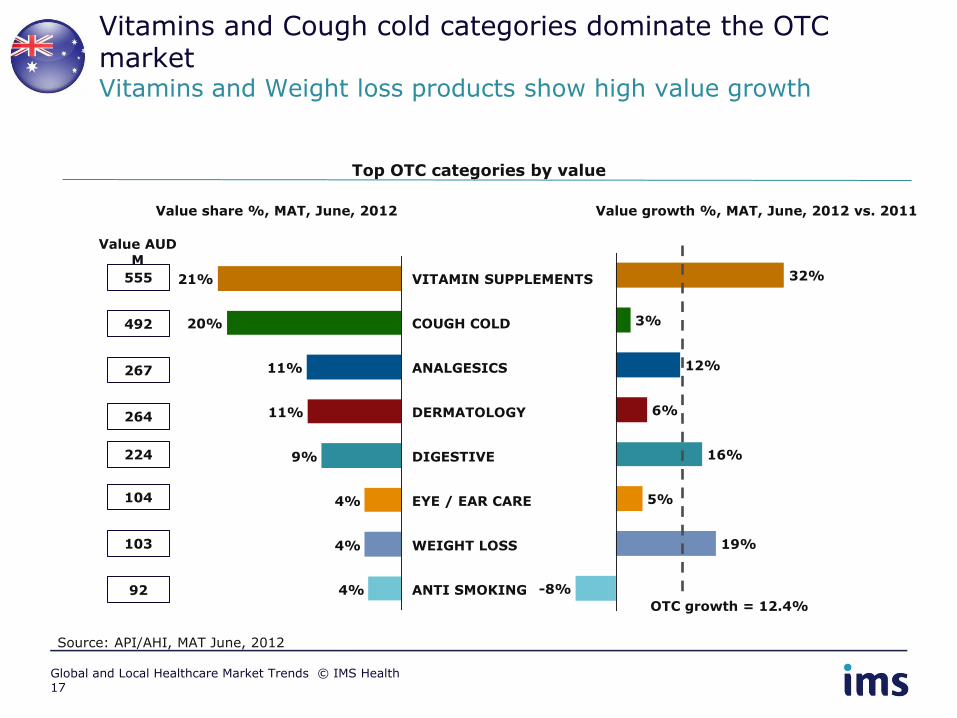
Vitamins and Cough cold categories dominate the OTC market Vitamins and Weight loss products show high value growth
Top OTC categories by value
Source: API/AHI, MAT June, 2012
WEIGHT LOSS 4%
EYE / EAR CARE 4%
DIGESTIVE 9%
DERMATOLOGY 11%
ANALGESICS 11%
COUGH COLD 20%
VITAMIN SUPPLEMENTS 21%
4% ANTI SMOKING -8%
19%
5%
16%
6%
12%
3%
32%
Value share %, MAT, June, 2012 Value growth %, MAT, June, 2012 vs. 2011
555
492
267
264
224
104
103
92
Value AUD M
OTC growth = 12.4%
17 Global and Local Healthcare Market Trends © IMS Health
-20
-15
-10
-5
0
5
10
15
20
25
30
0 10 20 30
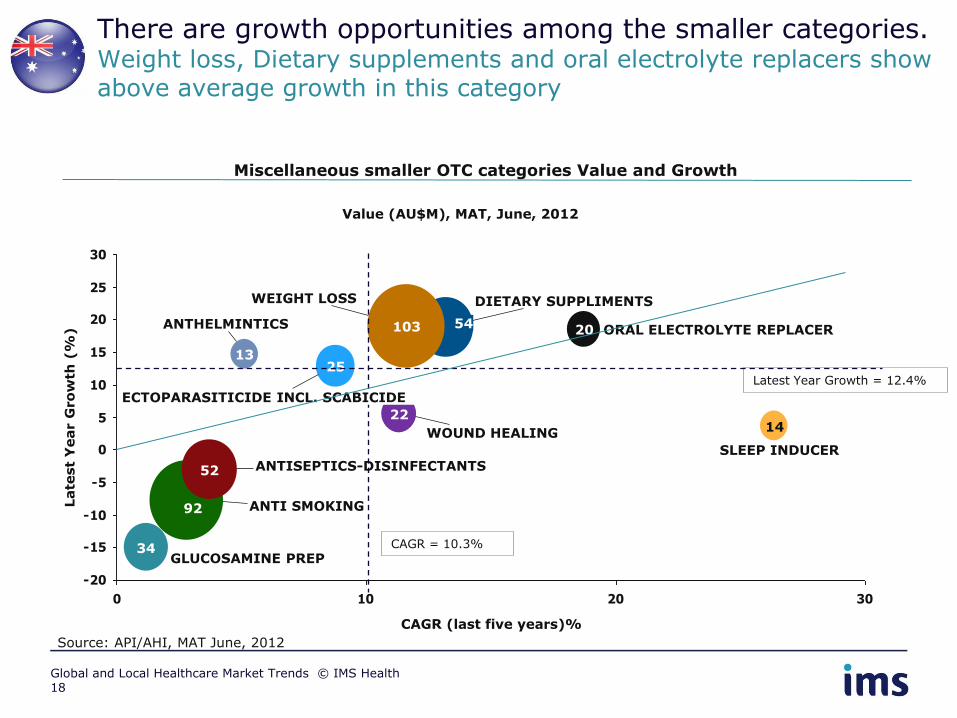
There are growth opportunities among the smaller categories. Weight loss, Dietary supplements and oral electrolyte replacers show above average growth in this category
Miscellaneous smaller OTC categories Value and Growth
Source: API/AHI, MAT June, 2012
Value (AU$M), MAT, June, 2012
Late
st
Year G
ro
wth
(%
)
CAGR (last five years)%
13
ANTHELMINTICS
14
SLEEP INDUCER
20 ORAL ELECTROLYTE REPLACER
22
WOUND HEALING
25
ECTOPARASITICIDE INCL. SCABICIDE
34 GLUCOSAMINE PREP
52 ANTISEPTICS-DISINFECTANTS
54
DIETARY SUPPLIMENTS
92 ANTI SMOKING
103
WEIGHT LOSS
Latest Year Growth = 12.4%
CAGR = 10.3%
18 Global and Local Healthcare Market Trends © IMS Health
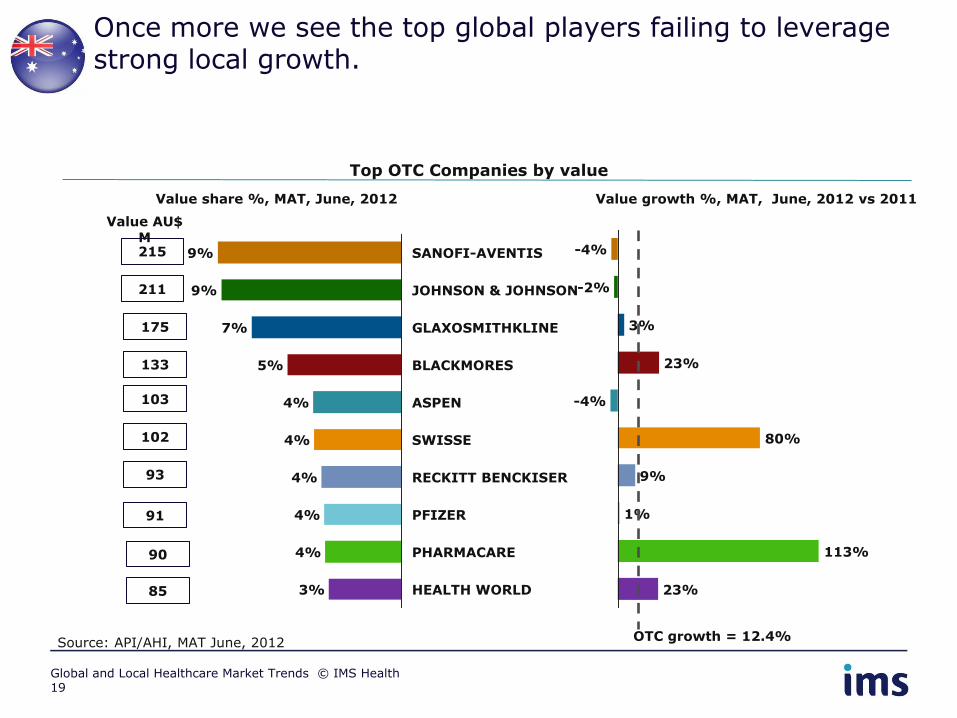
Once more we see the top global players failing to leverage strong local growth.
Top OTC Companies by value
Source: API/AHI, MAT June, 2012
PFIZER 4%
RECKITT BENCKISER 4%
SWISSE 4%
ASPEN 4%
BLACKMORES 5%
GLAXOSMITHKLINE 7%
JOHNSON & JOHNSON 9%
SANOFI-AVENTIS 9%
HEALTH WORLD
PHARMACARE 4%
3%
1%
9%
80%
-4%
23%
3%
-2%
-4%
113%
23%
Value share %, MAT, June, 2012 Value growth %, MAT, June, 2012 vs 2011
215
211
175
133
103
102
93
91
Value AU$ M
90
85
19 Global and Local Healthcare Market Trends © IMS Health
OTC growth = 12.4%
-30
-20
-10
0
10
20
30
40
50
60
70
80
90
100
110
120
130
-3 0 3 6 9 12 15 18 21 24 27 30 33 36 39 42 45
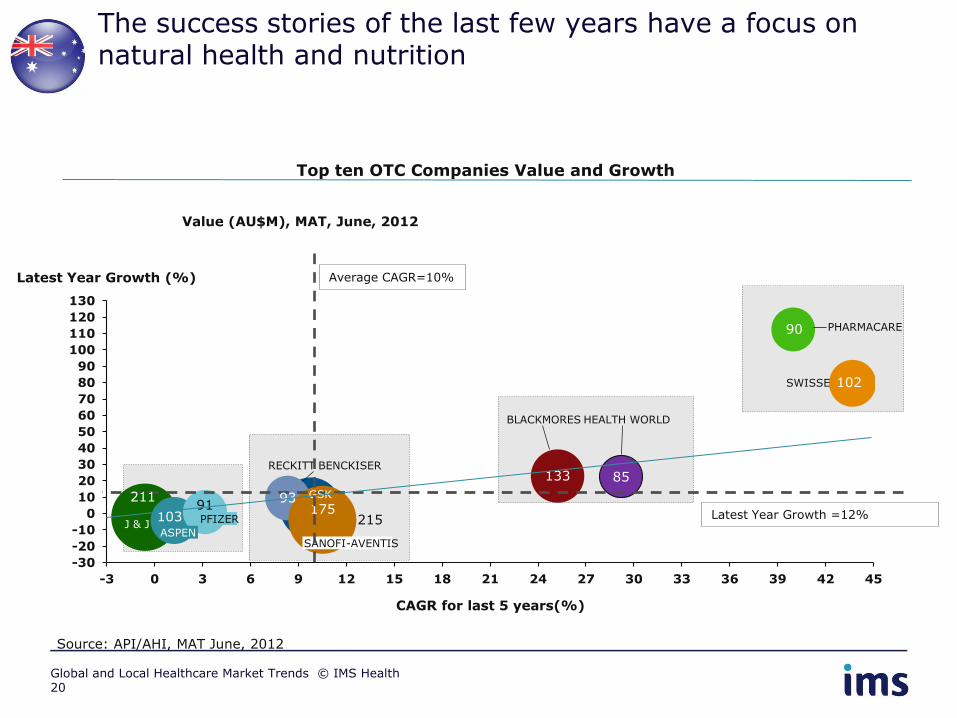
The success stories of the last few years have a focus on natural health and nutrition
Top ten OTC Companies Value and Growth
Source: API/AHI, MAT June, 2012
Value (AU$M), MAT, June, 2012
Latest Year Growth (%)
HEALTH WORLD
90 PHARMACARE
91 PFIZER
93
RECKITT BENCKISER
102 SWISSE
103 ASPEN
133
BLACKMORES
175 GSK 211
J & J 215
SANOFI-AVENTIS
CAGR for last 5 years(%)
85
Average CAGR=10%
Latest Year Growth =12%
20 Global and Local Healthcare Market Trends © IMS Health

Smaller companies have been growing and consistently contributing to overall OTC market growth Top three players are struggling to maintain their market share
Top OTC Companies Value, Growth and Contribution to growth
Source: API/AHI, MAT June, 2012
Value (AU$M), MAT, June
144 182 204 223 215 216 221 210 216 211 120 132 148 169 175 54 55 77
108 133 98 106 106
108 103 102 93 91
23 24
28 42
90 85 777
874 931
1,052
1,181
0%
2%
4%
6%
8%
10%
12%
14%
16%
0
500
1,000
1,500
2,000
2,500
3,000
2008 2009 2010 2011 2012
Gro
wth
(%
)
Valu
e (
AU
$M
) M
AT
Ju
ne
OTHERS
HEALTH
WORLD
PHARMACARE
PFIZER
RECKITT
BENCKISER
SWISSE
ASPEN
BLACKMORES
GSK
J & J
SANOFI-
AVENTIS
Growth
2% 1% 1%
-0.4%
1%
1% 1%
1.2% 1.6%
1%
1%
1%
2%
1%
0.4%
1%
1%
2% 0.4%
0.4%
1% 1%
6%
3%
6%
6%
-1%
1%
3%
5%
7%
9%
11%
13%
15%
2009 2010 2011 2012
Co
ntr
ibu
tio
n t
o G
ro
wth
(%
)
Contribution to Growth, MAT, June
21 Global and Local Healthcare Market Trends © IMS Health
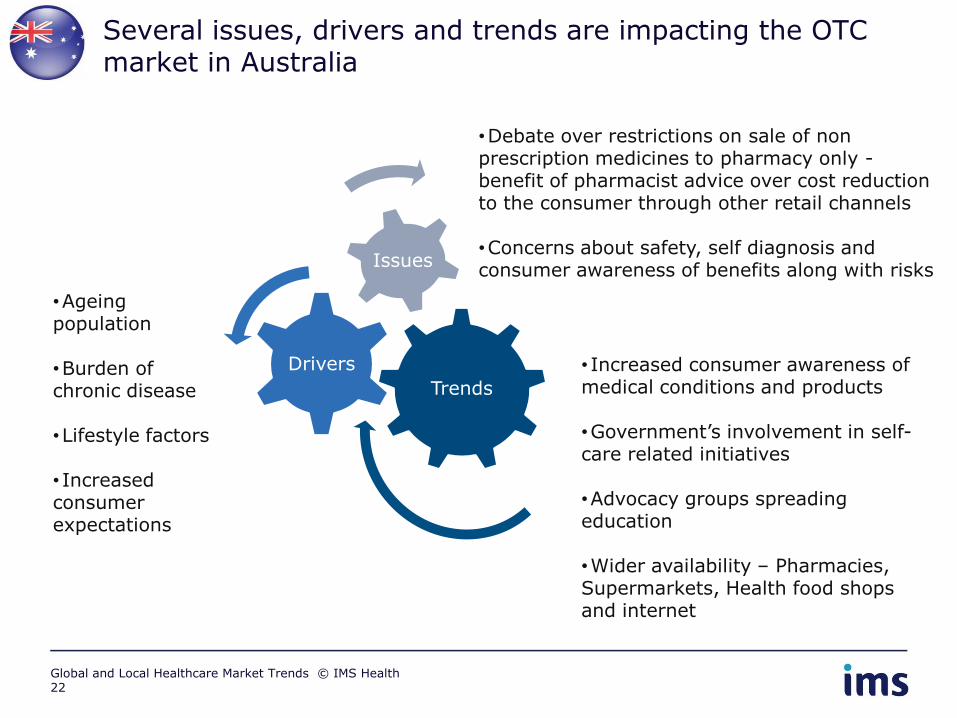
Several issues, drivers and trends are impacting the OTC market in Australia
Trends
Drivers
Issues
•Ageing population
•Burden of chronic disease
•Lifestyle factors
• Increased consumer expectations
•Debate over restrictions on sale of non prescription medicines to pharmacy only - benefit of pharmacist advice over cost reduction to the consumer through other retail channels
•Concerns about safety, self diagnosis and consumer awareness of benefits along with risks
• Increased consumer awareness of medical conditions and products
•Government’s involvement in self-care related initiatives
•Advocacy groups spreading education
•Wider availability – Pharmacies, Supermarkets, Health food shops and internet
22 Global and Local Healthcare Market Trends © IMS Health
AGENDA
• Global OTC Context
• Local Trends
• Focus on the Consumer & Channel
• Highlights & Conclusions
Global and Local Healthcare Market Trends © IMS Health 23
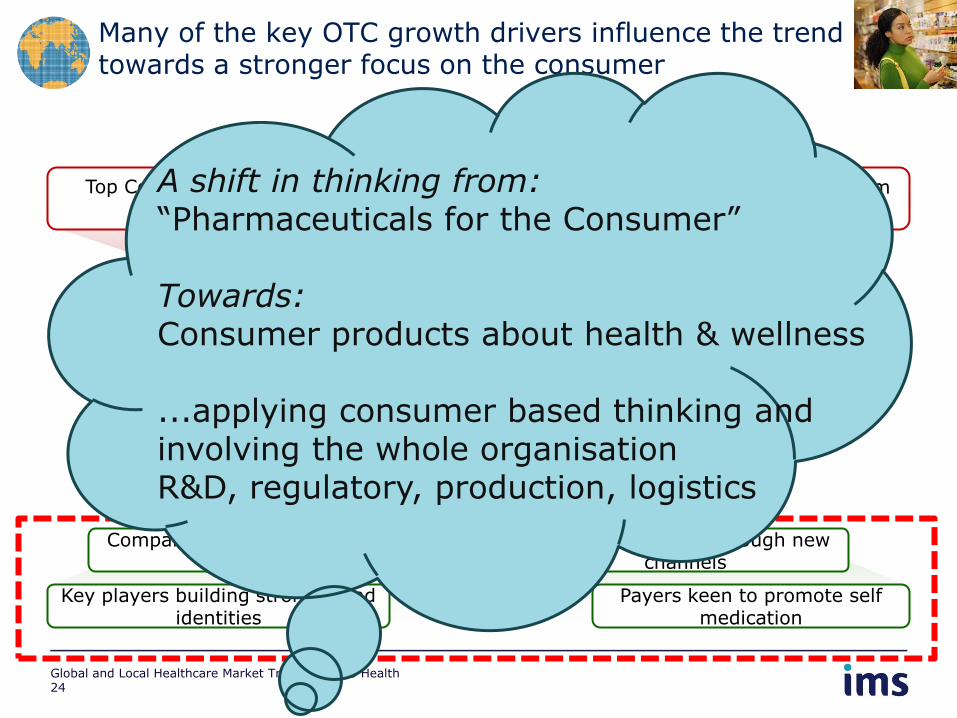
Many of the key OTC growth drivers influence the trend towards a stronger focus on the consumer
Global and Local Healthcare Market Trends © IMS Health 24
Top Corps contribution to growth falling rapidly
Low number and quality output from R&D
Generics dominating large therapy areas
Demand constrained by payers
Key players building strong brand identities
Payers keen to promote self medication
Emerging markets have the critical mass to influence growth
Companies seek to exploit switch opportunities
Increasing access through new channels
PHARMA
OTC
A shift in thinking from: “Pharmaceuticals for the Consumer” Towards: Consumer products about health & wellness ...applying consumer based thinking and involving the whole organisation R&D, regulatory, production, logistics
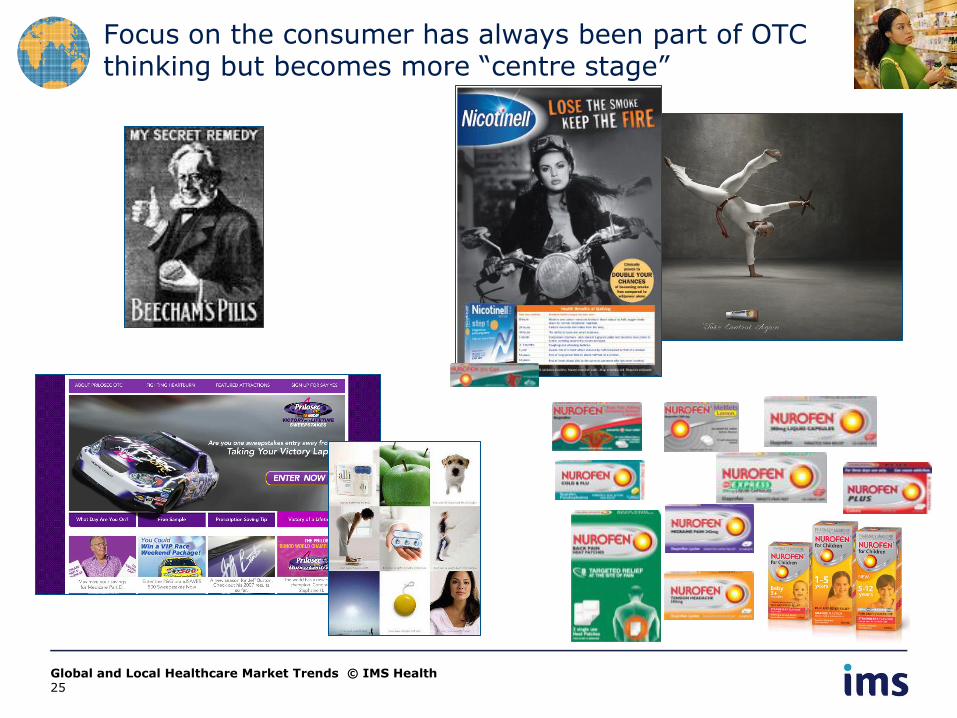
Focus on the consumer has always been part of OTC thinking but becomes more “centre stage”
Global and Local Healthcare Market Trends © IMS Health 25
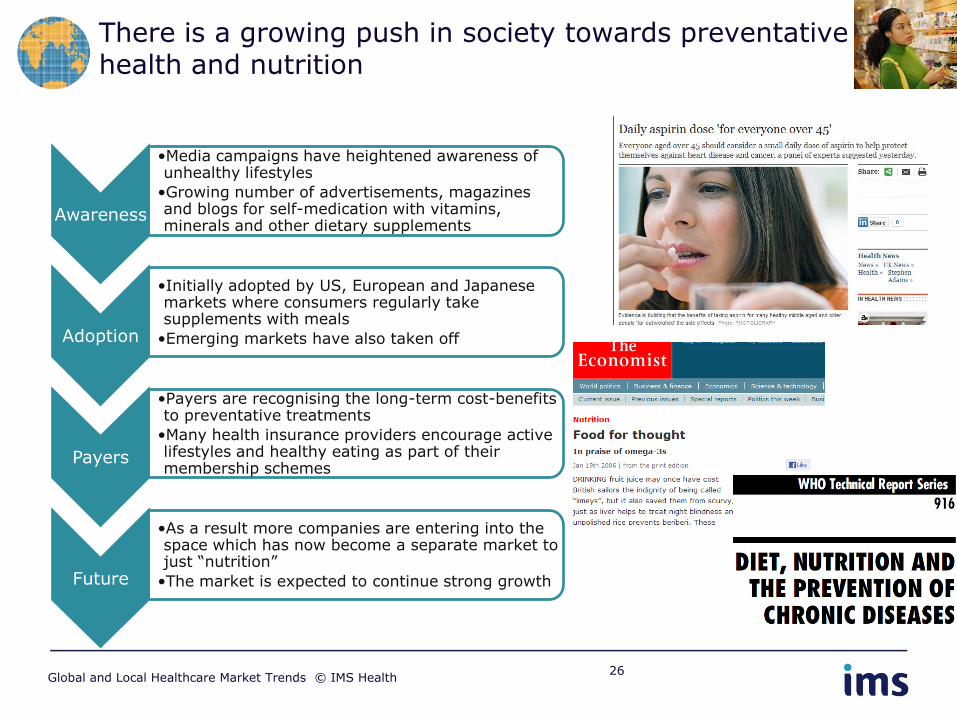
There is a growing push in society towards preventative health and nutrition
Global and Local Healthcare Market Trends © IMS Health 26
Awareness
•Media campaigns have heightened awareness of unhealthy lifestyles
•Growing number of advertisements, magazines and blogs for self-medication with vitamins, minerals and other dietary supplements
Adoption
•Initially adopted by US, European and Japanese markets where consumers regularly take supplements with meals
•Emerging markets have also taken off
Payers
•Payers are recognising the long-term cost-benefits to preventative treatments
•Many health insurance providers encourage active lifestyles and healthy eating as part of their membership schemes
Future
•As a result more companies are entering into the space which has now become a separate market to just “nutrition”
•The market is expected to continue strong growth
27
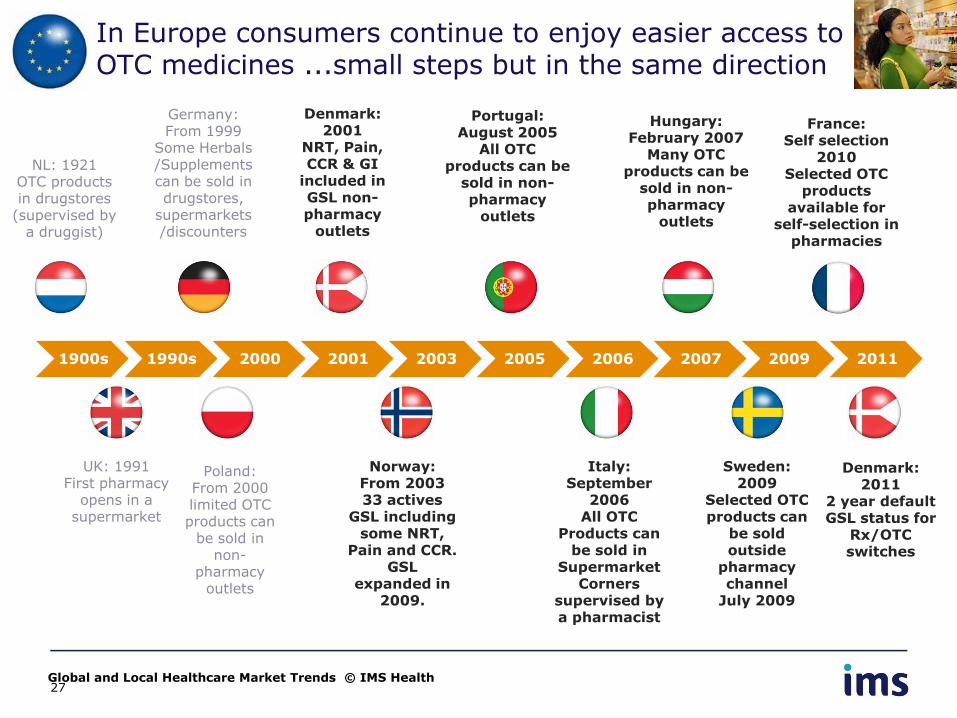
In Europe consumers continue to enjoy easier access to OTC medicines ...small steps but in the same direction
1900s 1990s 2000 2001 2003 2005 2006 2007 2009 2011
NL: 1921 OTC products in drugstores
(supervised by a druggist)
UK: 1991 First pharmacy
opens in a supermarket
Germany: From 1999
Some Herbals /Supplements can be sold in drugstores,
supermarkets /discounters
Poland: From 2000 limited OTC products can
be sold in non-
pharmacy outlets
Portugal: August 2005
All OTC products can be
sold in non-pharmacy
outlets
Italy: September
2006 All OTC
Products can be sold in
Supermarket Corners
supervised by a pharmacist
Hungary: February 2007
Many OTC products can be
sold in non-pharmacy
outlets
Sweden: 2009
Selected OTC products can
be sold outside
pharmacy channel
July 2009
Norway: From 2003 33 actives
GSL including some NRT,
Pain and CCR. GSL
expanded in 2009.
Denmark: 2001
NRT, Pain, CCR & GI
included in GSL non-pharmacy
outlets
Global and Local Healthcare Market Trends © IMS Health
France: Self selection
2010 Selected OTC
products available for
self-selection in pharmacies
Denmark: 2011
2 year default GSL status for
Rx/OTC switches
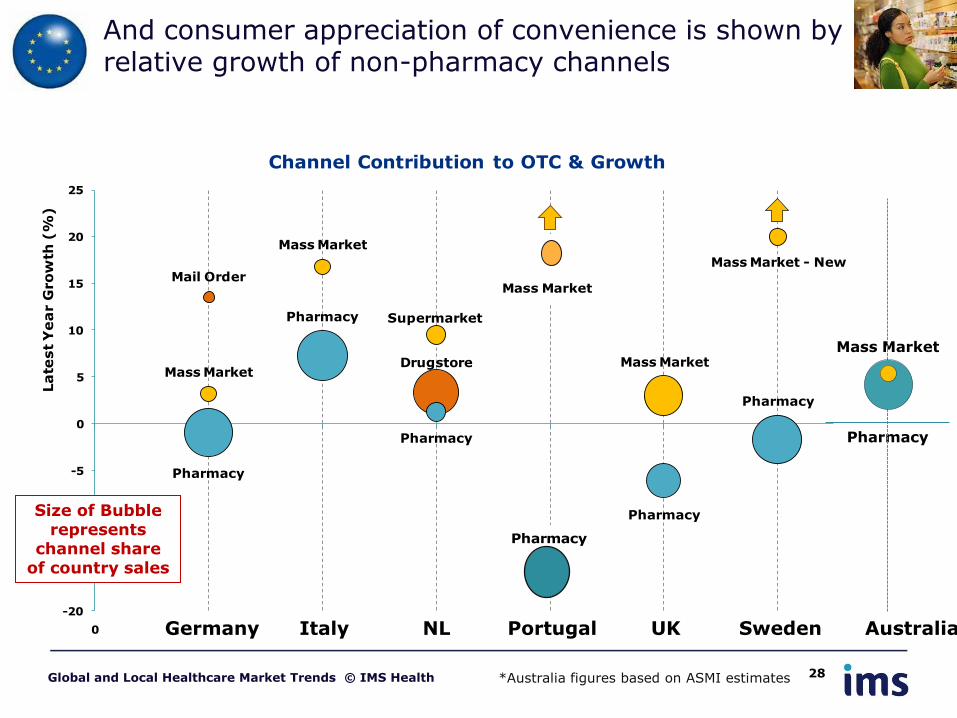
And consumer appreciation of convenience is shown by relative growth of non-pharmacy channels
Pharmacy
Mass Market
Mail Order
Mass Market
Pharmacy
Drugstore
Pharmacy
Supermarket
Mass Market
Pharmacy
Pharmacy
Mass Market
Mass Market - New
Pharmacy
-20
-15
-10
-5
0
5
10
15
20
25
0 1 2 3 4 5 6
La
test
Ye
ar G
ro
wth
(%
)
Channel Contribution to OTC & Growth
Germany Italy NL Portugal UK Sweden
Pharmacy
Mass Market
Australia
Pharmacy
Mass Market
28 Global and Local Healthcare Market Trends © IMS Health
Size of Bubble represents
channel share of country sales
*Australia figures based on ASMI estimates
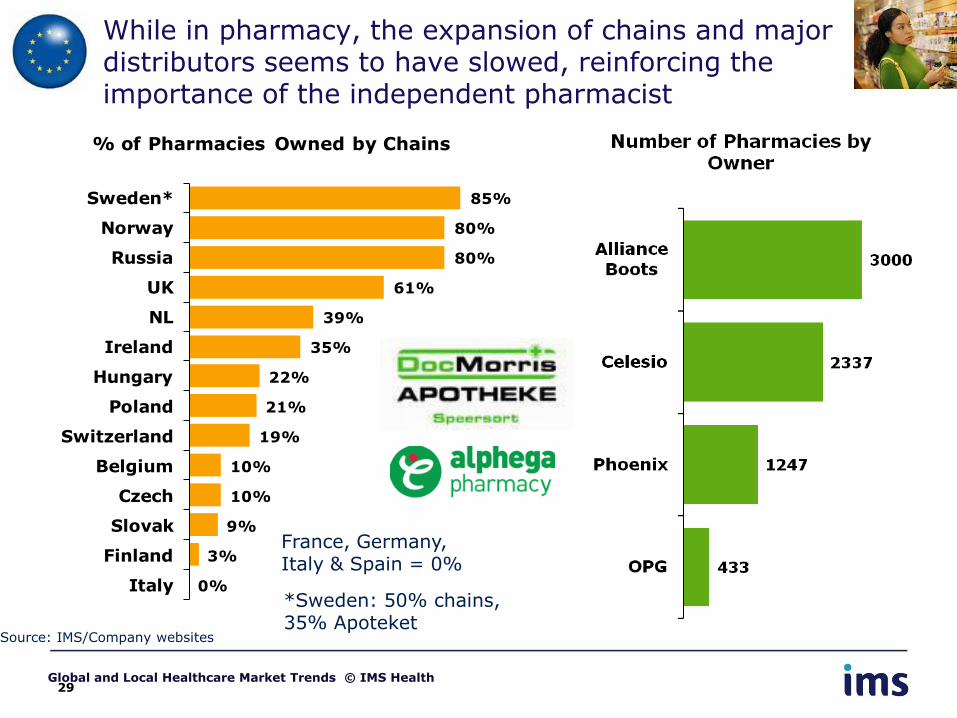
While in pharmacy, the expansion of chains and major distributors seems to have slowed, reinforcing the importance of the independent pharmacist
29
Source: IMS/Company websites
85%
80%
80%
61%
39%
35%
22%
21%
19%
10%
10%
9%
3%
0%
Sweden*
Norway
Russia
UK
NL
Ireland
Hungary
Poland
Switzerland
Belgium
Czech
Slovak
Finland
Italy
% of Pharmacies Owned by Chains
France, Germany, Italy & Spain = 0%
*Sweden: 50% chains, 35% Apoteket
Global and Local Healthcare Market Trends © IMS Health
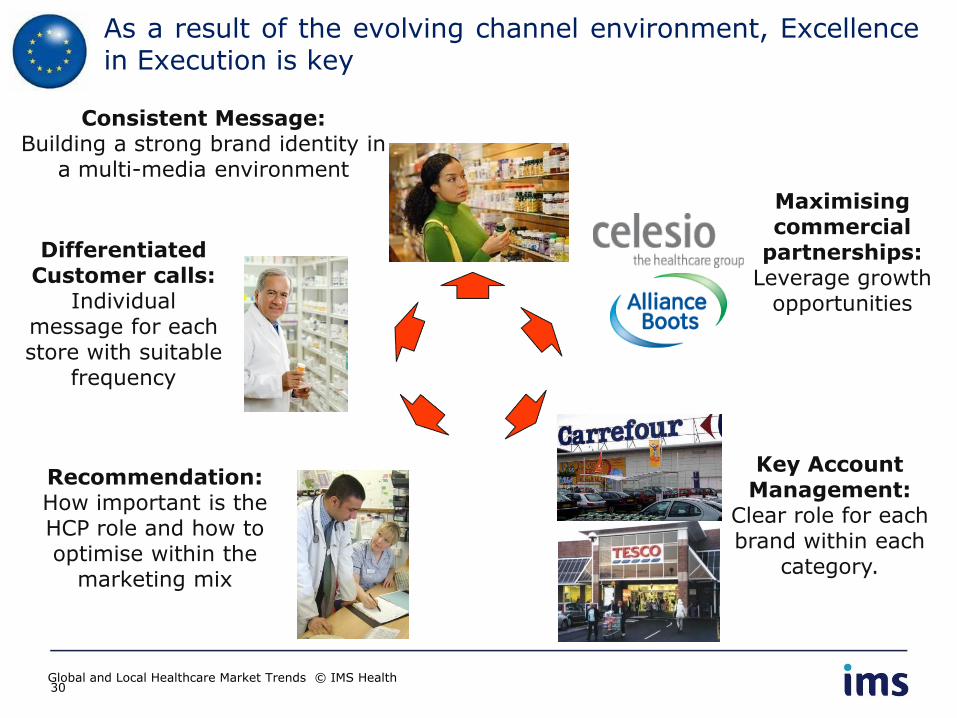
As a result of the evolving channel environment, Excellence in Execution is key
Pharmacist
HCPs
Mass Market
Wholesalers
Consumers
Key Account Management:
Clear role for each brand within each
category.
Differentiated Customer calls:
Individual message for each store with suitable
frequency
Consistent Message: Building a strong brand identity in
a multi-media environment Maximising
commercial partnerships:
Leverage growth opportunities
Recommendation: How important is the HCP role and how to optimise within the
marketing mix
Global and Local Healthcare Market Trends © IMS Health 30
AGENDA
• Global OTC Context
• Local Trends
• Focus on the Consumer & Channel
• Highlights & Conclusions
Global and Local Healthcare Market Trends © IMS Health 31
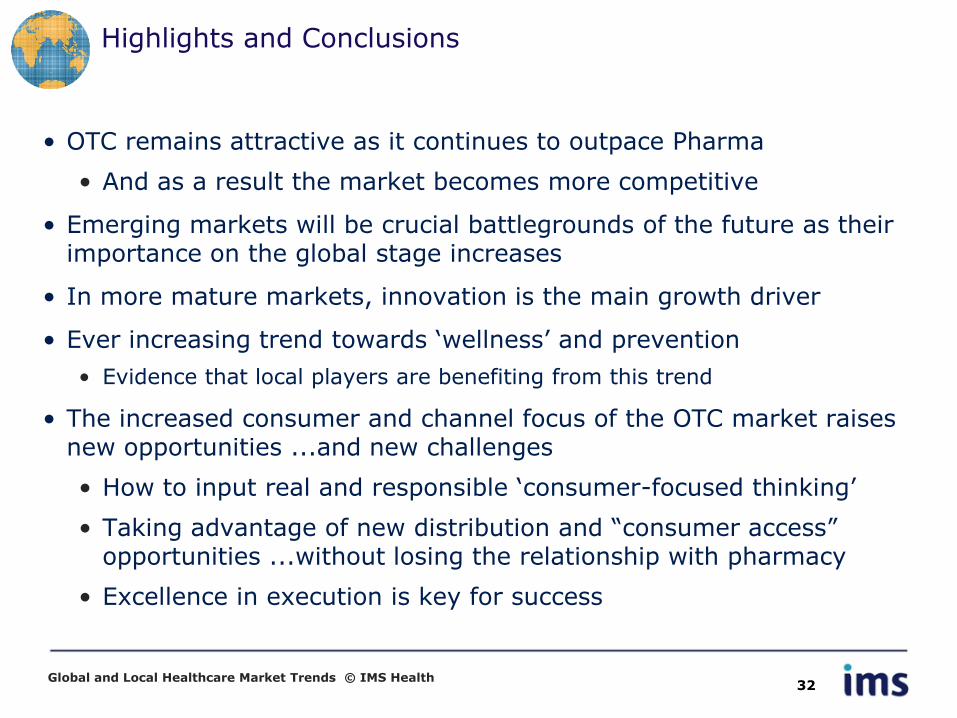
• OTC remains attractive as it continues to outpace Pharma
• And as a result the market becomes more competitive
• Emerging markets will be crucial battlegrounds of the future as their importance on the global stage increases
• In more mature markets, innovation is the main growth driver
• Ever increasing trend towards ‘wellness’ and prevention
• Evidence that local players are benefiting from this trend
• The increased consumer and channel focus of the OTC market raises new opportunities ...and new challenges
• How to input real and responsible ‘consumer-focused thinking’
• Taking advantage of new distribution and “consumer access” opportunities ...without losing the relationship with pharmacy
• Excellence in execution is key for success
Highlights and Conclusions
32 Global and Local Healthcare Market Trends © IMS Health
For more information on the content of this presentation please contact:
Francine Nieto Marketing Director, Consumer Health IMS Health
Phone Number: + 44 (0) 20 3075 4102
Thank You!
Global and Local Healthcare Market Trends © IMS Health 33