GLOBAL ADVANCED TECHNOLOGY PARTNER FOR CORE BUSINESS ... · GLOBAL ADVANCED TECHNOLOGY PARTNER FOR...
62
GLOBAL ADVANCED TECHNOLOGY PARTNER FOR CORE BUSINESS OPERATIONS Investors Presentation November 2017
Transcript of GLOBAL ADVANCED TECHNOLOGY PARTNER FOR CORE BUSINESS ... · GLOBAL ADVANCED TECHNOLOGY PARTNER FOR...

GLOBAL ADVANCED TECHNOLOGY PARTNER FOR CORE BUSINESS OPERATIONS
Investors Presentation
November 2017

| 2
This presentation has been produced by Indra for the sole purpose expressed therein. Therefore, neither this presentation nor any of
the information contained herein constitutes an offer sale or exchange of securities, invitation to purchase or sale shares of the
Company or any advice or recommendation with respect to such securities.
Its content is purely for information purposes and the statement it contains may reflect certain forward-looking statements,
expectations and forecasts about the Company at the time of its elaboration. These expectations and forecasts are not in
themselves guarantees of future performance as they are subject to risks, uncertainties and other important factors beyond the
control of the Company that could result in final results materially differing from those contained in these statements. The Company
does not assume any obligation or liability in connection with the accuracy if the mentioned estimations and is not obliged to update
or revise them.
This document contains information that has not been audited. In this sense, this information is subject to, and must be read in
conjunction with, all other publicly available information.
This disclaimer should be taken into consideration by all the individuals or entities to whom this document is targeted and by those
who consider that they have to make decisions or issue opinions related to securities issued by Indra.
Disclaimer

| 3
What is Indra?
Our Strategic Plan
Our delivery & new value levers going forward
Detailed vertical Description
Annex 1: Last quarterly results
Annex 2: VTO of Tecnocom
01
02
03
04
05
06
Index

| 4
Indra: A global Consulting and Technology company 01. Whats is Indra?
€2.7Bn Revenues 2016
34,000 employees
+140 countries
Global
consulting
and technology
company
Business Model
based on our
Proprietary
Products and
R&D
Technology Partner for core business operations
Information Technology (55% of total sales)
Leading Digital company
in Spain and Latam
Energy & Industry
Financial Services
Public Administration & Healthcare
Telecom & Media
Transport & Defence (45% of total sales)
Leading worldwide provider
of proprietary solutions in niche areas
Transport & Traffic
Defence & Security

| 5
We deliver core business operations technology in various industries
01. Whats is Indra?
15%
18%
8%
15%
22%
23%
T&D IT
Sales 2016
Transport & Traffic
• Air Traffic Management
systems and
Communications,
Navigation and
Surveillance systems
• Transport: Railway
management systems,
Urban traffic systems,
highways, tunnels and
traffic control systems
Defence & Security
• Electronic Defence
• Air surveillance
• Military simulation
• Maritime surveillance
• Satellite Communications
Telecom & Media
• Operations and business
support systems
• New media and digital
television solutions
Financial Services
• Insurance and banking core
systems
• Operations transformation and
process efficiency services
Public Admin
& Healthcare
• Comprehensive offer on electoral processes
• Educational and justice management systems
• Healthcare management platform
Energy & Industry
• Energy: generation, distribution and
commercial management solutions
• Industry management solutions
| 6
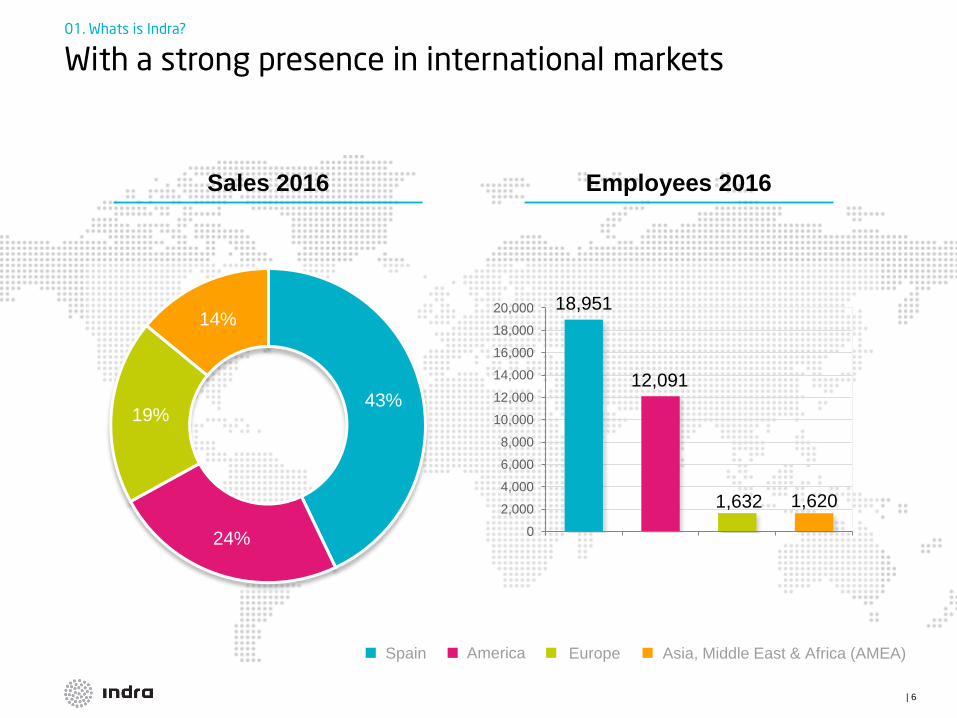
18,951
12,091
1,632 1,620
0
2,000
4,000
6,000
8,000
10,000
12,000
14,000
16,000
18,000
20,000
With a strong presence in international markets 01. Whats is Indra?
43%
24%
19%
14%
Sales 2016 Employees 2016
Spain America Europe Asia, Middle East & Africa (AMEA)

| 7
14%
26%
18%
18%
8%
17%
Transport
& Traffic
Financial
Services
PPAA & Healthcare
Energy
& Industry
Telecom
& Media
Defence
& Security
Revenues breakdown by regions and verticals 2016 01. Whats is Indra?
30%
11%
12% 13%
8%
26%
Spanish revenues breakdown
International revenues breakdown
Transport
& Traffic
Financial
Services
PPAA & Healthcare
Energy
& Industry
Telecom
& Media
Defence
& Security
64%
51%
41%
54%
33%
25%
43%
36%
46%
59%
46%
67%
75%
57%
Transport
& Traffic
Financial
Services
PPAA
& Healthcare
Energy
& Industry
Defence
& Security
Telecom
& Media
Total
Spain International

| 8
3,013 2,651 2,744
2,938 2,850 2,709
268 131 229
6.9%(2) 1.6%(1) 6.0%
-92(3) -641(3) 70
81(3) 30(3) 5
47 -50 184
663 700 523
Main figures 2014-16 01. Whats is Indra?
(1) Before non-recurrent items of €687M
(2) Before non-recurrent items of €246M
(3) After non-recurrent items
FY15 FY16 FY14
Order Intake (€M)
Revenues (€M)
EBITDA (€M)
EBIT margin
Recurrent
Net profit Reported (€M)
NWC (DoS)
FCF (€M)
Net Debt (€M)

| 9
Main Shareholders 01. Whats is Indra?
(*) Board of Directors representation
CNMV data. Identified shareholders
with a position in excess of 3%
18.7%
10.5%
9.4%
3.5%
3.4% 3.2%
3.0%
48.3%
Sociedad Estatal de Participaciones
Industriales S.E.P.I (*)
Fidelity Management Research
Corporación Financiera Alba (*)
Others
T. Rowe Price Associates
Norges Bank
Schroders
Allianz Global Investors

| 10
Diagnostic before our strategic plan: we grew in sales despite the crisis in Spain…
02. Our Strategic Plan
We overcame the Spanish crisis
by internationalizing our business
3,000
2,000
1,000
0
Spain - corporations
International
2014
2,938
461
685
1,791
2007
2,168
864
606
698
Spain - public sector
+13%
-47%
+157%
+36%
Spain - public sector
as % of Total Revenues 16% 40%
Sales evolution by geography, 2007 – 2014 (€M)
| 10

| 11
… at the expense of our profitability and cash flow conversion 02. Our Strategic Plan
0
1
2
3
4
5
2014
1.6
2007
3.3
-4
0
4
8
12
16
2007 2014
6.9
-1.4
11.1
Profitability decreased... ...and cash flow eroded
Free cash flow margin (%) Recurrent EBIT margin (%)
-4.2 pps
-1.7 pps
240 204 Recurrent
EBIT (€M) 72 47
Free Cash
Flow (€M)
150 663 Net Debt (€M)
When including
non-recurrent items

| 12
We understood the main causes that impacted our profitability performance
02. Our Strategic Plan
Complex macro
economic
environment & new
industry dynamics
Issues derived from
our strong focus on
growing outside of
Spain
Worst crisis in decades in Spain, our home market
• And worse global conditions than originally expected
outside of Spain
Scenario worsened by new industry dynamics
which have put pressure on pricing and margins
• Global players competing everywhere
• Pressure on client budgets
• Commoditization of traditional technology
In a context of aggressive growth and sales
replacement, we...
• ...lost our focus on cost efficiency
• ...widened our portfolio and focused less on our
value-added segments
• ...didn't quickly react to adjust our go-to-market
strategy
• ...and ended up in an expensive delivery model

| 13
We launched our strategic plan in July 15 02. Our Strategic Plan
Enabler for strategy
implementation
Growth accelerators
Base for sustainable
and profitable growth
Short term
must-dos
Cultural change to be more focused on profitability 06
Growth in new businesses 05
Products
and projects
portfolio
02 Go-to-market
strategy 03 Delivery
model 04
Cost reduction to capture savings and increase Indra's competitiveness
(Plan €180-200m) 01
In p
rogre
ss
Done

| 14
We are refocusing our product and project portfolio based on four levers
02. Our Strategic Plan
Prioritize existing
products portfolio
by focusing on
high value-added
products
Prioritize existing portfolio by focusing
on core business operation products
• Increase share of proprietary
products and end-to-end projects
Push to develop value-added
products focused on core business
operations for our clients
• We already have a strong
portfolio and want to keep
evolving it
Increase standardization
Increase
standardization Industrialize and standardize our offer
to capture economies of scale and
build expertise
• Reduce current portfolio of
products and projects
• Standardize and modularize
projects and products
• Take advantage of greater
standardization in production
processes
Demand
minimum project
requirements
Re-organize
business portfolio
Prioritize valuable projects for Indra
based on a selective funnel procedure
Demand a minimum size / profitability
for our projects to avoid fragmentation
inefficiencies
Complement business portfolio by
including selective investments and
divestments
• Based on cash flow generation

| 15
We are transforming our go-to-market strategy to achieve our target projects and products portfolio
02. Our Strategic Plan
Increase standardization
By re-balancing our business mix towards our own value-added products,
we will increase both profitability and cross-selling activities
Complement geographies' go-to-market
strategies with business specialized
expertise to maximize returns from the
targeted portfolio
Reinforce skills of commercial teams
Train and reinforce sales teams on new vertical offerings, with
specialized teams to deliver the best approach for the client
Selectively leverage third party channels
Take advantage of packaged solutions (e.g. inCMS, inGen...)
to facilitate sales through distribution channels
Increase revenue share per client
Prioritize flagship clients in order to cross-sell
and up-sell other projects and products
Reinforce commercial push
for value-added products
Push for targeted portfolio of
high value product and projects
Assess risk and price accordingly
Increase exhaustive control on offers and requisites
Assess risk in new projects / geographies and clients that
are new for Indra to avoid previous mistakes
Go-to-market
Strategy
| 15

| 16
We are improving the delivery model to increase both profitability and customer references
02. Our Strategic Plan
Industrialized
production Standardized products
that will be produced
efficiently
• In terms of costs,
timings and scope
New high-end tools and
processes for project
management
• Deployed across
all our verticals
Indra will focus on
minimizing errors and,
as a result, overruns
in projects
• Improving Indra's
profitability
Keep improving customer
experience so as to increase
• Loyalty among our
current client base
• Positive external
references to trigger
new sales
Industrialized
production
Customer
experience
and loyalty
Rigorous
project
management
Overrun
minimization

| 17
Defence &
Security
Transport &
Traffic
Energy &
Industry
Financial
Services
TMT
Public Admin
& Healthcare
We launched Minsait in February 2016 to grow in new digital businesses
02. Our Strategic Plan
Go-to-
market
Digital
solutions
Digital
platforms
Human
capital
Business Consultants
Technology Consultants Experts in Cyber Designers
Specific Own Property Solutions (Smart Home, Mobile Sales,...)
Digital platforms (i.e. Sofia2...)
New business
models
Relationship with
clients and citizens
Risk Management &
Cybersecurity
Redefining
operations
Consultoría + Sectores + Otros canales (por productos)
| 17

| 18
We are driving cultural change to be more focused on profitable growth and cash
02. Our Strategic Plan
Individuals
and teams are
engaged for
results
Reinforce
rigorous
project
management
Result-oriented behaviors • Based on accountability...
• ...and linking employee
remuneration to profitability
KPIs
Cultural change to be more focused on profitable growth
and cash generation
Processes and tools • Redefine offer approval
processes
• Reinforce controlling to support
performance measurement
People
People skilled and ready for
new strategy • Promote specialized vertical
business know-how
• Reinforce trainings and
people development
A cash flow target has already been set to define Indra's top
management team variable compensation
+ +
| 18

| 19
2,938 CAGR1
2.5%-4.5%
204 (6.9%) 10%-11%
47 (1.6%)
~200 (~6%)
2.5x ~1.0x
2018 2014
Revenues (€M)
Recurrent EBIT margin (€M)
(% of revenues)
FCF (€M)
(% of revenues)
Net Debt / EBITDA
2018 Targets for our Strategic Plan 02. Our Strategic Plan
1. Organic growth. Constant exchange rates as of 2014 (average FX in 2014).

| 20
• Global and local investment recovery
• Proprietary product portfolio and proven track-record
to boost international sales
• Strengthening of commercial partnerships and
optimization
of production and purchasing processes
509 3%-5%
• Take advantage of Single European Sky through
SESAR
and iTEC
• Push for Nation Wide projects
• Maintain growth and leadership in CNS equipment
620 3%-5%
• Product mix change towards higher value-added solutions and improving client mix
– More focus on private and global clients – More focus on national public clients in Public
Admin • Leverage Indra Digital's offering • Take advantage of optimized delivery model
1,809 2%-4%
Rationale
Defence & Security
Transport & Traffic
IT verticals
2018 Sales Targets by businesses 02. Our Strategic Plan
1. Organic growth. Constant exchange rates as of 2014 (average FX in 2014).
Sales
2014 (€M)
Expected CAGR1
2014 – 2018 (%)

| 21
Our performance since July 2015 (I) 03. Our delivery & new value levers going forward
• Revenue pressure in IT & Transport because of
• Macro headwinds (forex, oil and raw materials
price influence in public budgets, delays in
Spanish public budgets in 2015, 2016, 2017?,…)
• Slower portfolio rotation
• Strategy and portfolio of Transport division under
review
• More transformation required in terms of our
commercial capabilities, cultural change and portfolio
simplification.
• More than expected provisions for onerous
projects
• Our operations have improved…..
• New commercial strategy with a global customer
targeting
• Prioritized portfolio of core solutions and strict
offering process, bringing better quality of the
backlog
• Defence and Security growth beyond guidance
• Better understanding of cost levers, with the majority
of the cost reduction plan successfully implemented
• … and are reflected in our financial results
• Sounder balance sheet after write offs
• Improvement in operating margins
• Stable and recurrent FCF generation
• Deleverage delivery
Restructuring is mostly behind us – we have set the base for future profitable
growth, although we will continue with transformation of our operations
Highlights Lowlights
| 21

| 22
Our performance since July 2015 (II) 03. Our delivery & new value levers going forward
2014 2015 2016
% Change
14/16
Clients 710 699 642 -9,6%
Billables 961 838 673 -30,0%
Inventories 231 70 69 -70,1%
6,6x
2,3x
3Q15 4Q16
2018
76
163
181 184
1Q16 2Q16 3Q16 4Q16
2018
~200
€M
Balance Sheet (€M) Margin Improvement
45
162
1,6%
EBIT FY15
6,0%
EBIT FY16
+4,4pp
LTM FCF Evolution (€M) Net Debt / EBITDA LTM (x)
~1.0x

| 23
New value levers going forward 03. Our delivery & new value levers going forward
• Operating leverage on revenue growth
• Higher direct margin on
• Better mix and quality backlog
• Less low-profitability and onerous projects
• Pending cost savings from Investor Day plan
Management
Priorities
FY17
Levers for
EBIT Margin
expansion
• Generate profitable growth from our proprietary differential core offer
• Focus on our core businesses and solutions
• Seize Macro tailwinds, Defense budgets growth and digital business opportunities
• Increase commercial intensity and operational transformation in key geographies
• AMEA as high growth engine geography based on proprietary offer
• LATAM improvement in commercial positioning (focus on local private customers and T&D growth)
and better quality backlog
• Continue with operational transformation all across the board
• Continuous monitoring of low profitability and onerous projects
• Maintain cost efficiency once the Investor Day cost savings plan is almost fully captured
• Evolve current delivery model towards a global one with a more efficient management of resources

| 24
Detailed vertical description 04. Detailed vertical description
Defence
& Security
IT Verticals
Transport
& Traffic

| 25
Global and local investment recovery: changing economic cycle will strengthen Indra's business
04. Detailed vertical description
On top of these macro trends, Defence value is migrating
from platforms to systems and data
Increased uncertainty and local conflicts foster investments
in Defence and Security
• Asymmetric warfare scenarios, global terrorist and piracy threats
• Huge raise in cyber attacks
• Tension increasing in Eastern Europe with NATO countries raising
their defence budgets
• ISIS activity in North Africa and Middle East
• Increasing migratory pressure towards Europe
• Drug smuggling circuits in LatAm
Better Spanish perspectives implying increased investment
in Defence
Major multiyear programs will help us to develop new
offerings
298 278 318
0
500
Top 89 countries in Defence spending (€Bn)1
2011 2014 2018
Global investment cycle recovery Spanish investment cycle recovery
-2%
/ year
-2%
/ year
Remotely Piloted
Aircraft Systems
(RPAS)
Total:
c.€250M
Space
Surveillance &
Tracking Radar
NH90 Helicopters
F110 Frigate
8x8 Armoured
Vehicles
1. Sum of procurement and RTD&E – Research, Testing, Development & Evaluation, stated in constant €. Source: Jane's Defence Budgets October 2014, Kongsberg Gruppen, Pareto Securities Equity Research.
Electronic
Defence Updates
(Vetronics)
Santiago’s Project
| 25

| 26
Defence and Security: we recovered our sales by strongly internationalizing our offering
04. Detailed vertical description
335
152 113 118
187 197
298
311 382 408
369 402
633
463
495 526
556 599
0
100
200
300
400
500
600
700
2007 2012 2013 2014 2015 2016
Spain
International
% International
sales
Sales (€M)
~50% ~70%
7%
/year

| 27
Defence and Security: we recovered our sales by strongly internationalizing our offering
04. Detailed vertical description
Main accessible geographies for European players
are Europe, AMEA and LatAm
Electronic
Defence
5
12
6
6
9
3
Maritime Surveillance
Indra's accessible
market size (2015 €Bn)
SATCOM
Cyber Defense
Air Surveillance
Training and Simulation
Electronic Defence
3
6
8
10
3
6
Expected market growth
(% CAGR 2015-18)
Systems
provider
Prime
Indra is a specialist provider in selected
market segments
Air
Surveillance
Military
Simulation
Maritime
Surveillance
Cyber
Defence
Satellite Communications
Note: SATCOM: Satellite Communications. Source: Strategic Defence Intelligence, IHS Jane's.360, Visiongain, Indra Analysis.
| 27

| 28
European
competitor
Air
Surveillance
Military
Simulation
Maritime
Surveillance
Electronic
Defence
Satellite
Communication
Indra
A
B
C
D
E
Indra’s position
in Europe #2 #2 #2 #4 #4
We are a significant European player in the market segments of activity...
04. Detailed vertical description
Source: Strategic Defence Intelligence, IHS Jane's.360, Visiongain, Companies' websites. Indra Analysis.
| 29
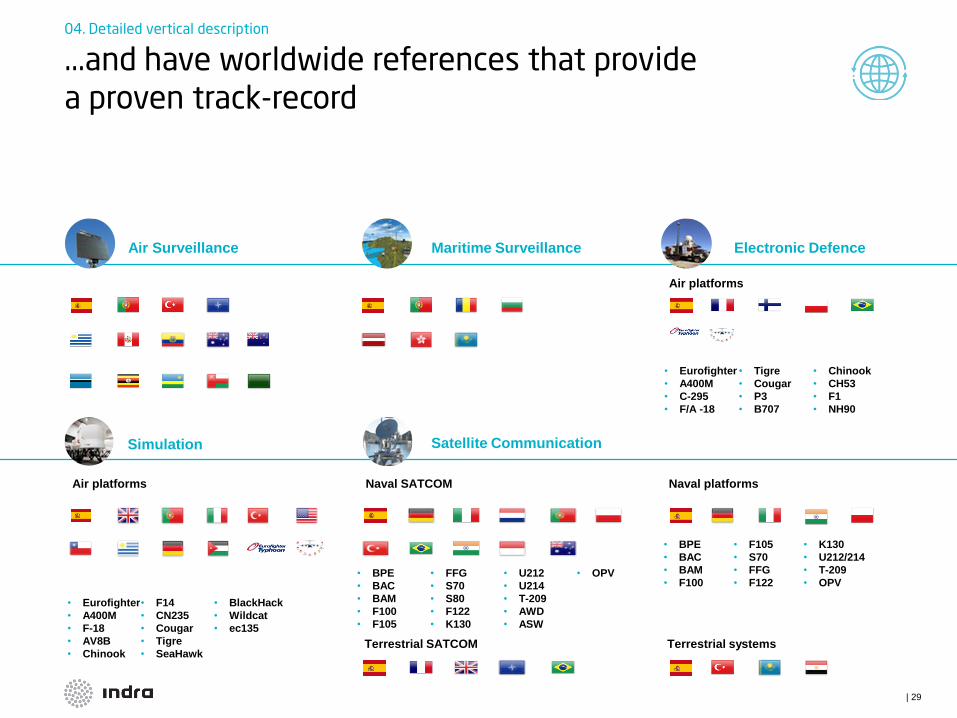
...and have worldwide references that provide a proven track-record
04. Detailed vertical description
Air platforms
Air platforms
Air Surveillance Maritime Surveillance Electronic Defence
• Eurofighter
• A400M
• C-295
• F/A -18
• Tigre
• Cougar
• P3
• B707
• Chinook
• CH53
• F1
• NH90
Terrestrial systems
Naval platforms
• BPE
• BAC
• BAM
• F100
• F105
• S70
• FFG
• F122
• K130
• U212/214
• T-209
• OPV
• BPE
• BAC
• BAM
• F100
• F105
• FFG
• S70
• S80
• F122
• K130
• U212
• U214
• T-209
• AWD
• ASW
• OPV
Naval SATCOM
Satellite Communication
Terrestrial SATCOM
Simulation
• Eurofighter
• A400M
• F-18
• AV8B
• Chinook
• F14
• CN235
• Cougar
• Tigre
• SeaHawk
• BlackHack
• Wildcat
• ec135

| 30
We will keep strengthening our network of commercial partners
04. Detailed vertical description
Air platforms Naval platforms Terrestrial platforms

| 31
Transport & Traffic: Consolidated position in Air Traffic Management (ATM)
04. Detailed vertical description
% ATM of Transport
& Traffic sales
Sales (€M)
~40%
158
316 279 271 280 270
236
351 333
399 394 355 394
667 611
670 674 625
0
100
200
300
400
500
600
700
800
2007 2012 2013 2014 2015 2016
ATM
Transport

| 32
ATM is an attractive market due to its sustained growth and stability
04. Detailed vertical description
Note: ATM: Air traffic management. CNS: Communication, Navigation & Surveillance. Source: Markets&Markets, Infinity Reports, Indra.
€3Bn
Global
Large
projects &
equipment
Sustained
growth
Technological
lead
(Europe)
High entry
barriers
Market dynamics Global market size
CNS
Equipment
4%
ATM
Systems
2%
Expected growth
rate 2015 – 2018
(%/year)

| 33
We are one of the most relevant partners at SESAR... and will materialize this through iTEC deployment
04. Detailed vertical description
Phase I Phase II SESAR 2020
Indra as one of the three
main industrial partners
Expecting to start in 2016, Indra
to keep a leading position
iTEC members
potential new entrants
iTEC: The system developed by Indra along with its air navigation
service provider partners (DFS, NATS, ENAIRE, LVNL)
to deploy the SESAR capabilities
Indra as one of the founding members of the
Single European Sky R&D Joint Undertaking
The iTEC Alliance aiming to cover an
important portion of the Single European Space
Note: SESAR: Single European Sky ATM Research. iTEC: interoperability Through European Collaboration. DFS: Deutsche Flugsicherung. NATS: National Air Traffic Services. LVLN: Luchtverkeersleiding Nederland. Source: Indra.
iTEC members: Spain, Germany, Netherlands, UK Potential new entrants: Norway, Poland, Lithuania, Bulgaria and Romania

| 34
We are maintaining growth and leadership in CNS equipment by boosting our flagship products
04. Detailed vertical description
Note: MSSR: Monopulse Secondary Surveillance Radar. PSR: Primary Surveillance Radar. ILS: Instrument Landing System. DVOR: Doppler VHF Omnidirectional Range . DME: Distance Measurement Equipment. Source: Indra.
• Competitive and latest technology product
• Most-sold PSR in 2014 (outside of US)
• Flagship and leader product globally (outside of US)
• >175 installations worldwide
• References in China, India, Australia, Indonesia, Turkey,
Poland, Spain, Latin America...
• DVOR: low cost and highly reliable equipment ready for
the most severe conditions
• DME: highly reliable distance measuring equipment
• Flagship and leader product globally (outside of US)
• Proven, reliable landing system that has guided aircraft
to well over 100 millions safe landings
• In more than 1,200 runways worldwide in the most demanding airports
Surveillance
Navigation
ILS
DVOR
DME
PSR
MSSR
| 35
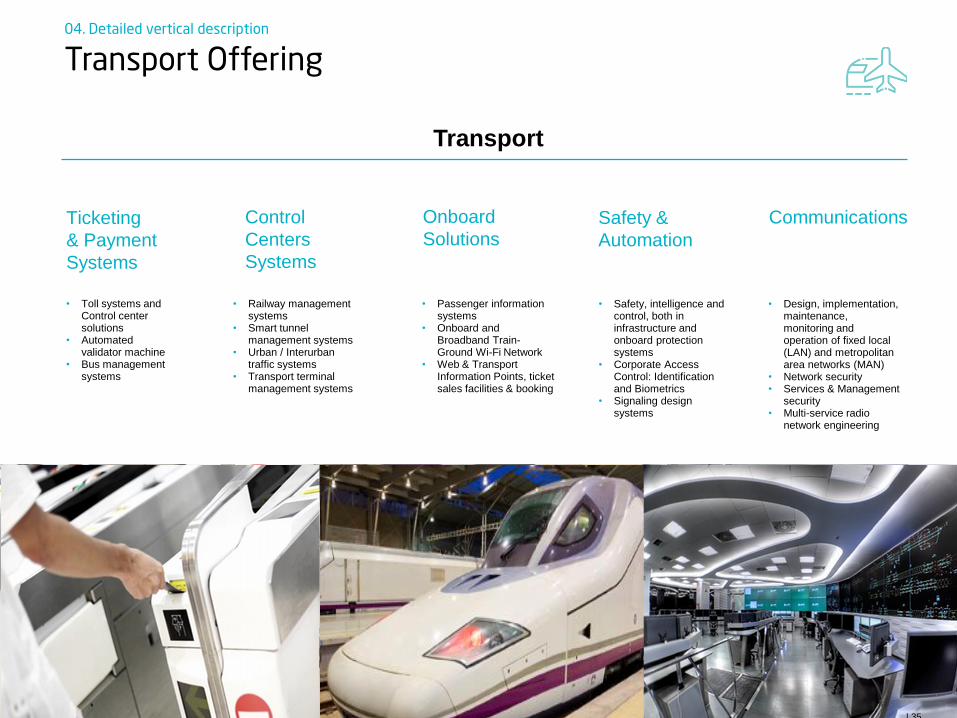
Transport Offering 04. Detailed vertical description
Safety &
Automation
Communications Onboard
Solutions Ticketing
& Payment
Systems
Control
Centers
Systems
• Passenger information systems
• Onboard and Broadband Train-Ground Wi-Fi Network
• Web & Transport Information Points, ticket sales facilities & booking
• Design, implementation, maintenance, monitoring and operation of fixed local (LAN) and metropolitan area networks (MAN)
• Network security • Services & Management
security • Multi-service radio
network engineering
• Safety, intelligence and control, both in infrastructure and onboard protection systems
• Corporate Access Control: Identification and Biometrics
• Signaling design systems
• Railway management systems
• Smart tunnel management systems
• Urban / Interurban traffic systems
• Transport terminal management systems
• Toll systems and Control center solutions
• Automated validator machine
• Bus management systems
Transport
| 35

| 36
296 517 503 516 458 398
215
369 355 298 251
212
276
464 470 475 488
476
354
460 479 453
426
400 1,140
1,811 1,808
1,742 1,621
1,485
0
200
400
600
800
1,000
1,200
1,400
1,600
1,800
2,000
2007 2012 2013 2014 2015 2016
Energy&Industry
Financial Services
Telecom&Media
Public Administrations & Healthcare
IT: Rebalancing our portfolio torwards on proprietary solutions
04. Detailed vertical description
% IT
of Total Sales
Sales (€M)
~ 50% ~ 60% ~ 55%
-5%
/year

| 37
Our vision on IT value creation: core business operations with value-added digital solutions
04. Detailed vertical description
Core business operations Digital
Billing
Telcos
Network
Management
Network
Management
... Billing Utilities
Channel
Management
Operations – Mobility
Media
Channel
Management
Core
Operations
Official
Reporting
Customer Management
Key drivers Key drivers
Efficiency
Reliability
Industrialized delivery
Proof of value
Innovation – trial & error
Agility
Plant
Management
Core business
operations
Industry
& Retail Energy TMT
Financial
Services

| 38
We have a presence in very attractive market segments
04. Detailed vertical description
We will focus our strategy on boosting our portfolio of proprietary products
~60
~120
Vertical
Solutions ~40
IT Outsourcing,
AM & ITO
BPO BPO 6.1%
IT Outsourcing,
AM & ITO 4.4%
Vertical
Solutions 6.8%
Product
development
AM, ITO, & IT
Outsourcing
BPO
Proprietary
products 3rd party
software
Global Market Size
(2015 €Bn)
Expected Market Growth
(% CAGR 2015-18)
| 38

| 39
We have developed a unique portfolio of proprietary products for core business operations
04. Detailed vertical description
By re-balancing our business mix towards our own value-added products,
we will increase both profitability and cross-selling activities
Portfolio of proprietary products... ...balanced across the maturity curve
Energy
& Industry
Media TV
Elections
OSS solutions
TMT
Financial
Services
Public Admin
& Healthcare
Cash flo
w g
enera
tion
Maturity
Elections
Set of products supporting core business operations across the industry's whole value chain
Last generation software co-developed by partnering up with key clients
Leading products implemented by our people all over the globe
Extended life cycle
Product
development
catalyzed
Impact with digital complementation
| 39

| 40
Through Minsait we are complementing our vertical offer with high value-added solutions and catalyze its evolution
04. Detailed vertical description
Strategy
Value proposition
Business model
Business plan
Operational model
Action plan
Implementation of business
solutions
Architecture
Design
Technology implementation
Support
Solutions portfolio
Product design and evolution
Specialized support
Business consulting
Technology Digital solutions
Strategy
Consultants
Management
Consultants Product Designers
& Experts
Technology
Consultants
Solutions
Architects
Experience
Designers
Data
Scientists
Cybersecurity
Experts
| 40

Annex I: Last quarterly results

| 42
REVENUES UP +8% IN REPORTED TERMS
Reported +8%
9M17 Sales Growth 3Q17 Sales Growth
Local Currency +8%
Organic Terms (Ex-Tecnocom)(1) -1%
Reported +19%
Local Currency +20%
Organic Terms (Ex-Tecnocom)(1) +7%
(1) Sales excluding Tecnocom and in local currency
(*) Displayed data includes Tecnocom consolidation since April 18th, 2017
€M €M
1.951
13167
15
2.116
9M16 FX Impact Tecnocom Underlying
growth
9M17*
619
7
85 40
737
3Q16 FX Impact Tecnocom Underlying
growth
3Q17*
Annex I. Last quarterly results Results
9M17

| 43
REVENUES BY VERTICAL
Local Currency / Reported
T&D
IT
Revenues (€M)
Energy & Industry
Financial Services
Telecom & Media
PPAA & Healthcare
Transport & Traffic
Defence & Security
(*) Displayed data includes Tecnocom consolidation since April 18th, 2017
446 403
401 40821% +2% / +2% 19%
-4% / -4%847 811
23% 19%-10% / -10%
161 171
298 355
352
437
293
3411.104
1.305
9M16 9M17*
8%
15%
18%
15%
8%
17%
21%
16%
+5% / +6%
+19% / +19%
+23% / +24%
+16% / +16%
+17% / +18%
Annex I. Last quarterly results Results
9M17

| 44
Annex I. Last quarterly results
(*) Displayed data includes Tecnocom consolidation since April 18th, 2017
REVENUES BY REGION
Spain
America
Europe
AMEA
Local Currency / Reported
Revenues (€M)
255 306
352359
481467
863985
1.951
2.116
9M16 9M17*
44%
13%
18%
25%
47%
14%
17%
22%
+2% / +2%
+20% / +20%
+14% / +14%
-6% / -3%
+8% / +8%
Results
9M17

| 45
Annex I. Last quarterly results
238 304
389446
452
528
1.001
1.074
2.080
2.351
9M16 9M17*
48%
11%
19%
22%
46%
13%
19%
22%
+15% / +15%
+28% / +27%
+7% / +7%
+14% / +17%
+13% / +13%
ORDER INTAKE UP +13% IN REPORTED TERMS
Local Currency / Reported Local Currency / Reported
Order Intake by Region (€M) Order Intake by Vertical (€M)
Energy & Industry
Financial Services
Telecom & Media
PPAA & Healthcare
Defence & Security
T&D
Transport & Traffic
(*) Displayed data includes Tecnocom consolidation since April 18th, 2017
444 386
45435922%
-21% / -21% 15%
-17% / -17%898
745
21% 16%-13% / -13%
137 173
308
493
401
514336
427
9M16 9M17*
19%
16%
21%
22%
7%
21%
22%
18%
+25% / +26%
+60% / +60%
+27% / +28%
+26% / +27%
+35% / +36%
1.183
1.607
Results
9M17

| 46
Annex I. Last quarterly results
BRAZIL
Revenues
EBIT(*)
EBIT Margin(*)
6 out of the 7 onerous projects already closed/finished
(local currency)
Order Intake
(*) EBIT includes contingencies
Results
9M17

| 47
Annex I. Last quarterly results
34
46
EBIT 3Q16 EBIT 3Q17*
5,5%
6,3%
35,5%
+0,8pp
104124
EBIT 9M16 EBIT 9M17*
5,3%
5,8%
18,7%
+0,5pp
EBIT MARGIN EVOLUTION
9M EBIT margin by Divisions 9M EBIT Margin Evolution
IT T&D
EBIT Margin Evolution Ex-Tecnocom
(*) Displayed data includes Tecnocom consolidation since April 18th, 2017
3Q EBIT Margin Evolution
12,0%13,0%
9M16 9M17*
0,3%1,4%
9M16 9M17*
46
119
EBIT 3Q17* EBIT 9M17*
7,0%
6,1%
Results
9M17

| 48
Annex I. Last quarterly results
115,4
153,8
9M16 9M17*
33%
-79 -85
-23
137
47
2
-5
140
-5
-26
75
1Q15 2Q15 3Q15 4Q15 1Q16 2Q16 3Q16 4Q16 1Q17 2Q17 3Q17
STRONG OPERATING FCF GENERATION DUE TO OPERATING IMPROVEMENT AND 3Q17 NWC
Quarterly FCF (€M)
Accumulated FCF LTM (€M)
9M15: €-187M 9M16: €44M
OPERATING FCF BEFORE WC (€M)
9M17: €44M
(*) Displayed data includes Tecnocom consolidation since April 18th, 2017
-114-136
-50
76
163 181 184132
104
184
1H15 9M15 FY15 1Q16 1H16 9M16 FY16 1Q17 1H17* 9M17*
Results
9M17

| 49
Annex I. Last quarterly results
523
44
185 16
680
Net Debt FY16 9M17* Free Cash Flow Tecnocom Payment Net Debt Tecnocom &
Others
Net Debt 9M17*
NET DEBT BRIDGE
Net Debt Bridge – Cash Flow (€M)
Net Debt Bridge – Tecnocom’s split(€M)
(*) Displayed data includes Tecnocom consolidation since April 18th, 2017
523
154 1631
2427 11
201
680
Net Debt FY16 Operating Cash
Flow
Net Working
Capital
Other Operating
Changes
Capex Taxes Net interest &
Subsidies
Financial
Investments & Non-CF items &
Others
Net Debt 9M17*
FCF = €44M
Results
9M17

| 50
Annex I. Last quarterly results
NET WORKING CAPITAL EVOLUTION
Net Working Capital (DoS)
2 945 -81-1 10
Accounts Receivable Accounts Payable Inventory
(*) Displayed data includes Tecnocom consolidation since April 18th, 2017
77 74
-82 -80
9 11
5 4
FY16 9M17*
+1
-3
+2
76 74
-76 -80
10 11
10 4
1H17* 9M17*
-4
-2
+1
Results
9M17

| 51
Annex I. Last quarterly results
5.9x6.6x
5.4x4.7x
3.1x 3.1x2.3x 2.3x 2.9x 2.5x
2Q15 3Q15 4Q15 1Q16 2Q16 3Q16 4Q16 1Q17 2Q17 3Q17
825 837
700659 659 666
523
532
745
680
NET DEBT EVOLUTION
Net Debt
Net Debt (€M)
Net Debt/EBITDA LTM (Times)(2)
ND/ EBITDA LTM(2)
(1) Non-recourse factoring (2) 2Q17 and 3Q17 ratio includes LTM EBITDA Indra & LTM EBITDA Tecnocom (part of this data is considered as if Tecnocom would have been managed by the former Managament) (3) 2Q17 and 3Q17 ratio includes Indra Net Debt and LTM EBITDA Indra, both excluding Tecnocom effect
(Factoring)(1) (187) (162)
(173) (176)
(187)
(187)
(187)
(187)
(187)
2,4x
Indra Stand-alone
ND/ EBITDA LTM(3)
Indra Stand-alone
Net Debt
554
(187)
460
1,9x
Results
9M17

| 52
Annex I. Last quarterly results Results
9M17
638
18
342
135
823
Cash 2017 2018 2019 Beyond
2020
171
439
135
823
Credit Facilities 2017 2018 2019 Beyond 2020
1.568
Available Credit Facilities
DEBT STRUCTURE 9M17* 2016
Total % of total (€M)
(€M)
Gross Debt Maturity Profile
Total % of total
(*) Displayed data includes Tecnocom consolidation since April 18th, 2017
Net Debt
Available Facilities
(€M)

Annex II: Voluntary tender offer
for the acquisition of
100% of the share
capital of TECNOCOM

| 54
Deal terms review Annex II. VTO of Tecnocom
Key transaction terms
• Announcement of the VTO: 29/11/2016
• Transaction settlement expected on Q2 2017
• Offer price per share: €4.253 paid with mixed consideration: cash (60%) and Indra shares (40%)
• €2.55 in cash and 0.1727 Indra shares per each Tecnocom share3
• Offer price represents:
• 12% premium vs. previous closing price (€3.81 as of 28 November 2016)
• 28% premium vs. the 3-month volume weighted average price (€3.324)
• Transaction subject to the following conditions:
• Approval from the relevant anti-trust authorities
• Minimum VTO acceptance rate of 50.01% of Tecnocom share capital (excluding Irrevocable
Commitments), and 70.01% of total share capital
• Indra’s General Shareholders Meeting approval of the capital increase related to the transaction
Price considerations
Condition
precedents
Transaction
structure • Voluntary Tender Offer (“VTO”)
Timetable
• Indra has subscribed Irrevocable Commitments with Tecnocom shareholders representing 52.7% of the share
capital, by which they commit to irrevocably tender their shares in the context of the VTO
Irrevocable
Commitments
Valuation
• The VTO values the 100% share capital1 of Tecnocom in €305m (“Equity Value”) and the entire company in
€336m (“Firm Value”)2
• Implicit transaction multiple: 14.3x Firm Value / EBIT’ 17E (pre synergies)2
• Implicit transaction multiple: 5.2x Firm Value / EBIT’ 17E (post synergies)2
• Double digit EPS accretion since year 1 (ex. restructuring costs)
1 Excluding treasury shares as of 2 September 2016 (3.2m shares) 2 Firm Value calculated as Equity value plus net debt as of 9M 16 (€27.2m) plus minorities as of H116 (€3.7m); EBIT pre-synergies based on the estimates of brokers included in Bloomberg´s consensus
(Ahorro Corporación and JB Capital Markets) for that year (€23.5m); EBIT post-synergies calculated as broker consensus EBIT plus €41m of estimated fully-phased synergies 3 Exchange ratio calculated as the mid-point of (i) the average of closing prices and (ii) the volume weighted average price of the five trading days prior to November 28th
4 Bloomberg from 29 august 2016 until 28 November 2016

| 55
Overview of Tecnocom Annex II. VTO of Tecnocom
Banking & Insurance
51% Industry 18%
TME 22%
Public Adm. 9%
Business overview
Revenue breakdown 9M 2016
Spain 81%
International
19%
1 Information and Communications Technology; 2 Based on Tecnocoms public result presentations / Recurring EBITDA excludes provisions; 3 Based on Tecnocom’s annual accounts (calculated as Operating profit plus
depreciation & amortisation); 4 Defined as EBT plus D&A, impairments, financial expenses, provisions minus change in working capital and taxes; 5 Net debt / LTM recurring EBITDA
Financial overview
€m 2014 2015 9M 2015 9M 2016
Revenues 372 406 291 300
% growth 9.2% +3.1%
Recurring EBITDA2 17 22 17 21
% margin 4.5% 5.4% 5.9% 6.9%
EBITDA3 15 22 17 20
% margin 4.1% 5.4% 5.7% 6.5%
EBIT 7 12 9 12
% margin 1.8% 2.8% 3.1% 3.9%
Consolidated net income (12) 4 1 5
% margin - 0.9% 0.4% 1.8%
Operating cash flow4 19 27 n.a. n.a.
Net debt 39 27 59 27
Net debt / recurring EBITDA 2.6x 1.2x 3.0x5 1.1x5
General
overview
ICT1 consulting firm with presence in Iberia and LatAm
Direct presence in +9 countries
+6,500 employees
Consolidated positioning both in niche areas such as
Payment Systems and traditional IT levers such as
Outsourcing
Consolidated
position in
Payment
Systems
c.90% of the Spanish financial institutions as
customers
Strong position in LatAm
Relevant
player in the
Spanish IT
sector
82% revenues coming from recurring services
Blue chip,
diversified
and loyal
client base
+1,000 clients with top 10 < 40% of revenues
+16 years of presence in key clients
22 IBEX-35 companies as clients
60% of revenues from clients with investment
grade
By geography By vertical
Ladislao Azcona
19%
Luis Solera 6%
Leonardo Sánchez
5%
Other Board members
2% Abanca
20%
KPN 11%
33%
Trasury stock 4%
Shareholding base
Free Float

| 56
Acquisition rationale Annex II. VTO of Tecnocom
1
Substantial improvement of Indra’s positioning in the Spanish IT market, providing the
Group with increased operational leverage
Fully-aligned with Indra’s strategy to reinforce its proprietary and digital-focused
offering (payment systems)
Highly complementary blue chip client base
2
Significant value creation potential through the implementation of cost synergies
Meaningful revenue synergies based on cross-selling and up-selling to both
companies' respective customer bases
Further potential cost savings derived from higher production efficiencies
3 Similar cultures leading to an easier integration process
Reinforcement of existing talent base in key growth areas
Industrial
rationale
Significant
synergetic
potential
Other
advantages

| 57
Industrial rationale – Substantial increase of Indra’s operating leverage and positioning in IT
Annex II. VTO of Tecnocom 1
30%
70%
34%
66%
Consolidation of IT
market position in
Spain and increased
critical mass
Scalability of the
delivery model Larger scalability and profitability enhancements derived from the evolution of Indra’s delivery model
Significant boost to
Financial Services
segment
Consolidation of Indra´s position the Financial services
segment
Value-added sector with high growth prospects fuelled
by the development of Fintech and the ongoing sector
transformation
Financial Services evolution over total IT revenues pre &
post acquisition (2015)
Increases exposure to
private sector in Spain
Improvement of Indra’s national IT private-public mix,
increasing private sector exposure to c.78% post
transaction
Private IT revenues in Spain3 pre & post acquisition
(2015)
Spanish IT ranking by 2015 sales2 (€m)
€1,621 m
1 FY 2015; 2 Based on Computing Consulting report, Registro Mercantil and Company information; 3Assumes all public revenues of Tecnocom are generated in Spain
€2,028m
€488m €685m
819
823819 810
398 317
317
1,136
Ithaca
+T
rium
ph
Acc
entu
re
Ithaca
Ieci
sa
Eve
ris
Trium
ph
+39%
c.75% c.78%
IT revenues in Spain would increase from €819m1 to
€1,136m1 (+39%)
Significant improvement of operating leverage on
existing fixed costs
| 58
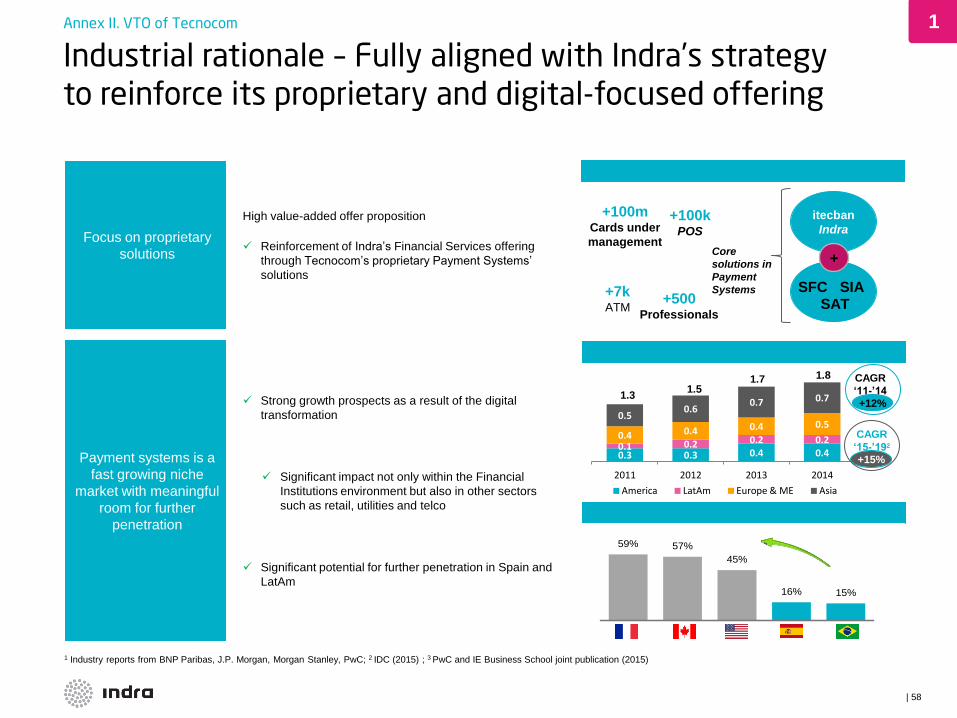
Industrial rationale – Fully aligned with Indra’s strategy to reinforce its proprietary and digital-focused offering
Annex II. VTO of Tecnocom 1
itecban
Indra High value-added offer proposition
Reinforcement of Indra’s Financial Services offering
through Tecnocom’s proprietary Payment Systems’
solutions
Focus on proprietary
solutions
Payment systems is a
fast growing niche
market with meaningful
room for further
penetration
Key data and main own solutions
+100m Cards under
management
+7k ATM
+500 Professionals
+100k POS
Strong growth prospects as a result of the digital
transformation
Significant impact not only within the Financial
Institutions environment but also in other sectors
such as retail, utilities and telco
Significant potential for further penetration in Spain and
LatAm
Payment system industry revenues1 ($ trillion)
1 Industry reports from BNP Paribas, J.P. Morgan, Morgan Stanley, PwC; 2 IDC (2015) ; 3 PwC and IE Business School joint publication (2015)
0.3 0.3 0.4 0.4 0.1 0.2 0.2 0.2 0.4 0.4 0.4 0.5 0.5
0.6 0.7 0.7
2011 2012 2013 2014
America LatAm Europe & ME Asia
1.3 1.5
1.7 1.8
SIA SAT
SFC
+ Core
solutions in
Payment
Systems
+12%
CAGR
‘11-’14
+15%
CAGR
‘15-’192
Non-cash transactions penetration by country (2013)3
59% 57%
45%
16% 15%
| 59
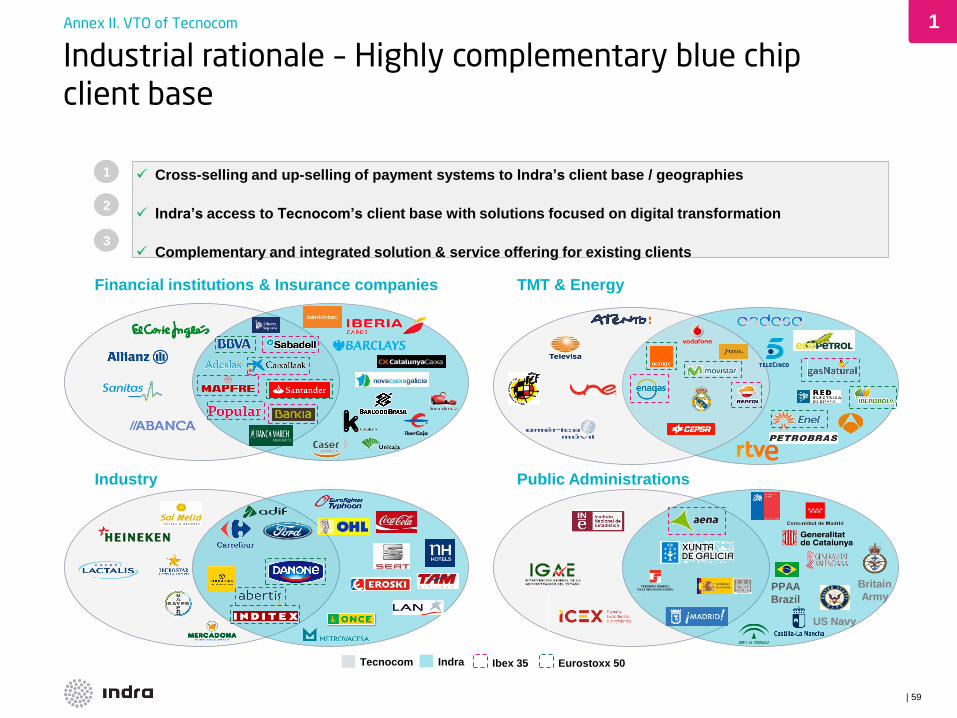
Industrial rationale – Highly complementary blue chip client base
Annex II. VTO of Tecnocom 1
Financial institutions & Insurance companies TMT & Energy
Industry Public Administrations
PPAA
Brazil
US Navy
Britain
Army
Tecnocom Indra Ibex 35 Eurostoxx 50
Cross-selling and up-selling of payment systems to Indra’s client base / geographies
Indra’s access to Tecnocom’s client base with solutions focused on digital transformation
Complementary and integrated solution & service offering for existing clients
1
2
3

| 60
Significant synergy potential – Strong value creation for Indra
Annex II. VTO of Tecnocom 2
Revenue
synergies
• Better competitive positioning based on an overlapping geographical footprint
and complementary client base
• Potential revenue synergies from cross-selling and up-selling (specially in
Financial Services, Industry and Utilities)
Operating
synergies
• Potential SG&A expenses optimization through commercial and overheads
costs
• Further potential costs savings derived from higher production efficiencies and
enhancement of operating model (combination on capacity utilization, average
pyramid, offshore leverage, etc)
• Integrate real state footprint (facilities rationalization)
• Other potential synergies including: optimization of R&D efforts and capex
thanks to enhanced scalability, etc.
€10.5m
€30.5m
Total Quantified annual fully-phased synergies of c.€41m1 achieved by year 2

| 61
Overview of the combined entity (LTM Sep-16 pre-synergies) Annex II. VTO of Tecnocom
1 Last twelve months figures as of September 2016 based on public information 2 Tecnocom revenues in the Industry segment 3 Tecnocom revenues in the TMT & Energy segment
Revenue breakdown by
vertical (Sept. 2016 – LTM)1
Revenue breakdown by
region (Sept. 2016 – LTM)1
22%
17%
15% 8%
15%
23%
49%
11%
23%
17% 19%
21%
14%
25%
20%
Defence & Security
Financial Services
Public Admin. & Healthcare TMT
+ =
44% 56%
0 0 0 0
49%
51%
Spain
International + = 80%
20% 0 0 0 0
25%
2
3
Sept. 16 - LTM (€mm)1 Indra Tecnocom Indra + Tecnocom (pre-syn.) Delta (%)
Revenues 2,732 415 3,147 +15.2%
Recurring EBITDA 218 25 243 +11.5%
% margin 8.0% 6.1% 7.7%
Recurring EBIT 151 14 165 +9.3%
% margin 5.5% 3.4% 5.2%

Investor Relations [email protected]
Avda. de Bruselas 35
28108 Alcobendas,
Madrid Spain
T +34 91 480 50 00
F +34 91 480 50 80
www.indracompany.com