Glenmark Pharmaceuticals (GLEPHA)€¦ · · 2015-02-20ICICI Securities Ltd | Retail Equity...
14
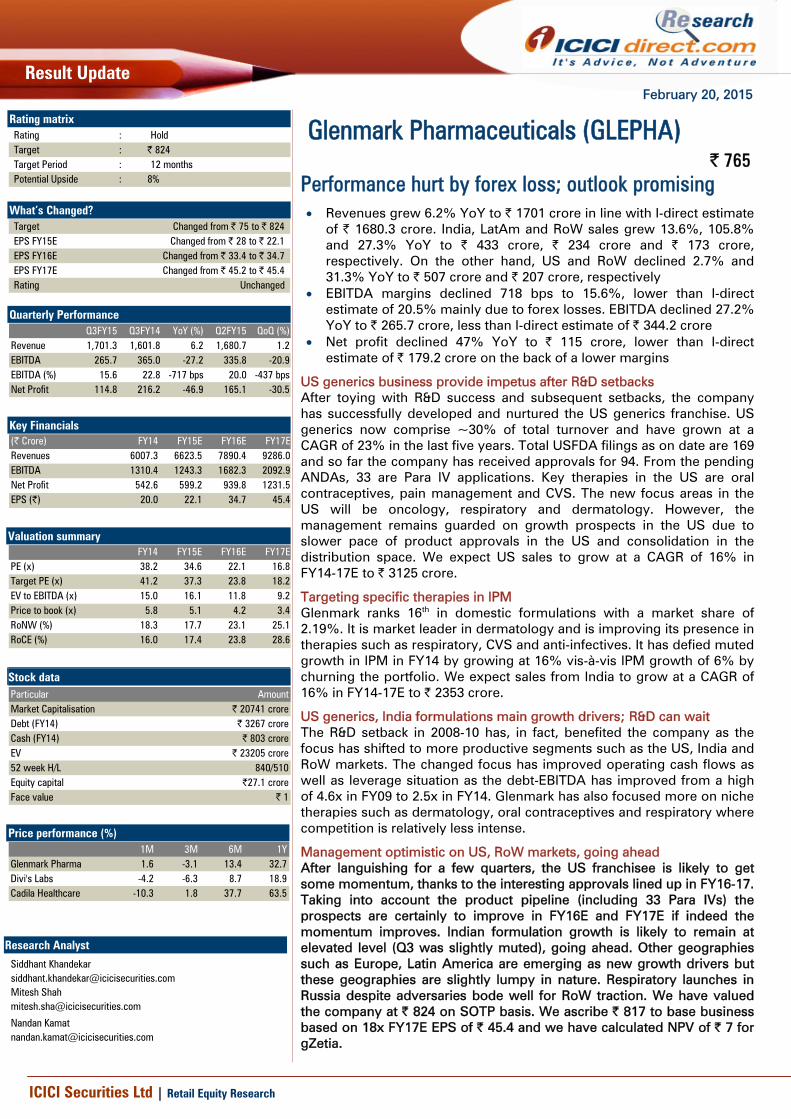
February 20, 2015 ICICI Securities Ltd | Retail Equity Research Result Update Performance hurt by forex loss; outlook promising • Revenues grew 6.2% YoY to | 1701 crore in line with I-direct estimate of | 1680.3 crore. India, LatAm and RoW sales grew 13.6%, 105.8% and 27.3% YoY to | 433 crore, | 234 crore and | 173 crore, respectively. On the other hand, US and RoW declined 2.7% and 31.3% YoY to | 507 crore and | 207 crore, respectively • EBITDA margins declined 718 bps to 15.6%, lower than I-direct estimate of 20.5% mainly due to forex losses. EBITDA declined 27.2% YoY to | 265.7 crore, less than I-direct estimate of | 344.2 crore • Net profit declined 47% YoY to | 115 crore, lower than I-direct estimate of | 179.2 crore on the back of a lower margins US generics business provide impetus after R&D setbacks After toying with R&D success and subsequent setbacks, the company has successfully developed and nurtured the US generics franchise. US generics now comprise ~30% of total turnover and have grown at a CAGR of 23% in the last five years. Total USFDA filings as on date are 169 and so far the company has received approvals for 94. From the pending ANDAs, 33 are Para IV applications. Key therapies in the US are oral contraceptives, pain management and CVS. The new focus areas in the US will be oncology, respiratory and dermatology. However, the management remains guarded on growth prospects in the US due to slower pace of product approvals in the US and consolidation in the distribution space. We expect US sales to grow at a CAGR of 16% in FY14-17E to | 3125 crore. Targeting specific therapies in IPM Glenmark ranks 16 th in domestic formulations with a market share of 2.19%. It is market leader in dermatology and is improving its presence in therapies such as respiratory, CVS and anti-infectives. It has defied muted growth in IPM in FY14 by growing at 16% vis-à-vis IPM growth of 6% by churning the portfolio. We expect sales from India to grow at a CAGR of 16% in FY14-17E to | 2353 crore. US generics, India formulations main growth drivers; R&D can wait The R&D setback in 2008-10 has, in fact, benefited the company as the focus has shifted to more productive segments such as the US, India and RoW markets. The changed focus has improved operating cash flows as well as leverage situation as the debt-EBITDA has improved from a high of 4.6x in FY09 to 2.5x in FY14. Glenmark has also focused more on niche therapies such as dermatology, oral contraceptives and respiratory where competition is relatively less intense. Management optimistic on US, RoW markets, going ahead After languishing for a few quarters, the US franchisee is likely to get some momentum, thanks to the interesting approvals lined up in FY16-17. Taking into account the product pipeline (including 33 Para IVs) the prospects are certainly to improve in FY16E and FY17E if indeed the momentum improves. Indian formulation growth is likely to remain at elevated level (Q3 was slightly muted), going ahead. Other geographies such as Europe, Latin America are emerging as new growth drivers but these geographies are slightly lumpy in nature. Respiratory launches in Russia despite adversaries bode well for RoW traction. We have valued the company at | 824 on SOTP basis. We ascribe | 817 to base business based on 18x FY17E EPS of | 45.4 and we have calculated NPV of | 7 for gZetia. Rating matrix Rating : Hold Target : | 824 Target Period : 12 months Potential Upside : 8% What’s Changed? Target Changed from | 75 to | 824 EPS FY15E Changed from | 28 to | 22.1 EPS FY16E Changed from | 33.4 to | 34.7 EPS FY17E Changed from | 45.2 to | 45.4 Rating Unchanged Quarterly Performance Q3FY15 Q3FY14 YoY (%) Q2FY15 QoQ (%) Revenue 1,701.3 1,601.8 6.2 1,680.7 1.2 EBITDA 265.7 365.0 -27.2 335.8 -20.9 EBITDA (%) 15.6 22.8 -717 bps 20.0 -437 bps Net Profit 114.8 216.2 -46.9 165.1 -30.5 Key Financials (| Crore) FY14 FY15E FY16E FY17E Revenues 6007.3 6623.5 7890.4 9286.0 EBITDA 1310.4 1243.3 1682.3 2092.9 Net Profit 542.6 599.2 939.8 1231.5 EPS (|) 20.0 22.1 34.7 45.4 Valuation summary FY14 FY15E FY16E FY17E PE (x) 38.2 34.6 22.1 16.8 Target PE (x) 41.2 37.3 23.8 18.2 EV to EBITDA (x) 15.0 16.1 11.8 9.2 Price to book (x) 5.8 5.1 4.2 3.4 RoNW (%) 18.3 17.7 23.1 25.1 RoCE (%) 16.0 17.4 23.8 28.6 Stock data Particular Market Capitalisation Debt (FY14) Cash (FY14) EV 52 week H/L 840/510 Equity capital |27.1 crore Face value | 1 Amount | 20741 crore | 3267 crore | 803 crore | 23205 crore Price performance (%) 1M 3M 6M 1Y Glenmark Pharma 1.6 -3.1 13.4 32.7 Divi's Labs -4.2 -6.3 8.7 18.9 Cadila Healthcare -10.3 1.8 37.7 63.5 Glenmark Pharmaceuticals (GLEPHA) | 765 Research Analyst Siddhant Khandekar [email protected] Mitesh Shah [email protected] Nandan Kamat [email protected]
Transcript of Glenmark Pharmaceuticals (GLEPHA)€¦ · · 2015-02-20ICICI Securities Ltd | Retail Equity...
February 20, 2015
ICICI Securities Ltd | Retail Equity Research
Result Update
Performance hurt by forex loss; outlook promising • Revenues grew 6.2% YoY to | 1701 crore in line with I-direct estimate
of | 1680.3 crore. India, LatAm and RoW sales grew 13.6%, 105.8% and 27.3% YoY to | 433 crore, | 234 crore and | 173 crore, respectively. On the other hand, US and RoW declined 2.7% and 31.3% YoY to | 507 crore and | 207 crore, respectively
• EBITDA margins declined 718 bps to 15.6%, lower than I-direct estimate of 20.5% mainly due to forex losses. EBITDA declined 27.2% YoY to | 265.7 crore, less than I-direct estimate of | 344.2 crore
• Net profit declined 47% YoY to | 115 crore, lower than I-direct estimate of | 179.2 crore on the back of a lower margins
US generics business provide impetus after R&D setbacks After toying with R&D success and subsequent setbacks, the company has successfully developed and nurtured the US generics franchise. US generics now comprise ~30% of total turnover and have grown at a CAGR of 23% in the last five years. Total USFDA filings as on date are 169 and so far the company has received approvals for 94. From the pending ANDAs, 33 are Para IV applications. Key therapies in the US are oral contraceptives, pain management and CVS. The new focus areas in the US will be oncology, respiratory and dermatology. However, the management remains guarded on growth prospects in the US due to slower pace of product approvals in the US and consolidation in the distribution space. We expect US sales to grow at a CAGR of 16% in FY14-17E to | 3125 crore.
Targeting specific therapies in IPM Glenmark ranks 16th in domestic formulations with a market share of 2.19%. It is market leader in dermatology and is improving its presence in therapies such as respiratory, CVS and anti-infectives. It has defied muted growth in IPM in FY14 by growing at 16% vis-à-vis IPM growth of 6% by churning the portfolio. We expect sales from India to grow at a CAGR of 16% in FY14-17E to | 2353 crore.
US generics, India formulations main growth drivers; R&D can wait The R&D setback in 2008-10 has, in fact, benefited the company as the focus has shifted to more productive segments such as the US, India and RoW markets. The changed focus has improved operating cash flows as well as leverage situation as the debt-EBITDA has improved from a high of 4.6x in FY09 to 2.5x in FY14. Glenmark has also focused more on niche therapies such as dermatology, oral contraceptives and respiratory where competition is relatively less intense.
Management optimistic on US, RoW markets, going ahead After languishing for a few quarters, the US franchisee is likely to get some momentum, thanks to the interesting approvals lined up in FY16-17. Taking into account the product pipeline (including 33 Para IVs) the prospects are certainly to improve in FY16E and FY17E if indeed the momentum improves. Indian formulation growth is likely to remain at elevated level (Q3 was slightly muted), going ahead. Other geographies such as Europe, Latin America are emerging as new growth drivers but these geographies are slightly lumpy in nature. Respiratory launches in Russia despite adversaries bode well for RoW traction. We have valued the company at | 824 on SOTP basis. We ascribe | 817 to base business based on 18x FY17E EPS of | 45.4 and we have calculated NPV of | 7 for gZetia.
Rating matrix Rating : HoldTarget : | 824Target Period : 12 monthsPotential Upside : 8%
What’s Changed? Target Changed from | 75 to | 824EPS FY15E Changed from | 28 to | 22.1EPS FY16E Changed from | 33.4 to | 34.7EPS FY17E Changed from | 45.2 to | 45.4Rating Unchanged
Quarterly Performance
Q3FY15 Q3FY14 YoY (%) Q2FY15 QoQ (%)Revenue 1,701.3 1,601.8 6.2 1,680.7 1.2EBITDA 265.7 365.0 -27.2 335.8 -20.9EBITDA (%) 15.6 22.8 -717 bps 20.0 -437 bpsNet Profit 114.8 216.2 -46.9 165.1 -30.5
Key Financials (| Crore) FY14 FY15E FY16E FY17ERevenues 6007.3 6623.5 7890.4 9286.0EBITDA 1310.4 1243.3 1682.3 2092.9Net Profit 542.6 599.2 939.8 1231.5EPS (|) 20.0 22.1 34.7 45.4
Valuation summary
FY14 FY15E FY16E FY17EPE (x) 38.2 34.6 22.1 16.8Target PE (x) 41.2 37.3 23.8 18.2EV to EBITDA (x) 15.0 16.1 11.8 9.2Price to book (x) 5.8 5.1 4.2 3.4RoNW (%) 18.3 17.7 23.1 25.1RoCE (%) 16.0 17.4 23.8 28.6
Stock data ParticularMarket CapitalisationDebt (FY14)Cash (FY14)EV 52 week H/L 840/510Equity capital |27.1 croreFace value | 1
Amount| 20741 crore
| 3267 crore| 803 crore
| 23205 crore
Price performance (%)
1M 3M 6M 1YGlenmark Pharma 1.6 -3.1 13.4 32.7Divi's Labs -4.2 -6.3 8.7 18.9Cadila Healthcare -10.3 1.8 37.7 63.5
Glenmark Pharmaceuticals (GLEPHA) | 765
Research Analyst
Siddhant Khandekar [email protected] Mitesh Shah [email protected]
Nandan Kamat [email protected]

ICICI Securities Ltd | Retail Equity Research Page 2
Variance analysis
(| crore) Q3FY15 Q3FY15E Q3FY14 Q2FY15 YoY (%) QoQ (%) CommentsRevenue 1,701.3 1,680.3 1,601.8 1,680.7 6.2 1.2 Slow growth was mainly due to muted growth in the US (-2.7%) on account of lack
of new product approvals and 31% de-growth in RoW due to currency related issuesin Russia.
Raw Material Expenses 556.0 534.8 537.3 548.9 3.5 1.3Employee Expenses 316.5 341.8 273.5 355.3 15.7 -10.9Other expenditure 563.1 459.6 426.0 440.7 32.2 27.8
Total Expenditure 1,435.6 1,336.2 1,236.8 1,344.9 16.1 6.7 Includes | 106 crore of forex loss.EBITDA 265.7 344.2 365.0 335.8 -27.2 -20.9EBITDA (%) 15.6 20.5 22.8 20.0 -717 bps -437 bps contraction in margin mainly due to higher forex loss.Interest 51.3 51.5 47.3 51.6 8.6 -0.6
Depreciation 65.5 65.9 61.1 65.0 7.1 0.7Other income 2.1 3.0 5.1 1.0 -58.2 119.1EO expenses 0.0 0.0 0.0 0.0 0.0 0.0PBT 151.0 229.8 261.7 220.2 -42.3 -31.4
Tax 36.3 50.6 47.4 55.2 -23.4 -34.3PAT 114.8 179.2 214.3 165.0 -46.5 -30.5MI 0.0 0.1 -1.9 -0.1 NA NANet Profit 114.8 179.2 216.2 165.1 -46.9 -30.5 Decline in net profit was synch with operational performance and higher taxation.
Key MetricsUSA 507.2 516.1 521.4 507.6 -2.7 -0.1 YoY de-growth on the back of lack of new product launches and channel
consolidation.India 433.1 476.5 381.2 478.2 13.6 -9.4Europe 173.0 135.8 135.8 130.6 27.3 32.5 Growth was mainly driven by new product launches including gSeretide.
Latin America 234.4 199.4 113.9 230.9 105.8 1.5Despite currency volatility, 200%+growth in Mexico and Venezuela drove the growth in Latin America
RoW markets 207.1 180.6 301.0 174.0 -31.2 19.0 Subdued growth was mainly due to adverse currency movement in Russia
API 146.5 162.7 147.9 159.5 -1.0 -8.2Out-licensing income 0.0 0.0 0.0 0.0 0.0 0.0
Source: Company, ICICIdirect.com Research Change in estimates
(| Crore) Old New % Change Old New % Change CommentsRevenues 6,822.0 6,623.5 -2.9 7,940.2 7,890.4 -0.6EBITDA 1,465.6 1,243.3 -15.2 1,688.7 1,682.3 -0.4 Reduction in FY15 EBITDA estimates after incorporating margin fall in H2FY15 due to
forex losses especially in Russia.EBITDA Margin (%) 21.5 18.8 -271 bps 21.3 21.3 5 bpsNet Profit 759.4 599.2 -21.1 907.1 939.8 3.6 Reduction in estimates in synch with reduction in EBITDA in FY15EPS (|) 28.0 22.1 -21.1 33.4 34.7 3.7
FY15E FY16E
Source: Company, ICICIdirect.com Research Assumptions
Comments(| crore) FY13 FY14 FY15E FY16E FY15E FY16EUSA 1,688.7 2,027.1 2,019.3 2,373.8 2,043.5 2,402.6India 1,309.6 1,510.5 1,760.3 2,077.2 1,777.1 2,097.0Europe 372.4 506.1 584.8 792.1 639.6 767.5Latin America 346.8 404.6 795.4 1,002.0 634.7 825.1 Change in FY16 estimates to factor abnormal growth in Venezuela, Mexico and
growth recovery in Brazil on the back of new product launches.
RoW markets 812.2 986.0 798.0 922.7 1,045.9 1,098.2 Reduction in estimates to factor in currency volatility in Russia API 397.6 529.2 626.6 720.6 650.2 747.8Out-licensing income 49.3 36.5 29.9 0.0 29.9 0.0
Current Earlier
Source: Company, ICICIdirect.com Research

ICICI Securities Ltd | Retail Equity Research Page 3
Company Analysis
Incorporated in 1977 Glenmark was never a mass-market player with a clear focus on niche areas such as dermatology, respiratory and cardiology. The company was one of the few Indian players (like DRL) to identify the importance of dedicated R&D efforts in the nineties. Post its maiden IPO in 2000, the company started ramping up API business via small acquisitions. In 2005 it struck its first out-licensing R&D seal with US based Forest Laboratories for COPD/asthma molecule with Oglemilast. Similar R&D deals were struck with Innovator companies such as Eli Lily and Merck KGaA (Germany). It received a substantial amount in the nature of upfront – milestone payments. However, it received a setback in most of these deals, one after another during 2007-09, as clients were unsatisfied with the progress or not interested to pursue the same any further due to changed priorities or budgetary constraints. This had hit the company hard during that period as, unlike other Indian players which hived off the risky R&D ventures into separate companies to protect core balance-sheet, Glenmark hived off the generic business. Its balance sheet got stretched with huge debts with the D/E and debt/EBITDA ratio swelled to 2x and 4x, respectively. However, post the R&D debacle the company refocused on the generics business especially in the US and Indian formulations putting R&D on the backburner. The changed has worked going by the performance in the last two-three years as the strong traction in the US, backed by forays into niche areas such as oral contraceptives and dermatology, robust growth in Indian formulations and strong tractions from ROW and Latam markets have improved the balance sheet and operating cash-flows significantly. The R&D deals are still active but the focus on the innovative R&D and generic R&D is almost equal. The company has almost fully recovered the amount spent on innovative R&D which is almost US$200 million in the last nine years. With other geographies also chipping in, the growth, going ahead is likely to be broad based with India and the US, the largest geographies growing at a decent pace and emerging segments such as RoW markets and Latin America showing greater traction. The company also remains committed to API exports. We expect sales to grow at a CAGR of 16% to | 9286 crore between FY14 and FY17E. Exhibit 1: Revenues to grow at CAGR of 16% in FY14-17E
20932485
2954
4022 4022
60076624
7890
9286
0
2000
4000
6000
8000
10000
FY09 FY10 FY11 FY12 FY13 FY14 FY15E FY16E FY17E
(| c
rore
)
Revenues
Source: Company, ICICIdirect.com Research
Glenmark has reclassified it operations into six categories - India, US, Europe, Latin America, ROW markets and APIs. Earlier the classification was on the basis of - 1) specialty businesses and 2) generics businesses.

ICICI Securities Ltd | Retail Equity Research Page 4
India (25% of overall sales) – In India it operates through over 20 divisions with focus on dermatology, cardiology, respiratory and anti-infectives among all. The company markets over 350 products in India. As AIOCD MAT 2014, Glenmark ranks sixteenth in IPM with a market share of 2.19%. Among therapies, it ranks second in dermatology, sixth in respiratory and tenth in cardiology. The current MR strength of the company is ~3200 and the MR productivity is | 47.2 lakh per MR. The acute: chronic ratio for Glenmark is 63: 37. Exhibit 2: India business major growth driver…
614.2752.9 844.7
1002.1
1309.61510.5
1779.3
2046.2
2353.2
0
500
1000
1500
2000
2500
FY09 FY10 FY11 FY12 FY13 FY14 FY15E FY16E FY17E
(| c
rore
)
India
Source: Company, ICICIdirect.com Research
The US (34% of overall sales) – The US generic business is being operated through its subsidiary Glenmark Generics Limited. It focuses on developing, manufacturing and the distribution of generics through wholesalers, retailers and pharmacy chains. Glenmark’s US strategy is to focus on less crowded therapies such as oral contraceptives, dermatology, oncology, etc. Typically, the company focuses on small ticket but niche opportunities. Till date, the company has filed 169 ANDAs with the USFDA. Of these, it has received approval for 94 ANDAs. It is currently awaiting USFDA approval for 75 ANDAs, of which 33 are Para IV applications. Exhibit 3: … so is the US
733.8 723.0 835.2
1213.7
1688.7
2027.12301.0
2681.4
3125.2
0
500
1000
1500
2000
2500
3000
3500
FY09 FY10 FY11 FY12 FY13 FY14 FY15E FY16E FY17E
(| c
rore
)
USA
Source: Company, ICICIdirect.com Research
The drug discovery business is focusing on areas of inflammation (asthma/COPD, rheumatoid arthritis, etc.), metabolic disorders (diabetes, obesity, etc.) and pain (neuropathic pain and inflammatory pain).

ICICI Securities Ltd | Retail Equity Research Page 5
Glenmark has a pipeline of six molecules – 3 NCEs and 4 NBEs in various stages of preclinical and preclinical development. Of these, five are in clinical trials. Glenmark has been following a strategy of out-licensing research-staged molecules in clinical development to MNCs. So far Glenmark has struck seven deals in the last nine years booking ~US$ 200 million as upfront and milestone payments. Exhibit 4: Higher R&D spend here to stay….
88.3 76.8138.0
261.3 261.3
538.6625.7
749.4
882.0
4.2
3.1
4.7
6.5 6.5
9.4 9.5 9.5
9.0
0
200
400
600
800
1000
FY09 FY10 FY11 FY12 FY13 FY14 FY15E FY16E FY17E
(| c
rore
)
0
2
4
6
8
10
(%)
R & D cost R & D cost (% revenue)
Source: Company, ICICIdirect.com Research
Exhibit 5: Margins remains under pressure due to higher R&D spend
455619.6 596.8
847.1 847.1
1310.4 1243.3
1682.3
2092.9
21.7
24.9
20.221.1 21.1
18.8
21.3
22.5
21.8
0
400
800
1200
1600
2000
2400
FY09 FY10 FY11 FY12 FY13 FY14 FY15E FY16E FY17E
(| c
rore
)
14
18
22
26
(%)
EBITDA EBITDA Margins (%)
Source: Company, ICICIdirect.com Research

ICICI Securities Ltd | Retail Equity Research Page 6
Exhibit 6: Net profit to grow at CAGR of 31% in FY14-17E on lower base
196.1324.5
453.2 460.3 460.3542.6 599.2
939.8
1231.5
9.4
13.1
15.3
11.4 11.4
9.0
11.913.3
9.0
0
300
600
900
1200
1500
FY09 FY10 FY11 FY12 FY13 FY14 FY15E FY16E FY17E
(| c
rore
)
0
2
4
6
8
10
12
14
16
18
(%)
Net Profit Net Profit Margins (%)
Source: Company, ICICIdirect.com Research
Exhibit 7: Return ratios to improve, going ahead…
19.7
14.1
22.5
19.3
22.5
18.3
23.125.1
16.5 16.3 15.3
18.817.7
17.4
28.6
23.8
16.0
14.8
10
13
16
19
22
25
28
31
FY09 FY10 FY11 FY12 FY13 FY14 FY15E FY16E FY17E
(%)
RoNW (%) RoCE (%)
Source: Company, ICICIdirect.com Research

ICICI Securities Ltd | Retail Equity Research Page 7
Exhibit 8: Trends in quarterly financials (| crore) Q3FY12 Q4FY12 Q1FY13 Q2FY13 Q3FY13 Q4FY13 Q1FY14 Q2FY14 Q3FY14 Q4FY14 Q1FY15 Q2FY15 Q3FY15 YoY (%) QoQ (%)
Net Sales 1031.1 1065.9 1040.4 1255.2 1381.3 1335.5 1237.9 1463.0 1601.2 1681.7 1477.8 1671.5 1692.1 5.7 1.2
Other operating income 0.2 0.3 0.3 0.4 0.4 0.4 0.4 0.4 0.5 21.8 9.1 9.2 9.2 1638.2 0.2
Revenues 1031.3 1066.2 1040.7 1255.6 1381.6 1335.9 1238.2 1463.4 1601.8 1703.6 1486.9 1680.7 1701.3 6.2 1.2
Raw material cost 370.3 410.9 366.3 442.6 467.7 377.0 405.0 486.9 537.3 443.9 447.2 548.9 556.0 3.5 1.3
% to revenues 35.9 38.5 35.2 35.2 33.9 28.2 32.7 33.3 33.5 26.1 30.1 32.7 32.7 -86.5 2.2
Gross Profit 661.1 655.3 674.4 813.0 913.9 958.9 833.3 976.5 1064.4 1259.7 1039.7 1131.8 1145.3 7.6 1.2
Gross Profit Margin (%) 64.1 61.5 64.8 64.8 66.1 71.8 67.3 66.7 66.5 73.9 69.9 67.3 67.3 86.5 -2.2
Employee cost 173.4 163.3 165.6 201.6 212.4 208.7 210.8 264.5 273.5 277.4 276.4 355.3 316.5 15.7 -10.9
% to revenues 16.8 15.3 15.9 16.1 15.4 15.6 17.0 18.1 17.1 16.3 18.6 21.1 18.6 152.6 -253.5
Other expenditure 384.8 270.3 343.7 340.1 381.4 495.4 374.7 396.4 426.0 600.7 421.0 440.7 563.1 32.2 27.8
% to revenues 37.3 25.4 33.0 27.1 27.6 37.1 30.3 27.1 26.6 35.3 28.3 26.2 33.1 649.6 687.9
Total Expenditure 928.5 844.4 875.6 984.2 1061.5 1081.1 990.5 1147.7 1236.8 1321.9 1144.6 1344.9 1435.6 16.1 6.7
% to revenues 90.0 79.2 84.1 78.4 76.8 80.9 80.0 78.4 77.2 77.6 77.0 80.0 84.4 717.1 436.7
EBIDTA 102.9 221.8 165.1 271.3 320.2 254.8 247.8 315.7 365.0 381.6 342.3 335.8 265.7 -27.2 -20.9
EBITDA margin (%) 10.0 20.8 15.9 21.6 23.2 19.1 20.0 21.6 22.8 22.4 23.0 20.0 15.6 -717.8 -436.7
Depreciation 23.1 23.6 27.5 32.1 35.6 31.8 34.9 60.5 61.1 60.3 65.1 65.0 65.5 7.1 0.7
Interest 35.9 41.0 38.0 38.4 40.0 43.6 46.4 48.5 47.3 46.4 48.1 51.6 51.3 8.6 -0.6
Other income 10.8 2.3 2.6 6.6 5.2 -5.0 3.3 13.4 5.1 -12.1 3.5 1.0 2.1 -58.2 119.1
Exceptional items 0.0 0.0 0.0 0.0 0.0 0.0 0.0 0.0 0.0 217.5 0.0 0.0 0.0
PBT 54.5 159.5 102.2 207.4 249.7 174.4 169.8 220.1 261.7 45.3 232.6 220.2 151.0 -42.3 -31.4
Tax 8.4 7.3 21.8 47.7 36.6 4.6 39.2 62.8 47.4 1.9 47.7 55.2 36.3 -23.4 -34.3
Tax Rate (%) 15.4 4.6 21.3 23.0 14.7 2.6 23.1 28.5 18.1 4.1 20.5 25.1 24.0
PAT 46.1 152.2 80.4 159.7 213.0 169.8 130.6 157.3 214.3 43.4 184.9 165.0 114.8 -46.5 -30.5
PAT Margin (%) 4.5 14.3 7.7 12.7 15.4 12.7 10.5 10.7 13.4 2.5 12.4 9.8 6.7
Minority Interest 1.3 1.9 2.1 3.0 0.1 3.0 1.9 3.0 -1.9 0.3 0.1 -0.1 0.0
Net Profit 44.8 150.4 78.3 156.8 212.9 166.8 128.7 154.3 216.2 43.1 184.8 165.1 114.8 -46.9 -30.5
EPS (|) 1.7 5.6 2.9 5.8 7.9 6.2 4.8 5.7 8.0 1.6 6.8 6.1 4.2
Source: Company, ICICIdirect.com Research
SWOT Analysis Strengths- Prudent geographical mix covering high opportunity emerging markets as well as developed markets. Presence in niche therapies in the US such as oral contraceptives, dermatology which is relatively less crowded. Time tested R&D focused business model with a portfolio of Innovative products. Well placed to monetise the R&D pipeline in with product in various stages of completion. Weakness- High debt level; Presence of substantial intangibles in the Balance sheet. Higher R&D spends likely to put pressure on the margins. Opportunities- In the US Generics space lot of opportunities are panning out in the Oral Contraceptives and Respiratory space. Threats- Increased USFDA scrutiny across the globe regarding cGMP issues and consolidation in the US pharmacy space.

ICICI Securities Ltd | Retail Equity Research Page 8
Conference call highlights • Gross debt and cash stood at ~| 3160 crore and ~| 406 crore
respectively in Q3FY15. • In Q3, the company has received 1 USFDA approval
(gPrilosec) and filed 4 products. Cumulatively, it has 94 products in the US and has 75 pending approvals including 33 Para IV application. It also expects to file 4 ANDA in Q4FY15.
• It expects acceleration in the USFDA approvals from Q4 onwards. It has also taken some price hikes in the US.
• R&D stood at | 176 crore in Q3 FY15 (10.4% of total sales). The company has spent ~US$ 40-45 million in R&D for innovative products in CY14. Going ahead, the proportion of Innovative R&D in the total R&D is likely to go down.
• CIS is contributing 50-55% of the company’s total ROW sales. Venezuela is contributing 25-30% of company’s total Latin American sales.
• In Russia, the company has not taken any price hike despite sharp Rouble depreciation. During the quarter the company has received 3-4 products approval including gSeretide (for asthma; US$ 60-70 million sales). The company is holding back some Russian sales to avoid bad-debts.
• Russian margins are normally above the company’s blended margins.
• The company has also filed gSeretide in 4-5 other emerging markets and plans to file 5-6 more respiratory products in these markets.
• It expects strong European sales from Q4FY15 mainly due to launches of 3-4 products including gTarka
• The company expects ~18% growth in the domestic market. In Latin America, despite currency volatility it expects 10-15% growth due to incremental product launches.
• Capex expected to be ~| 500 crore for FY16.
Market Share: Domestic
MAT Dec 2014 (%) MAT Dec 2013 (%)Cardiac 3.81 3.50Respiratory 3.82 3.58Anti-Infectives 1.81 1.63Anti-Diabetic 1.97 1.50Gynacology 1.42 1.48Derma 8.04 8.16
Source: Company, ICICIdirect.com Research

ICICI Securities Ltd | Retail Equity Research Page 9
Valuation After languishing for few quarters, the US franchisee is likely to get some momentum, thanks to the interesting approvals lined up in FY16-17. Taking into account the product pipeline (including 33 Para IVs) the prospects are certainly to improve in FY16E and FY17E if indeed the momentum improves. Indian formulations growth is likely to remain at elevated level (Q3 was slightly muted) going ahead. Other geographies such as Europe, Latin America are emerging as new growth drivers but these geographies are slightly lumpy in nature. Respiratory launches in Russia despite adversaries bode well for ROW traction. We have valued the company at | 824 on SOTP basis- We ascribe | 817 to base business based on 18x FY17E EPS of | 45.4 and we have calculated NPV of | 7 for gZetia. Exhibit 9: One year forward PE
0100200300400500600700800900
1000M
ar-0
6
Oct-0
6
May
-07
Dec-
07
Jul-0
8
Feb-
09
Sep-
09
Apr-1
0
Nov
-10
Jun-
11
Jan-
12
Aug-
12
Mar
-13
Oct-1
3
May
-14
Dec-
14
|
Price 26.2x 23.8x 21.4x 19.0x 16.6x
[
Source: Company, ICICIdirect.com Research
Exhibit 10: One year forward PE of company vs. BSE Healthcare Index
0
10
20
30
40
50
60
Mar-06
Oct-06
May-07
Dec-07
Jul-08
Feb-09
Sep-09
Apr-10
Nov-10
Jun-11
Jan-12
Aug-12
Mar-13
Oct-13
May-14
Dec-14
(x)
Glenmark Pharma BSE Healthcare Index
Source: Company, ICICIdirect.com Research
Exhibit 11: Valuation
Revenues Growth EPS Growth P/E EV/EBITDA RoNW RoCE(| crore) (%) (|) (%) (x) (X) (%) (%)
FY14 6007 49 20.0 17.9 31.8 15.0 18.3 16.0FY15E 6624 10 22.1 10.4 28.8 16.1 17.7 17.4FY16E 7890 19 34.7 56.8 18.4 11.8 23.1 23.8FY17E 9286 18 45.4 45.4 14.0 9.2 25.1 28.6
Source: Company, ICICIdirect.com Research

ICICI Securities Ltd | Retail Equity Research Page 10
Company snapshot
Target Price: | 824
0
100
200
300
400
500
600
700
800
900
Jan-
10
Apr-1
0
Jul-1
0
Oct-1
0
Jan-
11
Apr-1
1
Jul-1
1
Oct-1
1
Jan-
12
Apr-1
2
Jul-1
2
Oct-1
2
Jan-
13
Apr-1
3
Jul-1
3
Oct-1
3
Jan-
14
Apr-1
4
Jul-1
4
Oct-1
4
Jan-
15
Apr-1
5
Jul-1
5
Oct-1
5
Jan-
16
Source: Bloomberg, Company, ICICIdirect.com Research Key events Date EventAug-09 Forest & Glenmark Pharma announce Phase IIb results for Oglemilast. The molecule did not show satisfactory results compare to its Placebo.
Oct-09 Launches four products in the UK market through its subsidiary Glenmark Generics Europe.
Mar-10 Receives USFDA approval for its new drug application for Oxycodone Hydrochloride capsules and liquid solutions filed as an NDA with USFDA under 505b2 route.
May-10 Enters into an agreement with Sanofi to out-license its GRC 15300 molecule. Receives US$ 20 million as an upfront payment.
Jan-11 Sanofi & Abbott win patent litigation case of generic Tarka. A Federal jury asks Glenmark to pay US$ 16 million as damages for launching at risk in the US market.
Apr-11 Enters into an exclusive agreement with a Canadian base company ImmanenceIntegrale Dermo Correction (IDC) to market high end dermatology products in eight countries including India & Brazil.
May-11 Out-licenses monoclonal antibody GBR 500 to Sanofi. Receives US$ 50 million as upfront payment.
Aug-12 The International Center for Dispute resolution rules in favor of Glenmark on the arbitration claim it filed against Napo Pharma. Glenmark will have rights to develop, commercialise and distribute Crofelemer in 140 emerging markets.
Jul-13 Conforms filing of ANDA for Lacosamide tablets and oral solutions with the USFDA under Para IV certification.
Mar-14 Provided | 213 crore for Tarka liability
Jan-15 Company has received shareholders' nod to raise up to $300 million (around Rs 1,890 crore) through issue of securities.
Source: Company, ICICIdirect.com Research Top 10 Shareholders Shareholding Pattern Rank Name Latest Filing Date % O/S Position (m)n Change (m)1 Saldanha Family Trust 31-Dec-14 47.27 128.2 0.02 Life Insurance Corporation of India 31-Dec-14 3.37 9.2 -0.23 OppenheimerFunds, Inc. 31-Dec-14 2.06 5.6 0.04 HSBC Global Asset Management (Hong Kong) Limited 31-Dec-14 1.82 5.0 -0.65 Capital International, Inc. 30-Sep-14 1.44 3.9 -0.16 Bellevue Asset Management AG 31-Jul-13 1.33 3.6 3.67 Macquarie Investment Management Ltd. 30-Sep-14 1.24 3.4 0.38 Capital Research Global Investors 31-Dec-14 1.22 3.3 -0.79 The Vanguard Group, Inc. 31-Jan-15 1.07 2.9 0.010 General Insurance Corporation of India 31-Dec-14 1.05 2.9 -0.1
(in %) Dec-13 Mar-14 Jun-14 Sep-14 Dec-14Promoter 48.3 48.3 48.3 48.3 48.3FII 33.1 33.2 34.4 35.1 34.6DII 7.5 7.8 6.8 5.9 6.4Others 11.1 10.7 10.5 10.7 10.7
Source: Reuters, ICICIdirect.com Research Recent Activity
Investor name Value Shares Investor name Value SharesBellevue Asset Management AG 34.13m 3.60m ICICI Prudential Asset Management Co. Ltd. -11.56m -0.95m APG Asset Management 29.36m 2.40m RCM Asia Pacific Ltd. -8.05m -0.68m Baron Capital Management, Inc. 12.53m 1.03m Capital Research Global Investors -7.95m -0.66m Wasatch Advisors, Inc. 12.45m 1.02m HSBC Global Asset Management (Hong Kong) Limited -7.47m -0.61m Tata Asset Management Limited 12.23m 1.00m William Blair & Company, L.L.C. -6.52m -0.56m
Buys Sells
Source: Reuters, ICICIdirect.com Research

ICICI Securities Ltd | Retail Equity Research Page 11
.
Financial summary
Profit and loss statement | Crore (Year-end March) FY14 FY15E FY16E FY17ERevenues 6,007.3 6,623.5 7,890.4 9,286.0Growth (%) 49.4 10.3 19.1 17.7Raw Material Expenses 1,873.0 2,119.3 2,524.3 2,924.5Employee Expenses 1,026.1 1,295.0 1,554.0 1,808.4R & D cost 538.6 625.7 749.4 882.0Other expenditure 1,259.1 1,340.2 1,380.5 1,578.3Total Operating Expenditure 4,696.9 5,380.2 6,208.1 7,193.1EBITDA 1,310.4 1,243.3 1,682.3 2,092.9Growth (%) 54.7 -5.1 35.3 24.4Depreciation 216.8 270.3 285.6 309.5Interest 188.6 203.3 196.1 170.1Other Income 9.8 9.6 12.0 12.0PBT 914.8 779.3 1,212.5 1,625.3EO 217.5 0.0 0.0 0.0Total Tax 151.3 180.1 272.8 365.7Profit After Tax 546.0 599.2 939.7 1,259.6MI 3.3 -0.1 -0.1 28.1Net Profit 542.6 599.2 939.8 1,231.5Growth (%) 17.9 10.4 56.8 31.0EPS (|) 20.0 22.1 34.7 45.4
Source: Company, ICICIdirect.com Research
Cash flow statement | Crore (Year-end March) FY14 FY15E FY16E FY17EProfit after Tax 546 599 940 1,260Add: Depreciation 217 270 286 309Inc/(dec) in CL and Provisions 721 200 93 435(Inc)/dec in Current Assets -839 -650 -378 -889Others 0 0 0 0CF from operating activities 644.4 419.3 940.7 1,114.9(Inc)/dec in Investments 0 0 0 0(Inc)/dec in Fixed Assets -484 -460 -500 -300Inc/(dec) deffered tax liability 30 0 0 0(Inc)/dec deffered tax liability -164 0 0 0CF from investing activities -618.1 -460.0 -500.0 -300.0Issue/(Buy back) of Equity 0 0 0 0Inc/(dec) in loan funds 502 -100 -300 -500Dividend paid & dividend tax -54 -95 -108 -108Inc/(dec) MI -11 0 0 0Others -271 -111 -141 -206CF from financing activities 165.7 -306.0 -549.2 -814.7Net Cash flow 192 -347 -109 0Opening Cash 611 803 456 348Closing Cash 803.0 456.3 347.7 347.9
Source: Company, ICICIdirect.com Research
Balance sheet | Crore (Year-end March) FY14 FY15E FY16E FY17ELiabilitiesEquity Capital 27.1 27.1 27.1 27.1Reserve and Surplus 2,956.5 3,349.7 4,040.2 4,985.1Total Shareholders funds 2,983.7 3,376.8 4,067.3 5,012.2Total Debt 3,267.0 3,167.0 2,867.0 2,367.0Deferred Tax Liability 207.1 207.1 207.1 207.1Minority Interest 13.3 13.3 13.3 13.3Total Liabilities 6,471.0 6,764.2 7,154.7 7,599.6
AssetsGross Block 3,632.6 3,892.6 4,292.6 4,492.6Less: Acc Depreciation 743.0 1,013.2 1,298.9 1,608.3Net Block 2,889.7 2,879.4 2,993.8 2,884.3Capital WIP 206.2 406.2 506.2 606.2Total Fixed Assets 3,095.9 3,285.6 3,500.0 3,490.5Investments 18.1 18.1 18.1 18.1Inventory 932.9 1,443.7 1,620.9 1,907.7Debtors 2,156.3 2,346.0 2,377.3 2,797.9Loans and Advances 906.4 856.3 1,025.5 1,206.9Other Current Assets 0.0 0.0 0.0 0.0Cash 803.0 456.3 347.7 347.9Total Current Assets 4,798.7 5,102.2 5,371.4 6,260.4Creditors 1,903.0 2,165.5 2,377.3 2,797.9Provisions 260.0 197.6 78.9 92.8Total Current Liabilities 2,163.0 2,363.1 2,456.2 2,890.8Net Current Assets 2,635.7 2,739.1 2,915.2 3,369.6Differed tax assets 721.3 721.3 721.3 721.3Application of Funds 6,471.0 6,764.2 7,154.7 7,599.6
Source: Company, ICICIdirect.com Research
Key ratios (Year-end March) FY14 FY15E FY16E FY17EPer share data (|)EPS 20.0 22.1 34.7 45.4Cash EPS 28.0 32.1 45.2 56.8BV 110.0 124.5 150.0 184.8DPS 2.0 3.5 4.0 4.0Cash Per Share 29.6 16.8 12.8 12.8Operating Ratios (%)EBITDA margins 21.8 18.8 21.3 22.5PBT margins 15.2 11.8 15.4 17.5Net Profit margins 9.0 9.0 11.9 13.3Debtor days 131 130 110 110Inventory days 57 80 75 75Creditor days 120 120 110 110Return Ratios (%)RoE 18.3 17.7 23.1 25.1RoCE 16.0 17.4 23.8 28.6RoIC 21.3 17.5 21.4 24.6Valuation Ratios (x)P/E 31.8 28.8 18.4 14.0EV / EBITDA 15.0 16.1 11.8 9.2EV / Revenues 3.3 3.0 2.5 2.1Market Cap / Revenues 2.9 2.6 2.2 1.9Price to Book Value 5.8 5.1 4.2 3.4Solvency RatiosDebt/EBITDA 2.5 2.5 1.7 1.1Debt / Equity 1.1 0.9 0.7 0.5Current Ratio 2.2 2.2 2.2 2.2Quick Ratio 1.8 1.5 1.5 1.5
Source: Company, ICICIdirect.com Research

ICICI Securities Ltd | Retail Equity Research Page 12
ICICIdirect.com coverage universe (Healthcare) ICICIdirect Healthcare coverage Universe
I-Direct CMP TP Rating M CapCode (|) (|) (| Cr) FY14 FY15E FY16E FY14 FY15E FY16E FY14 FY15E FY16E FY14 FY15E FY16E FY14 FY15E FY16E
Ajanta Pharma AJAPHA 2517 3220 BUY 8820.5 66.2 75.0 85.6 38.0 33.6 29.4 24.0 20.9 17.2 44.9 40.6 38.1 39.4 32.8 28.9
Apollo Hospitals APOHOS 1295 1075 HOLD 17951.7 22.8 27.5 35.1 56.9 47.2 36.9 28.1 24.0 18.2 11.6 12.7 14.9 10.6 11.8 13.58
Aurobindo Pharma AURPHA 1124 1303 HOLD 32672.9 47.3 57.4 70.5 23.8 19.6 15.9 17.0 14.0 11.4 24.1 23.4 24.4 31.3 31.6 28.65
Biocon BIOCON 420.5 410 HOLD 8378.7 20.7 20.0 22.6 20.3 21.0 18.6 12.4 12.4 10.9 13.4 11.6 12.9 13.7 12.3 12.9
Cadila Healthcare CADHEA 1545 1634 HOLD 31520.0 39.2 51.1 66.2 39.4 30.2 23.3 28.0 20.9 16.3 15.9 19.0 21.7 23.4 24.6 25.4
Cipla CIPLA 660.7 585 HOLD 52850.1 17.3 15.9 21.7 38.2 41.5 30.4 25.1 22.8 18.3 15.5 14.8 17.2 13.8 11.5 13.7
Divi's Laboratories DIVLAB 1644 1633 HOLD 21744.2 56.0 62.4 81.7 29.4 26.3 20.1 21.3 18.1 15.0 29.6 28.1 29.7 26.1 23.2 25.1
Dr Reddy's Labs DRREDD 3237 3332 HOLD 56545.6 126.7 128.3 151.0 26.3 26.0 22.1 17.1 15.8 13.9 19.2 18.7 20.1 23.7 19.9 19.5
Glenmark Pharma GLEPHA 765 824 HOLD 20193.6 20.0 22.1 34.7 38.2 34.6 22.1 17.3 18.4 12.0 16.0 17.4 23.8 18.3 17.7 23.1
Indoco Remedies INDREM 319.7 375 BUY 2935.1 6.3 9.5 13.3 50.9 33.7 24.0 24.9 16.9 13.1 16.6 21.8 28.1 12.6 16.4 19.4
Ipca Laboratories IPCLAB 670.2 622 HOLD 8425.7 37.9 25.6 31.8 17.7 26.2 21.1 11.0 14.5 14.0 27.6 16.1 17.8 24.4 14.7 16.0
Jubilant Life Sciences VAMORG 155.3 138 SELL 2463.6 6.8 -6.5 20.0 22.7 -24.0 7.8 6.3 11.4 5.5 10.1 4.5 7.6 4.2 -3.5 7.6
Lupin LUPIN 1618 1866 BUY 72401.8 41.0 54.4 61.0 39.5 29.7 26.5 24.9 19.0 17.1 34.5 34.7 32.0 26.5 27.4 24.6
Natco Pharma NATPHA 1402 1354 HOLD 4643.5 30.3 32.5 44.9 36.3 33.8 24.4 27.2 22.5 17.9 15.3 16.7 18.7 14.1 13.5 16.1
Sun Pharma SUNPHA 923.6 1036 BUY 190580.5 29.0 34.8 39.9 31.8 26.5 23.2 19.4 18.8 16.0 32.4 31.2 28.8 27.0 25.3 23.1
Torrent Pharma TORPHA 1152 1165 HOLD 19413.5 39.2 47.2 50.4 29.4 24.4 22.9 20.6 18.3 14.7 28.5 21.4 26.7 34.9 32.4 28.0
Unichem Laboratories UNILAB 215 206 HOLD 1946.2 18.7 6.4 13.2 11.5 33.9 16.3 10.8 17.9 11.1 15.7 6.5 12.8 20.7 7.1 14.0
RoNW (%)Company
EPS (|) PE(x) EV/EBITDA (x) RoCE (%)
Source: Company, ICICIdirect.com Research

ICICI Securities Ltd | Retail Equity Research Page 13
RATING RATIONALE ICICIdirect.com endeavours to provide objective opinions and recommendations. ICICIdirect.com assigns ratings to its stocks according to their notional target price vs. current market price and then categorises them as Strong Buy, Buy, Hold and Sell. The performance horizon is two years unless specified and the notional target price is defined as the analysts' valuation for a stock. Strong Buy: >15%/20% for large caps/midcaps, respectively, with high conviction; Buy: >10%/15% for large caps/midcaps, respectively; Hold: Up to +/-10%; Sell: -10% or more;
Pankaj Pandey Head – Research [email protected]
ICICIdirect.com Research Desk, ICICI Securities Limited, 1st Floor, Akruti Trade Centre, Road No 7, MIDC, Andheri (East) Mumbai – 400 093

ICICI Securities Ltd | Retail Equity Research Page 14
ANALYST CERTIFICATION We /I, Siddhant Khandekar, CA INTER and Mitesh Shah, MS (finance), Nandan Kamat MBA Research Analysts, authors and the names subscribed to this report, hereby certify that all of the views expressed in this research report accurately reflect our views about the subject issuer(s) or securities. We also certify that no part of our compensation was, is, or will be directly or indirectly related to the specific recommendation(s) or view(s) in this report.
Terms & conditions and other disclosures: ICICI Securities Limited (ICICI Securities) is a full-service, integrated investment banking and is, inter alia, engaged in the business of stock brokering and distribution of financial products. ICICI Securities is a wholly-owned subsidiary of ICICI Bank which is India’s largest private sector bank and has its various subsidiaries engaged in businesses of housing finance, asset management, life insurance, general insurance, venture capital fund management, etc. (“associates”), the details in respect of which are available on www.icicibank.com. ICICI Securities is one of the leading merchant bankers/ underwriters of securities and participate in virtually all securities trading markets in India. We and our associates might have investment banking and other business relationship with a significant percentage of companies covered by our Investment Research Department. ICICI Securities generally prohibits its analysts, persons reporting to analysts and their relatives from maintaining a financial interest in the securities or derivatives of any companies that the analysts cover. The information and opinions in this report have been prepared by ICICI Securities and are subject to change without any notice. The report and information contained herein is strictly confidential and meant solely for the selected recipient and may not be altered in any way, transmitted to, copied or distributed, in part or in whole, to any other person or to the media or reproduced in any form, without prior written consent of ICICI Securities. While we would endeavour to update the information herein on a reasonable basis, ICICI Securities is under no obligation to update or keep the information current. Also, there may be regulatory, compliance or other reasons that may prevent ICICI Securities from doing so. Non-rated securities indicate that rating on a particular security has been suspended temporarily and such suspension is in compliance with applicable regulations and/or ICICI Securities policies, in circumstances where ICICI Securities might be acting in an advisory capacity to this company, or in certain other circumstances. This report is based on information obtained from public sources and sources believed to be reliable, but no independent verification has been made nor is its accuracy or completeness guaranteed. This report and information herein is solely for informational purpose and shall not be used or considered as an offer document or solicitation of offer to buy or sell or subscribe for securities or other financial instruments. Though disseminated to all the customers simultaneously, not all customers may receive this report at the same time. ICICI Securities will not treat recipients as customers by virtue of their receiving this report. Nothing in this report constitutes investment, legal, accounting and tax advice or a representation that any investment or strategy is suitable or appropriate to your specific circumstances. The securities discussed and opinions expressed in this report may not be suitable for all investors, who must make their own investment decisions, based on their own investment objectives, financial positions and needs of specific recipient. This may not be taken in substitution for the exercise of independent judgment by any recipient. The recipient should independently evaluate the investment risks. The value and return on investment may vary because of changes in interest rates, foreign exchange rates or any other reason. ICICI Securities accepts no liabilities whatsoever for any loss or damage of any kind arising out of the use of this report. Past performance is not necessarily a guide to future performance. Investors are advised to see Risk Disclosure Document to understand the risks associated before investing in the securities markets. Actual results may differ materially from those set forth in projections. Forward-looking statements are not predictions and may be subject to change without notice. ICICI Securities or its associates might have managed or co-managed public offering of securities for the subject company or might have been mandated by the subject company for any other assignment in the past twelve months. ICICI Securities or its associates might have received any compensation from the companies mentioned in the report during the period preceding twelve months from the date of this report for services in respect of managing or co-managing public offerings, corporate finance, investment banking or merchant banking, brokerage services or other advisory service in a merger or specific transaction. ICICI Securities or its associates might have received any compensation for products or services other than investment banking or merchant banking or brokerage services from the companies mentioned in the report in the past twelve months. ICICI Securities encourages independence in research report preparation and strives to minimize conflict in preparation of research report. ICICI Securities or its analysts did not receive any compensation or other benefits from the companies mentioned in the report or third party in connection with preparation of the research report. Accordingly, neither ICICI Securities nor Research Analysts have any material conflict of interest at the time of publication of this report. It is confirmed that Siddhant Khandekar, CA INTER and Mitesh Shah, MS (finance), Nandan Kamat MBA, Research Analysts of this report have not received any compensation from the companies mentioned in the report in the preceding twelve months. Compensation of our Research Analysts is not based on any specific merchant banking, investment banking or brokerage service transactions. ICICI Securities or its subsidiaries collectively or Research Analysts do not own 1% or more of the equity securities of the Company mentioned in the report as of the last day of the month preceding the publication of the research report. Since associates of ICICI Securities are engaged in various financial service businesses, they might have financial interests or beneficial ownership in various companies including the subject company/companies mentioned in this report. It is confirmed that Siddhant Khandekar, CA INTER and Mitesh Shah, MS (finance), Nandan Kamat MBA, Research Analysts do not serve as an officer, director or employee of the companies mentioned in the report. ICICI Securities may have issued other reports that are inconsistent with and reach different conclusion from the information presented in this report. Neither the Research Analysts nor ICICI Securities have been engaged in market making activity for the companies mentioned in the report. We submit that no material disciplinary action has been taken on ICICI Securities by any Regulatory Authority impacting Equity Research Analysis activities. This report is not directed or intended for distribution to, or use by, any person or entity who is a citizen or resident of or located in any locality, state, country or other jurisdiction, where such distribution, publication, availability or use would be contrary to law, regulation or which would subject ICICI Securities and affiliates to any registration or licensing requirement within such jurisdiction. The securities described herein may or may not be eligible for sale in all jurisdictions or to certain category of investors. Persons in whose possession this document may come are required to inform themselves of and to observe such restriction.