Glaze Thesis 05.18.2009 - Texas A&M University
57
THE MAGNITUDE AND EXTENT OF MALFEASANCE ON UNPROCTORED INTERNET–BASED TESTS OF COGNITIVE ABILITY AND PERSONALITY A Thesis by RYAN MATTHEW GLAZE Submitted to the Office of Graduate Studies of Texas A&M University in partial fulfillment of the requirements for the degree of MASTER OF SCIENCE August 2009 Major Subject: Psychology
Transcript of Glaze Thesis 05.18.2009 - Texas A&M University
THE MAGNITUDE AND EXTENT OF MALFEASANCE ON UNPROCTORED
INTERNET–BASED TESTS OF COGNITIVE ABILITY AND PERSONALITY
A Thesis
by
RYAN MATTHEW GLAZE
Submitted to the Office of Graduate Studies of Texas A&M University
in partial fulfillment of the requirements for the degree of
MASTER OF SCIENCE
August 2009
Major Subject: Psychology

THE MAGNITUDE AND EXTENT OF MALFEASANCE ON UNPROCTORED
INTERNET–BASED TESTS OF COGNITIVE ABILITY AND PERSONALITY
A Thesis
by
RYAN MATTHEW GLAZE
Submitted to the Office of Graduate Studies of Texas A&M University
in partial fulfillment of the requirements for the degree of
MASTER OF SCIENCE
Approved by:
Chair of Committee, Winfred Arthur, Jr. Committee Members, David Martin Stephanie Payne Head of Department, Leslie Morey
August 2009
Major Subject: Psychology

iii
ABSTRACT
The Magnitude and Extent of Malfeasance on Unproctored Internet–Based Tests of
Cognitive Ability and Personality. (August 2009)
Ryan Matthew Glaze, B.A., The University of Oklahoma
Chair of Advisory Committee: Dr. Winfred Arthur, Jr.
The use of unproctored internet–based testing for employee selection is
widespread. Although this mode of testing has advantages over onsite testing,
researchers and practitioners continue to be concerned about potential malfeasance (e.g.,
cheating and response distortion) under high–stakes conditions. Therefore, the primary
objective of the present study was to investigate potential malfeasance effects on the
scores of an unproctored internet–based cognitive ability, and a personality test. This
was accomplished by implementing a within–subjects design in which test takers first
completed the tests as job applicants (high–stakes) or incumbents (low–stakes) then as
research participants (low–stakes). The pattern of cognitive ability test score differences
was more consonant with a psychometric practice effect than a malfeasance explanation.
Thus, the results suggest that, if present, there was no evidence to indicate that wide–
scale or systematic malfeasance unduly affected the test scores. This may have been due
to the speeded nature of the test, which was used to preempt the potential for widespread
cheating. Additionally, the unproctored personality administration resulted in similar
mean shifts and similar proportions of test takers being suspected of distorting their

iv
responses as that reported in the extant literature for proctored tests. In their totality,
these results suggest that an unproctored internet–based administration does not uniquely
threaten personality measures in terms of elevated levels of response distortion
compared to proctored measures.

v
ACKNOWLEDGEMENTS
I would like to thank my committee chair, Dr. Winfred Arthur, Jr., and my
committee members, Dr. Stephanie Payne and Dr. David Martin, for their guidance and
support throughout the course of this research. Additionally, I would like to thank Dr.
Anton Villado and Dr. Jason Taylor.
Thanks also go to my friends and colleagues at Texas A&M University. Special
thanks go to my friend and colleague, Eswen Fava. Finally, thanks go to my mom, dad,
and brother for their encouragement, support, patience, and love.

vi
TABLE OF CONTENTS
Page
ABSTRACT .............................................................................................................. iii
ACKNOWLEDGEMENTS ...................................................................................... v
TABLE OF CONTENTS .......................................................................................... vi
LIST OF FIGURES................................................................................................... viii
LIST OF TABLES .................................................................................................... ix
CHAPTER
I INTRODUCTION................................................................................ 1 Technology in Selection Testing.................................................... 1 Unproctored Internet–Based Testing.............................................. 2 Ability Testing................................................................................ 5 Unproctored Internet–Based Ability Testing ................................. 7 Nonability Testing.......................................................................... 9 Unproctored Internet–Based Nonability Testing ........................... 11 Testing Stakes ................................................................................ 12 II METHOD............................................................................................. 17
Participants ..................................................................................... 17 Measures......................................................................................... 18 Procedure........................................................................................ 22
III RESULTS............................................................................................. 25 Potential Cheating on Ability Test ................................................. 25 Potential Response Distortion on Personality Measures................ 30

vii
CHAPTER Page
IV DISCUSSION AND CONCLUSIONS................................................ 35
Limitations, Implications, and Directions for Future Research ..... 37 Conclusions .................................................................................... 38
REFERENCES.......................................................................................................... 40
APPENDIX A ........................................................................................................... 47
VITA ......................................................................................................................... 48
viii
LIST OF FIGURES
FIGURE Page
1 Percentage of test takers as per 1 SEMd operationalization of practice and cheating effects on the cognitive ability test.......................... 29 2 Percentage of test takers as per SEMd operationalization of response distortion on the personality measure......................................................... 33

ix
LIST OF TABLES
TABLE Page 1 Demography and Test 1 Scores for Participants and Nonparticipants....... 19 2 Frequency of the SOC Major Groups and the NAICS Industry Types in the Test 2 Data............................................................................. 20 3 FFM Dimensions Descriptive Statistics and Internal Consistency Reliability Coefficients .............................................................................. 23 4 Comparison of Cognitive Ability (Unproctored) Test–Retest Standardized Mean Differences (d) and Reliability Coefficients with Hausknecht et al. (2007) Meta–Analytic Results .............................. 26 5 Test 2/Test 1 Difference Score Means and Standard Deviations, Test–Retest Correlations, and SEMd Values.............................................. 27 6 Number of Test Items Attempted on Cognitive Ability Test and Retest ... 30
7 Comparison of FFM Dimensions (Unproctored) Test–Retest Standardized Mean Differences (d) and Reliability Coefficients with Birkeland et al. (2006) Meta–Analytic Results .......................................... 34
1
CHAPTER I
INTRODUCTION
Since the 1920s, psychological testing has played a definitive role in the field of
industrial/organizational (I/O) psychology by increasing the match between employee
characteristics and job requirements (Benjamin & Baker, 2004). Considerable research
attention has led to substantial contributions to the understanding of selection tests
(Arthur & Benjamin, 1999). Although, a review of the selection test literature is outside
the scope of this thesis, reviews are available elsewhere (e.g., Sackett & Lievens, 2008).
Previous reviews have focused on traditional methods of administering selection tests
(e.g., paper–and–pencil tests). However, researchers and practitioners are beginning to
realize the impact of technology on selection testing resulting in the increasing use of
unproctored internet–based tests. Consequently, the objectives of the current study are to
(a) review the extant unproctored internet–based testing literature, and (b) investigate
potential malfeasance effects on the scores of unproctored internet–based tests of
cognitive ability and personality.
Technology in Selection Testing
As the role of technology in I/O psychology grows, the advantages and
disadvantages of using computer–based testing continue to garner research attention.
Initial research in this domain focused on the measurement equivalency concerns when
____________ This thesis follows the style of Journal of Applied Psychology.

2
converting paper–and–pencil tests to computer–based tests. These concerns have since
largely been resolved; it would seem that computer administration does not threaten the
construct validity of said tests (Booth–Kewley, Edwards, & Rosenfeld, 1992; Mead, &
Drasgow, 1993; Potosky & Bobko, 2004; Richman, Kiesler, Wiesband, & Drasgow,
1999). Subsequently, the personnel selection testing literature is now focused on issues
brought about by internet–based testing which is a logical extension of computer–based
testing.
Unproctored Internet–Based Testing
The advantages of internet–based testing build on the utility of computer–based
testing (Baron & Austin, 2000; McBride, 1998), and can be characterized as improving
the efficiency of delivery. Thus, like computer–based testing, internet–based testing may
ensure that every test taker receives the same instructions, precise timing, and accurate
scoring. In addition, internet–based testing also permits the easy incorporation of
modifications and updates into existing systems (Tippins et al., 2006). However, one
advantage of internet–based testing over computer–based testing is its ability to be
paired with internet–based recruitment systems allowing applicants to search and apply
for jobs from any location with internet access at any time. This “test anywhere–
anytime” approach has many advantages. From an applicant perspective, the ease of
searching and applying for jobs online reduces the motivation and resources required to
engage in such behaviors by reducing or eliminating some common barriers to finding
jobs (e.g., transportation issues). From an organizational perspective, the “test
anywhere–anytime” approach may (a) reduce costs associated with onsite testing (e.g.,

3
space, staff, and production costs), (b) reduce time–to–hire, and (c) increase the size of
the hiring organization’s applicant pool, and subsequently improve the selection ratio.
Consequently, it is expected that the use of unproctored internet–based testing will
continue to increase and play an important role in employment testing (Tippins et al.,
2006).
However, to capitalize on the noted advantages of the “test anywhere–anytime”
approach, internet–based tests must be administered in an unproctored manner.1 Yet,
unproctored testing engenders disadvantages that potentially compromise the integrity of
unproctored internet–based test scores and hence, the resultant researcher and
practitioner concerns about this mode of testing. Possible threats that result from the use
of unproctored internet–based testing include the inability to verify the test taker’s
identity, test content security concerns, and technologically– and psychologically–based
sources of construct irrelevant variance (Messick, 1995).
There are available technologies that are intended to minimize the threats
concerning test taker identity and test content security. For example, practitioners may
use webcams, keystroke analysis, or biometric identification systems, such as iris, retina,
or fingerprint scans, in an attempt to verify test takers’ identities. Furthermore, other
layers of security for online testing, including electronic monitoring and control such as
real–time data forensics, browser lockdown, and desktop control, may increase test
content security and decrease access to illicit aides such as other internet sites (Foster,
2008; see also Burke, 2008). However, these technologies have some disadvantages,
1 The term “unproctored” is used here to refer to a lack or absence of human observation of test takers.

4
including concerns regarding cost and applicant reactions to the testing process and
invasive technologies (Foster, 2008). Furthermore, these possible solutions are state–of–
the–art and may not be a viable option for all organizations due to administrative
challenges (e.g., administrative cost and required expertise).
Concerns regarding test content security and test taker identification
notwithstanding, technologically–based sources of construct irrelevant variance also
compromise the veracity of unproctored internet–based test scores. The speed and
performance properties of the test taker’s computer and the quality of their connection to
the internet will affect how fast web pages (i.e., test items) are loaded and subsequently,
the amount of time the test taker has to complete the test (Potosky & Bobko, 2004).
Furthermore, the performance properties of the server on which the test content resides
may also affect the speed at which test items are loaded.
Finally, two major sources of construct irrelevant variance in this context are the
lack of standardization in the physical test taking environment, and the opportunity for
malfeasant behavior. Specifically, the physical context in which applicants complete
unproctored–internet based tests is not standardized. Applicants may be at a
disadvantage when taking tests, if for example, they are distracted by ambient noise
(e.g., crying children) whereas others take the test in a quiet environment. This lack of
standardization raises questions about whether unproctored internet–based tests meet the
levels of standardization required by professional guidelines (Pearlman, 2009).
Although there are a plethora of concerns regarding unproctored internet–based
testing, the focus of the present paper is the magnitude and extent of malfeasant behavior

5
and its potential effects on the veracity of test scores. Malfeasant behavior is defined
here as deliberately falsifying one's responses on a test in an attempt to distort one's
standing on the construct of interest. Malfeasant responding may take one of two forms
—cheating or response distortion. In reference to cheating, test takers may employ illicit
aids such as calculators and dictionaries, alternate test takers (e.g., an intelligent friend),
or pre–knowledge of test items that have been downloaded (printed) from the testing
website. In contrast, response distortion refers to deliberately falsifying one's responses
as in faking, impression management, and other forms of socially desirable responding
(Paulhus, 2002). Consequently, the primary objective of the present study is to
investigate and compare potential malfeasance effects on the scores of unproctored
internet–based tests of cognitive ability, and personality.
Ability Testing
Ability tests are generally considered to be one of the best predictors of job
performance (Schmidt, 2002; Schmidt & Hunter, 1998). Given their typical format (e.g.,
paper–and–pencil, computer–based) they are also inexpensive to administer. As a class
of predictors, ability tests have true correct or incorrect answers. Thus, unlike nonability
testing where malfeasant responding takes the form of response distortion, malfeasant
responding occurs in the form of cheating in the context of ability testing.
Although the prevalence of cheating in organizational settings is not well
researched (however, see Burke, 2008), this is less so in the educational literature where
the prevalence of cheating is known to be widespread. For instance, Chizek (1999) and

6
Whitley (1998) report that approximately half of all college students cheat on an
examination during their college career.
Ability (and knowledge) tests are susceptible to cheating for several reasons.
First, test takers’ scores play an important role in whether they get hired or not. Second,
the transparency and valence of ability test items are clear—that is, ability test items
have a correct or best answer. Unlike personality measures, the desired response is a
matter of fact. Consequently, it is not unreasonable to assume that cheating can and does
occur in applicant testing.
In an unproctored environment, cheating may consist of using crib sheets,
viewing other test takers’ responses, and communicating with other individuals. Proctors
deter such forms of cheating insofar as they are able to prevent and detect such
behaviors. Thus, human observation is the primary method for curtailing cheating.
However, human proctors are not perfect and some fraction of cheating behavior goes
undetected. Although there is no empirical evidence describing the relationship between
cheating and the criterion–related validity of test scores, cheating would have a
detrimental effect on the criterion–related validity of test scores if only a subset of test
takers engaged in cheating behaviors or if some test takers were able to cheat better than
others (i.e., differential score inflation across test takers).

7
Unproctored Internet–Based Ability Tests
As previously mentioned, ability tests utilize proctors to deter test takers from
cheating. In an unproctored environment2, the absence of a proctor may create a
permissive environment for cheating as test takers may experience little or no fear of
detection. Motivated test takers may seek out illicit aids, including alternate test takers,
reference materials, calculators and the like and use these illicit aides to increase their
test scores.
The potential for wide–scale cheating initially led several researchers to suspect
that unproctored internet–based ability testing may not a viable selection strategy
(Tippins et al., 2006). However, there are potential methods for detecting and reducing
the propensity of cheating. These methods include technological solutions as previously
noted (e.g., browser lockdown, desktop control) as well as proctored retesting (i.e.,
confirmation or verification tests), and using a speeded test.
Detecting cheating via proctored retesting. In an effort to utilize unproctored
internet–based testing and maintain test utility and validity, some researchers advocate
the use of proctored retesting (Tippins et al., 2006). Using unproctored internet–based
testing in conjunction with proctored retesting is advantageous over proctored testing
alone as it reduces the number of applicants who must be tested onsite. Nevertheless,
proctored retesting does reduce the efficiency and advantages of unproctored internet–
based testing, especially its cost effectiveness. Along these lines, Tippins et al. discuss
four approaches to unproctored internet–based testing for selection purposes and
2 It is important to note that the mode of testing (e.g., paper–and–pencil, computer–based, internet–based) is independent of the presence or absence of a test proctor.

8
delineate the tradeoffs associated with each approach. One approach is to use
unproctored internet–based testing to deliver feedback to applicants regarding their
likely performance on subsequent proctored retesting. Two approaches require proctored
retesting, taking the form of a full length retest (i.e., repeating the original tests or taking
alternate forms) or an abridged retest. The fourth approach entails unproctored internet–
based testing without retesting, although this may result in poor test score validity as this
approach is the most permissive for cheating.
In addition to the reduced efficiency of proctored retesting, research indicates
that retesting is associated with increases in test scores (Hausknecht, Halpert, Di Paolo,
& Moriarty Gerrard, 2007) and changes in the factor structure of ability tests (Lievens,
Reeve, & Heggestad, 2007). Hausknecht et al.’s (2007) meta–analytic evidence suggests
that in operational contexts test takers increase their scores .27 standard deviations upon
retest (k = 19, N = 61,795). Furthermore, the retesting effect in the absence of coaching
(in both research and operational contexts) is similar (d = 0.21, k = 75, N = 81,374).
Based on this evidence, Hausknecht et al. recommend a minimum retest interval of 1
year to minimize practice effects due to memory—a recommendation that is probably
not viable in most selection contexts. Furthermore, test scores based on a retest of
general mental ability (GMA) are less saturated with GMA (and less predictive of grade
point average) than initial test scores (Lievens et al., 2007). Thus, the use of proctored
retesting may threaten construct– and criterion–related validity of test scores gathered
under this approach.

9
Preventing cheating via speeded ability test. The primary reason for onsite
retesting of unproctored internet–based tests is to diminish the threat of cheating on the
part of the test taker and subsequently, scores that do not reflect the individual’s standing
on the construct of interest. Thus, the need for retesting individuals would be mitigated if
one used testing approaches that were less susceptible to cheating. One such approach is
to use speeded tests, which by virtue of their time constraints do not facilitate expected
cheating behaviors. This is predicated on the assumption that a speeded administration is
consonant with the job–relatedness of the test3. Possible modes of cheating (e.g., using
surrogate test takers, using additional aids) are not independent of time, assuming there
is no pre–knowledge of test content. For example, pertinent information in dictionaries
and reference materials must be located and read, which may take more time than is
permitted. Thus, if test takers do not have pre–knowledge of the test content, then time
constraints should make cheating more difficult, thereby deterring test takers from
engaging in cheating under speeded conditions. Thus, time constraints may reduce the
propensity of some forms of cheating (i.e., those that are dependent on time).
Nonability Testing
As a class of tests that are typically administered by means of self–report, there
are no true correct or incorrect, or even best answers for nonability measures. Therefore,
in the absence of true correct or incorrect answers, coupled with the inability to verify
the accuracy of test takers’ responses, nonability measures are susceptible to test takers’
3 In the United States, users of speeded tests should also consider the implications of the Americans with Disabilities Act. Specifically, some test takers may require some accommodation in the form of additional time to complete the test.
10
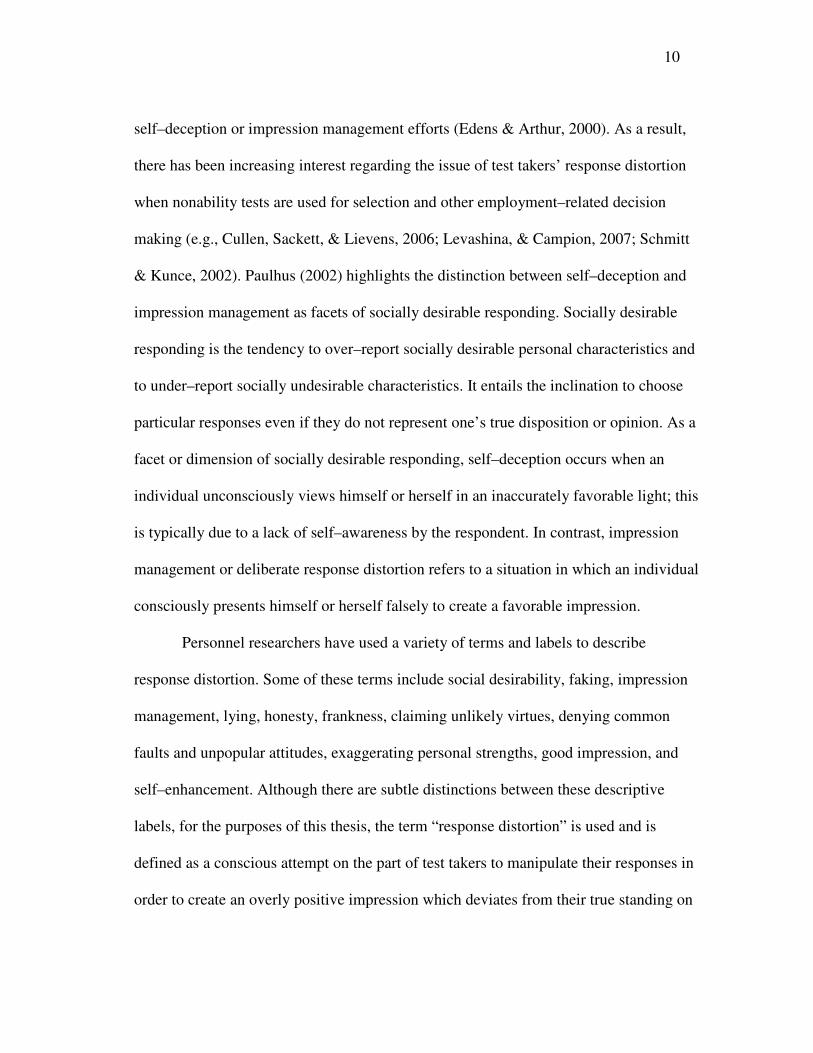
self–deception or impression management efforts (Edens & Arthur, 2000). As a result,
there has been increasing interest regarding the issue of test takers’ response distortion
when nonability tests are used for selection and other employment–related decision
making (e.g., Cullen, Sackett, & Lievens, 2006; Levashina, & Campion, 2007; Schmitt
& Kunce, 2002). Paulhus (2002) highlights the distinction between self–deception and
impression management as facets of socially desirable responding. Socially desirable
responding is the tendency to over–report socially desirable personal characteristics and
to under–report socially undesirable characteristics. It entails the inclination to choose
particular responses even if they do not represent one’s true disposition or opinion. As a
facet or dimension of socially desirable responding, self–deception occurs when an
individual unconsciously views himself or herself in an inaccurately favorable light; this
is typically due to a lack of self–awareness by the respondent. In contrast, impression
management or deliberate response distortion refers to a situation in which an individual
consciously presents himself or herself falsely to create a favorable impression.
Personnel researchers have used a variety of terms and labels to describe
response distortion. Some of these terms include social desirability, faking, impression
management, lying, honesty, frankness, claiming unlikely virtues, denying common
faults and unpopular attitudes, exaggerating personal strengths, good impression, and
self–enhancement. Although there are subtle distinctions between these descriptive
labels, for the purposes of this thesis, the term “response distortion” is used and is
defined as a conscious attempt on the part of test takers to manipulate their responses in
order to create an overly positive impression which deviates from their true standing on

11
the trait or characteristic of interest (Ellingson, Sackett, & Connelly, 2007; McFarland &
Ryan, 2000; Zickar & Robie, 1999). Response distortion is commonly conceptualized as
systematic error variance (Arthur, Woehr, & Graziano, 2001). Thus, job applicants are
assumed to distort their responses because it assists them in attaining valued outcomes
such as jobs and promotions.
In spite of the minority claims that few applicants distort their responses (Hogan,
Barrett, & Hogan, 2007; Hough et al., 1990), the preponderance of recent research
indicates that applicant response distortion on nonability measures does occur (Griffith,
Chmielowski, & Yoshita, 2007; Levin & Zickar, 2002). As a result, several techniques
for preventing or minimizing response distortion on personality measures have been
investigated, including forced–choice responses, empirical keying, warning and
verification, and response elaboration (see Hough, 1998 for a review). These techniques
are designed to decrease the magnitude and extent of response distortion, as these are
critical factors in determining the adverse effects of response distortion on the criterion–
related validity of test scores (Komar, Brown, Komar, & Robie, 2008).
Unproctored Internet–Based Nonability Testing
The resultant critical question is whether unproctored internet–based personality
testing results in greater levels of response distortion compared to proctored testing.
Response distortion is posited to be determined by one’s motivation, ability, the
opportunity to fake (e.g., test takers with a lower true score have a greater opportunity to
fake compared to test takers with a higher true score), and situational factors (McFarland
& Ryan, 2006). In an unproctored environment access to illicit aides may create a

12
relatively more permissive environment compared to proctored testing as test takers may
collaborate with other individuals (e.g., alternate test takers, surrogates or advisors) in an
effort to inflate their test scores. However, it is unlikely that test takers will engage in
these behaviors if they are confident in their ability to elevate their test scores using their
own personal schemas of a desirable personality profile. Given the preponderance of
research that indicates test takers can effectively distort their responses (Viswesvaran &
Ones, 1999), it is not unreasonable to posit that test takers are unlikely to seek out illicit
aides (e.g., alternate test takers). Thus, the magnitude and extent of response distortion
should be similar for both unproctored internet–based and proctored personality tests.
Testing Stakes
Test outcomes, that is high– versus low–stakes testing (Birkeland et al., 2006;
Ellingson et al., 2007), may also affect the propensity for malfeasance. A test
administration is considered to have high–stakes when the results of the test have
“important, direct consequences for examinees, programs, or institutions involved in
testing” (AERA et al., 1999, p. 121). Thus, high–stakes testing (e.g., selection and other
employment–related testing) would be expected to increase the motivation for
malfeasance whereas low–stakes testing (e.g., for developmental or research purposes)
should result in relatively little, if any cheating or response distortion. In high–stakes
testing, test scores are used to make comparative evaluative decisions regarding who to
hire or the allotment of other valued outcomes (e.g., promotions in municipal merit–
based personnel systems). When used for these purposes, the test takers’ livelihoods are
affected by decisions made on the basis of their test scores. Thus, it is reasonable to
13
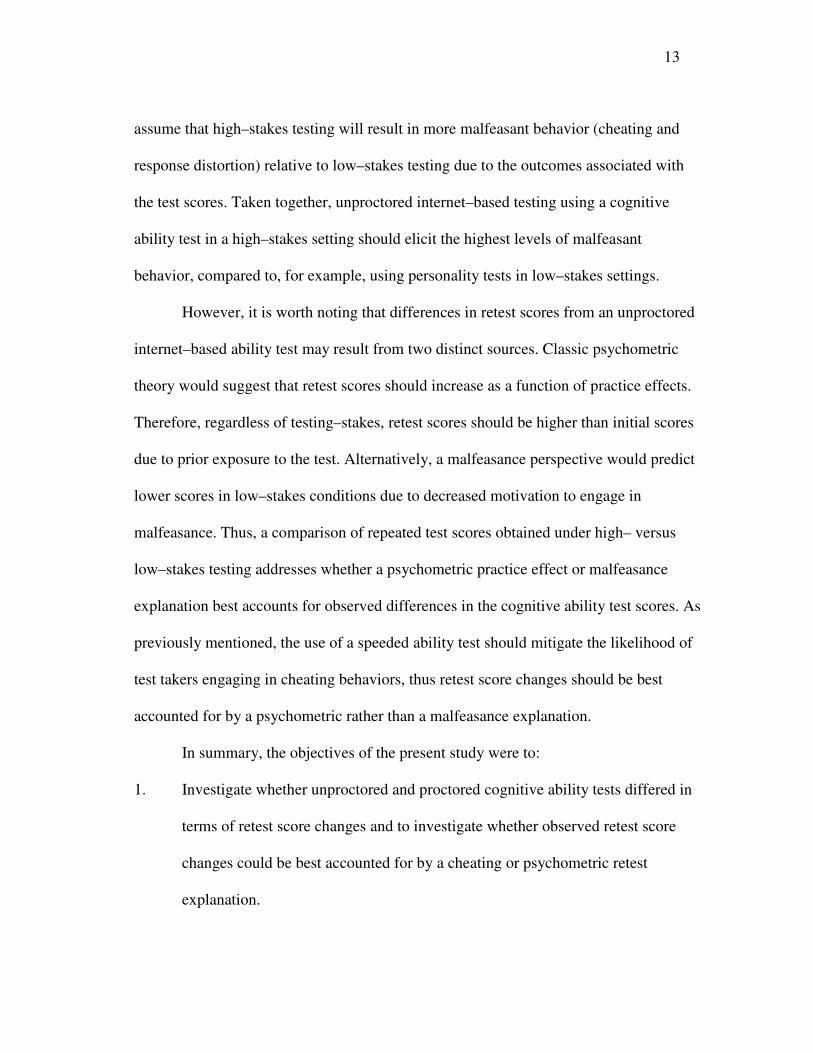
assume that high–stakes testing will result in more malfeasant behavior (cheating and
response distortion) relative to low–stakes testing due to the outcomes associated with
the test scores. Taken together, unproctored internet–based testing using a cognitive
ability test in a high–stakes setting should elicit the highest levels of malfeasant
behavior, compared to, for example, using personality tests in low–stakes settings.
However, it is worth noting that differences in retest scores from an unproctored
internet–based ability test may result from two distinct sources. Classic psychometric
theory would suggest that retest scores should increase as a function of practice effects.
Therefore, regardless of testing–stakes, retest scores should be higher than initial scores
due to prior exposure to the test. Alternatively, a malfeasance perspective would predict
lower scores in low–stakes conditions due to decreased motivation to engage in
malfeasance. Thus, a comparison of repeated test scores obtained under high– versus
low–stakes testing addresses whether a psychometric practice effect or malfeasance
explanation best accounts for observed differences in the cognitive ability test scores. As
previously mentioned, the use of a speeded ability test should mitigate the likelihood of
test takers engaging in cheating behaviors, thus retest score changes should be best
accounted for by a psychometric rather than a malfeasance explanation.
In summary, the objectives of the present study were to:
1. Investigate whether unproctored and proctored cognitive ability tests differed in
terms of retest score changes and to investigate whether observed retest score
changes could be best accounted for by a cheating or psychometric retest
explanation.

14
2. Investigate whether unproctored and proctored personality tests differed in terms
of the magnitude of response distortion. Specifically, do unproctored internet–
based personality tests display higher levels of response distortion than proctored
tests? In addition, do unproctored internet–based personality tests result in more
test takers distorting their responses compared to proctored personality tests?
To accomplish the objectives of the present study, a within–subjects design was
implemented in which 296 test takers completed an unproctored online assessment that
included a cognitive ability, and personality test. Participants completed the measures
first as job applicants (high–stakes) or incumbents (low–stakes), then as research
participants (low–stakes). Meta–analytic results reported in the extant literature were
used for the proctored ability (Hausknecht, et al., 2007) and personality (Birkeland et al.,
2006) test comparisons. Furthermore, results reported by Griffith et al. (2007; a primary
study) were used to compare the frequency of applicant response distortion in proctored
and unproctored settings. The results of these studies are briefly reviewed below.
The results of Hausknecht et al.’s (2007) meta–analysis of practice effects on
proctored cognitive ability tests indicated retest improvements in scores both in the
presence (d = 0.64, k = 23, N = 2,323) and absence (d = 0.21, k = 75, N = 81,374) of
interventions such as test coaching and training. In addition, the mean improvement in
test scores under operational (d = 0.27, k = 19, N = 61,795) and research–based (d =
0.22, k = 88, N = 72,641) testing conditions were quite similar. It should be noted that
unlike the present study, the testing conditions for the test and retest were identical.
Thus, for the operational setting both conditions were high–stakes, and for the research

15
conditions both were low–stakes. Although the operational data are much closer to the
study objectives, both the operational and research–based results from Hausknecht et
al.’s meta–analysis will be used to make comparisons. Finally, Hausknecht et al. also
obtained fairly high retest reliability coefficients (mean Test 1/Test 2 = .82, Test 2/Test 3
= .83, and Test 1/Test 3 = .82; J. P. Hausknecht, personal communication, 2007).
Birkeland et al. (2006) investigated job applicant faking on personality measures
by comparing applicants’ and incumbents’ scores on the five factor model (FFM) of
personality dimensions. In conducting their meta–analysis, they drew the distinction
between direct and indirect measures of the FFM dimensions, where direct measures
were defined as those that were specifically designed to measure the FFM personality
factors (e.g., NEO–FFI). In contrast, indirect measures were not (e.g., the 16PF) but
could be and were reclassified into the FFM personality dimensions. Birkeland et al.’s
general conclusion was that the sample–weighted mean differences between applicants
and incumbents (which was inferred to represent faking) was a function of the
personality dimension and the test type (i.e., direct versus indirect measure). Although
the current study uses an indirect FFM measure, the results from the present study were
compared to both Birkeland et al.’s indirect and direct measure results.
Griffith et al. (2007) investigated applicant faking on a measure of
conscientiousness using a within–subjects design where applicants were retested as
research participants. Specifically, they constructed confidence intervals around the
participants’ honest scores (i.e., their retest scores) and inferred faking if the
participants’ scores as applicants fell outside the specified band. As a result, 49%, 31%,

16
and 22% of the participants were labeled as fakers using confidence intervals of .5SD,
the standard error of measurement, and the standard error of the difference.

17
CHAPTER II
METHOD
Participants
The study sample was obtained by emailing 9,426 individuals who had
previously completed the cognitive ability and personality tests as part of an unproctored
internet–based assessment system developed and implemented by a large testing firm.
The first administration was for either selection (i.e., test takers were applicants) or
profile development purposes (i.e., test takers were incumbents). Out of the 9,426
individuals contacted, 296 agreed to participate in the study by completing the tests a
second time (also online). Participants must have completed the tests at least one year
prior to the second administration to be invited to participate. This resulted in a response
rate of 3.14%. Test 1 scores were available for all 9,426 individuals, including those who
chose not to participate in the follow–up investigation. Comparisons between those who
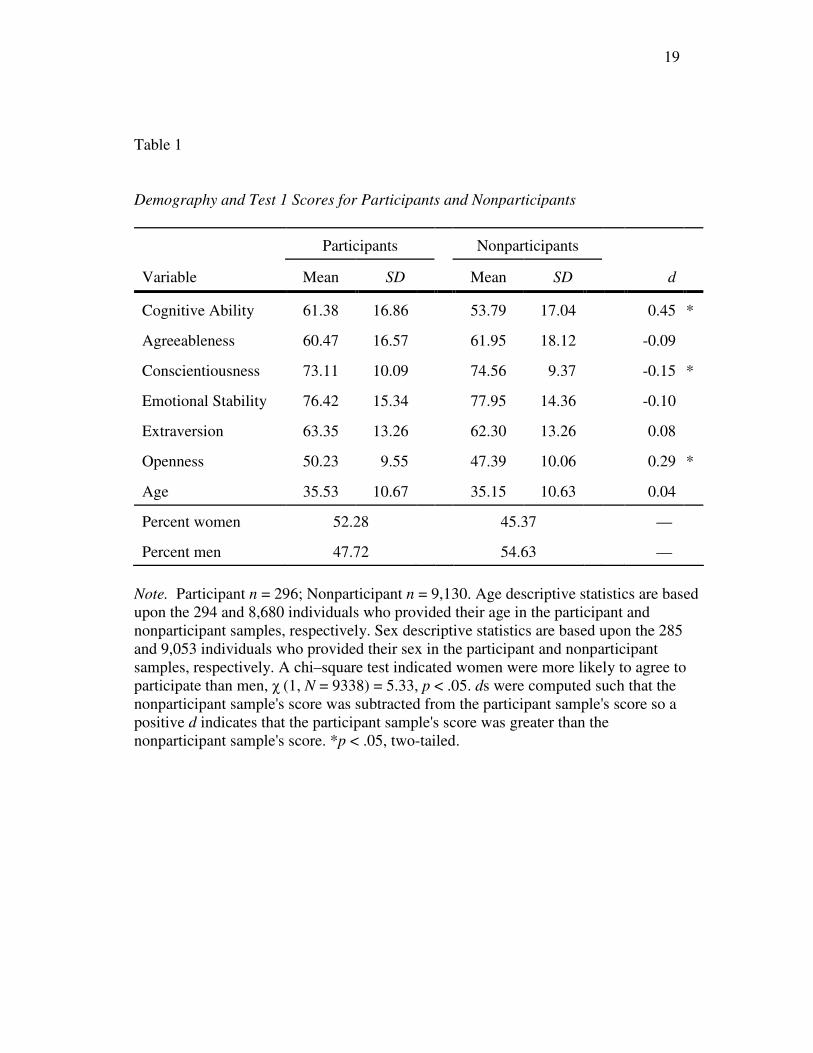
participated and those who did not are presented in Table 1. The mean age of the
participants at Test 1 was 35.53 (SD = 10.67). Of the participants (Test 2), 149 were
women and 136 were men. Eleven participants did not report their sex. There were 234
Caucasians, 24 Asians, 16 African–Americans, 11 Hispanics, and 1 American Indian.
Nine participants reported their race as “other”, and 1 participant did not report her/his
race. The participants’ employment status at Test 2 was 239 full–time, 21 part–time, 22
unemployed, and 13 self–employed with 1 individual not responding. Participants were
compensated with a movie ticket (n = 19), $10 gift card (n = 31), $20 (n = 14), or $20

18
gift card (n = 230) for participating in the study (i.e., Test 2). Two participants did not
receive any compensation for participation.
Because the testing firm uses the tests for a wide range of positions for their
clients, the participants represented a variety of jobs in a number of organizations.
Although the specific job titles for the positions to which they applied were not
available, Table 2 presents the frequencies for the Standard Occupational Classification
(SOC) major groups and the North American Industry Classification System (NAICS)
industry types represented in the data at Test 2. The data in Table 2 are limited to only
instances in which the participant’s organization (at Test 2) was a client of the testing
organization.
The average Test 1/Test 2 retest interval was 429.16 days (SD = 54.84, median =
419.50). The difference between the retest interval for the 2 conditions (applicants
versus incumbents) was not significant, t (294) = 1.55, p > .05, d = 0.28. In addition, the
differences between Test 1 and Test 2 scores were not related to the participants’ retest
interval (cognitive ability = –.06, agreeableness = .01, conscientiousness = –.02,
emotional stability = –.01, openness = –.05, and extraversion = –.13 [p < .05]).
Measures
Cognitive ability test. The cognitive ability test (Arthur, 2004) was a proprietary
internet–based speeded test that consisted of 120 4–alternative multiple choice items
with verbal (64 items) and numeric (56 items) sub–scales. Participants had 20 minutes to
complete the test. The test was scored as the percentage of items answered correctly.
19
Table 1
Demography and Test 1 Scores for Participants and Nonparticipants
Participants Nonparticipants
Variable Mean SD Mean SD d
Cognitive Ability 61.38 16.86 53.79 17.04 0.45 *
Agreeableness 60.47 16.57 61.95 18.12 -0.09
Conscientiousness 73.11 10.09 74.56 9.37 -0.15 *
Emotional Stability 76.42 15.34 77.95 14.36 -0.10
Extraversion 63.35 13.26 62.30 13.26 0.08
Openness 50.23 9.55 47.39 10.06 0.29 *
Age 35.53 10.67 35.15 10.63 0.04
Percent women 52.28 45.37 —
Percent men 47.72 54.63 —
Note. Participant n = 296; Nonparticipant n = 9,130. Age descriptive statistics are based upon the 294 and 8,680 individuals who provided their age in the participant and nonparticipant samples, respectively. Sex descriptive statistics are based upon the 285 and 9,053 individuals who provided their sex in the participant and nonparticipant samples, respectively. A chi–square test indicated women were more likely to agree to participate than men, χ (1, N = 9338) = 5.33, p < .05. ds were computed such that the nonparticipant sample's score was subtracted from the participant sample's score so a positive d indicates that the participant sample's score was greater than the nonparticipant sample's score. *p < .05, two-tailed.

20
Table 2 Frequency of the SOC Major Groups and the NAICS Industry Types in the Test 2 Data
Standard Occupational Classification (SOC) titles Frequency
Management occupations Business and financial operations occupations Computer and mathematical occupations Architecture and engineering occupations Community and social services occupations
Education, training and library occupations Arts, design, entertainment, sports, and media occupations Healthcare practitioners and technical occupations Healthcare support occupations Food preparation and serving related occupations
Personal care and service occupations Sales and related occupations Office and administrative support occupations Construction and extraction occupations Installation, maintenance, and repair occupations
Transportation and material moving occupations Military specific occupations
66 6 4 1 –
– 1 – 2 –
– 13 3 – –
– –
North American Industry Classification System (NAICS) titles
Manufacturing Wholesale retail Retail trade Transportation and warehousing Information
Finance and insurance Real estate and rental and leasing Professional, scientific, and technical services Administrative and support and waste management and remediation services Healthcare and social assistance
Accommodation and food services Other services (except public administration)
22 7 5 – –
35 –
15 – 6
9 –
Note. These data are limited to only the instances in which participant’s organization (at Test 2) was a client of the testing organization.
21
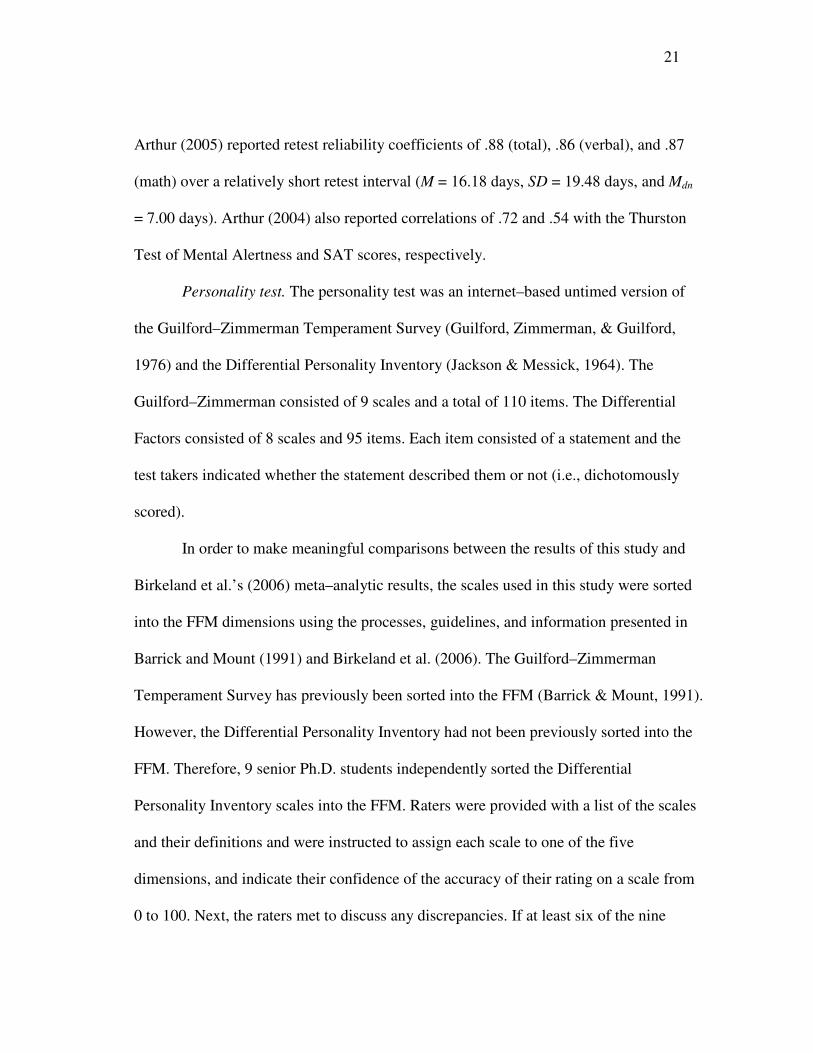
Arthur (2005) reported retest reliability coefficients of .88 (total), .86 (verbal), and .87
(math) over a relatively short retest interval (M = 16.18 days, SD = 19.48 days, and Mdn
= 7.00 days). Arthur (2004) also reported correlations of .72 and .54 with the Thurston
Test of Mental Alertness and SAT scores, respectively.
Personality test. The personality test was an internet–based untimed version of
the Guilford–Zimmerman Temperament Survey (Guilford, Zimmerman, & Guilford,
1976) and the Differential Personality Inventory (Jackson & Messick, 1964). The
Guilford–Zimmerman consisted of 9 scales and a total of 110 items. The Differential
Factors consisted of 8 scales and 95 items. Each item consisted of a statement and the
test takers indicated whether the statement described them or not (i.e., dichotomously
scored).
In order to make meaningful comparisons between the results of this study and
Birkeland et al.’s (2006) meta–analytic results, the scales used in this study were sorted
into the FFM dimensions using the processes, guidelines, and information presented in
Barrick and Mount (1991) and Birkeland et al. (2006). The Guilford–Zimmerman
Temperament Survey has previously been sorted into the FFM (Barrick & Mount, 1991).
However, the Differential Personality Inventory had not been previously sorted into the
FFM. Therefore, 9 senior Ph.D. students independently sorted the Differential
Personality Inventory scales into the FFM. Raters were provided with a list of the scales
and their definitions and were instructed to assign each scale to one of the five
dimensions, and indicate their confidence of the accuracy of their rating on a scale from
0 to 100. Next, the raters met to discuss any discrepancies. If at least six of the nine

22
raters agreed on a dimension, the scale was classified in that dimension. As a result,
seven of the nine scales were classified into the FFM. The remaining two scales and
their constituent items were reviewed by two Ph.D. students and a faculty member. A
scale was classified if consensus was reached. This resulted in the classification of the
two remaining scales (see Appendix A).
The number of items and internal consistency coefficients for the FFM
dimension scores are presented in Table 3. The mean completion times for Test 1
(participants only) of the Guilford–Zimmerman was 114.25 minutes (SD = 1006.5.
median = 12.00) and was 65.38 minutes (SD = 693.65, median = 9.00) for the
Differential Personality Inventory. The mean completion times for Test 2 were 150.84
minutes (SD = 919.78, median = 9.00) and 14.13 minutes (SD = 68.03, median = 7.00)
for the Guilford–Zimmerman and Differential Personality Inventory, respectively.
Procedure
For both test administrations, participants completed the cognitive ability and
personality tests under unproctored internet–based testing conditions. That is, they
logged on to the internet test site whenever they wanted, from any computer, and from
any location of their choosing. As previously noted, test takers who had previously
completed the tests, either as applicants (Test 1, high–stakes) or incumbents who were
requested by their company to complete the measure to generate a profile (Test 1, low–
stakes), were invited via e–mail to retake the tests as research participants. To be invited
to participate in the study, participants must have completed testing at least one year

23
Table 3 FFM Dimensions Descriptive Statistics and Internal Consistency Reliability Coefficients
HL LL
Test 1 Test 2 Test 1 Test 2
FFM Dimension
# of items
M SD α M SD α M SD α M SD α
Agreeableness 22 60.89 16.65 .70 48.61 20.44 .79 58.10 16.06 .68 50.83 17.80 .71
Conscientiousness 58 73.75 09.78 .73 65.13 13.77 .81 69.46 11.17 .70 65.70 11.81 .72
Emotional Stability 20 76.87 15.18 .72 64.09 19.85 .78 73.86 16.13 .74 72.05 17.03 .74
Extraversion 54 63.09 13.14 .81 58.84 14.39 .83 64.83 13.99 .83 62.09 14.47 .83
Openness 51 50.04 09.36 .68 52.77 11.00 .68 50.88 10.71 .73 49.73 10.71 .70
Note. N = 296, HL n = 252, LL n = 44. Test 1 internal consistency estimates for the total sample (i.e., HL + LL) were .69 for agreeableness, .73 for conscientiousness, .72 for emotional stability, .81 for extraversion, and .61 for openness. Test 2 internal consistency estimates for the total sample (i.e., HL + LL) were .78 for agreeableness, .80 for conscientiousness, .78 for emotional stability, .83 for extraversion, and .68 for openness.

24
prior to the second administration. Because Test 2 assessment was for research purposes
and all participants were informed of such when they were recruited, the Test 2
assessment was considered to be low–stakes. This created two groups of participants.
Applicants were considered to have experienced high–stakes testing and low–stakes
retesting (i.e., HL–stakes, n = 252) and incumbents were posited to have experienced
low–stakes during both testing and retesting (i.e., LL–stakes, n = 44). Consequently, the
LL–stakes group was considered to have the least incentive to engage in malfeasant
behaviors during the initial test (Test 1), thus the Test 1/Test 2 difference scores should
be relatively small compared to the HL–stakes group.

25
CHAPTER III
RESULTS
Potential Cheating on Ability Test
Effect of potential cheating on ability test score changes. The observed retest
reliabilities of the cognitive ability test scores were .78, .77, and .84 for the total sample,
HL, and LL participants, respectively (see Table 4). These values are well within the
range of those reported by Hausknecht et al. (2007). Table 4 also presents the
standardized mean differences between the Test 1 and Test 2 cognitive ability test
scores. The results generally indicate that the retest improvements in test scores were
moderate and generally larger than those reported by Hausknecht et al.
A 2 (Group) × 2 (Administration) mixed analysis of variance (ANOVA) was
used to investigate group mean differences. The between–subjects main effect was
nonsignificant indicating that participants across the two groups (HL, LL) did not differ
in their overall cognitive ability test scores (F(1,294) = 101, p > .05, η2 = .00). However,
the within–subjects effect was significant (F (1,294) = 64.35, p < .05, η2 = .18), indicating
an increase in overall cognitive ability test scores from Test 1 to Test 2. Finally, overall
cognitive ability test scores did not increase differentially between groups, that is, the
Group × Administration interaction was not significant (F (1,294) = 1.72, p > .05, η2 = .00).

26
Table 4 Comparison of Cognitive Ability (Unproctored) Test–Retest Standardized Mean
Differences (d) and Reliability Coefficients with Hausknecht et al. (2007) Meta–Analytic
Results
Unproctored
Proctored (Hausknecht et al.)
Total HL LL OpA RschB
Cognitive ability Test 2–Test 1 d
0.39*
0.36*
0.57*
0.27
0.22
Retest reliability .78 .77 .84 .82C
Note. N = 296, HL n = 252, LL n = 44. ds were computed by subtracting the Test 1 scores from the Test 2 scores so a positive d indicates that the Test 2 score is greater than the Test 1 score. AOperational data; Bresearch–based data. CHausknecht et al. do not present an operational/research retest reliability breakdown thus, the reliability estimate is for both settings. For comparative purposes, the mean retest interval for the current study was 429.16 days (SD = 54.84, Mdn = 54.84); in contrast, Hausknecht et al. report a mean of 134.52 days (SD = 304.67, Mdn = 20.00). * p < .05, two–tailed.
To further investigate how participants differed in their responses across the two
administrations of the cognitive ability test, the standard error of measurement of the
difference scores (SEMd) was used to identify individuals who may have engaged in
malfeasance. The SEMd provides an estimate of the range of fluctuation that is likely to
occur between two observed scores, both containing measurement error (e.g., regression
toward the mean). Thus, it represents an estimate of the standard deviation of the normal
distribution of difference scores that an individual would have obtained if he/she took a
test, in principle, an infinite number of times (Gulliksen, 1950).

27
In computing the SEMd, the correlation between the scores of the two
administrations (test–retest reliability) was used as the reliability estimate and the
observed standard deviation of the difference scores as the variability estimate.
Specifically, the formula presented by Dudek (1979 [see Equation 3]; see also Hogan et
al., [2007]) was used and is presented in Equation 1 below and the resultant values are
presented in Table 5.
(1)
where
sd = the standard deviation of the Test 2−Test 1 difference score
rx1x2 = the Test 1/Test 2 correlation.
Table 5 Test 2/Test 1 Difference Score Means and Standard Deviations, Test–Retest
Correlations, and SEMd Values
Variable M SD rx1x2 SEMd
Cognitive Ability 6.81 11.76 .78 7.6
Agreeableness –11.54 18.06 .53 15.31
Conscientiousness –7.90 11.79 .53 10.00
Emotional Stability –11.15 18.08 .49 15.76
Extraversion –4.03 10.21 .73 6.98
Openness 2.08 8.48 .67 6.30
Note. N = 296.
SED = sd √1–rx1x2

28
Next, the differences between individuals’ Test 2 and Test 1 scores were
examined to determine whether the score changes fell above, below, or within 1 SEMd.
This approach resulted in three categories of test patterns. Differences between Test 2
and Test 1 scores that fell within the band (i.e., Test 2 test score did not differ from the
Test 1 test score) were considered to be evidence of stability. Differences between Test 2
and Test 1 scores that fell above the band (i.e., Test 2 test score was greater than the Test
1 score) were considered to be evidence of a practice effect, whereas differences
between Test 2 and Test 1 scores that fell below the band (i.e., Test 2 score was lower
than the Test 1 test score) were considered to be evidence of malfeasance. The results of
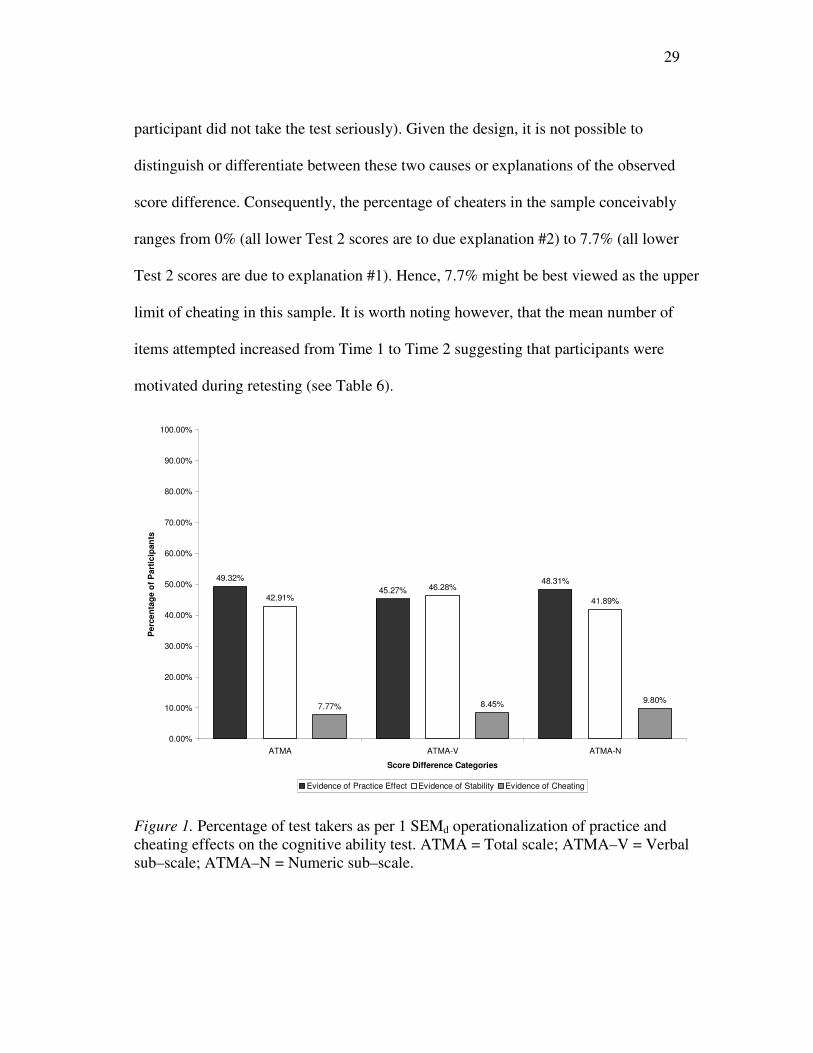
this categorization, which are presented in Figure 1, show that the preponderance of
changes in test scores (49.32%) were indicative of a practice effect (Test 2 score was
greater than the Test 1 score). The results also show that 42.91% of the test score
changes were within 1 SEMd. In contrast, only 7.77% of the scores were indicative of
malfeasance. Consequently, for 92.23% of the participants, the pattern of their test score
differences are more in line with a psychometric than a malfeasance explanation and do
not support the presence of wide–scale score inflation on this speeded ability test as a
result of high–stakes testing. This pattern of results is similar to results reported by Nye,
Do, Drasgow, and Fine (2008) for a perceptual speed test.
In interpreting these data, it should be noted that lower Test 2 scores (which is
inferred to be “cheating”) could be due to (1) the Test 1 score being elevated due to
cheating and the Test 2 score being the “true” score, or (2) the Test 1 score being the
“true” score and the Test 2 score being an unmotivated test performance score (i.e., the
29
participant did not take the test seriously). Given the design, it is not possible to
distinguish or differentiate between these two causes or explanations of the observed
score difference. Consequently, the percentage of cheaters in the sample conceivably
ranges from 0% (all lower Test 2 scores are to due explanation #2) to 7.7% (all lower
Test 2 scores are due to explanation #1). Hence, 7.7% might be best viewed as the upper
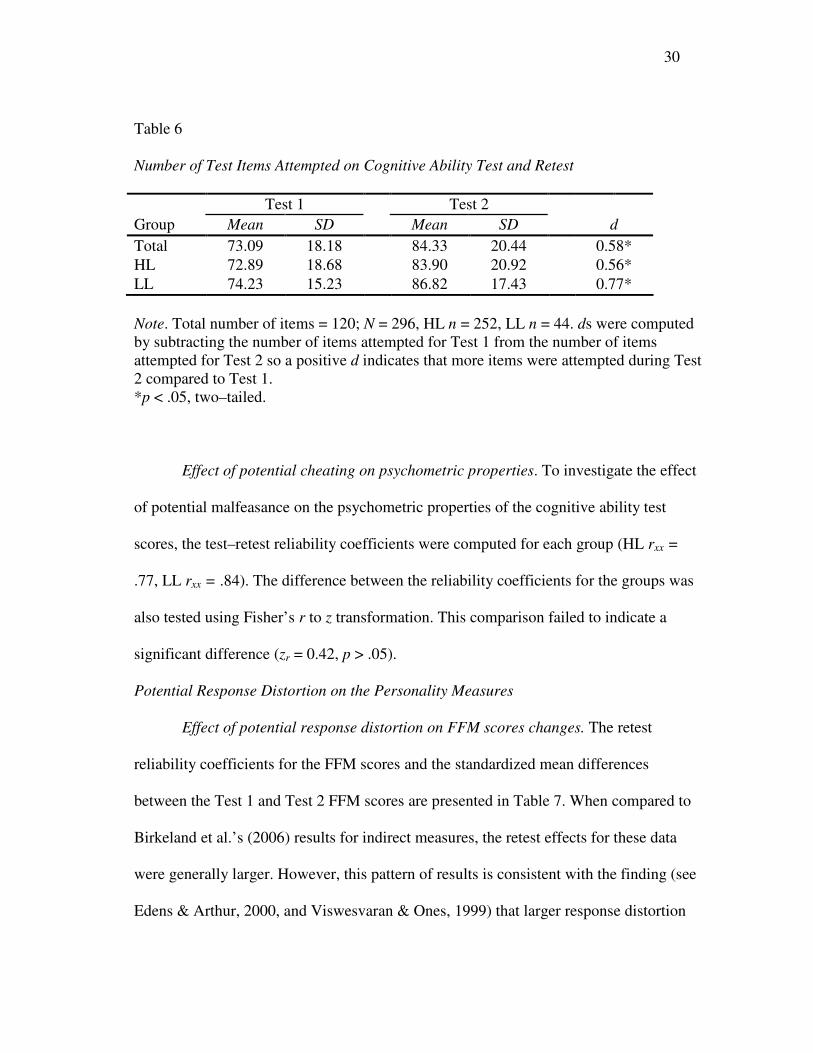
limit of cheating in this sample. It is worth noting however, that the mean number of
items attempted increased from Time 1 to Time 2 suggesting that participants were
motivated during retesting (see Table 6).
49.32%
45.27%48.31%
42.91%
46.28%
41.89%
7.77% 8.45%9.80%
0.00%
10.00%
20.00%
30.00%
40.00%
50.00%
60.00%
70.00%
80.00%
90.00%
100.00%
ATMA ATMA-V ATMA-N
Score Difference Categories
Pe
rce
nta
ge
of
Part
icip
an
ts
Evidence of Practice Effect Evidence of Stability Evidence of Cheating
Figure 1. Percentage of test takers as per 1 SEMd operationalization of practice and cheating effects on the cognitive ability test. ATMA = Total scale; ATMA–V = Verbal sub–scale; ATMA–N = Numeric sub–scale.
30
Table 6 Number of Test Items Attempted on Cognitive Ability Test and Retest
Test 1 Test 2
Group Mean SD Mean SD d
Total 73.09 18.18 84.33 20.44 0.58*
HL 72.89 18.68 83.90 20.92 0.56*
LL 74.23 15.23 86.82 17.43 0.77*
Note. Total number of items = 120; N = 296, HL n = 252, LL n = 44. ds were computed by subtracting the number of items attempted for Test 1 from the number of items attempted for Test 2 so a positive d indicates that more items were attempted during Test 2 compared to Test 1. *p < .05, two–tailed. Effect of potential cheating on psychometric properties. To investigate the effect
of potential malfeasance on the psychometric properties of the cognitive ability test
scores, the test–retest reliability coefficients were computed for each group (HL rxx =
.77, LL rxx = .84). The difference between the reliability coefficients for the groups was
also tested using Fisher’s r to z transformation. This comparison failed to indicate a
significant difference (zr = 0.42, p > .05).
Potential Response Distortion on the Personality Measures
Effect of potential response distortion on FFM scores changes. The retest
reliability coefficients for the FFM scores and the standardized mean differences
between the Test 1 and Test 2 FFM scores are presented in Table 7. When compared to
Birkeland et al.’s (2006) results for indirect measures, the retest effects for these data
were generally larger. However, this pattern of results is consistent with the finding (see
Edens & Arthur, 2000, and Viswesvaran & Ones, 1999) that larger response distortion

31
Table 7 Comparison of FFM Dimensions (Unproctored) Test–Retest Standardized Mean Differences (d) and Reliability Coefficients
with Birkeland et al. (2006) Meta–Analytic Results
Unproctored
Proctored (Birkeland et al.)
FFM Dimensions Total HL LL Direct Indirect
Agreeableness –0.63* (.53) –0.66* (.53) –0.43* (.56) –0.51 0.15
Conscientiousness –0.66* (.53) –0.72* (.55) –0.33* (.49) –0.79 –0.15
Emotional Stability –0.63* (.49) –0.72* (.51) –0.11 (.50) –0.72 –0.24
Extraversion –0.29* (.73) –0.31* (.70) –0.19* (.87) –0.18 –0.07
Openness –0.20* (.67) –0.26* (.66) –0.11 (.75) –0.28 –0.02
Note. N = 296, HL n = 252, LL n = 44. ds were computed by subtracting the Test 1 scores from the Test 2 scores so a positive d indicates that the Test 2 score is greater than the Test 1 score. Test–retest reliability coefficients are in parenthesis. *p < .05, two–tailed.

32
effects are generally obtained for within–subject designs (these data) than between–
subjects designs (Birkeland et al.’s data). However, consistent with Birkeland et al.’s
findings, the effects were not uniform across all FFM personality dimensions with
extraversion and openness displaying smaller mean shifts (i.e., less response distortion)
than agreeableness, conscientiousness, and emotional stability.
Five mixed ANOVAs were also conducted, one for each personality factor, to
test for the statistical significance of the observed mean differences in these data. The
between–subjects main effects were not significant for all analyses, indicating
participants across the two groups (HL, LL) did not differ on any of the FFM personality
dimensions (see Table 3). In addition, with exception of openness (η2 = .00), the with–
subjects effects were significant for all the personality dimensions (η2 = .13, .12, .08, and
.06 for agreeableness, conscientiousness, emotional stability, and extraversion,
respectively). Hence, these results indicate that participants’ scores decreased from Test
1 to Test 2 for all the FFM dimensions except openness. Finally, the Group ×
Administration interaction was significant for conscientiousness (η2 = .02), emotional
stability (η2 = .04), and openness (η2
= .03), indicating that these factors decreased
differentially across groups.
Next, the SEMd was used to further investigate changes in retest scores. In this
instance, differences between Test 2 and Test 1 scores that fell within 1 SEMd (i.e., Test
2 score did not differ from the Test 1 score) were considered to be evidence of stability.
Differences between Test 2 and Test 1 scores that fell above the SEMd (i.e., Test 2 score
was greater than Test 1 score) were considered to be indicative of distort–low response

33
distortion on Test 1. In contrast, differences between Test 2 and Test 1 scores that fell
below the SEMd (i.e., Test 2 score was lower than Test 1 score) were considered to be
indicative of distort–high response distortion on Test 1. The results of these analyses
indicate that with the exception of openness, substantially more test takers distorted high
versus low (see Figure 2 and Table 5). Thus, although most test takers’ scores were
fairly stable, sizeable percentages of the test takers displayed evidence of higher scores
on Test 1 than Test 2 (35.81% on agreeableness, 34.12% on conscientiousness, 33.11%
on emotional stability, 35.81% on extraversion, and 14.53% on openness). Thus, the
results presented here are slightly larger than the results of Griffith et al.’s (2007) study
where 22% (compared to 34.12%) of test takers were identified as distorting their
responses on the first administration of a conscientiousness measure.
Effect of potential response distortion on psychometric properties. To investigate
the effect of potential response distortion on the psychometric properties of the
personality test scores, differences between the test–retest reliability coefficients for the
groups were tested using Fisher’s r to z transformation. The comparison indicated only
extraversion displayed differences in its test–retest reliability coefficient (zr = 2.69, p <
.05). In addition, the retest reliability coefficients were similar in magnitude and range to
those reported for proctored tests using similar designs. For example, Ellingson et al.
(2007) reported average retest reliability coefficients for the California Psychological
Inventory of .66, .62, .57, and .59 for test takers who experienced LL–, LH–, HL–, and
LL–stakes testing conditions, respectively. Additionally, Hogan et al. (2007) reported

34
slightly smaller retest reliability coefficients from test takers who experienced HH–
stakes.
4.39%3.04% 2.03%
12.84%
25.68%
59.80%
62.84%64.86%
51.35%
59.80%
35.81%34.12% 33.11%
35.81%
14.53%
0%
10%
20%
30%
40%
50%
60%
70%
80%
90%
100%
Agreeableness Conscientiousness Emotional Stability Extraversion Openness
Perc
en
tag
e o
f T
est
Takers
Evidence of Response Distortion (Low) Evidence of Stability Evidence of Response Distortion (High)
Figure 2. Percentage of test takers as per 1 SEMd operationalization of response distortion on the personality measure.

35
CHAPTER IV
DISCUSSION AND CONCLUSIONS
A number of summary statements can be made on the basis of the results
reported here. First, the use of a speeded unproctored internet–based ability test resulted
in high–stakes/low–stakes retest effects that were more consonant with a psychometric
practice effect than a malfeasance explanation. Specifically, consistent with
psychometric theory, the Test 2 scores were moderately higher than the Test 1 scores (d
= 0.39). These findings are consistent with those reported by Hausknecht et al. (2007)
who, in a meta–analysis of 50 organizational and educational studies of practice effects
for cognitive ability, obtained a d of 0.21 for practice effects without an intervention
(i.e., no coaching). Furthermore, these results are similar to the findings of Nye et al.
(2008) who administered a perceptual speed test under high–stakes unproctored
conditions then under high–stakes proctored (verification testing). Specifically, they
reported that applicants increased their test score 0.29 SD from Test 1 to Test 2. In the
current study, the higher Test 2 scores provide more support for a psychometric
explanation of test score differences than they do for a malfeasance explanation, which if
supported would have resulted in lower Test 2 scores. In addition, the HL–stakes (n =
252) and LL–stakes (n = 44) groups represented two sharply contrasted groups. The first
administration represented an applicant (high–stakes) versus incumbent (low–stakes)
comparison. Consequently, one would have expected test score differences between
these two groups to be fairly large. However, statistical comparisons failed to obtain

36
significant differences between them. Furthermore, a relatively small percentage of
“cheaters” were identified using the SEMd operationalization. Thus, the results do not
support the presence of widespread score inflation on this speeded ability test as a result
of high–stakes testing. So, it would seem that the use of speeded tests, assuming they are
not at odds with the job requirements, might be one means of alleviating cheating
concerns with unproctored internet–based ability tests. However, although speeded tests
might mitigate cheating–related behaviors that are time dependent, they may do little to
preempt the cheating behaviors that are not temporally demanding (e.g., employing
surrogate test takers or pre–knowledge of test items).
Second, because proctoring is not a technique that is intended to prevent or
minimize response distortion on non–cognitive measures, it was expected that
unproctored internet–based personality measures would display levels of response
distortion similar to those reported for proctored measures in the extant literature.
Specifically, the data reported here display similar standardized mean differences (e.g.,
Birkeland et al., 2006) and similar percentages of “fakers” (Griffith, Chmielowski, &
Yoshita, 2007) as reported in the extant literature. The results of this study support this
supposition. Thus, similar to proctored measures, FFM dimension scores were generally
higher in high–stakes compared to the low–stakes condition. Furthermore, as with
proctored tests, the magnitude of the score shifts was generally higher for agreeableness,
conscientiousness, and emotional stability compared to extraversion and openness.

37
Limitations, Implications, and Directions for Future Research
The low response rate and self–selective nature of the study sample are potential
methodological threats. For instance, one could reasonably speculate that compared to
those who did not engage in malfeasant behaviors in the first administration, individuals
who did engage in this behavior would be less likely to volunteer to participate in the
second administration. So, the results of this study must be interpreted within the context
of this potential threat. Another limitation is that the absence of criterion data did not
allow for the assessment of the comparative criterion–related validity of the cognitive
ability and personality test scores under the different testing conditions. The extant
literature does not address the effects of malfeasance on the criterion–related validity of
ability tests, however, the effects of response distortion on the criterion–related validity
of personality scores has received some attention (see Hough, Eaton, Dunnette Kamp, &
McCloy, 1990; Ones, Viswesvaran, & Reiss, 1996). On the basis of this research, it
would seem that although the true effect of response distortion on the criterion–related
validity of personality test scores remains unclear (Birkeland et al., 2006; Hough, 1998;
Hough et al., 1990; Ones et al., 1996), the impact appears to be low (Schmitt & Oswald,
2006). Nevertheless, the availability of criterion data would have permitted a further
assessment of the effects of unproctored high–stakes cognitive ability and personality
testing.
Finally, the data presented here do not directly assess malfeasance or the lack
thereof. For instance, given the elusive nature of cheating, it is difficult to directly
measure this behavior. In lieu of this, the focus was on changing the psychological

38
conditions (i.e., perceived stakes), instead of the administration conditions (i.e.,
proctored versus unproctored testing). In addition, the test–retest design used did not
suffer from the common limitation of using only incumbent data as both applicant and
incumbent data were included in a within–subjects design. Therefore, changes in test
scores were a function of changes in either malfeasance patterns or practice effects and
the presence or absence of said changes was used to make inferences about the levels of
cheating and response distortion. Consequently, on these bases, for the cognitive ability
test there was no evidence to indicate that wide–scale or systematic malfeasance unduly
affected the test scores or their psychometric properties.
Likewise, inferences about the presence of response distortion on the personality
measure were made on the basis of mean shifts in test scores from the high–stakes to
low–stakes testing conditions, with the expectation that test takers are more likely to
inflate their scores in high–stakes conditions. Whether the mean shift truly represents
“faking” or not could be debated. However, irrespective of one’s position on this issue, it
would not be unreasonable to conclude that the pattern of results obtained for the
unproctored internet–based personality measure is similar to those reported for proctored
measures.
Conclusions
The efficacy of unproctored internet–based employment testing is threatened by
the possible influence of malfeasance on the part of applicants. However, the current
study provides evidence that even under conditions where it is intuitive to expect
widespread cheating (i.e., high–stakes unproctored ability testing), there was no

39
discernable effect on test scores when the testing condition was designed to counter such
behavior. Unproctored internet–based testing using a speeded test format appears to have
reduced the opportunity for and thus the prevalence of malfeasant behavior. Thus, the
use of speeded unproctored internet–based ability tests may be an additional option to
onsite retesting, when a speeded test is consonant with the job relatedness of said tests.
Similarly, these data suggest that using an unproctored internet–based testing
administration does not uniquely threaten personality measures in terms of elevated
levels of response distortion compared to that of proctored tests. Specifically, the pattern
of high– versus low–stakes retest effects observed for unproctored and proctored
personality measures are quite similar.

40
REFERENCES
American Educational Research Association (AERA), American Psychological
Association, & National Council on Measurement in Education (1999).
Standards for educational and psychological testing. Washington, DC: American
Educational Research Association.
Arthur, W. Jr., & Benjamin, L. T. Jr. (1999). Psychology applied to business. In A. M.
Stec, & D. A. Bernstein (Eds.), Psychology: Fields of application (pp. 98–115).
Boston, MA: Houghton Mifflin.
Arthur, W. Jr., Woehr, D. J., & Graziano, W. G. (2001). Personality testing in
employment settings: Problems and issues in the application of typical selection
practices. Personnel Review, 30, 657–676.
Arthur, W. Jr. (2004). Report on the development of an internet–administered general
mental ability test (with verbal and numeric sub–scales). College Station, TX:
Winfred Arthur, Jr. Consulting.
Arthur, W. Jr. (2005). ATMA test–retest reliability study. College Station, TX: Winfred
Arthur, Jr. Consulting.
Baron, H., & Austin, J. (2000). Measuring ability via the Internet: Opportunities and
issues. Paper presented at the 15th Annual Conference of the Society for
Industrial and Organizational Psychology, New Orleans, LA.
Barrick, M. R., & Mount, M. K. (1991). The big five dimensions and job performance:
A meta–analysis. Personnel Psychology, 44, 1–26.

41
Benjamin, T. B. Jr., & Baker, D. B. ( 2004). From seance to science: A history of the
profession of psychology in America. Belmount, CA: Wadsworth/Thomson
Learning.
Birkeland, S. A., Manson, T. M., Kisamore, J. L., Brannick, M. T., & Smith, M. A.
(2006). A meta–analytic investigation of job applicant faking on personality
measures. International Journal of Selection and Assessment, 14, 317–335.
Booth–Kewley, S., Edwards, J. E., & Rosenfeld, P. (1992). Impression management,
social desirability, and computer administration of attitude questionnaires: Does
the computer make a difference? Journal of Applied Psychology, 77, 563–566.
Burke, E. (2008). Preserving the integrity of online testing. In N. P. Tippins (Chair),
Internet testing: Current issues, research, solutions, guidelines, and concerns.
Symposium presented at the 23rd Annual Conference of the Society for Industrial
and Organizational Psychology, San Francisco.
Chizek, G. J. (1999). Cheating on tests: How to do it, detect it, and prevent it. Mahwah,
NJ: Lawrence Erlbaum Associates.
Cullen, M. J., Sackett, P. R., & Lievens, F. (2006). Threats to the operational use of
situational judgment test in the college admission process. International Journal
of Selection and Assessment, 14, 142–155.
Dudek, F. J. (1979). The continuing misinterpretation of the standard error of
measurement. Psychological Bulletin, 86, 335–337.
Edens, P. S., & Arthur, W. Jr. (2000). A meta–analysis investigating the susceptibility of
self–report inventories to distortion. Paper presented at the 15th Annual

42
Conference of the Society for Industrial and Organizational Psychology, New
Orleans, LA.
Ellingson, J. E., Sackett, P. R., & Connelly, B. S. (2007). Personality assessment across
seletion and development contexts: Insights into response distortion. Journal of
Applied Psychology, 92, 386–395.
Foster, D. (2008). Innovative technologies for monitoring test taker behavior online. In
N. P. Tippins (Chair), Internet testing: Current issues, research, solutions,
guidelines, and concerns. Symposium presented at the 23rd Annual Conference
of the Society for Industrial and Organizational Psychology, San Francisco.
Griffith, R. L., Chmielowski, T., Yoshita, Y. (2007). Do applicants fake? An
examination of the frequency of applicant faking behavior. Personnel Review,
36, 341–355.
Guilford, J. S., Zimmerman, W. S., & Guilford, J. P. (1976). The Guilford–Zimmerman
Temperament Survey Handbook: Twenty–five years of research and application.
San Diego, CA: EdITS Publishers.
Gulliksen, H. (1950). Theory of mental tests. New York: Wiley.
Hausknecht, J. P., Halpert, J. A., Di Paolo, N. T., & Moriarty Gerrard, M. O. (2007).
Retesting in selection: A meta–analysis of coaching and practice effects for tests
of cognitive ability. Journal of Applied Psychology, 92, 373–385.
Hogan, J., Barrett, P., & Hogan, R. (2007). Personality measurement, faking, and
employment selection. Journal of Applied Psychology, 92, 1270–1285.

43
Hough, L. M., Eaton, N. K., Dunnette, M. D., Kamp, J. D., & McCloy, R. A. (1990).
Criterion–related validities of personality constructs and the effect of response
distortion on those validities. Journal of Applied Psychology, 75, 581–595.
Hough, L. M. (1998). Effects of intentional distortion in personality measurement and
evaluation of suggested palliatives. Human Performance, 11, 209–244.
Jackson, D. N., & Messick, S. J. (1964). The Differential Personality Inventory
(Form L). Goshen, NY: Research Psychologists Press.
Komar, S., Brown, D. J., Komar, J. A., & Robie, C. (2008). Faking and the vailidity of
conscientiousness: A monte carlo investigation. Journal of Applied Psychology,
93, 140–154.
Levashina, J., & Campion, M. A. (2007). Measuring faking in the employment
interview: Development and validation of an interview faking behavior scale.
Journal of Applied Psychology, 92, 1638–1656.
Levin, R. A., & Zickar, M. J. (2002). Investigating self–presentation, lies, and bullshit:
Understanding faking and its effects on selection decisions using theory, field
research, and simulation. In J. M. Brett, & F. Drasgow (Eds.), The psychology of
work: Theoretically based empirical research (pp. 253–276). Mahwah, NJ:
Lawrence Erlbaum.
Lievens, F., Reeve, C. L., & Heggestad, E. D. (2007). An examination of psychometric
bias due to retesting on cognitive ability tests in selection settings. Journal of
Applied Psychology, 92, 1672–1682.
44
McBride, J. R. (1998). Innovations in computer–based ability testing: Promise,
problems, and perils. In M. D. Hakel (ed.), Beyond multiple choice (pp. 113–
129). Mawah, NJ: Lawrence Erlbaum Associates.
McFarland, L. A., & Ryan, A. M. (2000). Variance in faking across noncognitive
measures. Journal of Applied Psychology, 85, 812–821.
McFarland, L. A., & Ryan, A. M. (2006). Toward an integrated model of applicant
faking behavior. Journal of Applied Social Psychology, 36, 979–1016.
Mead, A. D., & Drasgow, F. (1993). Equivalence of computerized and paper–and–pencil
cognitive ability tests: A meta–analysis. Psychological Bulletin, 114, 449–458.
Messick, S. (1995). Validity of psychological assessment: Validation of inferences from
persons' responses and performances as scientific inquiry into score meaning.
American Psychologist, 50, 741–749.
Nye, C. D., Do, Ben–Roy, Drasgow, F., & Fine, S. (2008). Two–step testing in
employee selection: Is score inflation a problem? International Journal of
Selection and Assessment, 16, 112–120.
Ones, D. S., Viswesvaran, C., & Reiss, A. D. (1996). Role of social desirable in
personality testing for personnel selection: The red herring. Journal of Applied
Psychology, 81, 660–679.
Paulhus, D. L. (2002). Socially desirable responding: The evolution of the construct. In
H. Braun, D. Jackson, and D. Wiley (Eds.), The role of constructs in
psychological and educational measurement (pp. 49–69). Mahwah, NJ:
Lawrence Erlbaum Associates.

45
Pearlman, K., (2009). Unproctored internet testing: Practical, legal, and ethical concerns.
Industrial and Organizational Perspectives, 2, 14-19.
Potosky, D., & Bobko, P. (2004). Selection testing via the internet: Practical
considerations and exploratory empirical findings. Personnel Psychology, 57,
1003–1034.
Richman, W. L., Kiesler, S., Weisband, S., & Drasgow, F. (1999). A meta–analytic
study of social desirability in computer–administered questionnaires, traditional
questionnaires, and interviews. Journal of Applied Psychology, 84, 754–755.
Sackett, P. R., & Lievens, F. (2008). Personnel selection. Annual Review of Psychology,
59, 419–450.
Schmidt, F. L., & Hunter, J. E. (1998). The validity and utility of selection methods in
personnel psychology: Practical and theoretical implications of 85 years of
research findings. Psychological Bulletin, 124, 262–273.
Schmidt, F. L. (2002). The role of general cognitive ability and job performance: Why
there cannot be a debate. Human Performance, 15, 187–211.
Schmitt, N., & Kunce, C. (2002). The effects of elaboration on answers to biodata
questions. Personnel Psychology, 55, 569–587.
Schmitt, N., & Oswald, F. L. (2006). The impact of corrections for faking on the validity
of noncognitive measures in selection settings. Journal of Applied Psychology,
91, 613–621.

46
Tippins, N. P., Beaty, J., Drasgow, F., Wade, M. W., Pearlman, K., Segall, D. O., &
Shepherd, W. (2006). Unproctored internet testing in employment settings.
Personnel Psychology, 59, 189–225.
Viswesvaran, C., & Ones, D. S. (1999). Meta–analyses of fakability estimates:
Implications for personality measurement. Educational and Psychological
Measurement, 59, 197–210.
Whitley, B. E. (1998). Factors associated with cheating among college students: A
review. Research in Higher Education, 39, 235–274.
Zickar, M. J., & Robie, C. (1999). Modeling faking good on personality items: An item
level analysis. Journal of Applied Psychology, 84, 551–563.

47
APPENDIX A
Five Factor Model Dimensions Inventory
Emotional Stability Extraversion Openness Agreeableness Conscientiousness
Guilford– Zimmerman
Emotional Consistency
Ascendance Thoughtfulness Personal Relations General Activity
Objectivity Sociability Friendliness Restraint
Differential Factors
Adventure vs. Security
Likes Thinking Realistic Thinking
Need for Attention Need for Freedom from Structure
Self–Reliance
Need for Diversion Cultural Conformity
VITA
Ryan Matthew Glaze
Department of Psychology Texas A&M University College Station, TX 77843–4235 Education August 2009 Texas A&M University, College Station, Texas M.S. – Psychology May 2005 University of Oklahoma, Norman, Oklahoma B.A. – Psychology Research Experience Graduate Student Research Assistant
2005–2008 Supervisor: Winfred Arthur, Jr., Ph.D. Texas A&M University Undergraduate Research Assistant 2005–2005 Supervisor: Eric Day, Ph.D. University of Oklahoma 2003–2004 Supervisor: Luz–Eugenia Cox–Fuenzalida, Ph.D. University of Oklahoma