Glasgow University Staff Survey 2012 University Services Presentation
25
Glasgow University Staff Survey 2012 University Services Presentation Ian Black, HR Director University of Glasgow
description
Glasgow University Staff Survey 2012 University Services Presentation. Ian Black, HR Director University of Glasgow. Purpose of GU 2012 Staff Survey. 1. To measure: Staff Involvement Staff Commitment Staff Wellbeing 2. To determine: Actions for building on favourable findings - PowerPoint PPT Presentation
Transcript of Glasgow University Staff Survey 2012 University Services Presentation
Glasgow University Staff Survey 2012University Services Presentation
Ian Black, HR DirectorUniversity of Glasgow
GU 2012 staff survey - University Services
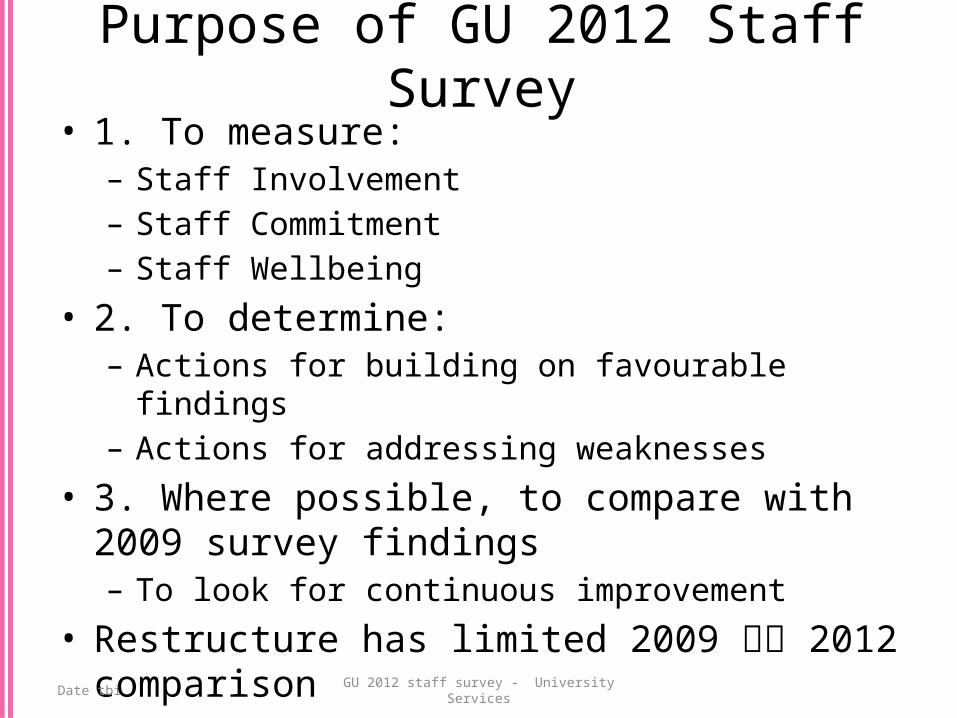
Purpose of GU 2012 Staff Survey• 1. To measure:
– Staff Involvement– Staff Commitment– Staff Wellbeing
• 2. To determine: – Actions for building on favourable findings – Actions for addressing weaknesses
• 3. Where possible, to compare with 2009 survey findings– To look for continuous improvement
• Restructure has limited 2009 2012 comparison
Date tbi
GU 2012 staff survey - University Services
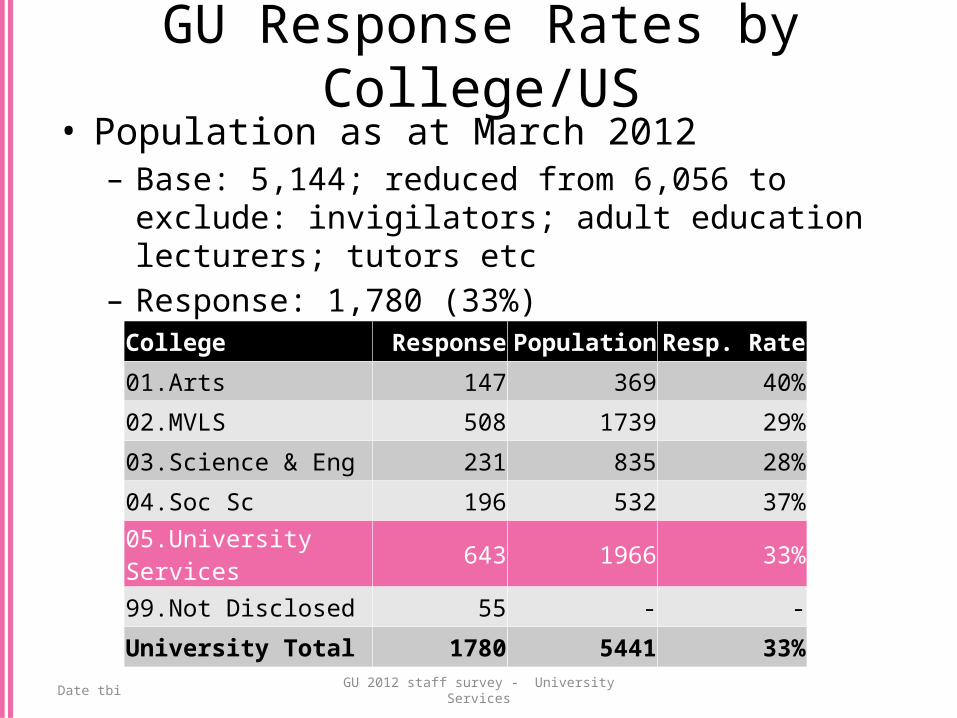
GU Response Rates by College/US• Population as at March 2012
– Base: 5,144; reduced from 6,056 to exclude: invigilators; adult education lecturers; tutors etc
– Response: 1,780 (33%)
Date tbi
College Response PopulationResp. Rate01.Arts 147 369 40%02.MVLS 508 1739 29%03.Science & Eng 231 835 28%04.Soc Sc 196 532 37%05.University Services 643 1966 33%99.Not Disclosed 55 - -University Total 1780 5441 33%
GU 2012 staff survey - University Services
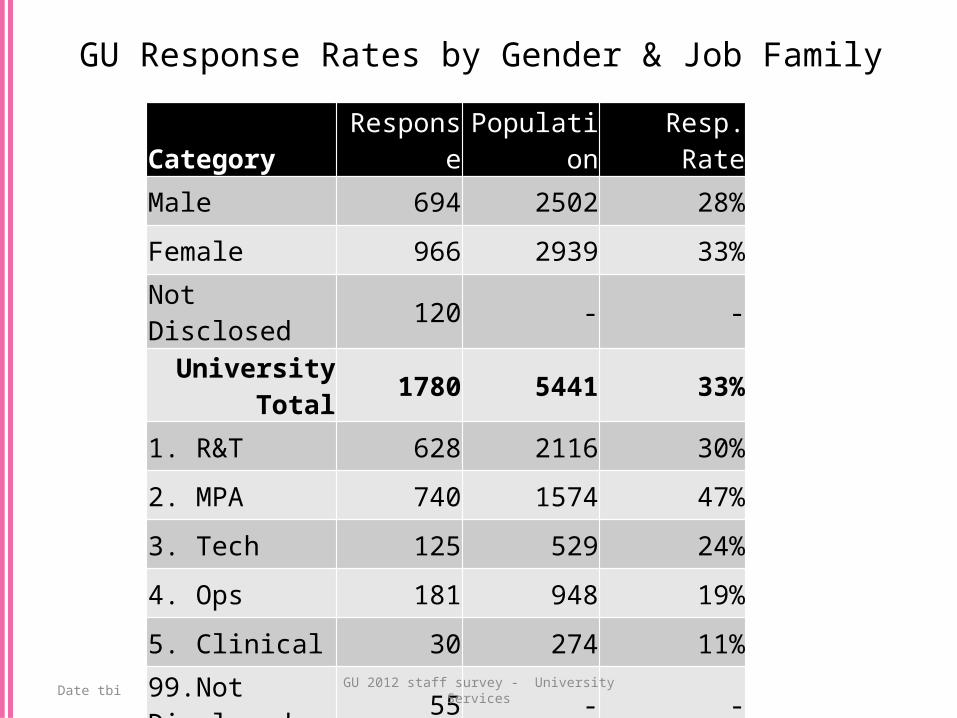
GU Response Rates by Gender & Job Family
Category Response Population Resp. RateMale 694 2502 28%
Female 966 2939 33%
Not Disclosed 120 - -
University Total 1780 5441 33%
1. R&T 628 2116 30%
2. MPA 740 1574 47%
3. Tech 125 529 24%
4. Ops 181 948 19%
5. Clinical 30 274 11%
99.Not Disclosed 55 - -
University Total 1780 5441 33%
Date tbi
GU 2012 staff survey - University Services
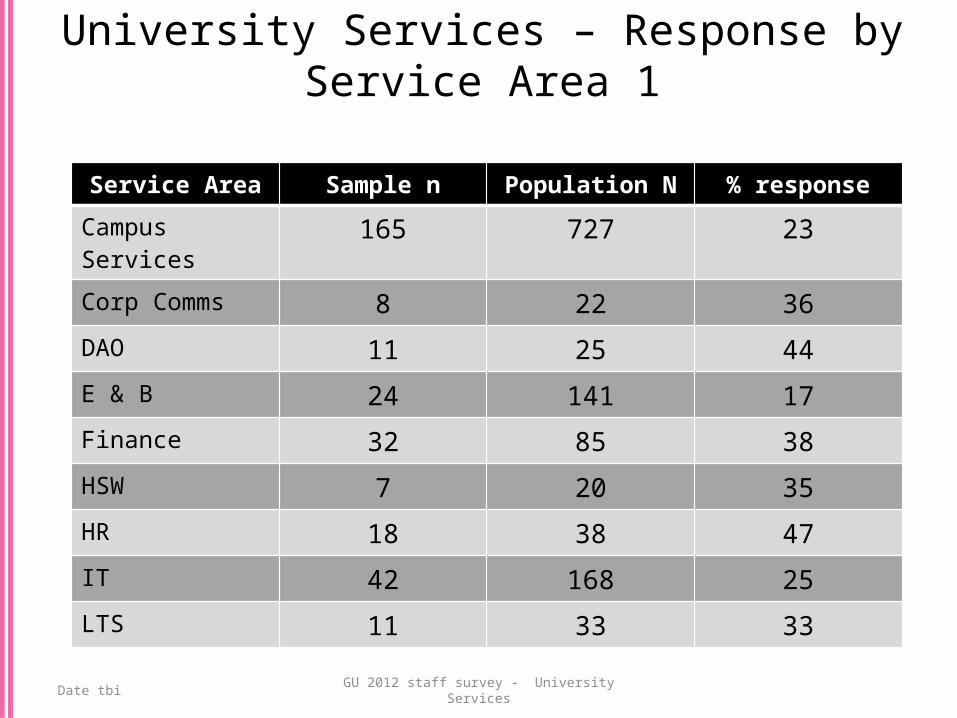
University Services – Response by Service Area 1
Date tbi
Service Area Sample n Population N % response
Campus Services 165 727 23Corp Comms 8 22 36DAO 11 25 44E & B 24 141 17Finance 32 85 38HSW 7 20 35HR 18 38 47IT 42 168 25LTS 11 33 33
GU 2012 staff survey - University Services
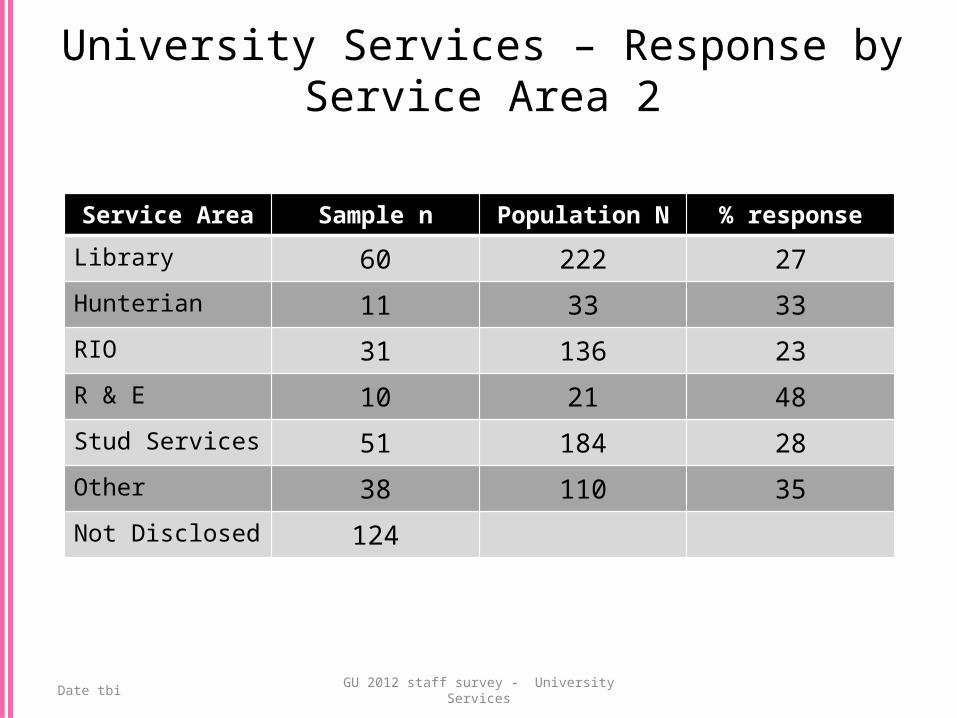
University Services – Response by Service Area 2
Date tbi
Service Area Sample n Population N % response
Library 60 222 27Hunterian 11 33 33RIO 31 136 23R & E 10 21 48Stud Services 51 184 28Other 38 110 35Not Disclosed 124
GU 2012 staff survey - University Services
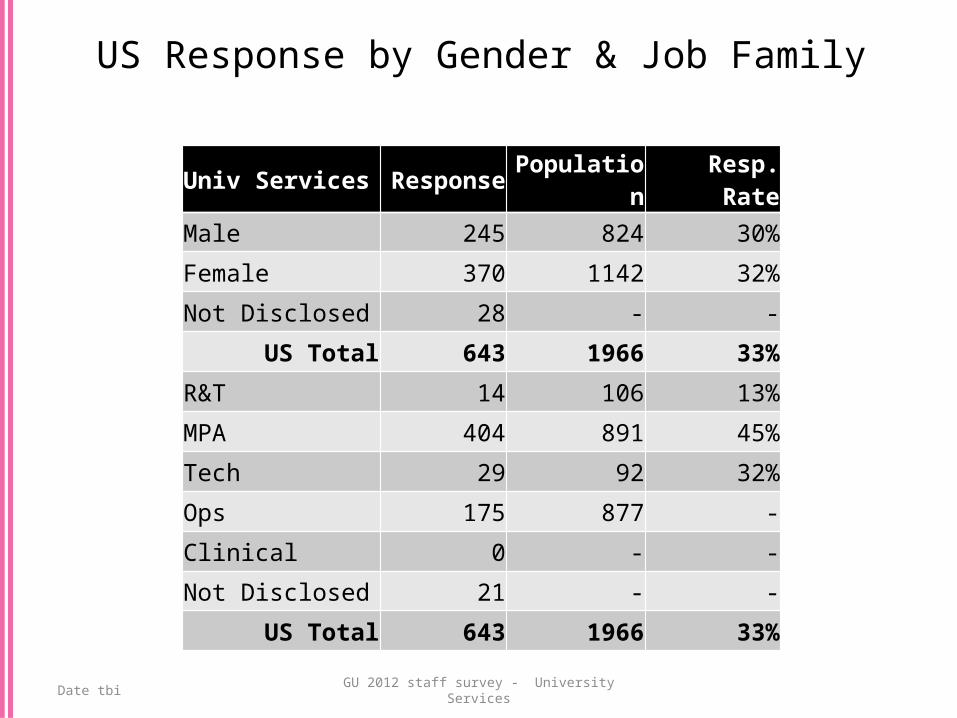
US Response by Gender & Job Family
Date tbi
Univ Services Response Population Resp. RateMale 245 824 30%
Female 370 1142 32%
Not Disclosed 28 - -
US Total 643 1966 33%R&T 14 106 13%
MPA 404 891 45%
Tech 29 92 32%
Ops 175 877 -
Clinical 0 - -
Not Disclosed 21 - -
US Total 643 1966 33%
GU 2012 staff survey - University Services
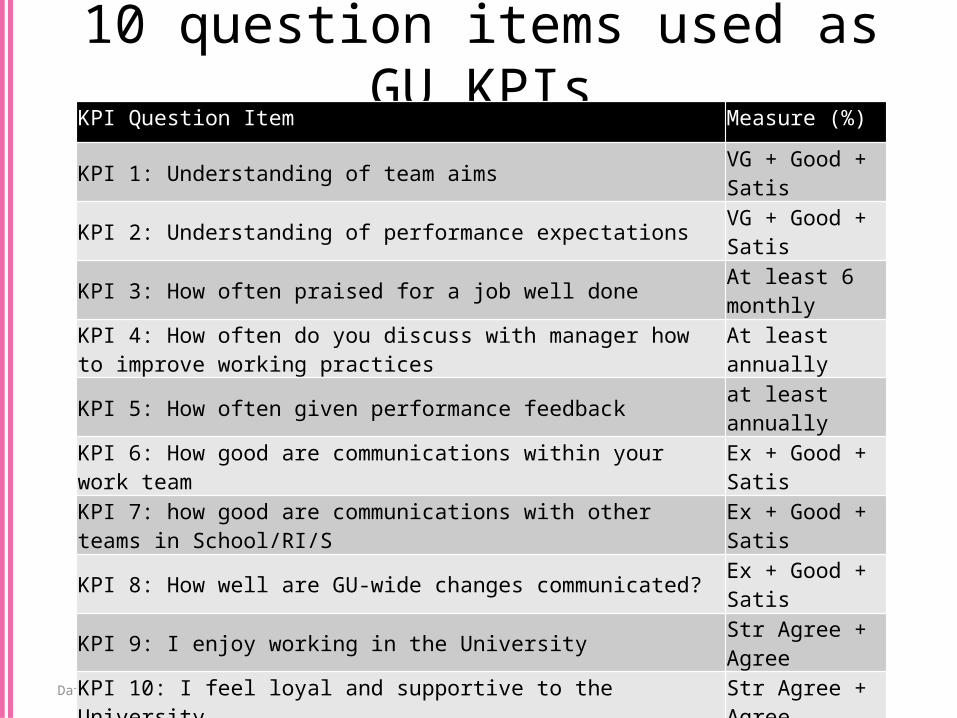
10 question items used as GU KPIs
Date tbi
KPI Question Item Measure (%)
KPI 1: Understanding of team aims VG + Good + Satis
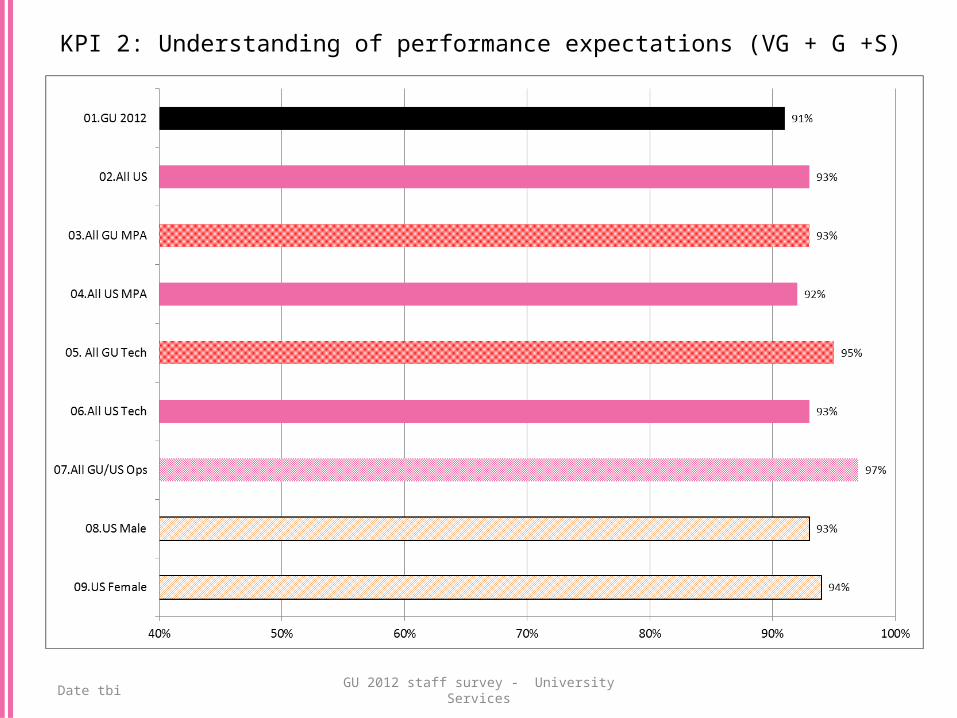
KPI 2: Understanding of performance expectations VG + Good + Satis
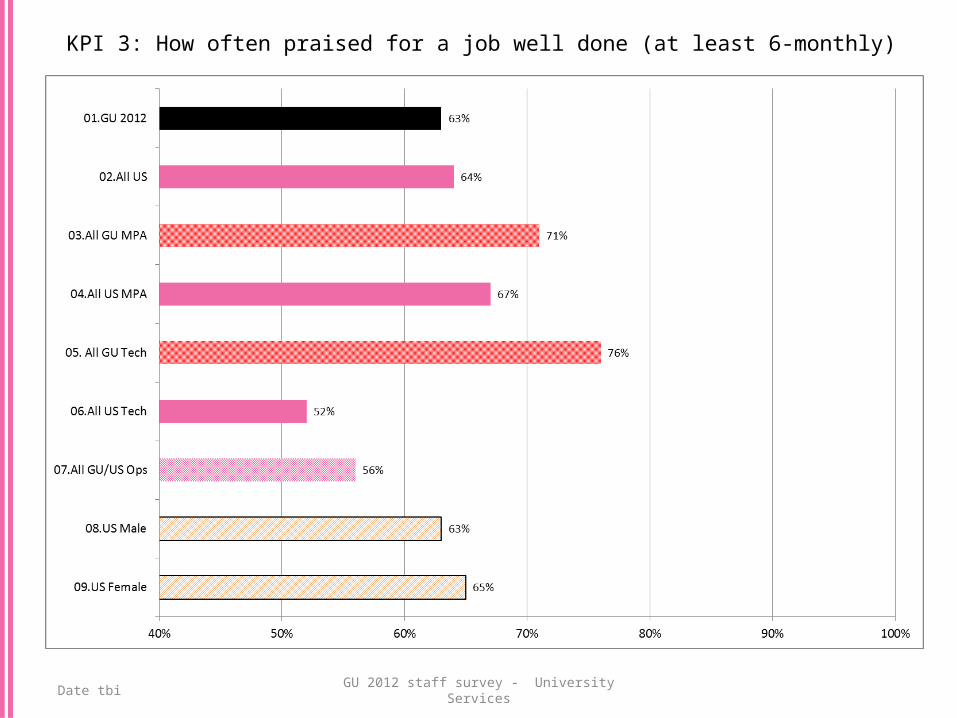
KPI 3: How often praised for a job well done At least 6 monthly
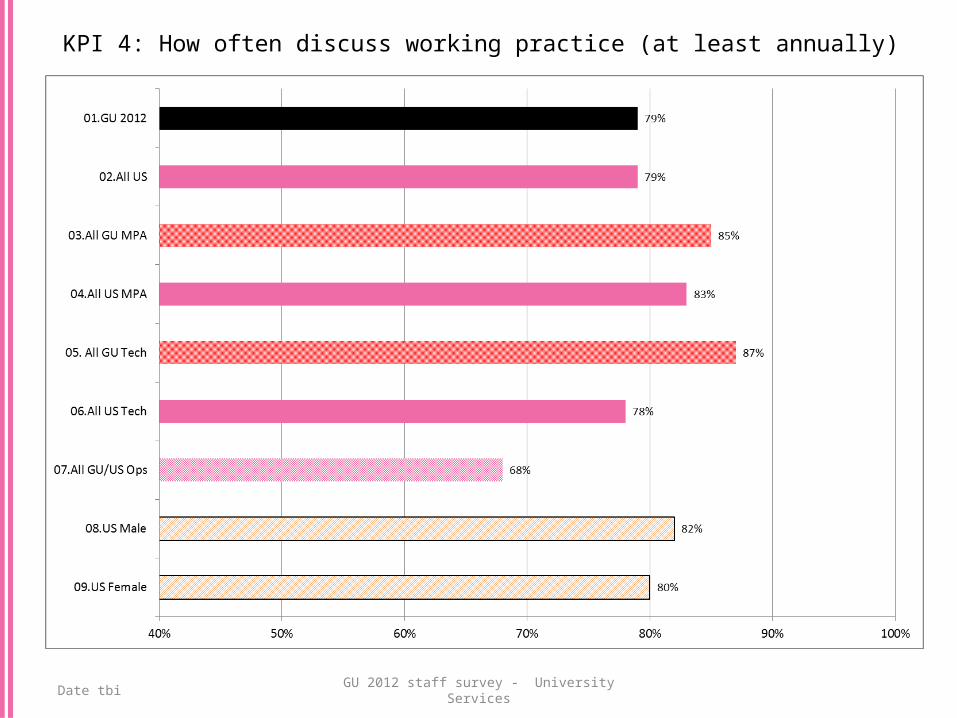
KPI 4: How often do you discuss with manager how to improve working practices At least annually
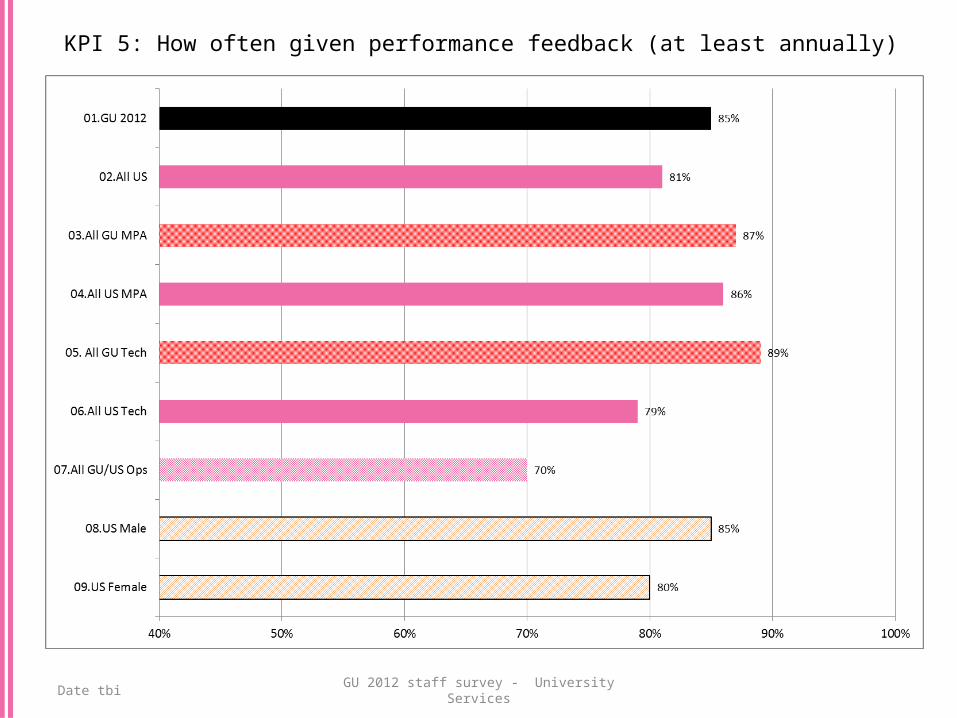
KPI 5: How often given performance feedback at least annually
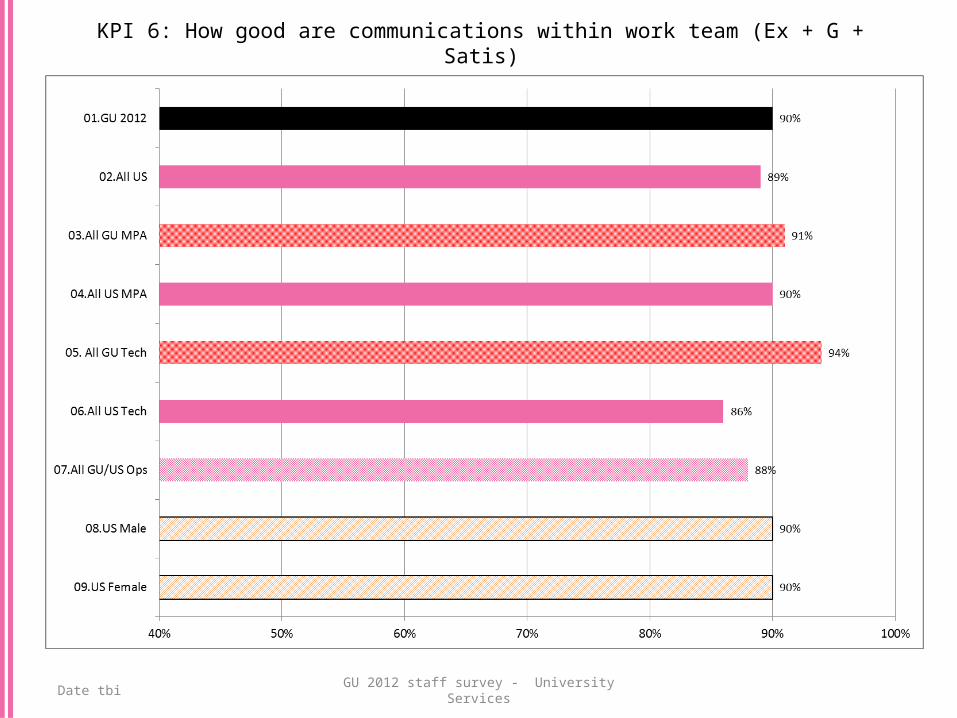
KPI 6: How good are communications within your work team Ex + Good + Satis
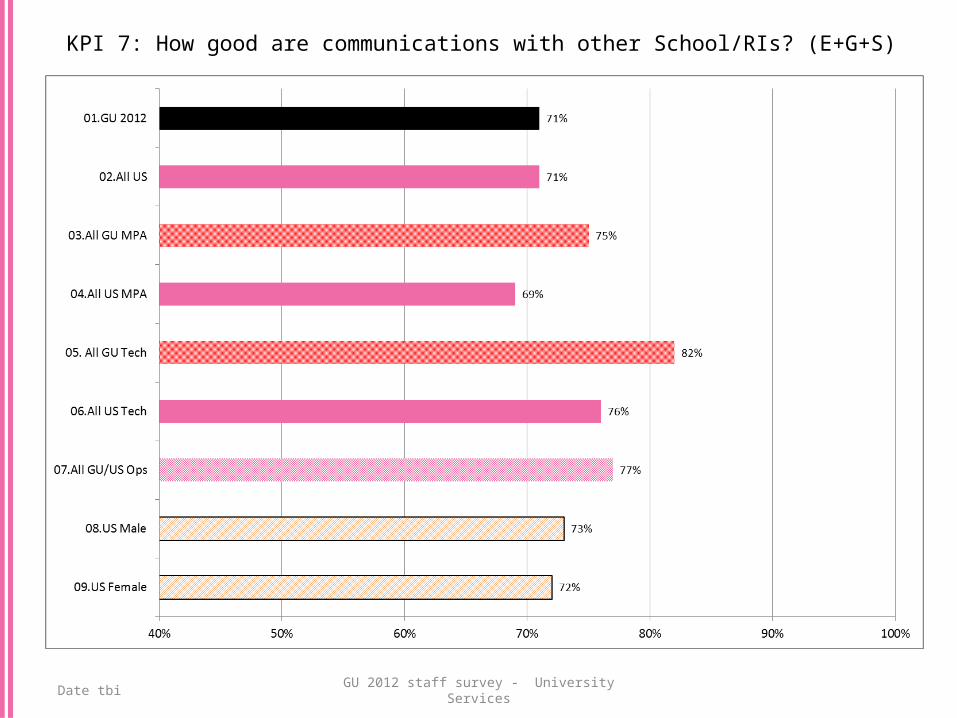
KPI 7: how good are communications with other teams in School/RI/S Ex + Good + Satis
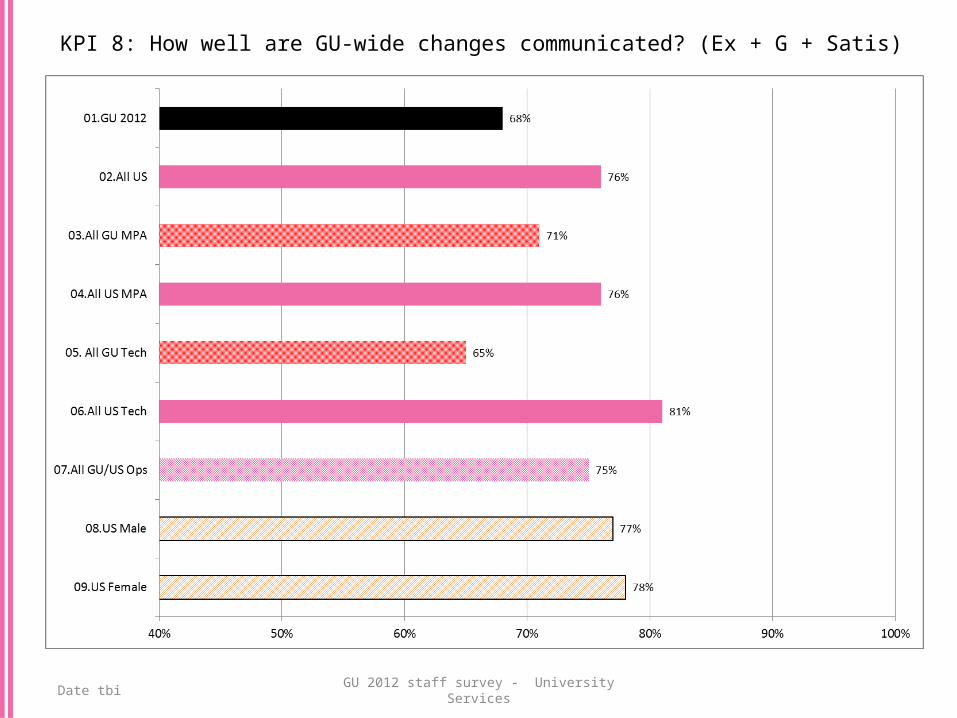
KPI 8: How well are GU-wide changes communicated? Ex + Good + Satis
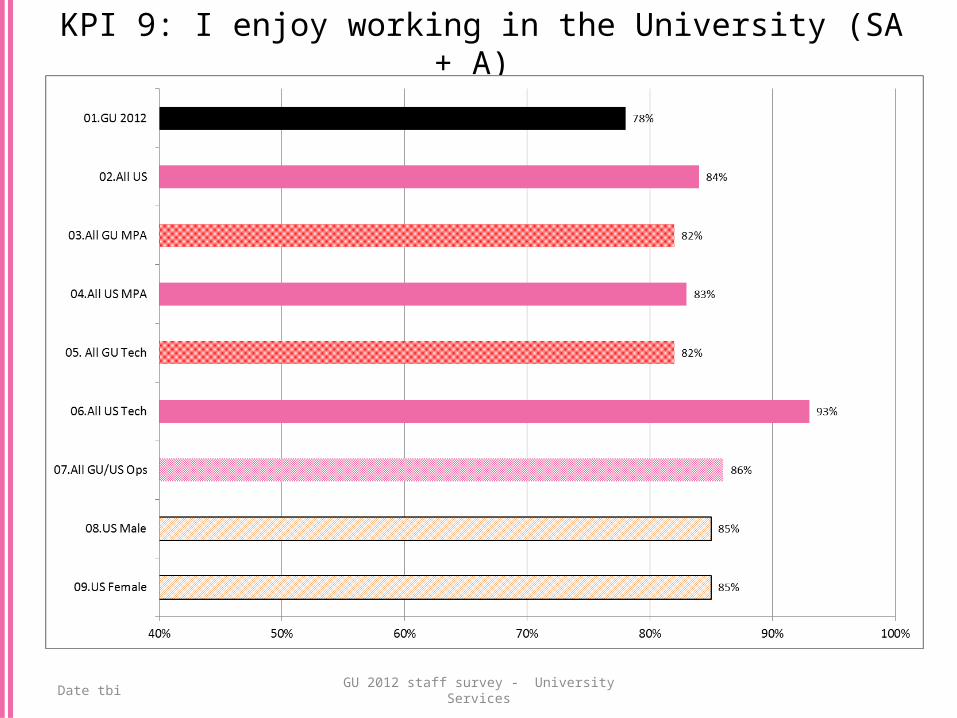
KPI 9: I enjoy working in the University Str Agree + Agree
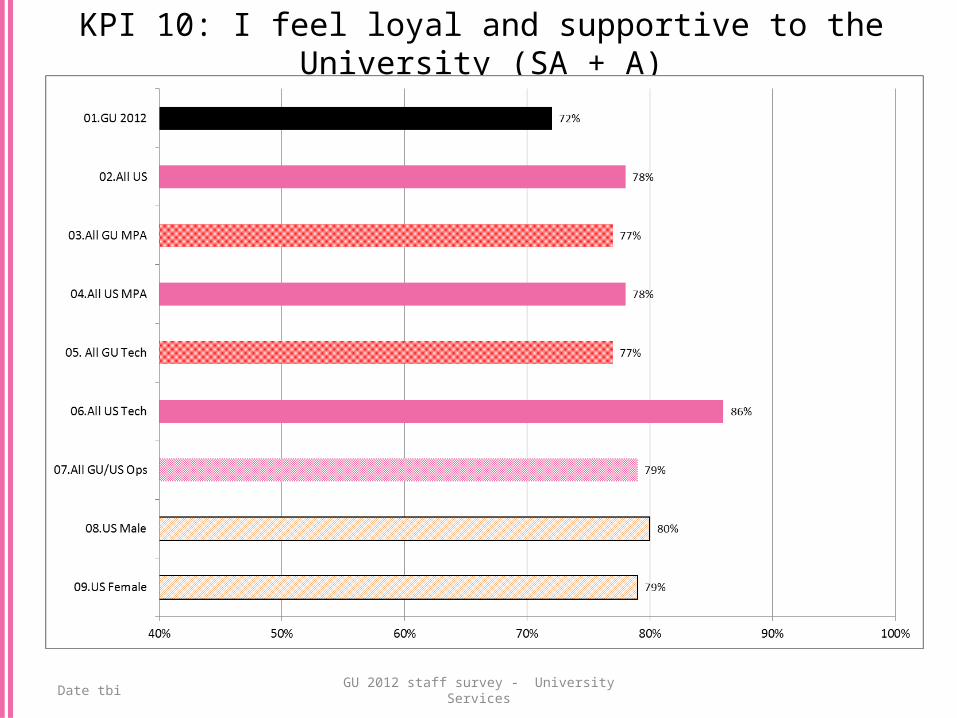
KPI 10: I feel loyal and supportive to the University Str Agree + Agree
GU 2012 staff survey - University Services
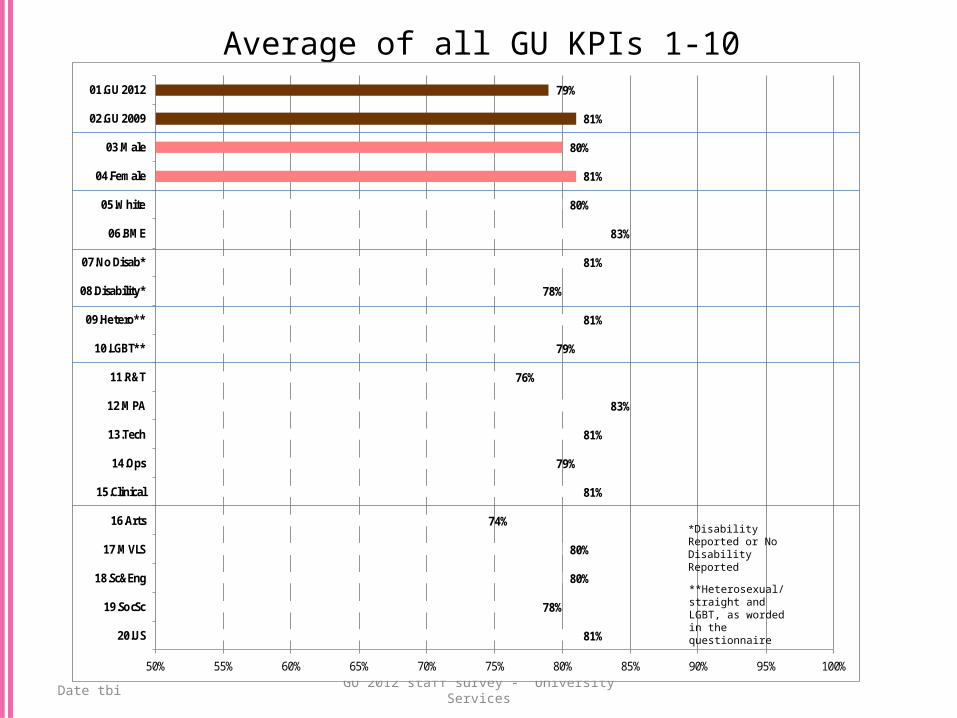
Average of all GU KPIs 1-10
Date tbi
81%
78%
80%
80%
74%
81%
79%
81%
83%
76%
79%
81%
78%
81%
83%
80%
81%
80%
81%
79%
50% 55% 60% 65% 70% 75% 80% 85% 90% 95% 100%
20.US
19.SocSc
18.Sc&Eng
17.MVLS
16.Arts
15.Clinical
14.Ops
13.Tech
12.MPA
11.R&T
10.LGBT**
09.Hetero**
08.Disability*
07.No Disab*
06.BME
05.White
04.Female
03.Male
02.GU 2009
01.GU 2012
**Heterosexual/straight and LGBT, as worded in the questionnaire
*Disability Reported or No Disability Reported
GU 2012 staff survey - University Services
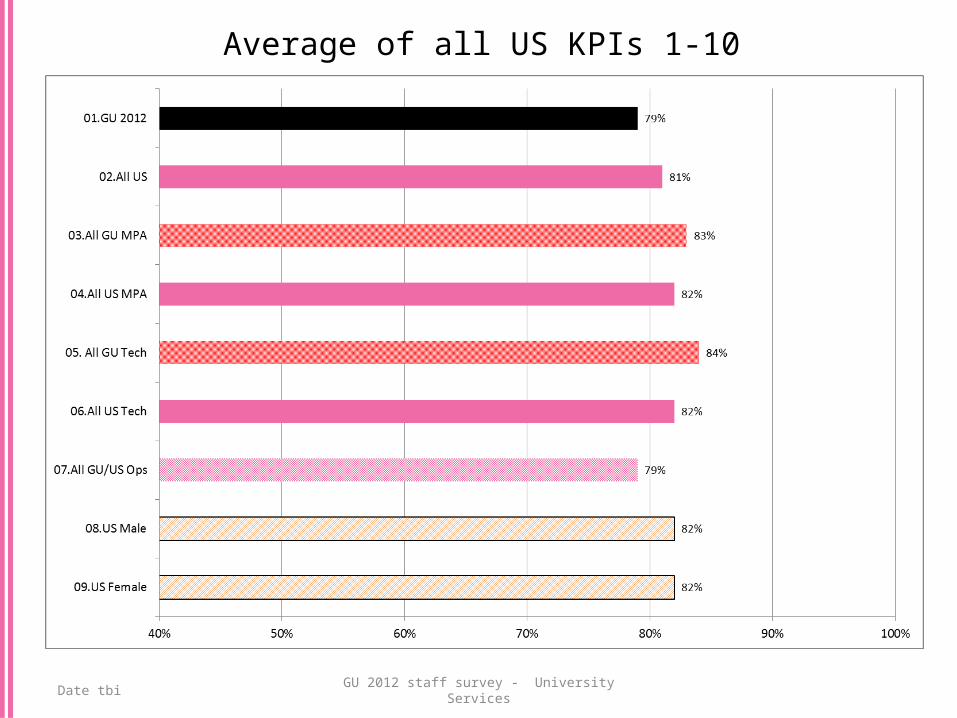
Average of all US KPIs 1-10
Date tbi
GU 2012 staff survey - University Services
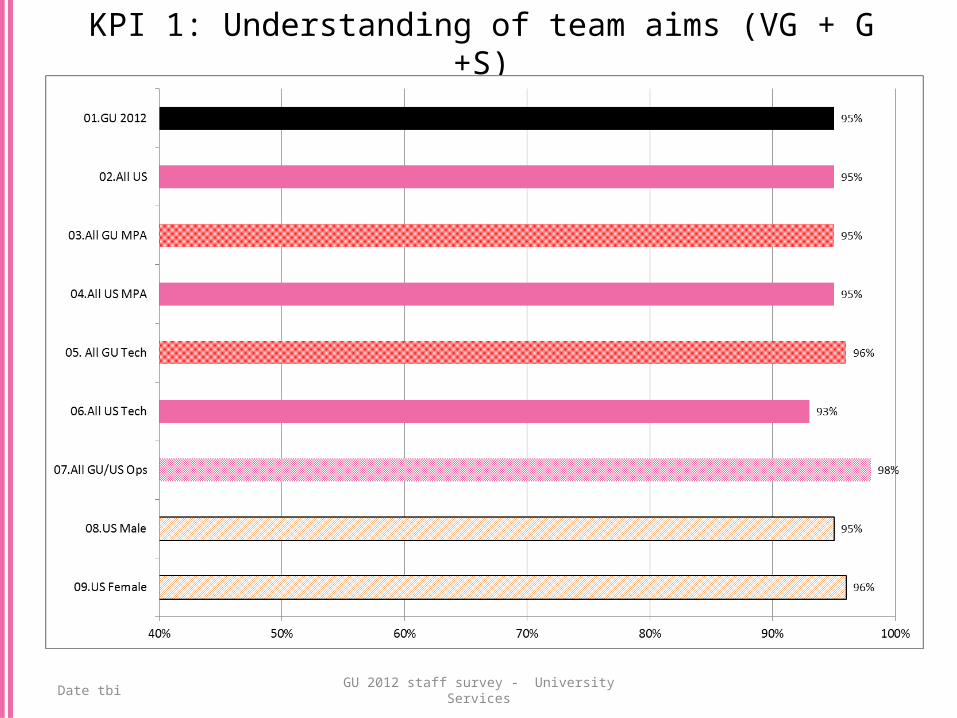
KPI 1: Understanding of team aims (VG + G +S)
Date tbi
GU 2012 staff survey - University Services
KPI 2: Understanding of performance expectations (VG + G +S)
Date tbi
GU 2012 staff survey - University Services
KPI 3: How often praised for a job well done (at least 6-monthly)
Date tbi
GU 2012 staff survey - University Services
KPI 4: How often discuss working practice (at least annually)
Date tbi
GU 2012 staff survey - University Services
KPI 5: How often given performance feedback (at least annually)
Date tbi
GU 2012 staff survey - University Services
KPI 6: How good are communications within work team (Ex + G + Satis)
Date tbi
GU 2012 staff survey - University Services
KPI 7: How good are communications with other School/RIs? (E+G+S)
Date tbi
GU 2012 staff survey - University Services
KPI 8: How well are GU-wide changes communicated? (Ex + G + Satis)
Date tbi
GU 2012 staff survey - University Services
KPI 9: I enjoy working in the University (SA + A)
Date tbi
GU 2012 staff survey - University Services
KPI 10: I feel loyal and supportive to the University (SA + A)
Date tbi
HSE Stress Measurement Tool - Findings
GU 2012 staff survey - University Services
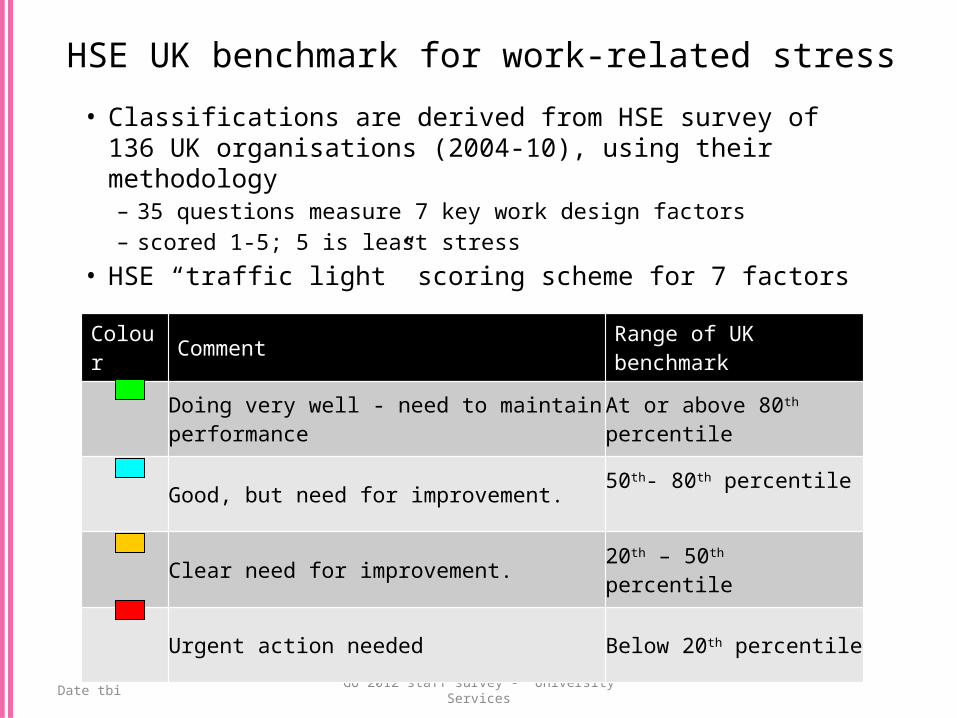
HSE UK benchmark for work-related stress• Classifications are derived from HSE survey of 136 UK
organisations (2004-10), using their methodology– 35 questions measure 7 key work design factors – scored 1-5; 5 is least stress
• HSE “traffic light” scoring scheme for 7 factors
Date tbi
Colour Comment Range of UK benchmark
Doing very well - need to maintain performance At or above 80th percentile
Good, but need for improvement. 50th- 80th percentile
Clear need for improvement. 20th – 50th percentile
Urgent action needed Below 20th percentile
GU 2012 staff survey - University Services
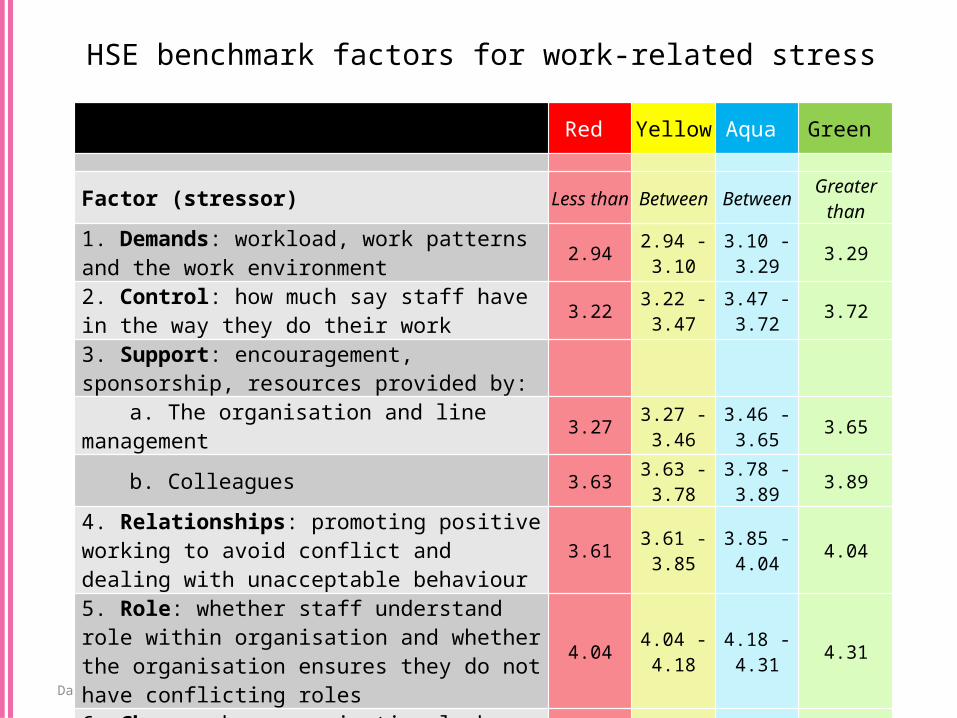
HSE benchmark factors for work-related stress
Date tbi
Red Yellow Aqua Green
Factor (stressor) Less than Between Between Greater than
1. Demands: workload, work patterns and the work environment 2.94 2.94 - 3.10 3.10 - 3.29 3.29
2. Control: how much say staff have in the way they do their work 3.22 3.22 - 3.47 3.47 - 3.72 3.72
3. Support: encouragement, sponsorship, resources provided by:
a. The organisation and line management 3.27 3.27 - 3.46 3.46 - 3.65 3.65
b. Colleagues 3.63 3.63 - 3.78 3.78 - 3.89 3.89
4. Relationships: promoting positive working to avoid conflict and dealing with unacceptable behaviour 3.61 3.61 - 3.85 3.85 - 4.04 4.04
5. Role: whether staff understand role within organisation and whether the organisation ensures they do not have conflicting roles
4.04 4.04 - 4.18 4.18 - 4.31 4.31
6. Change: how organisational change (large or small) is managed and communicated in the organisation
2.79 2.79 - 3.04 3.04 - 3.24 3.24
GU 2012 staff survey - University Services
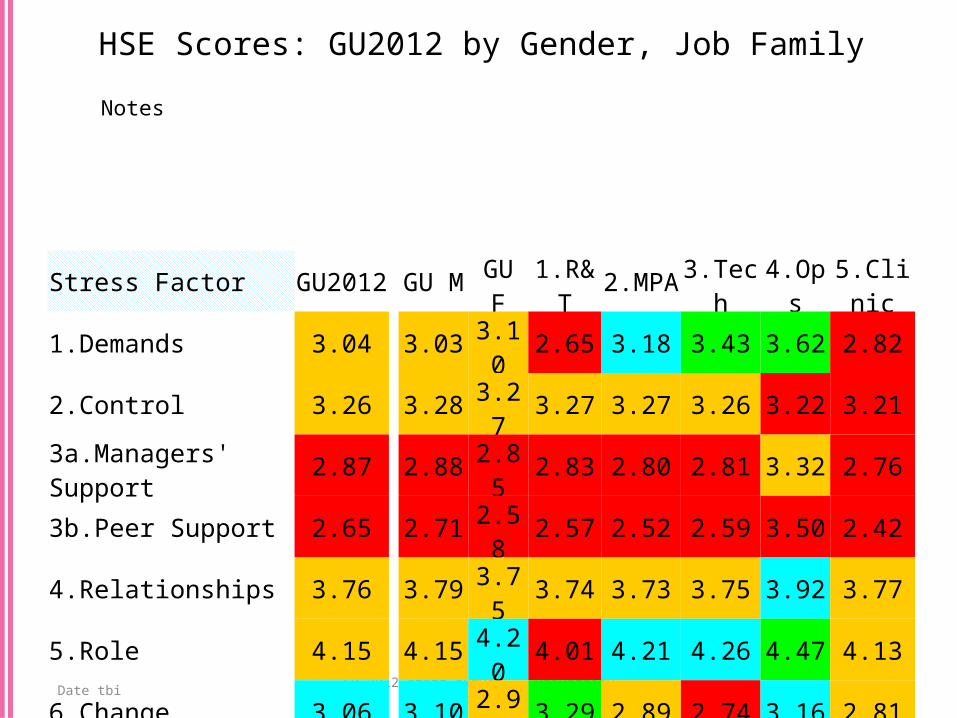
HSE Scores: GU2012 by Gender, Job Family
Date tbi
Notes
Stress Factor GU2012 GU M GU F 1.R&T 2.MPA 3.Tech 4.Ops 5.Clinic1.Demands 3.04 3.03 3.10 2.65 3.18 3.43 3.62 2.822.Control 3.26 3.28 3.27 3.27 3.27 3.26 3.22 3.213a.Managers' Support 2.87 2.88 2.85 2.83 2.80 2.81 3.32 2.763b.Peer Support 2.65 2.71 2.58 2.57 2.52 2.59 3.50 2.424.Relationships 3.76 3.79 3.75 3.74 3.73 3.75 3.92 3.775.Role 4.15 4.15 4.20 4.01 4.21 4.26 4.47 4.136.Change 3.06 3.10 2.96 3.29 2.89 2.74 3.16 2.81
GU 2012 staff survey - University Services
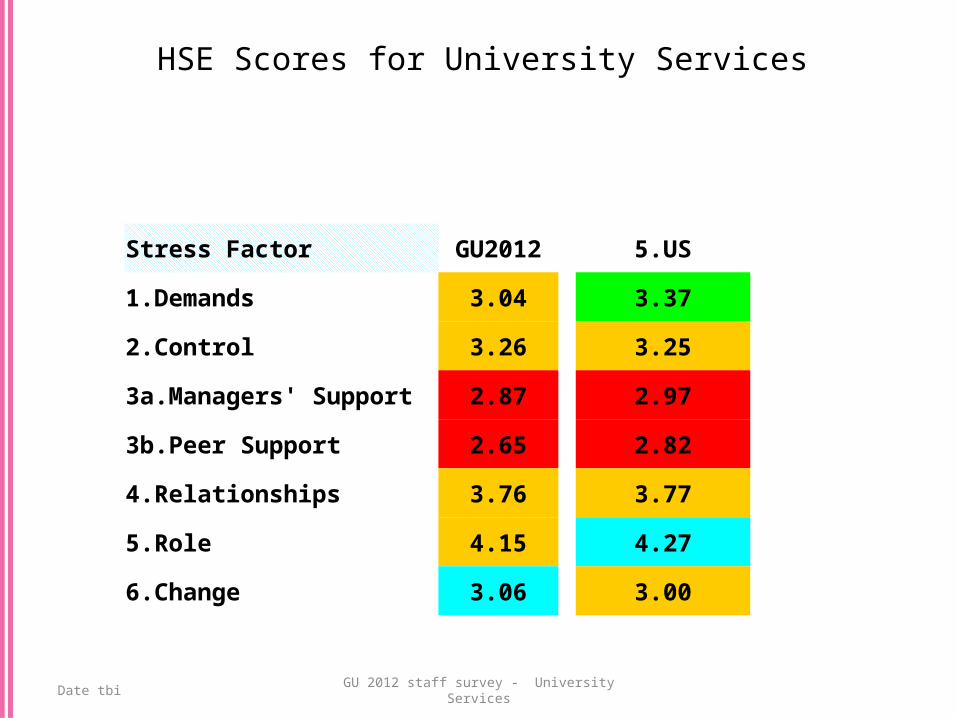
HSE Scores for University Services
Date tbi
Stress Factor GU2012 5.US
1.Demands 3.04 3.37
2.Control 3.26 3.25
3a.Managers' Support 2.87 2.97
3b.Peer Support 2.65 2.82
4.Relationships 3.76 3.77
5.Role 4.15 4.27
6.Change 3.06 3.00