
GL Ship Vibration
51
GL-Technology Ship Vibration
-
Upload
phuocthontu -
Category
Documents
-
view
221 -
download
0
Transcript of GL Ship Vibration

8/8/2019 GL Ship Vibration
http://slidepdf.com/reader/full/gl-ship-vibration 1/51
GL-TechnologyShip Vibration

8/8/2019 GL Ship Vibration
http://slidepdf.com/reader/full/gl-ship-vibration 2/51
This issue of GL’s “Technology” contains
the revision of an article which originally
appeared in the German “Handbuch der
Werften”, published 1998 by Schiffahrtsverlag
“Hansa” C. Schroedter & Co., Hamburg.
The paper presents the “state of the art” of
calculation and measurement techniques in
the field of ship vibrations. In this respect,
emphasis is put on the description of general
procedures. Theoretical background is only
explained when necessary for the compre-hension of physical concepts. Specifically
addressed are engineers/inspectors at ship-
yards, shipping companies and consulting
offices. The goal is to improve communication
between specialists performing vibrational
investigations and engineers concerned with
design and operation of ships.
Ship Vibrationby
Iwer Asmussen / Wolfgang Menzel / Holger Mumm
Germanischer Lloyd
Hamburg, 2001

8/8/2019 GL Ship Vibration
http://slidepdf.com/reader/full/gl-ship-vibration 3/51
Page
1. Introduction 5
2. Standards for Assessment 6
2.1 Effect of Vibrations on Human Beings 6
2.2 Structural Vibrations 8
2.3 Engine and Equipment Vibrations 8
3 Calculation of Natural Vibrations 9
3.1 Global Structures 10
3.2 Substructures 14
3.3 Local Structures 20
4. Calculation of Forced Vibrations 23
4.1 Computation Methods 23
4.2 Damping 24
4.3 Excitation Forces 24
4.4 Evaluation and Assessment 30
5. Measurements 34
5.1 Sensors 34
5.2 Measurement Systems 35
5.3 Measurement Procedures 36
5.4 Evaluation and Assessment 37
5.5 Practical Applications 40
6. Conclusions 48
7. Literature 49
Contents
4

8/8/2019 GL Ship Vibration
http://slidepdf.com/reader/full/gl-ship-vibration 4/51
5
Despite considerable progress in the theoretical and experimental treatment of
ship vibrations, questions about the accuracy of analysis methods for predicting
the vibration behaviour as well as for solving vibration problems on completed
ships are as topical as ever.
The aim of this article is to describe the “state of the art” in computational and
measurement techniques. Here, the main emphasis is placed on the description
of general approaches. Theoretical backgrounds are explained only if this is
necessary for an understanding of physical situations. This paper is, therefore,
aimed in particular at engineers and inspectors of shipyards, shipping companies
and consulting offices, in the expectation that improved communication will be
achieved between vibration specialists and engineers responsible for design andoperation of ships.
In this context, “ship vibrations” consist exclusively of elastic vibrations of the
ship’s hull and/or its parts. These vibrations can impair well-being, efficiency and
health of people on board, can cause damage to the ship and its cargo, and – in
especially serious cases – can endanger the safety of the vessel.
The paper is structured as follows: after a discussion of questions concerning
the building specification and standards for assessment of ship vibrations, analysis
methods for calculation of free vibrations are dealt with. Here, various aspects of
the determination of natural frequencies for simple components, large subsystems
and entire ships are described.
After that, aspects of the calculation and assessment of the forced vibration level
are dealt with since in many cases a final evaluation of vibration questions in the
design stage cannot be made with adequate certainty solely by comparing natural
frequencies with main excitation frequencies.
Finally, this is followed by general remarks about the state of the art for experimen-
tal investigations and by a description of some vibration problems experienced
on completed ships. The measurement procedure for diagnosis and actions taken
to solve these problems are described in detail.
Here, it must also be pointed out that the subject of ship vibrations certainly can-
not be dealt with completely and conclusively. It is our opinion that highly
specialised questions – concerning, for example, elastic mounting of engines,
sloshing phenomena in tanks or torsional vibrations of shafts – nevertheless lie
outside the scope of this article, important as such questions undoubtedly are.
1. Introduction

8/8/2019 GL Ship Vibration
http://slidepdf.com/reader/full/gl-ship-vibration 5/51
6
In recent years, it has become standard practice to regulate
vibration aspects for a newbuilding on a contractual basis.
In the newbuilding contract, limit values that must not be ex-
ceeded during operation of the ship are defined as being part
of the specification. The shipyard thus bears the responsibility
for ensuring that limits agreed on with the shipping company
are not exceeded or – if they are – for taking action with the
aim of reducing the vibration level to the permissible value.
At the preliminary design stage or during the structural design
phase, the shipyard will carry out adequate analyses or will
have them performed by an independent consultant. Amongst
other things, the scope of theoretical investigations regardedas necessary in a given case depends on the agreed limit
values, the type of ship, the propulsion plant, and so on.
There are essentially three areas which are often included in
the building specification to define vibration limits:
• Effect of vibrations on human beings
• Structural vibrations
• Vibrations of engines and equipment items
In the following, a few important standards that are often
used to define limit values are dealt with briefly.
2.1 Effect of Vibrations on Human Beings
With regard to the effect of vibrations on human beings, it
should basically be noted that existing standards are aimed
solely at ensuring comfort and well-being. The word “habita-
bility” is often used in this connection. If the recommended
limits are not exceeded, damage to health is unlikely to occur.
2.1.1 ISO 6954Internationally, the standard ISO 6954 (edition 1984) gained
general acceptance for the evaluation of human exposure to
vibrations [1]. An important feature of this standard was that,
for the purposes of assessment, peak values of amplitudes
had to be considered individually for each excitation
frequency. Since the periodic excitation forces of the
propulsion plant – especially of the propeller – are subject to
a certain degree of variation, the vibration values, too, are
measured with the corresponding variance. This fact led to
problems in the assessment because the standard did not
clearly define how a ”mean“ peak value (maximum repetitive
value) was to be formed from values of differing magnitudedetermined over the duration of the measurement – consti-
tuting the well-known problem with the “crest factor”.
This evaluation procedure contradicted the principles
stipulated in the revised edition of ISO 2631-1 [2]. For this
reason, too, a revision of the ISO 6954 was initiated.
The new ISO standard was released in December 2000 [3].
It is now harmonised with the principles of ISO 2631-1 and
integrates substantial improvements:
For assessment, a single value over the frequency range
from 1 to 80 Hz is formed. As frequency weighting curve,
the "combined curve” of ISO 2631-2 [4] is used, see Fig. 1.
The final vibration criterion, the so-called “overall frequency
weighted r.m.s. value”, is no longer a peak value. Hence,
the term “crest factor” is no longer necessary and is thus
completely cancelled. Three classifications for different
kinds of spaces are combined with recommended vibration
limits, giving now additional orientation to contractual
partners, see Table 1:
Table 1 Overall frequency-weighted r.m.s. values from 1 Hz to 80 Hz given as guidelines for the habitabilityof different areas on a ship [3]
Area classification
A B C
mm/s2 mm/s mm/s2 mm/s mm/s2 mm/s
143 4 214 6 286 8
71.5 2 107 3 143 4
Values above which adverse
comments are probable
Values below which adverse
comments are not probable
NOTE The zone between upper and lower values reflects the shipboard vibration environment commonly experienced and accepted.
2. Standards for Assessment

8/8/2019 GL Ship Vibration
http://slidepdf.com/reader/full/gl-ship-vibration 6/51
Sea Mode Harbour Operation Thruster Operation 1)hcn hcn hcn
1 2 3 4 5 1 2 3 4 5 1 2 3 4 5
0.8 1.2 1.6 2.0 2.4 - - - - - 1.6 2.0 2.4 2.8 3.2
1.2 1.7 2.2 2.7 3.2 - - - - - 2.0 2.4 2.8 3.2 3.6
2.0 2.5 3.0 3.5 4.0 - - - - - - - - - -
1.4 1.9 2.4 2.9 3.4 - - - - - - - - - -
2.0 2.4 2.8 3.2 3.6 - - - - - - - - - -
2.2 2.6 3.0 3.4 3.8 - - - - - - - - - -
Vibration limits
Indoor Spaces Forward of Frame B
First class cabins
Standard cabins
Public spaces, short exposure time
Public spaces, long exposure time
Outdoor Spaces Forward of Frame B
Open deck recreation
Open deck recreation, overhangs1) Thrusters operating at not less than 70 % full load
7
NOTE: For guidance, Classification A can be passenger
cabins, Classification B crew accommodation
areas, and Classification C working areas.
However, it is still up to owner and yard to exactly define the
vibration comfort on board "their" vessel. Nevertheless, the
new ISO 6954 is clearer and avoids misunderstandings due
to deletion of the crest factor. Furthermore, it better reflects
the human sensitivity by taking into account the entire
spectrum from 1 to 80 Hz.
2.1.2 Class Notations In terms of comfort on board, the rise of the cruise market
in the last few years led to advanced developments by
Classification Societies in this field. Notations of comfort,
obviously, needed particular attention for passenger ships.
The main objective is to support the owner/yard when
detailing a newbuilding specification with regard to vibration
and noise. Therefore, Classification Societies, with initiative
from cruise ship owners, began to introduce vibration and
noise as voluntary class notations.
The respective GL class notation is called “Harmony Class”
[5]. It is focused on noise and vibration criteria on board
passenger vessels in a first step and will be followed by
additional criteria for other types of ships. The comfort is
scaled according to harmony criteria numbers, hcn 1 to 5,
where 1 represents an extraordinary comfort (most
ambitious level). The Rules do not only comprise limits and
assessment procedures for the normal (seagoing) service
condition, but account for thruster operation and harbour
mode as well. Moreover, “acoustic privacy” is introduced as
an additional noise criterion reflecting both sound insulation
and impact sound insulation of cabins to adjacent spaces.
Germanischer Lloyd were the first Classification Society to
base the vibration part on the new ISO 6954 standard.
For illustration, Table 2 displays the vibration limits for
passenger spaces.
Table 2 Vibration limits, passenger spaces
Fig.1: Frequency weighting curve, “combined curve”
of ISO 2361-2
The class notation requires a detailed documentation of plans
and drawings to be submitted by the building yard. On this
basis the Survey Programs, describing the extent of vibration
(and noise) measurements for different criteria and operation
modes, are checked and finally approved. The measurements
cover a variable but relatively high percentage of the various
kinds of spaces and areas of the ship.
The measurements of each space investigated are documented
in the Survey Report and finally condensed to an hcn-number,
that is – as the final result – certified in the class notation.
Generally, the Rules are detailed, leading the user through
different technical aspects of noise and vibration on board
passenger ships. Hints to potentially critical areas are given.
A separate section is dedicated to the different theoretical
analyses (FEM-based, for instance), recommended to achieve
the hcn-number desired.
8/8/2019 GL Ship Vibration
http://slidepdf.com/reader/full/gl-ship-vibration 7/51
V i b r a t i o n V e l o c i t y
1 10 100 Hz
Frequency
5 x 10⁻¹
mm/s
1 mm/s
10 mm/s
102
mm/s
5 x 10²
mm/s 1 m m
1 0 - 1 m
m
1 0 - 2 m
m
1 0 - 3 m
m
V E L O
C I T Y
A C C E L E R A T I O N
60 100 1000 6000 c/min
1 0 m m
1 0 m m / s 2
( 1 0 - 3 g )
1 0 2 m m / s 2
( 1 0 - 2 g )
1 0 3 m m / s 2
( 1 0 - 1 g )
1 0 4 m m / s 2
( g )
1 0 5 m
m / s 2
( 1 0 g )
D I S P L A
C E M E N
T
Damage probable
2 . 0 m m
Recommended
1 . 0 m m
60 mm/s
30 mm/s
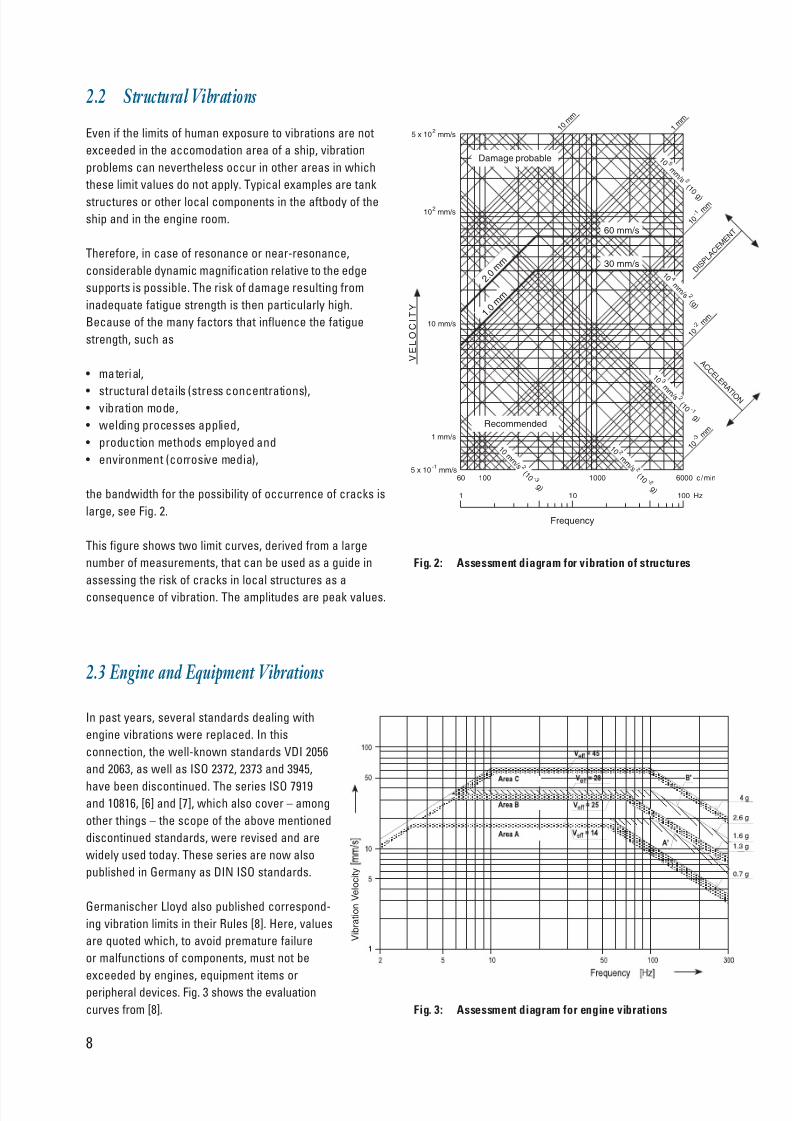
8
Even if the limits of human exposure to vibrations are not
exceeded in the accomodation area of a ship, vibration
problems can nevertheless occur in other areas in which
these limit values do not apply. Typical examples are tank
structures or other local components in the aftbody of the
ship and in the engine room.
Therefore, in case of resonance or near-resonance,
considerable dynamic magnification relative to the edge
supports is possible. The risk of damage resulting from
inadequate fatigue strength is then particularly high.
Because of the many factors that influence the fatigue
strength, such as
• material,
• structural details (stress concentrations),• vibration mode,
• welding processes applied,
• production methods employed and
• environment (corrosive media),
the bandwidth for the possibility of occurrence of cracks is
large, see Fig. 2.
This figure shows two limit curves, derived from a large
number of measurements, that can be used as a guide in
assessing the risk of cracks in local structures as a
consequence of vibration. The amplitudes are peak values.
In past years, several standards dealing with
engine vibrations were replaced. In this
connection, the well-known standards VDI 2056
and 2063, as well as ISO 2372, 2373 and 3945,
have been discontinued. The series ISO 7919and 10816, [6] and [7], which also cover – among
other things – the scope of the above mentioned
discontinued standards, were revised and are
widely used today. These series are now also
published in Germany as DIN ISO standards.
Germanischer Lloyd also published correspond-
ing vibration limits in their Rules [8]. Here, values
are quoted which, to avoid premature failure
or malfunctions of components, must not be
exceeded by engines, equipment items or
peripheral devices. Fig. 3 shows the evaluation
curves from [8]. Fig. 3: Assessment diagram for engine vibrations
Fig. 2: Assessment diagram for vibration of structures
2.2 Structural Vibrations
2.3 Engine and Equipment Vibrations

8/8/2019 GL Ship Vibration
http://slidepdf.com/reader/full/gl-ship-vibration 8/51
speed. In many cases, however, a resonance free design
of structures and equipment items is possible for all service
conditions. A subcritical or supercritical design can be
selected. As shown in Fig. 4, a subcritical design must ensure
that, considering a certain safety margin, all natural frequen-
cies of the system are higher than the highest significant
excitation frequency.
The dynamic magnification factor depends not only on the
safety margin between excitation frequency and natural
frequency, but also on the damping coefficient of the system.
9
Fig. 4: Dynamic magnification factor for a single
degree-of-freedom system
In general, limit curve A can be applied to assess vibration
levels regarding machinery items. The criteria for use of
curves A', B, B' and C are described in [8] and will not be
repeated here. These criteria mainly involve reciprocating
engines with peripheral devices connected to them.
In addition, limit curve B can also be used to assess equip-
ment and components installed in steering gear rooms or
bow thruster compartments.
Because low-cost building and operation aspects of a ship
increasingly influence the design, vibration problems occur
more frequently. The following design trends contributed to
this:
• Light-weight construction and, therefore, low values
of stiffness and mass (low impedance)
• Arrangement of living and working quarters in the vicinity
of the propeller and main engine to optimize stowage
space or to achieve the largest possible deck openings of
container ships
• High propulsion power to achieve high service speed
• Small tip clearance of the propeller to increase
efficiency by having a large propeller diameter
• Use of fuel-efficient slow-running main engines
On the other hand, the consistent application of labourlegislation rules and higher demand for living comfort
underline the need to minimise the vibration level.
The simplest way to avoid vibrations is to prevent resonance
conditons. This procedure is successful as long as natural
frequencies and excitation frequencies can be regarded as
being independent of environmental conditions. In questions
of ship technology, this prerequisite frequently remains
unfulfilled. For example, different filling states change the
natural frequency of tank structures. The overall hull of the
ship takes on different natural modes and natural frequencies
for different loading conditions, or there might be variable
excitation frequencies for propulsion plants having a variable
Difficulties often occur in the assessment of components
situated on masts. However, as a rough guide, it can be
assumed that damage to these components can largely be
prevented if the vibration level remain within area A.
3. Calculation of Natural Vibrations
..
.
.
.
.
.
0 0.5 1.51.0 2.0 2.5

8/8/2019 GL Ship Vibration
http://slidepdf.com/reader/full/gl-ship-vibration 9/51
10
engine foundation up to a frequency of about 200 Hz has
about the same number of degrees of freedom as a complete
hull model used to compute the natural vibrations up to 20 Hz.
3.1 Global Structures Global vibrations in this context are vibrations of the ship’s
entire hull in the frequency range from about 0.5 to 10 Hz.
Typical large substructures, such as the aft part of the ship,
the deckhouse and the double bottom, are coupled in a way
that they cannot be considered isolated. Thanks to advances
in computer technology, computation methods for deter-
mining global vibrations progressed rapidly during the past
two decades. From today’s point of view, classical approxi-
mation formulas or simple beam models for determining
natural bending frequencies of a ship’s hull are in manycases no longer adequate. For container ships with a high
deck-opening ratio, e.g., for which coupled horizontal and
torsional vibration modes play an important part, they do not
offer the necessary degree of accuracy. In the past, one had
to make do with beam models of a more complex type to
cover shear and torsional stiffnesses of the ship’s hull.
However, in the meantime FE analyses using 3D models of
the hull became the standard computational tool, as
described in [9], for example.
In Fig. 5, the vibration phenomena relevant in shipbuilding
applications are plotted versus frequency. The frequency
limits indicated are valid for standard designs and for normal
ship types.
The transitions between ship motions, ship vibrations and
ship acoustics are smooth. In the field of vibration, it is
possible to distinguish between three different phenomena:
global hull vibrations, vibrations of substructures and local
vibrations.
In general, the higher the frequency, the greater the modal
density, i.e., “the number of natural frequencies per Hertz”.
As a result, the system response in the higher frequency
range is defined by the interaction of more natural modes
than at low frequencies. In the transition to structure-borne
noise, the mode density finally becomes so large that a fre-
quency-selective analysis of the structure’s dynamic behav-iour requires an unacceptably large effort. One then has to
make do with characteristic energy-values averaged over
frequency intervals (Statistical Energy Analysis, Noise-FEM,
etc.). Today, of course, FEM is used to some extent in this
frequency range, too. However, with the currently available
power of computers, frequency-selective computation is
limited to partial areas of particular interest, such as engine
foundations. For example, an FE model intended for reliable
computation of natural frequencies and natural modes of an
Fig. 5: Natural frequency ranges in shipbuilding applications

8/8/2019 GL Ship Vibration
http://slidepdf.com/reader/full/gl-ship-vibration 10/51
11
Fig. 6: FE models of various types of ships
3.1.1 Modelling The replication of a ship’s structure in an FE model is gene-
rally the most laborious step of the analysis. For global
vibrations, it turns out to be sufficient to represent primary
structural components with the aid of plane stress elements.
Bending stiffnesses of deck and wall girders are not covered
by this type of modelling since they are generally simulated
by truss elements. Large web frames are taken into account
by plane stress elements as well. For the sake of simplicity
minor structural components lying outside the planes of the
modelled sections are considered as additional element-
thicknesses or are ignored altogether. The division of the
model is oriented relative to deck planes and to main longi-
tudinal and transverse structures. The number of degrees of
freedom is 20 to 40 thousand, yielding 50 to 150 natural
vibration modes in the range up to 20 Hz. Three typical models
are shown in Fig. 6, namely, a 700 TEU container ship, a
smaller double hull tanker, and a 4500 TEU container ship.

8/8/2019 GL Ship Vibration
http://slidepdf.com/reader/full/gl-ship-vibration 11/51
12
In global vibration analyses, it is not necessary to model
the middle and the forward part of the ship with the level of
detail shown. However, the global models are mostly used
for strength analyses, too, which require a more accurate
modelling of the structure in these areas. If the bending stiff-
nesses of deck grillages are also to be included in the global
model, the representation of transverse and longitudinal
girders of decks is necessary, at least in form of beam
elements. Normally, these models possess 40 to 80 thousand
degrees of freedom and have 300 to 500 natural frequencies
in the range up to 20 Hz. An alternative for taking account of
deck grillages in form of beam elements is to model the webs
of girders by means of plane stress elements and flanges by
truss elements.
Fig. 7 shows three typical FE models of this kind in an overall
view and a longitudinal section: a yacht about 60 m long, a
240 m passenger ship, and a frigate. As can be seen from the
centre-line sections, webs of the deck grillages are modelled
three-dimensionally in case of the yacht only. For the other
two much larger ships, this procedure would have led to un-
necessarily large models.
Fig. 7: FE models of various types of ship

8/8/2019 GL Ship Vibration
http://slidepdf.com/reader/full/gl-ship-vibration 12/51
13
In the computation of global vibrations of ships, it must be
borne in mind that natural frequencies are highly dependent
on the loading condition. From a draught variation of about
± 1.0 m upwards, it should be considered to take a further
loading condition into account. For cargo vessels, therefore,
at least two or three mass distributions have to be considered.
In contrast to strength analyses, no extreme cargo-distribu-
tions should be selected, but rather homogeneous ones
typical for the expected ship operation.
The following masses must be taken into account:
• Ship structure
• Outfitting and equipment
• Tank filling
• Cargo
• Hydrodynamic masses
In FE techniques, a distinction is drawn between node masses
and element masses. Node masses are concentrated at therespective nodal points of the FE model. This arrangement of
masses is advisable for heavy parts of equipment whose
centres of gravity are not automatically evident from the
model geometry. The three types of masses last mentioned
are likewise arranged as node masses. For the arrangement
of structure masses, as well as for the “distributable” part of
equipment masses, the existing geometric information of the
FE model should be used (element masses).
The masses of tank contents are distributed over the nodes
of the relevant tank structure, taking correct account of the
centres of gravity. If nodes are available, the same applies
to cargo masses. However, in many cases, for example for
container masses, auxiliary structures must be provided to
introduce masses into the FE model in a realistic manner. It
must be ensured that these auxiliary structures do not
unacceptably stiffen the ship’s hull.
To determine hydrodynamic masses, separate computations
must be performed. The procedures used are still often based
on the method of Lewis [10], which involves a 2D theory
derived for elongated, slim bodies. The associated set of
potential-theory formulas is based on conformal mappings ofa circular cross-section. The water flow in the ship’s longitu-
dinal direction is taken into account by correction factors
that depend mainly on the length-to-width ratio, but also on
the natural mode being considered. Because hydrodynamic
masses have to be determined prior to the calculation of
natural vibrations, the selection of correction factors should
be co-ordinated with the expected frequency range of
natural modes. Strictly speaking, it is possible to accurately
determine only the natural frequency of the particular mode
used as the basis to select correction factors.
The Lewis method offers the advantage that the hydrodynamic
mass matrix to be used for the eigenvalue solution contains
terms on the main diagonal only. Thus, the same numerically
effective algorithms can be used for solving the eigenvalue
problem as those used for problems involving only structural
masses.
More comprehensive methods to calculate hydrodynamic
inertia effects take account of the fact that the acceleration
of a point on the wetted shell also causes changes in the
hydrodynamic pressure at adjacent points. This coupling
leads to the introduction of terms on the secondary diagonals
of the mass matrix, which in turn leads to a considerably
more effort-intensive calculation of eigenvalues. A calculation
method that takes account these couplings is described in
[11]. Conversion into a practical computation method on the
basis of a boundary value formulation is described in [12].
3.1.2 CalculationIf stiffness and mass matrices are known, natural vibration
calculation can be performed. For this purpose, numerically
effective approximation methods, such as the Ritz procedure,
are used. For the eigenvalue solver, starting vectors must be
specified, the superimposition of which permits as accurate
a representation as possible of expected vibration modes.
However, only mode shapes can be calculated for which
corresponding starting vectors have been specified.
As starting vectors the Lanczos method presented in [13] and
[14], for instance, selects in an automated manner unit load
cases that act in every degree of freedom of the system. This
leads to the computation of all existing natural frequencies in
the desired frequency interval. At present, the natural
vibration analysis of a large global model takes several hours
on a high-performance workstation.
To illustrate the situation, some typical fundamental natural
vibration modes calculated for the previous FE models are
shown in Fig. 8 and Fig. 9. In each case, the first torsional
vibration mode and the second vertical bending vibration
mode are presented together with the computed natural
frequencies. Because of the large deck-opening ratio, thenatural torsional frequencies for container ships are low. As
a result of the comparatively short deckhouses there is no
significant stiffening effect on the ship’s hull.
For the other ship types presented, on the other hand, it can
be assumed that the superstructures contribute considerably
to hull stiffness.
Vibration modes of ship hulls lie in the lower frequency
range. Because of the usual higher excitation frequencies
their contribution to the vibration level is small. Nevertheless,
knowledge of these vibration modes is important for
validation purposes.

8/8/2019 GL Ship Vibration
http://slidepdf.com/reader/full/gl-ship-vibration 13/51
14
Fig. 8: Natural torsional and vertical bending modes
of various ship types
3.2 Substructures
In the transition between global and local vibrations, vibrations
of large subsystems, too, are of interest in practice. Here
subsystems are structures or equipment items whose
natural vibration characteristics can be regarded, for the
sake of simplicity, as being independent of the vibration
f = 1.4 Hz
f = 3.3 Hz
f = 2.1 Hz
f = 2.6 Hz
f = 0.6 Hz
f = 1.7 Hz
behaviour of the structure surrounding them – which is the
case with a vibrating radar mast, for example. However, in
the analysis of subsystems, the surrounding structure must
not be ignored, because it defines the connecting stiffness,
i.e., the supporting conditions.

8/8/2019 GL Ship Vibration
http://slidepdf.com/reader/full/gl-ship-vibration 14/51
15
Fig. 9: Natural torsional and vertical bending modes
of various ship types
f = 5.2 Hz
f = 5.6 Hz
f = 1.7 Hz
f = 2.0 Hz
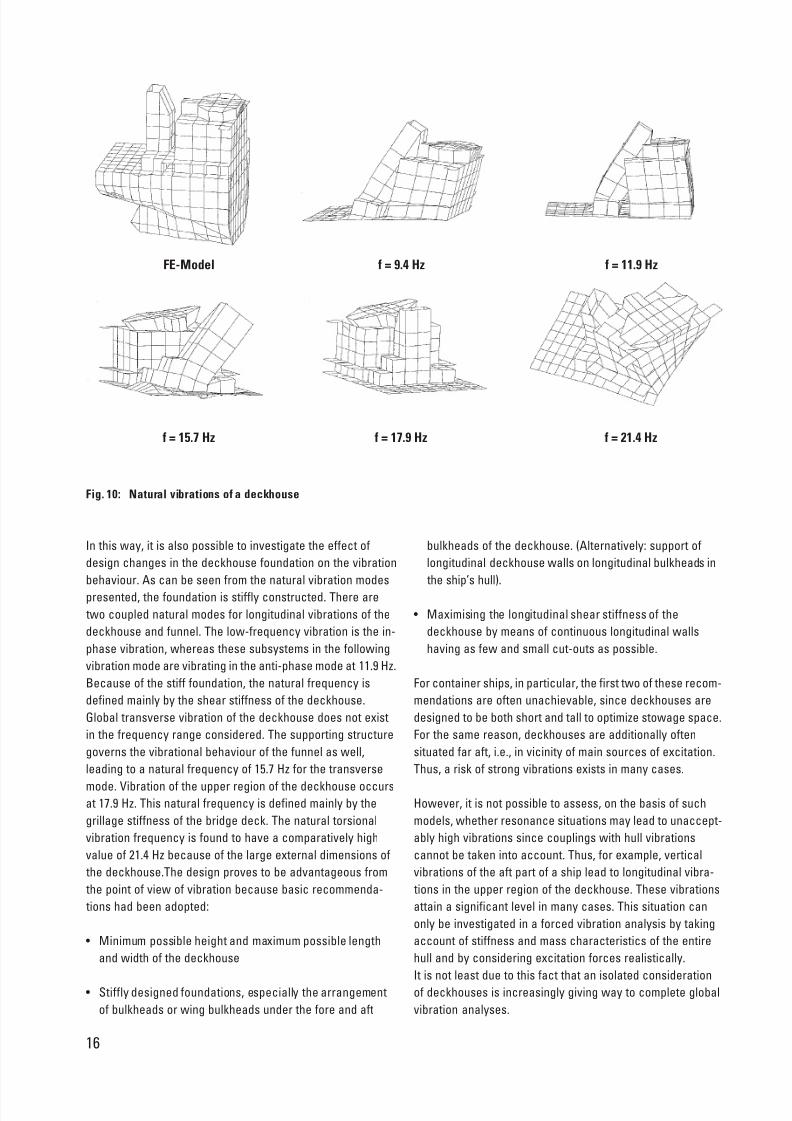
3.2.1 Deckhouses The aim of analyses of this type is the avoidance of resonance
between fundamental vibration modes and main excitation
frequencies. A typical example of a substructure is a deckhouse
when considered as an isolated system. Fig. 10 shows such
a model with the calculated fundamental vibration modes.
The longitudinal and transverse vibration modes, in particular,
are significantly affected by the vertical stiffness in the
supporting area. Therefore, an attempt must be made to
incorporate, in a simplified manner, an apropriate part of the
ship’s hull in the region of the deckhouse into the model.
8/8/2019 GL Ship Vibration
http://slidepdf.com/reader/full/gl-ship-vibration 15/51
16
In this way, it is also possible to investigate the effect of
design changes in the deckhouse foundation on the vibration
behaviour. As can be seen from the natural vibration modes
presented, the foundation is stiffly constructed. There are
two coupled natural modes for longitudinal vibrations of the
deckhouse and funnel. The low-frequency vibration is the in-
phase vibration, whereas these subsystems in the following
vibration mode are vibrating in the anti-phase mode at 11.9 Hz.
Because of the stiff foundation, the natural frequency is
defined mainly by the shear stiffness of the deckhouse.
Global transverse vibration of the deckhouse does not exist
in the frequency range considered. The supporting structure
governs the vibrational behaviour of the funnel as well,
leading to a natural frequency of 15.7 Hz for the transverse
mode. Vibration of the upper region of the deckhouse occursat 17.9 Hz. This natural frequency is defined mainly by the
grillage stiffness of the bridge deck. The natural torsional
vibration frequency is found to have a comparatively high
value of 21.4 Hz because of the large external dimensions of
the deckhouse.The design proves to be advantageous from
the point of view of vibration because basic recommenda-
tions had been adopted:
• Minimum possible height and maximum possible length
and width of the deckhouse
• Stiffly designed foundations, especially the arrangement
of bulkheads or wing bulkheads under the fore and aft
bulkheads of the deckhouse. (Alternatively: support of
longitudinal deckhouse walls on longitudinal bulkheads in
the ship’s hull).
• Maximising the longitudinal shear stiffness of the
deckhouse by means of continuous longitudinal walls
having as few and small cut-outs as possible.
For container ships, in particular, the first two of these recom-
mendations are often unachievable, since deckhouses are
designed to be both short and tall to optimize stowage space.
For the same reason, deckhouses are additionally often
situated far aft, i.e., in vicinity of main sources of excitation.
Thus, a risk of strong vibrations exists in many cases.
However, it is not possible to assess, on the basis of such
models, whether resonance situations may lead to unaccept-
ably high vibrations since couplings with hull vibrations
cannot be taken into account. Thus, for example, vertical
vibrations of the aft part of a ship lead to longitudinal vibra-
tions in the upper region of the deckhouse. These vibrations
attain a significant level in many cases. This situation can
only be investigated in a forced vibration analysis by taking
account of stiffness and mass characteristics of the entire
hull and by considering excitation forces realistically.
It is not least due to this fact that an isolated consideration
of deckhouses is increasingly giving way to complete global
vibration analyses.
f = 15.7 Hz f = 17.9 Hz f = 21.4 Hz
FE-Model f = 9.4 Hz f = 11.9 Hz
Fig. 10: Natural vibrations of a deckhouse

8/8/2019 GL Ship Vibration
http://slidepdf.com/reader/full/gl-ship-vibration 16/51
17
Longitudinal Vibration
16.2 Hz
3.2.2 Masts In case of masts, there is a clear separation from the sur-
rounding structure. Depending on the size and nature of the
equipment fixed to a mast, four design principles can be
distinguished:
• Simple masts whose cross sections make them fairly flexible
and which are stiffened by means of additional stays
• Welded tripod constructions
• Streamline-shaped masts with large, closed cross-
sections and correspondingly high bending and torsional
stiffness
• More complex beam type structures, which are mostly
designed as latticework constructions made of tubular or
MSH members.
In case of stayed masts, adequate stiffness of the connect-
ing structural members on deck and of the corresponding
foundation must be ensured. Stays should be provided with
pre-tensioning devices and should form as small an angle as
possible with the horizontal. In case of both tripod and
latticework designs, it turns out that the frequency depends
not only on the height and the location of the centre of the
mass, but also on the stiffness of the foundation at the
footing. Mounting on deck areas supported by bulkheads
is the best solution. Particularly in case of masts mounted on
the wheelhouse top, this requirement can be met only if
communication between steel construction and equipment
departments is well coordinated at an early stage.
Fig. 11: Natural vibrations of a mast
Transverse Vibration
17.2 Hz
In many cases, it is possible to position the mast on bulkheads
of the stair casing or on pillars integrated in accommodation
walls.
Permissible vibrations are mostly defined by limit values for
electronic equipment situated on mast platforms. These
limits are not standardised, and at present they are mostly
based on empirical values.
A mast vibrating in resonance can also act as a secondary
source of excitation. As a result, deck coverings and partial
walls can, in turn, experience excitation. This usually
involves generation of noise.
Fig. 11 shows the possible extent of a computation model for
a mast situated on a wheelhouse top. The FE model should
continue at least down to a level one deck below the mountingdeck. This is the only way to ensure that supporting condi-
tions are taken into account realistically. Natural frequencies
of longitudinal and transverse vibrations are 16.2 and 17.2 Hz,
respectively. This means that a subcritical design with regard
to a frequency twice that of the propeller blade frequency
was ensured in this case.
As with any design aimed to avoid resonance, it is necessary
to select – mainly in conjunction with distance from propeller
and main engine – the order of excitation up to which there
should be no resonances. In general, it turns out to be ade-
quate to design fundamental vibration modes of the mast con-
struction subcritically relative to twice the propeller frequency
or to the ignition frequency.

8/8/2019 GL Ship Vibration
http://slidepdf.com/reader/full/gl-ship-vibration 17/51
18
3.2.3 Engine/Foundation Systems Subsystems described so far refer to typical shipbuilding
structures. In the following, the natural vibration of ships’
main engines are described.
Fundamental natural frequencies of main engine vibrations
depend on the distribution of stiffnesses and masses of the
engine itself, but they are also determined to a large extent
by the stiffness of adjoining structures. The effect of the
doublebottom stiffness is more marked for slow-running en-
gines than for medium-speed ones. Fig. 12 shows natural
modes of a slow-running, rigidly mounted 7-cylinder engine,
compared to those of the engine supported realistically in
the ship. Furthermore, corresponding natural frequencies
are given for an infinitely rigid engine structure supported on
a realistic ship foundation. The global stiffness of the engine
housing is represented in a simplified form by means of
plane stress elements.
Fundamental vibration modes of housings – called “H”, “X”
and “L” modes – depend mainly on the doublebottom
stiffness. Since doublebottom designs for slow-running main
engines do not differ significantly, bands for the probable
natural frequencies can be derived for engines having a
certain number of cylinders, see [15].
For slow-running engines resonance situations can be
experienced for all three fundamental modes, with typical
combinations of number of cylinder and speed.
In case of medium-speed engines this is true only for the
H-type vibration mode, which might be in resonance with
the ignition frequency. Corresponding computation models
should contain at least the doublebottom structure in the
engine room area and the structure up to the next deck.
However, the engine housing, too, must be included in the
model. Because the effect of the engine’s frame stiffness is
more marked for medium-speed than for slow-running
engines, the engine structure must be simulated with greater
accuracy – see also [16]. A computation model with a typical
level of detail of engine and ship structure is presented inFig. 13. This shows the port half of the engine room area of a
RoRo trailer ferry powered by two 7-cylinder, 4400 kW main
engines driving two propellers.
Fig. 12: Natural vibrations of slow-running main engines for
various boundary conditions
Fig. 13: Computation model
for determining the
natural transverse
bending frequencies
of medium-speed
engines
Rigidly Supported
L-Type
f= 13.2 Hz
H-Type
f= 14.8 Hz
X-Type
f= 19.8 Hz
L-Type
9.1- 9.4 Hz
Rigid Engine Structure ≈ 10.0 Hz
H-Type
5.9 - 6.5 Hz
Rigid Engine Structure ≈ 7.0 Hz
X-Type
15.4 - 15.5 Hz
Realistically Supported

8/8/2019 GL Ship Vibration
http://slidepdf.com/reader/full/gl-ship-vibration 18/51
The same applies to the calculation of coupled torsional/axial
vibrations. In practice, these turn out to be relevant only for
shaft systems driven by slow-running main engines.
A corresponding computation model includes both, the entire
shaft line and the crankshaft – see also [17]. If the axial/tor-
sional vibration resonates with the thrust fluctuation of the
propeller or with a radial force excitation of the main engine,
comparatively strong axial force fluctuations can appear at
the thrust bearing. These forces are further transmitted into
the ship then acting as a secondary source of excitation.
However, this will not be dealt with here.
Bending Vibrations For the determination of natural frequencies of shaft bending
vibrations, it is advisable to take account of the structure
surrounding the shaft system. Detailed investigations should
be considered for a shaft line design for which at least oneof the following criteria apply:
• Soft structure in the vicinity of the sterntube bearing
• Guidance of the shaft in a shaft bossing, thus causinghydrodynamic masses to act
• Arrangement of shaft brackets, which themselves can
have natural frequencies close to the propeller blade
frequency
• Estimation of clearance between shaft and bearing shell
as well as of dynamic bearing loads in a forced vibration
analysis.
Because the transverse members in the ship’s aftbody, which
tapers off in a catamaran-like manner, are not very stiff, the
task was to check the risk of resonance between transverse
modes of the engines and the ignition frequency. Because
the H-moment also leads to vertical vibrations of the double-
bottom, hydrodynamic masses are acting on the ship, which
have to be considered. Large tank-fillings in the vicinity of
the main engines are taken into account as well. For this
example various natural frequencies were determined, reflec-
ting coupled vibrations of the port and starboard engines.
Fig. 14 shows three corresponding vibration modes. Depending
on coupling conditions of the port and starboard engines,
H-type transverse vibration modes occur at 17.9, 20.5 and
22.5 Hz. The design was, therefore, supercritical relative to
the ignition frequency of 30 Hz. Consequently, there was no
need to install an elastic or semi-elastic mounting. Computa-
tions of X-type vibration modes of the main engines revealedfrequencies in a band between 34 and 38 Hz, thus indicating
an adequate safety margin to the ignition frequency as well.
3.2.4 Shaft Lines Axial/Torsional Vibrations As far as axial and torsional vibrations are concerned, it is
often adequate to consider shaft lines isolated, i.e.,
independent of the surrounding structure of the ship. With
regard to torsional vibrations, relevant requirements of the
Classification Society have to be accounted for – see [8].
Axial vibrations are usually calculated by isolated models
consisting of point masses, springs and damping elements.
f= 17.9 Hz
f= 20.5 Hz
f= 22.5 Hz
Fig. 14: H-type natural vibration modes of two 7-cylinder engines on a RoRo trailer ferry
19
8/8/2019 GL Ship Vibration
http://slidepdf.com/reader/full/gl-ship-vibration 19/51
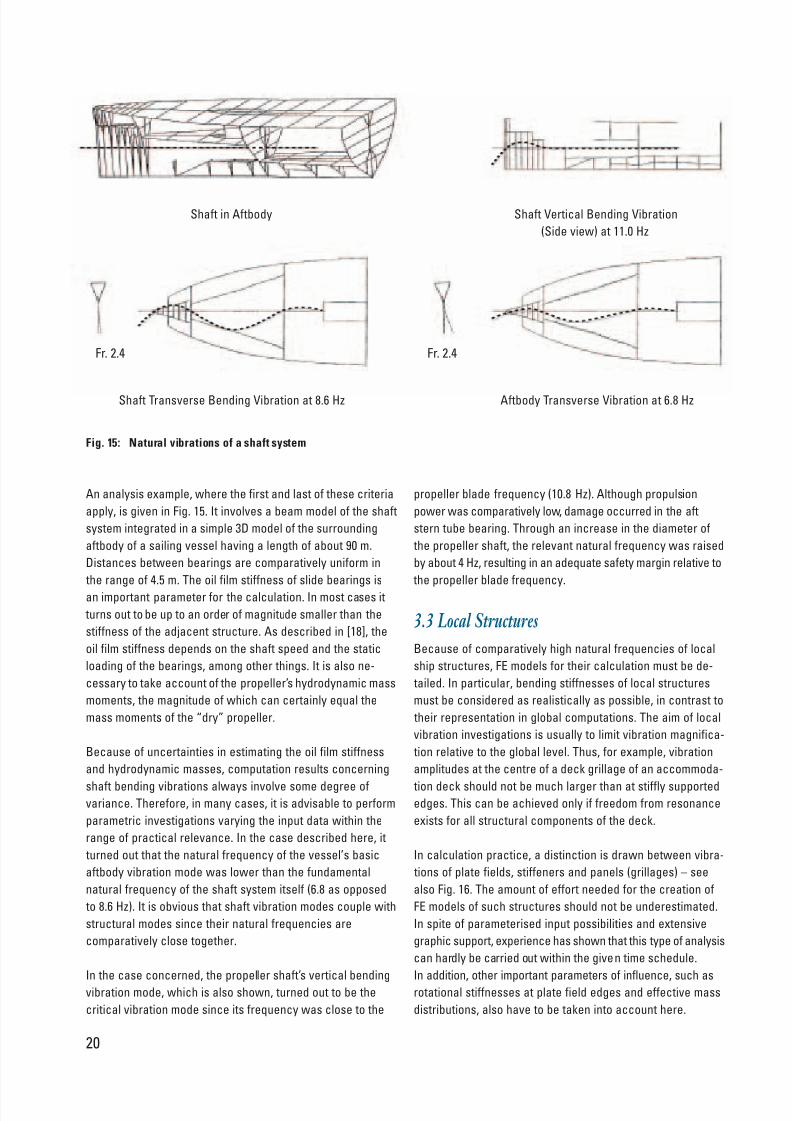
Fig. 15: Natural vibrations of a shaft system
Shaft Transverse Bending Vibration at 8.6 Hz Aftbody Transverse Vibration at 6.8 Hz
Shaft in Aftbody Shaft Vertical Bending Vibration
(Side view) at 11.0 Hz
Fr. 2.4 Fr. 2.4
An analysis example, where the first and last of these criteria
apply, is given in Fig. 15. It involves a beam model of the shaft
system integrated in a simple 3D model of the surrounding
aftbody of a sailing vessel having a length of about 90 m.
Distances between bearings are comparatively uniform in
the range of 4.5 m. The oil film stiffness of slide bearings is
an important parameter for the calculation. In most cases it
turns out to be up to an order of magnitude smaller than the
stiffness of the adjacent structure. As described in [18], the
oil film stiffness depends on the shaft speed and the static
loading of the bearings, among other things. It is also ne-
cessary to take account of the propeller’s hydrodynamic mass
moments, the magnitude of which can certainly equal the
mass moments of the “dry” propeller.
Because of uncertainties in estimating the oil film stiffness
and hydrodynamic masses, computation results concerning
shaft bending vibrations always involve some degree ofvariance. Therefore, in many cases, it is advisable to perform
parametric investigations varying the input data within the
range of practical relevance. In the case described here, it
turned out that the natural frequency of the vessel’s basic
aftbody vibration mode was lower than the fundamental
natural frequency of the shaft system itself (6.8 as opposed
to 8.6 Hz). It is obvious that shaft vibration modes couple with
structural modes since their natural frequencies are
comparatively close together.
In the case concerned, the propeller shaft’s vertical bending
vibration mode, which is also shown, turned out to be the
critical vibration mode since its frequency was close to the
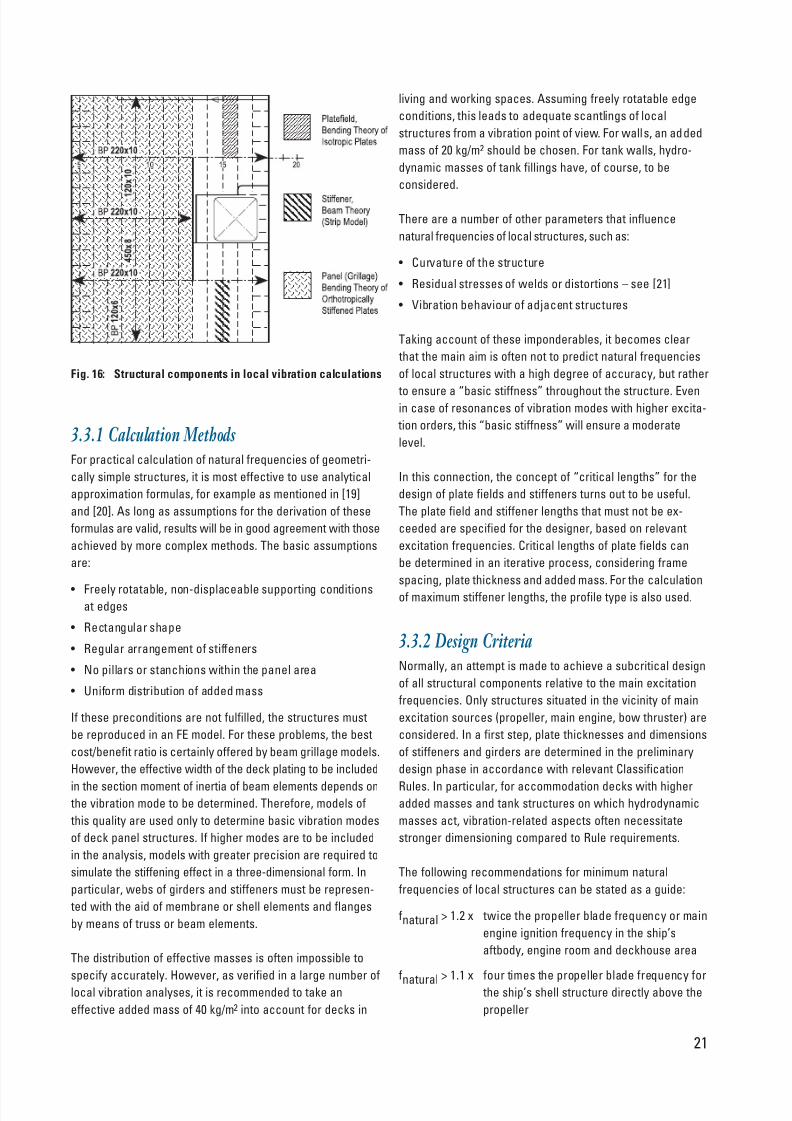
3.3 Local Structures
Because of comparatively high natural frequencies of local
ship structures, FE models for their calculation must be de-
tailed. In particular, bending stiffnesses of local structures
must be considered as realistically as possible, in contrast to
their representation in global computations. The aim of local
vibration investigations is usually to limit vibration magnifica-
tion relative to the global level. Thus, for example, vibration
amplitudes at the centre of a deck grillage of an accommoda-
tion deck should not be much larger than at stiffly supportededges. This can be achieved only if freedom from resonance
exists for all structural components of the deck.
In calculation practice, a distinction is drawn between vibra-
tions of plate fields, stiffeners and panels (grillages) – see
also Fig. 16. The amount of effort needed for the creation of
FE models of such structures should not be underestimated.
In spite of parameterised input possibilities and extensive
graphic support, experience has shown that this type of analysis
can hardly be carried out within the given time schedule.
In addition, other important parameters of influence, such as
rotational stiffnesses at plate field edges and effective mass
distributions, also have to be taken into account here.
20
propeller blade frequency (10.8 Hz). Although propulsion
power was comparatively low, damage occurred in the aft
stern tube bearing. Through an increase in the diameter of
the propeller shaft, the relevant natural frequency was raised
by about 4 Hz, resulting in an adequate safety margin relative to
the propeller blade frequency.
8/8/2019 GL Ship Vibration
http://slidepdf.com/reader/full/gl-ship-vibration 20/51
21
Fig. 16: Structural components in local vibration calculations
3.3.1 Calculation Methods For practical calculation of natural frequencies of geometri-
cally simple structures, it is most effective to use analytical
approximation formulas, for example as mentioned in [19]
and [20]. As long as assumptions for the derivation of these
formulas are valid, results will be in good agreement with those
achieved by more complex methods. The basic assumptions
are:
• Freely rotatable, non-displaceable supporting conditionsat edges
• Rectangular shape
• Regular arrangement of stiffeners
• No pillars or stanchions within the panel area
• Uniform distribution of added mass
If these preconditions are not fulfilled, the structures must
be reproduced in an FE model. For these problems, the best
cost/benefit ratio is certainly offered by beam grillage models.
However, the effective width of the deck plating to be included
in the section moment of inertia of beam elements depends on the vibration mode to be determined. Therefore, models of
this quality are used only to determine basic vibration modes
of deck panel structures. If higher modes are to be included
in the analysis, models with greater precision are required to
simulate the stiffening effect in a three-dimensional form. In
particular, webs of girders and stiffeners must be represen-
ted with the aid of membrane or shell elements and flanges
by means of truss or beam elements.
The distribution of effective masses is often impossible to
specify accurately. However, as verified in a large number of
local vibration analyses, it is recommended to take an
effective added mass of 40 kg/m2 into account for decks in
living and working spaces. Assuming freely rotatable edge
conditions, this leads to adequate scantlings of local
structures from a vibration point of view. For walls, an added
mass of 20 kg/m2 should be chosen. For tank walls, hydro-
dynamic masses of tank fillings have, of course, to be
considered.
There are a number of other parameters that influence
natural frequencies of local structures, such as:
• Curvature of the structure
• Residual stresses of welds or distortions – see [21]
• Vibration behaviour of adjacent structures
Taking account of these imponderables, it becomes clear
that the main aim is often not to predict natural frequencies
of local structures with a high degree of accuracy, but rather
to ensure a “basic stiffness” throughout the structure. Evenin case of resonances of vibration modes with higher excita-
tion orders, this “basic stiffness” will ensure a moderate
level.
In this connection, the concept of “critical lengths” for the
design of plate fields and stiffeners turns out to be useful.
The plate field and stiffener lengths that must not be ex-
ceeded are specified for the designer, based on relevant
excitation frequencies. Critical lengths of plate fields can
be determined in an iterative process, considering frame
spacing, plate thickness and added mass. For the calculation
of maximum stiffener lengths, the profile type is also used.
3.3.2 Design CriteriaNormally, an attempt is made to achieve a subcritical design
of all structural components relative to the main excitation
frequencies. Only structures situated in the vicinity of main
excitation sources (propeller, main engine, bow thruster) are
considered. In a first step, plate thicknesses and dimensions
of stiffeners and girders are determined in the preliminary
design phase in accordance with relevant Classification
Rules. In particular, for accommodation decks with higheradded masses and tank structures on which hydrodynamic
masses act, vibration-related aspects often necessitate
stronger dimensioning compared to Rule requirements.
The following recommendations for minimum natural
frequencies of local structures can be stated as a guide:
fnatural > 1.2 x twice the propeller blade frequency or main
engine ignition frequency in the ship’s
aftbody, engine room and deckhouse area
fnatural
> 1.1 x four times the propeller blade frequency for
the ship’s shell structure directly above the
propeller

8/8/2019 GL Ship Vibration
http://slidepdf.com/reader/full/gl-ship-vibration 21/51
22
with other design questions is another reason for examining
the design from a vibration point of view as early as possible.
One typical example is the choice of web heights of deck
girders in the accommodation area. In practice, web heights
that can be implemented are limited by restricted deck heights
and by the need for adequate space under the flange plane
of the deck grillage for routing of piping and cable runs.
In these areas, web heights of 250 to 400 mm are aimed at
although this can lead to comparatively soft panel structures
if supporting walls are far away. An alternative is the selec-
tion of high-webbed girders (600 – 800 mm), which offer suffi-
cient margin to route piping and cables through adequately
large cut-outs in webs.
The close relationship between vibration related questions
and other design targets is illustrated by the example of a
container ship that exhibited large vibrations on the bridge
deck. The equipment numeral of a ship according to applicableClassification Rules depends on the closed wind-drag area
of the deckhouse. To keep the equipment numeral low, the
shipyard decided to make a break in the deckhouse front
and aft bulkhead in the space under the bridge deck, as this
space was not needed for living purposes, and to replace the
bulkhead by an open beam structure. Thus, on the one hand,
the desired aim of reducing the equipment numeral and,
consequently, saving money in the purchase of, e.g., the anchor
gear was achieved. On the other hand, however, this design
variant also resulted in a reduced shear stiffness which, in
turn, led to a high vibration level on the bridge deck.
3.3.4 Case StudyThe importance of freedom from resonance and of a certain
degree of stiffness for structural components is demonstrated
examplarely on damaged fresh water tanks of a container
ship. Because of operational requirements, the tanks were
moved one deck level higher compared to the original
design. This retrospective measure had evidently not been
checked with regard to vibration aspects. The stiffening
system of the aft tank-bulkhead and the longitudinal wall issketched in Fig. 17. In the entire frequency range around
nominal speed (≈110 – 130 r/min), severe vibrations of the
tank structures occurred. Measurements revealed vibration
velocities about 30 – 50 mm/s at the centre of plate fields
and 15 – 30 mm/s at stiffeners. Asymmetrical stiffener
profiles exhibited vibration velocities of up to 30 mm/s in
their flange plan. Depending on measurement location,
engine speed and filling level, excitation frequencies were
either the propeller blade frequency, twice that frequency
(≈ 10 and 20 Hz) or the ignition frequency of the main engine
(≈14 Hz). A rough check indicated that natural frequencies of
all structural components of the tanks lay in the range
between 10 and 20 Hz.
For a subcritical design, the assumption of simply supported
edges is conservative since each constraining effect
increases the safety margin between natural frequency and
excitation frequency. Freely rotatable support can normally
be assumed for plate fields. This assumption can, however,
lead to considerable overdimensioning of stiffeners and
girders connected via brackets to adjacent structures. Such
brackets cause a certain clamping effect that, in turn, leads
to an increased stiffness. To compensate for this, bracket
connections are often accounted for in the design process
by taking about 70 % - 50 % of the actual bracket length as
”effective“ in the analysis.
In most cases, it is sufficient to design natural frequencies of
structural components subcritically up to about 35 Hz. Any
further increase of natural frequencies requires an unjusti-
fiable amount of effort. A supercritical design or a ”design in
frequency windows“ should be chosen with regard to higherdominant excitation frequencies.
Dimensioning principles stated above are fairly easy to put
into practice in case of cargo vessels. However, for passenger
ships the design of local structures with natural frequencies
above 20% of twice the propeller blade frequency is generally
impossible to realize for weight reasons. In such cases, struc-
tures are designed “in the window” between blade frequency
and twice that frequency, provided main engines are mounted
elastically. In these cases the design frequency band is con-
sequently small. Therefore, a larger amount of computation
effort is required to ensure that natural frequencies are cal-
culated with the necessary degree of accuracy. More effort
has then to be spent on modelling boundary conditions,
specific structural features, effective masses, etc.. Designs
aiming at less than the single blade frequency are inadvisable
for reasons of lack of stiffness.
However, there is a strong interaction between local vibrations
of structures and ship’s acoustics. This relationship is mani-
fested by the fact that a ship whose local structures have
been consistently designed in respect to vibration also gains
acoustic advantages.
3.3.3 Inclusion in the Design Process The earlier the stage at which vibration related aspects are
included in the design, the simpler and better the solutions
are. If the shipyard has no experience with this matter, an
external expert should be consulted after completion of the
general arrangement plan and after the propulsion plant has
been fixed, i.e., when dominant excitation frequencies are
known. Even at this early stage, it is advisable to introduce
concepts of the stiffening pattern for decks and tank walls in
the ship’s aftbody and deckhouse area. The intermeshing

8/8/2019 GL Ship Vibration
http://slidepdf.com/reader/full/gl-ship-vibration 22/51
23
Thus, it was no wonder that cracks shown in the sketch
occurred after a comparatively short period of operation.
After raising natural frequencies of all local structures to
about 24 Hz, the problem was solved.
Fig. 17: Vibration damage to a
freshwater tank in the
aft part of a ship
The greater the mode density, the more difficult it becomes
to apply the criterion of resonance avoidance. Computation
of forced vibrations often turns out to be the only possibility
of assessing on a rational basis the large number of natural
frequencies. In addition to a realistic simulation of stiffness
and mass characteristics of the structure, it is thus necessary
to consider damping and excitation forces.
Ultimately, it must be proven during sea trials that maximumvibration velocities specified in the newbuilding contract are
not exceeded. Therefore, a complete judgement of ship
vibrations cannot be limited to an analysis of the free vibra-
tion problem, but must also give an insight into vibration
amplitudes expected at critical points.
4.1 Computation Methods
A large number of FE programs provide various algorithms
for solving the equation of motion of forced vibrations in
MDOF (“Multiple Degree of Freedom”) systems. Basically, a
distinction has to be drawn between solutions in the time
domain and those in the frequency domain. In ship structural
applications, the solution in the time domain is confined to
special cases, such as the analysis of the vibration decay of
a ship’s hull in the event of excitation by a slamming impact
(“whipping”), for example.
Vibration questions in shipbuilding mainly involve types of
excitation which are either harmonic or which are capable of
being represented as a harmonic series and, therefore, can be
distinguished by a characteristic frequency-content.
Because of its extraordinarily high numerical effectiveness,
the mode superposition method, [22] and [23], achieved great
acceptance for calculation of the forced vibration level.
In this process, the first step is to determine natural vibrations
of the structure in the frequency range of interest. Natural
modes are then transformed and used as generalized, ortho-
gonal coordinates. This procedure causes a decoupling of
all degrees of freedom contained in the equation of motion.
Due to this a reduction of the effort needed to solve the
equation system is achieved. Thus, it is possible to compute
the vibration level even for large systems over a wide range
of frequencies at moderate cost.
4. Calculation of Forced Vibrations

8/8/2019 GL Ship Vibration
http://slidepdf.com/reader/full/gl-ship-vibration 23/51
2 · π ⋅ ϑ• Logarithmic decrement Λ [-], where Λ =
1 – ϑ2
• Degree of damping ϑ or
Lehr’s damping coefficient D [-],
bwhere ϑ = and c = stiffness, m = mass
c · m
24
4.3 Excitation Forces
In ship technology, with the exception of special problems
(e.g. impact excitation), periodically varying excitation forces
are of interest. If the excitation forces do not vary harmoni-
cally, they can usually be split into harmonic components
(excitation orders) with the aid of a Fourier analysis.
Excitation forces are introduced into the ship’s structure by a
large number of machinery units:
• Main engines and auxiliary machinery: excitationfrequencies are half and/or whole multiples of the
frequencies of revolution.
• Shaft machinery: excitation frequencies are equal to the
frequency of revolution and, in case of cardan shafts, also
to twice that frequency.
• Compressors: excitation frequencies are equal to the
frequency of revolution and to twice that frequency.
• Gearboxes: excitation frequencies are equal to
frequencies of revolution and meshing.
• Propellers: excitation frequencies are equal to the blade
frequency and its multiples.
Fig. 18: Modal damping for global calculations of vibrations
In structural mechanics, Lehr’s damping coefficient is normally
used in form of modal damping. It refers to individual natural
vibration modes which, in the context of the mode super-
position method, can each be thought of as a SDOF (“Single
Degree of Freedom”) system. Thus, in case of MDOF systems,
each natural vibration mode has a particular damping coeffi-
cient assigned to it. To illustrate the magnitude of damping,
the logarithmic decrement can be calculated from the modal
damping by means of the relation stated above. For a modal
damping of 2%, for example, the value of Λ is 0.13. According
to the definition of the logarithmic decrement, eΛ corresponds to the amplitude ratio A1 /A2 of two successive maxima in the
vibration decay of a natural vibration mode excited by an
impact force. From Λ = 0.13, it follows that A1 /A2 = 1.13. Thus,
the amplitude decreases by 13% with each vibration cycle.
Whereas material damping is easy to quantify (0.5 – 1.5%),
component damping depends mainly on floor and deck
coverings (4 – 10%). Cargo damping is heavily dependent on
the nature of the cargo (container, fluid, bulk, etc.). Hydro-
dynamic damping is generally regarded as negligible in the
frequency range of ship vibrations. Torsional and axial vibration
damping devices of crankshafts as well as hydraulic units of
transverse engine stays are examples for mechanical
Various physical mechanisms contribute to damping of
vibrations on ships:
• Material damping
• Component damping, especially that produced by floor
and deck coverings
• Cargo damping
• Hydrodynamic damping
• Mechanical damping (concentrated damping)
To characterize damping properties of a structure or a
vibration absorber, a number of different parameters are
used:
damping systems. In the literature, widely differing values are
stated for damping characteristics in ship structural applica-
tions. There are clear descriptions in [24] and [25]. For the
higher frequency range in particular, it turns out to be difficult
to measure modal damping coefficients since the mode density
is high and natural modes can, therefore, not be definitely
identified by measurements. However, the damping grows with
increasing frequency. For calculation of global vibrations,
e.g., for container vessels, satisfactory results for the damping
coefficient as a function of frequency were achieved with the
approach outlined in Fig. 18.
4.2 Damping
damping force N• Damping coefficient b =
vibration velocity m/s
8/8/2019 GL Ship Vibration
http://slidepdf.com/reader/full/gl-ship-vibration 24/51
25
In addition, there are some special types of vibration excita-
tion, such as periodic flow-separation phenomenon at struc-
tural appendages or torque fluctuations in electric engines.
In this paper, only the main sources of excitation will be dealt
with, i.e., the excitation effects stemming from propeller and
main engine.
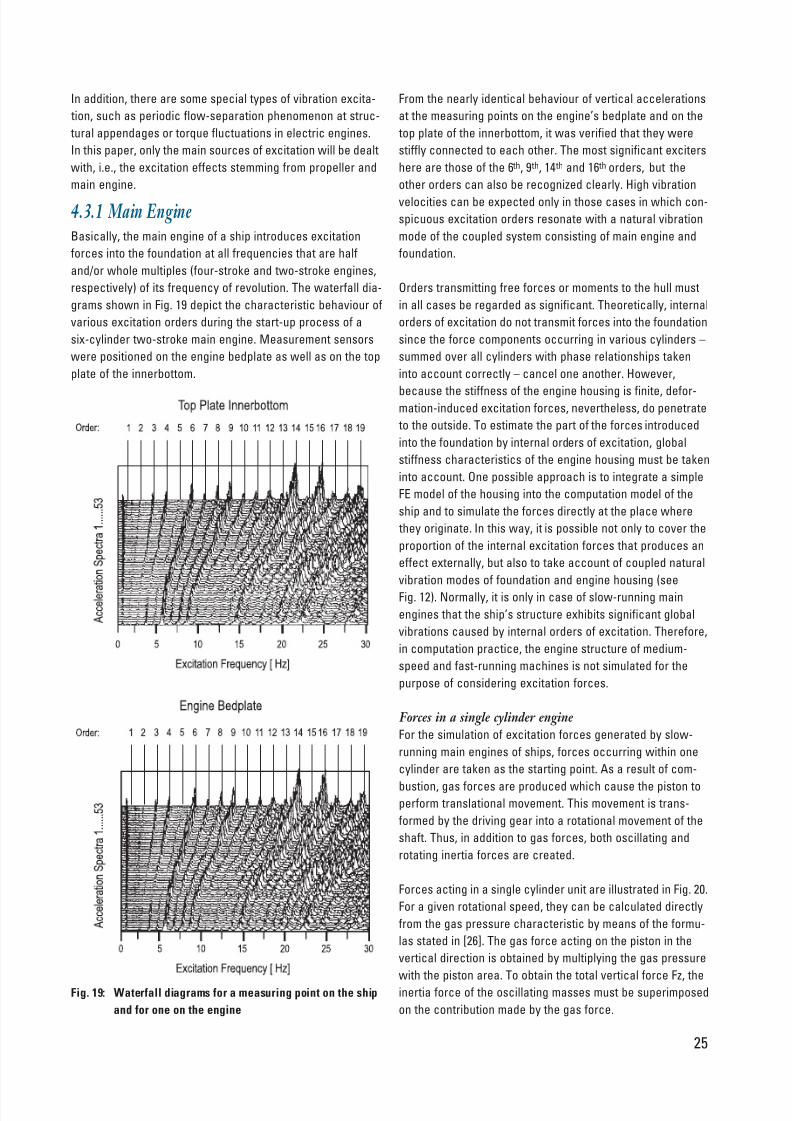
4.3.1 Main EngineBasically, the main engine of a ship introduces excitation
forces into the foundation at all frequencies that are half
and/or whole multiples (four-stroke and two-stroke engines,
respectively) of its frequency of revolution. The waterfall dia-
grams shown in Fig. 19 depict the characteristic behaviour of
various excitation orders during the start-up process of a
six-cylinder two-stroke main engine. Measurement sensors
were positioned on the engine bedplate as well as on the top
plate of the innerbottom.
From the nearly identical behaviour of vertical accelerations
at the measuring points on the engine’s bedplate and on the
top plate of the innerbottom, it was verified that they were
stiffly connected to each other. The most significant exciters
here are those of the 6 th, 9 th, 14 th and 16 th orders, but the
other orders can also be recognized clearly. High vibration
velocities can be expected only in those cases in which con-
spicuous excitation orders resonate with a natural vibration
mode of the coupled system consisting of main engine and
foundation.
Orders transmitting free forces or moments to the hull must
in all cases be regarded as significant. Theoretically, internal
orders of excitation do not transmit forces into the foundation
since the force components occurring in various cylinders –
summed over all cylinders with phase relationships taken
into account correctly – cancel one another. However,
because the stiffness of the engine housing is finite, defor-mation-induced excitation forces, nevertheless, do penetrate
to the outside. To estimate the part of the forces introduced
into the foundation by internal orders of excitation, global
stiffness characteristics of the engine housing must be taken
into account. One possible approach is to integrate a simple
FE model of the housing into the computation model of the
ship and to simulate the forces directly at the place where
they originate. In this way, it is possible not only to cover the
proportion of the internal excitation forces that produces an
effect externally, but also to take account of coupled natural
vibration modes of foundation and engine housing (see
Fig. 12). Normally, it is only in case of slow-running main
engines that the ship’s structure exhibits significant global
vibrations caused by internal orders of excitation. Therefore,
in computation practice, the engine structure of medium-
speed and fast-running machines is not simulated for the
purpose of considering excitation forces.
Forces in a single cylinder engine
For the simulation of excitation forces generated by slow-
running main engines of ships, forces occurring within one
cylinder are taken as the starting point. As a result of com-
bustion, gas forces are produced which cause the piston toperform translational movement. This movement is trans-
formed by the driving gear into a rotational movement of the
shaft. Thus, in addition to gas forces, both oscillating and
rotating inertia forces are created.
Forces acting in a single cylinder unit are illustrated in Fig. 20.
For a given rotational speed, they can be calculated directly
from the gas pressure characteristic by means of the formu-
las stated in [26]. The gas force acting on the piston in the
vertical direction is obtained by multiplying the gas pressure
with the piston area. To obtain the total vertical force Fz, the
inertia force of the oscillating masses must be superimposed
on the contribution made by the gas force.
Fig. 19: Waterfall diagrams for a measuring point on the ship
and for one on the engine

8/8/2019 GL Ship Vibration
http://slidepdf.com/reader/full/gl-ship-vibration 25/51
26
Fig. 20: Forces in the single-cylinder engine
Naturally, engine forces – formulated in cartesian coordinates –
can be converted to polar coordinates, so that the tangential
and radial forces acting on the crank web pins are obtained.
The product of the transverse force and the current distance
between main bearing and crosshead gives the moment
about the longitudinal axis of the engine. For reasons of
equilibrium, this moment must equal (at ignition frequency)
the torque generated by the tangential force.
The characteristic of various force components is shown in
Fig. 20, taking an engine with a cylinder power of 4200 kW
and a revolution rate of 104 r/min as an example. The maxi-
mum vertical force is about 4200 kN, whereas a force of about
1100 kN acts in transverse direction.
In the next step, the force curves shown are transformed
into the frequency domain by means of a Fourier analysis. If
vibrations of the crankshaft or shaft line are to be considered,
harmonic components of the tangential and radial forces are
applied as sources of excitation. If, on the other hand, engine
housing vibrations play the major role, vertical and transverse
forces have to be considered.
Application of the Total Excitation Forces If forces acting in a single cylinder unit are known for the
individual orders, their phase relationship with other cylinder
units can be calculated, considering the ignition sequence. In
the next step, vertical and transverse forces are applied –
with the correct phase relations – to relevant nodes of the FE
model of the engine housing. Fig. 21 shows a schematical
“snapshot” for a typical distribution of excitation forces of
an engine housing. Vertical forces are assumed to be acting
on the top of cylinder units and on main bearings, whereas
transverse forces are acting at the centre of the crossheadguide and on main bearings. Another advantage of this
procedure lies in the simple method of taking account of irre-
gular ignition sequences and in the possibility of simulating
ignition failures, for instance.
To judge whether excitation forces of the individual order are
significant, forces acting in their planes of effect are added
over the length of the engine, with the phase relationships
being taken into account correctly. Let Fyi, k and Fzi, k be the
complex force amplitudes of order “i” acting on cylinder “k”,
let “dxk” be defined as the distance of cylinder “k” from the
centre of the engine, and let “dzk” be defined as the distance
between main bearings and crosshead guide.
Table 3
Fz [kN] Fy [kN]Ord. From Gas Forces From Osc. Total Force
Inertia Forces
1 2553 3575 508
2 1712 875 165
3 1133 0 37
4 736 31 144
5 414 0 101
6 237 0 54
7 133 0 37
8 63 0 23
Fz is transmitted via the piston rod, connecting rod and crank-
shaft into the main bearings where corresponding reaction
forces act. The engine housing is thus subjected to a periodic
change of compressive and tensile forces of considerable
magnitude.
Owing to the oblique position of the connecting rod, a trans-
verse force is created that affects the crosshead guide. Like
the vertical force, it is transmitted via the engine housing into
the main bearings where, in turn, the equilibrium forces act.
The magnitude of excitation forces decreases with in-
creasing order. Influence exerted by the oscillating masses
exists for the first, second and fourth order of excitation.
The values quoted are valid for the revolution rate on which
the calculation is based. For revolution rates varying linearly,
both inertia forces and mean gas pressure change quadrati-
cally. However, this does not apply exactly to individual
harmonic components of the gas pressure. In computation
practice, this inaccuracy is tolerated in return for a consi-
derable reduction of data input.
The following table summarizes harmonic components of
vertical and transverse forces for the single cylinder engine
described above:

8/8/2019 GL Ship Vibration
http://slidepdf.com/reader/full/gl-ship-vibration 26/51
• Vertical moment of inertia(external)
• Horizontal moment of inertia(external)
• H-type moment (external)
• X-type moment (internal)
• Pitching moment (internal)
27
Except for the pitching moment, all excitation parameters
can be taken from the engine manufacturers’ standard cata-
logues. However, the danger of pronouced vibrations cannot
be estimated on the basis of these values alone. It is also
necessary to consider whether the shape of the force distri-
bution also corresponds to a coupled engine and foundation
vibration mode. Vertical moments of inertia and pitching mo-
ments mainly excite bending vibrations of the doublebottom
in conjunction with an L-type vibration mode of the main
engine. Horizontal moments of inertia and X-type moments
MVi =∑Fz – Osc · dxk
i,k
nk
k=1
MHi=∑Fy – Rot · dxki,k
nk
k=1
MDi=∑Fy – Gas · dzki,k
nk
k=1
MXi=∑Fy – Gas ·dxki,k
nk
k=1
MPi=∑Fz – Gas ·dxki,k
nk
k=1
^
^
FY i, k
^
Fig. 21: Typical excitation force distribution over the engine
frame of a ship’s slow-running main engine
Thus, the following quantities can be defined for individual
orders “i” of excitation; see also [27]. The subscripts “Osc”,
“Rot” and “Gas” indicate the physical cause of force effects
(oscillating/rotating masses and gas forces).
cause torsional vibrations of the engine housing about the
vertical axis. Although excitations mentioned last can cause
high vibrations in the transverse direction at the top of the
engine, they are normally of minor interest as far as exci-
tation of the foundation is concerned. The recommendations
of the manufacturers to provide engines with a large number
of cylinders with transverse bracings are mainly aimed at
avoiding resonance with the X-type natural vibration modes.
However, installation of transverse stays also causes an
increase in the H-type natural frequency of the main engine.
In case of engines with six or seven cylinders and a revo-
lution rate of about 100 r/min, transverse bracings may, in
turn, result in unfavourable resonance situations with the
H-type moment acting at ignition frequency.
The choice of number of cylinders for a ship’s main engine
is not based primarily on vibration aspects. However, the
following table provides an indication for slow-running engineshaving 5 to 9 cylinders and the usual ignition sequences,
which orders of excitation may have a significant effect on
global ship vibrations.
Number of Order of Excitation
Cylinders 1st 2nd 3rd 4 th 5 th 6 th 7 th 8 th 9 th
5 – – – –
6 – – – –
7 – – – –
8 – – – – –
9 – –
Influence Exists – Negligible Influence
Table 4
Secondary sources of excitation, especially axial force
fluctuations that result from vibrations of the crankshaft
and shaft line, are not taken into account in this table,
since no general statements can be made in this context.
4.3.2 Propeller From the propeller, excitation forces are transmitted into
the ship via the shaft line and in form of pressure pulses
acting on the ship’s shell. Whereas shaft line forces are
the most significant factor for vibrations of shaft lines, the
predominant factor for vibrations of ship structures are
pressure fluctuations.
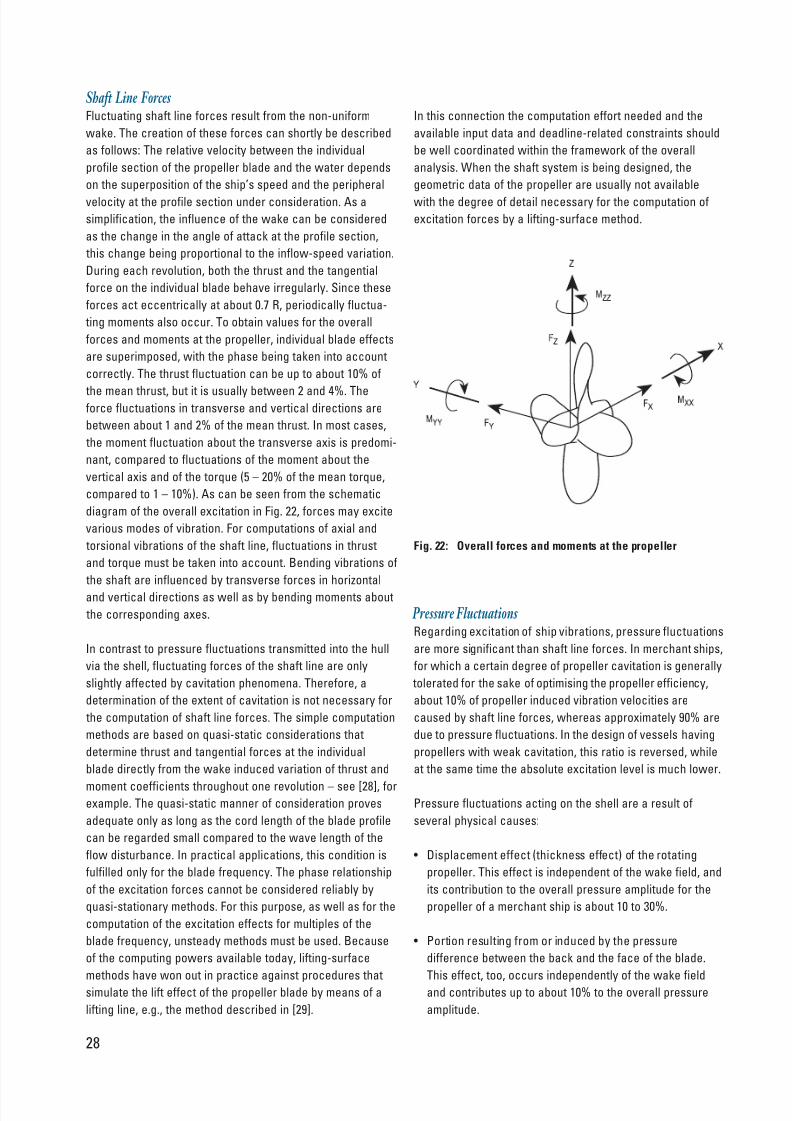
8/8/2019 GL Ship Vibration
http://slidepdf.com/reader/full/gl-ship-vibration 27/51
28
Fig. 22: Overall forces and moments at the propeller
Shaft Line Forces Fluctuating shaft line forces result from the non-uniform
wake. The creation of these forces can shortly be described
as follows: The relative velocity between the individual
profile section of the propeller blade and the water depends
on the superposition of the ship’s speed and the peripheral
velocity at the profile section under consideration. As a
simplification, the influence of the wake can be considered
as the change in the angle of attack at the profile section,
this change being proportional to the inflow-speed variation.
During each revolution, both the thrust and the tangential
force on the individual blade behave irregularly. Since these
forces act eccentrically at about 0.7 R, periodically fluctua-
ting moments also occur. To obtain values for the overall
forces and moments at the propeller, individual blade effects
are superimposed, with the phase being taken into account
correctly. The thrust fluctuation can be up to about 10% of
the mean thrust, but it is usually between 2 and 4%. Theforce fluctuations in transverse and vertical directions are
between about 1 and 2% of the mean thrust. In most cases,
the moment fluctuation about the transverse axis is predomi-
nant, compared to fluctuations of the moment about the
vertical axis and of the torque (5 – 20% of the mean torque,
compared to 1 – 10%). As can be seen from the schematic
diagram of the overall excitation in Fig. 22, forces may excite
various modes of vibration. For computations of axial and
torsional vibrations of the shaft line, fluctuations in thrust
and torque must be taken into account. Bending vibrations of
the shaft are influenced by transverse forces in horizontal
and vertical directions as well as by bending moments about
the corresponding axes.
In contrast to pressure fluctuations transmitted into the hull
via the shell, fluctuating forces of the shaft line are only
slightly affected by cavitation phenomena. Therefore, a
determination of the extent of cavitation is not necessary for
the computation of shaft line forces. The simple computation
methods are based on quasi-static considerations that
determine thrust and tangential forces at the individual
blade directly from the wake induced variation of thrust and
moment coefficients throughout one revolution – see [28], forexample. The quasi-static manner of consideration proves
adequate only as long as the cord length of the blade profile
can be regarded small compared to the wave length of the
flow disturbance. In practical applications, this condition is
fulfilled only for the blade frequency. The phase relationship
of the excitation forces cannot be considered reliably by
quasi-stationary methods. For this purpose, as well as for the
computation of the excitation effects for multiples of the
blade frequency, unsteady methods must be used. Because
of the computing powers available today, lifting-surface
methods have won out in practice against procedures that
simulate the lift effect of the propeller blade by means of a
lifting line, e.g., the method described in [29].
Pressure Fluctuations Regarding excitation of ship vibrations, pressure fluctuations
are more significant than shaft line forces. In merchant ships,
for which a certain degree of propeller cavitation is generally
tolerated for the sake of optimising the propeller efficiency,
about 10% of propeller induced vibration velocities are
caused by shaft line forces, whereas approximately 90% are
due to pressure fluctuations. In the design of vessels having
propellers with weak cavitation, this ratio is reversed, while
at the same time the absolute excitation level is much lower.
Pressure fluctuations acting on the shell are a result of
several physical causes:
• Displacement effect (thickness effect) of the rotating
propeller. This effect is independent of the wake field, and
its contribution to the overall pressure amplitude for the
propeller of a merchant ship is about 10 to 30%.
• Portion resulting from or induced by the pressure
difference between the back and the face of the blade.
This effect, too, occurs independently of the wake field
and contributes up to about 10% to the overall pressure
amplitude.
In this connection the computation effort needed and the
available input data and deadline-related constraints should
be well coordinated within the framework of the overall
analysis. When the shaft system is being designed, the
geometric data of the propeller are usually not available
with the degree of detail necessary for the computation of
excitation forces by a lifting-surface method.

8/8/2019 GL Ship Vibration
http://slidepdf.com/reader/full/gl-ship-vibration 28/51
p = where = fluid density.
29
The pressure amplitude is thus proportional to the acceler-
ation of the volume of the cavitation layer. The formula is
applicable for the free field and does not take account of the
obstructing effect of the ship’s hull. The magnitude of this
effect depends on the geometry of the ship’s hull and must
be determined separately.
To derive the pressure amplitude from the formula statedabove, the curve of the cavitation volume versus propeller
blade position must be known. Principally, this curve can be
estimated by calculation, by model experiment or by full-
scale observation. However, the quantity to be used is the
second derivation of the cavitation volume curve, i.e., the
pressure amplitude is governed by the curvature of the
volume curve.
Calculation of the volume curve requires knowledge of the
pressure distribution on the propeller blade, both in the radial
and circumferential direction. The flow condition in the tip
region of the propeller blades has a particularly strong
influence on cavitation phenomena. The flow condition at the
blade tips is additionally complicated by the formation and
subsequent detaching of tip vortices. Computation programs
for the prediction of cavitation volumes are correspondingly
complex.
To avoid strong cavitation induced pressure amplitudes, the
volume curve should exhibit the smallest possible curvatures.
This can be achieved by influencing the wake (minimizing
wake peaks) and by a suitable choice of propeller geometry.
However, improved cavitation characteristics must normally
be “paid for” by reductions in efficiency. Selection of a larger
area-ratio Ae/A0 and reduction of the propeller tip loading by
selection of smaller pitch and camber at the outer radii are
the most effective measures. In addition, by means of skew,
a situation can be achieved where the individual profile
sections of a propeller blade are not all subjected to their
maximum loading at the same time, but instead the volumecurve is rendered uniform by the offset in the circumferential
direction. Some concepts tolerate comparatively severe
cavitation phenomena and are aimed at making the growth
and collapse of the cavitation layer as slow as possible; see
[32], for example.
The formula stated above characterizes the principal
mechanism of creation of pressure fluctuations, but it is not
suitable for the actual prediction. The corresponding compu-
tation methods can be divided into empirical, semi-empirical
and numerical procedures:
The method presented in [33] is a purely empirical procedure
where the pressure amplitude is determined from a small
amount of geometric data related to the propeller as well as
from the wake. The formulas given therein are based on re-
gression analyses of data determined with a large number of
full-scale measurements. However, propellers having a high
skew are not covered by these statistics. For high-skew pro-
pellers, an appropriate correction can be made in accordance
with [34], for example.
One semi-empirical method is the Quasi-Continuous Method,[35] and [36], developed at the Hamburg Ship Model Basin
(HSVA). Here the determination of the expected cavitation
volume curve is performed with the aid of a numerical
approximation process based on vortex distribution. The
following step, namely the calculation of the pressure ampli-
tude from the cavitation volume for a given geometry of the
ship’s shell, is carried out by means of empirical formulas.
With software based on [29], the latter calculation step, too,
is performed using a numerical approximation method.
A comparison of results obtained from empirical and semi-
empirical methods with full-scale measurements is dealt with
in [37]. An evalutation of the two methods is described in [38].
ρ 1 ∂2V· ·4π r ∂ t2
• Displacement effect of the fluctuating cavitation layer
that typically forms when the propeller blade is moving
through the wake peak in the region of the outer radii. For
the propeller of a merchant ship, the contribution of this
effect to the overall pressure amplitude is approximately
60 to 90%.
Pressure pulses on the shell are also caused by the induction
and displacement effect of the propeller tip vortex and the
collapse of the individual cavity bubbles. Whereas the
former process mainly has an effect in the frequency range
corresponding to the higher harmonics of the propeller blade
(see [30], for example), the latter phenomenon mainly influen-
ces the excitation characteristics in the noise frequency range.
Both processes are excitation phenomena that, at present,
are scarcely amenable to methods of calculation and should
– if necessary – be investigated in a cavitation tunnel. In thefollowing, these special aspects will not be dealt with.
From the above mentioned contributions to the overall
pressure amplitude, it can be concluded that high excitation
forces can be expected only in case of cavitating propellers.
As described in [31], for example, pressure pulses caused by
a fluctuating cavitation volume V at a point situated at a
distance r can be approximated by the following formula:
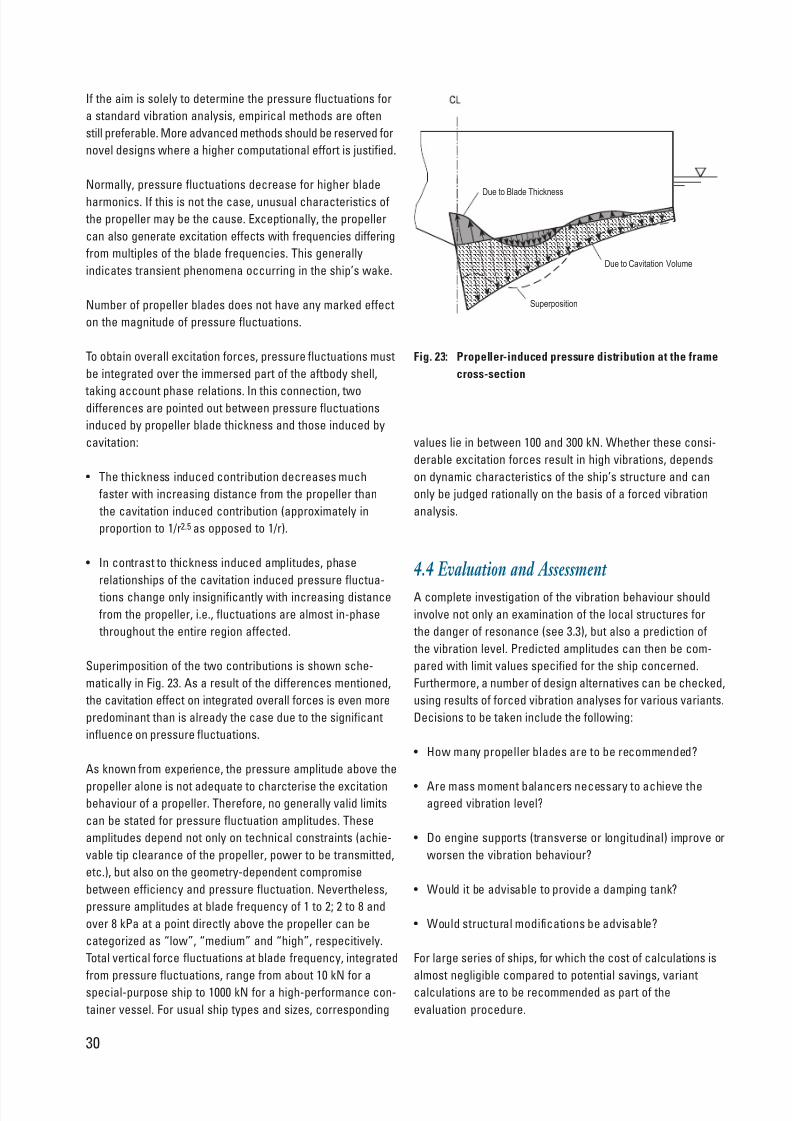
8/8/2019 GL Ship Vibration
http://slidepdf.com/reader/full/gl-ship-vibration 29/51
Due to Blade Thickness
Due to Cavitation Volume
Superposition
30
If the aim is solely to determine the pressure fluctuations for
a standard vibration analysis, empirical methods are often
still preferable. More advanced methods should be reserved for
novel designs where a higher computational effort is justified.
Normally, pressure fluctuations decrease for higher blade
harmonics. If this is not the case, unusual characteristics of
the propeller may be the cause. Exceptionally, the propeller
can also generate excitation effects with frequencies differing
from multiples of the blade frequencies. This generally
indicates transient phenomena occurring in the ship’s wake.
Number of propeller blades does not have any marked effect
on the magnitude of pressure fluctuations.
To obtain overall excitation forces, pressure fluctuations must
be integrated over the immersed part of the aftbody shell,
taking account phase relations. In this connection, twodifferences are pointed out between pressure fluctuations
induced by propeller blade thickness and those induced by
cavitation:
• The thickness induced contribution decreases much
faster with increasing distance from the propeller than
the cavitation induced contribution (approximately in
proportion to 1/r2.5 as opposed to 1/r).
• In contrast to thickness induced amplitudes, phase
relationships of the cavitation induced pressure fluctua-
tions change only insignificantly with increasing distance
from the propeller, i.e., fluctuations are almost in-phase
throughout the entire region affected.
Superimposition of the two contributions is shown sche-
matically in Fig. 23. As a result of the differences mentioned,
the cavitation effect on integrated overall forces is even more
predominant than is already the case due to the significant
influence on pressure fluctuations.
As known from experience, the pressure amplitude above the
propeller alone is not adequate to charcterise the excitationbehaviour of a propeller. Therefore, no generally valid limits
can be stated for pressure fluctuation amplitudes. These
amplitudes depend not only on technical constraints (achie-
vable tip clearance of the propeller, power to be transmitted,
etc.), but also on the geometry-dependent compromise
between efficiency and pressure fluctuation. Nevertheless,
pressure amplitudes at blade frequency of 1 to 2; 2 to 8 and
over 8 kPa at a point directly above the propeller can be
categorized as “low”, “medium” and “high”, respecitively.
Total vertical force fluctuations at blade frequency, integrated
from pressure fluctuations, range from about 10 kN for a
special-purpose ship to 1000 kN for a high-performance con-
tainer vessel. For usual ship types and sizes, corresponding
Fig. 23: Propeller-induced pressure distribution at the frame
cross-section
4.4 Evaluation and Assessment
A complete investigation of the vibration behaviour should
involve not only an examination of the local structures for
the danger of resonance (see 3.3), but also a prediction of
the vibration level. Predicted amplitudes can then be com-
pared with limit values specified for the ship concerned.
Furthermore, a number of design alternatives can be checked,
using results of forced vibration analyses for various variants.
Decisions to be taken include the following:
• How many propeller blades are to be recommended?
• Are mass moment balancers necessary to achieve theagreed vibration level?
• Do engine supports (transverse or longitudinal) improve or
worsen the vibration behaviour?
• Would it be advisable to provide a damping tank?
• Would structural modifications be advisable?
For large series of ships, for which the cost of calculations is
almost negligible compared to potential savings, variant
calculations are to be recommended as part of the
evaluation procedure.
values lie in between 100 and 300 kN. Whether these consi-
derable excitation forces result in high vibrations, depends
on dynamic characteristics of the ship’s structure and can
only be judged rationally on the basis of a forced vibration
analysis.

8/8/2019 GL Ship Vibration
http://slidepdf.com/reader/full/gl-ship-vibration 30/51
31
For optimization of a design from the vibration viewpoint,
evaluation methods that reflect the spatial distribution of
vibration velocities for individual excitation frequencies
proved to be helpful. In the following, some possibilities for
a corresponding evaluation of calculation results of forced
vibrations are described.
4.4.1 Vibration Velocity (Response) SpectraIt is recommended to perform the calculation of forced vibra-
tions separately for relevant orders and sources of excitation,
because the vibration response determined can then be
attributed to a definite cause. Furthermore, a judgement can
be conducted directly according to the old ISO 6954 standard
as described in section 2.1 and the determination of overall
frequency weighted r.m.s. values according to the new stan-
dard can be derived from amplitudes calculated for individual
excitation orders. Since natural frequencies vary for differentloading conditions and also because, in many cases, a parti-
cular revolution rate has not been specified, investigations
should be carried out over a large frequency range. Therefore,
calculation of amplitude spectra has proven its worth in
practice.
A determination of the vibration response over the total
frequency range for all nodal points of the FE model is not
possible in practice, nor is it necessary. This form of evalua-
tion is generally performed for a maximum of about 50 repre-
sentative points of the ship’s structure.
Fig. 24 shows two typical vibration velocity spectra. Here,
predicted vibration velocities at a stiffly supported (global)
point on the bridge deck of a container ship is shown. The
upper diagram applies to excitation by the 2nd order of the
main engine (external vertical mass moment) and the lower
diagram refers to the 7 th order fluctuation of torque (ignition
frequency). Vibration velocities (peak values) in longitudinal
(x), and transverse (y) directions are plotted logarithmically
for a range surrounding the nominal revolution rate. The
latter is indicated by a vertical line in the diagrams. The
lower and upper limit lines as per the old ISO 6954 are high-lighted by horizontal lines. Vibration velocities determined
during full-scale measurement are likewise shown (curves
with markings).
The curve characteristic of the 2nd order excitation differs
greatly from that of the 7 th. Whereas for the 2nd order there
are definite maxima, the curve for the 7 th order is more
balanced. Both, calculation and measurement, indicate the
larger mode density in the higher frequency range. In contrast
to the 7 th order, definite natural frequencies can be assigned
to the 2nd order curve. In this case, vertical bending
vibrations of the ship’s hull at 2.1 and 3.0 Hz can be identified.
Calculated natural frequencies are about 5% higher than
1e-02
1e-03
V i b r a t i o n V e l o
c i t y [ m / s ]
1.8 2.0 2.2 2 . 4 2.6 2.8 3.0 3.2
Excitation Frequency
1e-02
1e-03
V i b r a t i o n V e l o c i t y [ m / s ]
Excitation Frequency
X-Cal.
X-Meas.
8 8.5 9.5 10 10.59
X-Meas.
X-Cal.
Y-Meas.
Y-Cal.
nd2 Excitation Order
thExcitation Order7
Fig. 24: Velocity spectra for excitation by the 2nd and
7 th orders of main engine excitation
One principal advantage of this kind of diagram is that trends
on the amplitude level for varied natural and excitation
frequencies are illustrated.
For this kind of presentation divisions on the frequency axis
can be selected freely. Normally, vibration velocities are
calculated for about 200 excitation frequencies within the
selected frequency interval to obtain sufficient resolution of
the curve shape.
Excitation forces are generally determined for a reference
rate of revolution, e.g., the nominal revolution rate or the
revolution rate during the acceptance measurements. An
assumption is then made about the dependence of excitation
forces on the frequency. As already explained in 4.3.1 in
case of main engines, it is assumed for the sake of simplicity
measured ones. This may be due to inaccuracies in the
calculation, or to the use of slightly different draughts in the
calculation and measurement condition, respectively.

8/8/2019 GL Ship Vibration
http://slidepdf.com/reader/full/gl-ship-vibration 31/51
32
that excitation forces are proportional to the square of the
revolution rate. Especially for the evaluation of amplitudes
determined for excitation frequencies differing more
markedly from the reference revolution rate, assumptions
about the dependence should be chosen with care.
If the mode superposition method was used for the calcula-
tion of forced vibrations, it is possible to state for each excita-
tion order and location, which natural vibration modes make
a significant contribution to the system’s response. On this
basis most effective measures for detuning these modes can
be specified.
4.4.2 Velocity Distributions It is not possible to derive the spatial distribution of velocities
from the response spectra predicted for a few selected points
of the ship’s structure. In particular, only a limited statementcan be made about local magnifications of vibrations from
these spectra.
Especially for passenger and naval vessels with complex
spatial structures, a diagram as presented in Fig. 25, showing
the velocity distributions over a deck, turned out to be useful.
This particular example involves the aft region of the main deck
of a naval vessel. The length of the arrows indicates the vertical
velocity at the node concerned. All revolution rates that have a
predominant effect on ship operation should be investigated.
In this case, there are two such states, indicated by the left
and right arrows, respectively.
In the example shown, the vibrations are excited by the
propellers. Torsional vibrations of the aft part of the ship can
clearly be identified. The vibration level decreases from aft
forwards. Because deck grillages are taken into account in
the FE model with the aid of beam elements, it is also possible
Fig. 25: Vibration velocity distribution in the deck area
Left Arrow: : Vibration Velocity (vertical)
Operating Condition 1
Right Arrow: : Vibration Velocity (vertical)
Operating Condition 2
to identify local increases of vibration. The outer starboard
panel behind the fourth transverse bulkhead, for instance,
is obviously in resonance in case of Operating Condition 1.
Because of the high stiffness of the structure and the large
distance from the source of excitation, the panel is, nevertheless,
uncritical in spite of the resonance situation. In cases of this
kind, there is some elbowroom for the decision as to whether
further stiffening measures are advisable. The shipyard can
benefit from such diagrams, especially when trying to balance
between the achievable improvement of the vibration
behaviour and the effort required for such an improvement.
4.4.3 Mode of the Forced VibrationAnother clear illustration is a plot showing the spatial shape
of forced vibrations. This kind of evaluation makes it possible
to draw conclusions about the interaction between excitation
forces and natural vibration modes. Fig. 26 shows forcedvibration modes for the excitation of the ship’s hull by
various orders of a seven-cylinder engine.
The 1st order (1.5 Hz) excites the fundamental torsional vibra-
tion mode of the ship’s hull, whereas the vertical second-
order mass moment (3.0 Hz) causes four-node vertical
bending vibrations of the ship’s hull. There is no recognizable
increase in the longitudinal vibration of the engine.
At the 3rd order (4.5 Hz), it is mainly the X-type bending
moment of the engine that takes effect. Because this is an
internal moment and the stiffness of the engine housing is
adequately high, practically no vibrations are transmitted into
the foundation. Highest vibration velocities occur in the
transverse direction at the top of the engine.
The 4 th order (6.0 Hz) mainly excites longitudinal vibration of
the engine, combined with longitudinal vibration of the deck-

8/8/2019 GL Ship Vibration
http://slidepdf.com/reader/full/gl-ship-vibration 32/51
33
Fig. 26:
Vibration modes
in the case of
excitation by
vibration orders of
the main engine
1st Order
2nd Order
3rd Order
4 th Order
7 th Order
33
house. The excitation is caused by the external fourth-order
mass moment and by the pitching moment, which is likewiseconspicuous at this order. As explained in [27], resonance with
the L-type vibration of the housing can lead to a consider-
able increase of excitation forces. In this case, too, a definite
increase can be seen in the vibration of the housing compared
to the doublebottom. When reaching the aftmost hold bulk-
head, the vibrations largely decayed.
5 th and 6 th orders of excitation cause a similar vibration
mode as the 3rd order and are, therefore, not shown here.
The 7 th order of excitation (10.5 Hz ignition frequency) evidently
causes H-type transverse bending vibrations of the engine
housing. Because the fundamental natural torsional frequency
of the deckhouse is close to the excitation frequency, the
bridge deck reveals high amplitudes. Deckhouse and enginevibrations couple in a complex mode, which is almost im-
possible to detect with simpler methods of calculation and
evaluation.
A computer animation of forced vibration modes provides
further important information and indicates potential
improvements.
Naturally, a large number of evaluation algorithms can be
used. However, because the calculation of forced vibrations
of ships requires a considerable amount of numerical effort,
the challenge here, too, is to find a reasonable compromise
between cost and benefit.

8/8/2019 GL Ship Vibration
http://slidepdf.com/reader/full/gl-ship-vibration 33/51
In parallel with the progress being made in the field of
vibration prediction with mathematical models (FEM), which
are becoming more and more detailed and hence require an
increasing amount of effort, also a growth in the use of
experimental investigations is evident.
One of the main reasons for this is undoubtedly the general
progress being made in electronics.This has led not only to
devices that are now portable and comparatively user-
friendly (of the “plug & play” variety), but also to computing
powers of PCs or workstations that, together with efficient
software, permit the configuration and evaluation of even the
most demanding and extensive experimental investigations.Thus, many investigations that even ten years ago were the
domain of research can now be carried out within a reason-
able time and almost as a matter of routine.
Specially worth mentioning are “pre-triggering” and “post-
triggering”, by means of which even rare events can be
measured automatically in a purposeful manner with almost
all multichannel measurement systems. For example, flow-
induced excitation forces transmitted into the ship’s structure
via appendages, such as fins, nozzles or rudders, are difficult
to identify since their occurrence often depends on specific,
but initially unknown conditions. In such cases, this triggering
possibility can be extremely useful. The disadvantage of
processing the huge and bewildering amount of measuring
results collected over months can thus be avoided by pre-
selecting relevant data.
Further reasons for an increasing use of experimental
investigations in ship technology include the general trend
towards lower structural weight combined with increasing
propulsive power. Moreover, production optimization and the
trend towards unconventional designs and new hull forms
require an increasing demand of measurement. In this
connection, conventional ratios (e.g., length to beam, beam
to draught etc.) are more and more disappring from the
design process. Specific excitation phenomena may, for
example, occur for a novel design as a consequence of poor
inflow to the propeller or because air is getting underneath
the ship at its forward shoulder, resulting in unpredictable
vibrations. Corresponding problems can only be solved by a
well-planned measurement campaign.
A brief overview of sensors and measurement systems used
for vibration analyses is given below. This is followed by an
introduction to the procedure of various measurements
frequently applied in shipbuilding and ship operation. Some typical methods to evaluate measurement data and to
assess results are discussed next.
Finally, six specific examples from practical work (trouble
shooting) indicate how special vibration problems on ships can
either be avoided or solved at comparatively low cost. The
problems selected are technically simple, but in some cases
they had serious economical effects. The individual problem
and the way how it was satisfactorily solved on the basis of
measurements can be clearly understood from the presented
graphic presentations.
5.1 Sensors
In any application, accelerometers are essential. Every manu-
facturer offers a wide spectrum of standard sensors consti-
tuting an absolutely vast range to choose from.
For structures typical in shipbuilding and marine
engineering, only the frequency range up to about 300 Hz is
of interest from a vibrational point of view. The maximum
acceleration values are generally less than 1 g, and in most
cases they are distinctly lower.
34
5. Measurements

8/8/2019 GL Ship Vibration
http://slidepdf.com/reader/full/gl-ship-vibration 34/51
Popular sensors consist, on the one hand, of seismic types.
As spring-mass systems they also measure statically (0 Hz)
and function as inclinometers. On the other hand, piezo-
electric sensors are widly used. The latter offer advantages in
the high frequency range. Depending on the design, the upper
frequency limit ranges to about 10 kHz or even higher and
thus can also cover the structure-borne noise range.
However, because of the physical principle on which they
are based, they are unsuitable for measurement of ship
motions below 1 Hz.
The sensitivity of both types of sensor is adequate for the
measurement of mechanical vibrations. To name an order of
magnitude: 5 mm/s2 (about 0.0005 g) can be measured without
any problem. At a frequency of 10 Hz, this corresponds to a
vibration velocity of approximately 0.08 mm/s and is, there-
fore, at the limit of the human perception threshold.
Sensors for the direct measurement of vibration velocity,
which is predominantly the quantity to be assessed, play a
part in special cases only.
For measurements of propeller pressure fluctuations, require-
ments to be met by sensors with regard to pressure range,
dynamic range and sensitivity are likewise comparatively
easy to fulfil nowadays. A greater ruggedness to cope with
possible influences in the vicinity of a propeller (such as
sand or unfavourable cavitation effects) to reliably withstand
prolonged investigations would, however, be beneficial. As
measurement cells, not only piezo-electric elements, but
also strain gauges are used.
To detect causes of special vibration problems, it is occa-
sionally necessary to measure various operational parameters
(e.g., of the engine). This requires, consequently, the use of a
wide variety of sensors.
5.2 Measurement Systems
The production lines range from handy mobile (i.e., battery-powered) and easy-to-operate single-channel compact devi-
ces up to PC-controlled multi-channel measurement systems.
These advanced systems, equipped with 32 or 64 channels
and extensive triggering features, represent the upper end of
the scale. In view of the wide variety of devices available, a
reasonably rational decision in favour of a specific system is
possible only if the measurement task is clearly defined.
However, experience has shown that clear definit ion is diffi-
cult since the decision has to be made also for unknown
future tasks. There is no such thing as a practical device for
all possible applications. On the other hand, a higher-perfor-
mance and more compact generation of the product will
generally appear on the market after a few years.
For the widespread need to determine the vibration level at
various places on the ship and to clearly identify the main
source of excitation, it is sufficient to use single or dual-
channel frequency analysers in hand-held format cabable
to show the measured spectrum on a small display and to
store it. Unfortunately, they do not yet feature evaluation
procedures as per the new ISO 6954. Also, for reasons of
memory capacity, the time signal is mostly not available.
One to four-channel systems consisting of sensors, amplifiers
and a DAT recorder can still be classed as “mobile”, and they
have the advantage of being able to record time signals
simultaneously in a practically unlimited manner.
DAT cassettes, with up to 2 hours capacity, are a worthwhile
storage medium. Evaluation takes place later with a PC using
appropriate software. If data quantities are small, laptops
can be used instead of a DAT recorder. Measurement data
are then present in digitized form on the hard disk at a definedsampling rate. In the conversion of analog to digital data,
possible aliasing effects must be taken into account. These
effects can generally be ruled out if analog signals are
suitably filtered.
At the next level, there are 8- to 16-channel units, which re-
quire a place in a protected environment and a 220 V power
supply. These units can certainly not be classed as “mobile”.
In the simplest case, the measurement chain corresponds to
a 1- to 4-channel system. The analog amplifier output (generally
with a maximum of 2, 5 or 10 V) make it possible to connect
other devices, such as two-channel analysers or thermal
printers for checking and observing the measurement.
Equipment with this scope is typical for investigations of the
global vibration behaviour, e.g., of the aft part of the ship
including the deckhouse as part of the trouble shooting
process.
The range comprising 16 or more channels is the domain of
complete data acquisition systems, “front-end” units as
they are called, containing amplifier boards often integrated
in the housing. The configuration of measurement channels
and other setting activities, such as those for triggerfunctions and for controlling the measurement procedure,
take place via the interface connection to the PC or laptop.
Depending on the requirements, extensive measurement
data are stored on the PC hard disk or via external drives,
e.g., on hard disks, DAT cassettes or MO (magneto-optical)
disks. These systems make it possible to program a com-
pletely automatic measurement procedure – for example, for
long-duration measurements – and are mentioned here only
for the sake of completeness. For vibration investigations on
board ships they are necessary only in exceptional cases
and then because of their trigger functions and hence the
possibility of automatically measuring vibration phenomena
that rarily occur.
35

8/8/2019 GL Ship Vibration
http://slidepdf.com/reader/full/gl-ship-vibration 35/51
Depending on the kind of problem and the measurement
effort to be expended, the vibration measurement procedure
must be adapted to suit the given operational constraints.
Basically, a distinction can be drawn between measurements
for various excitation types.
5.3.1 Impact Method The purpose of these measurements is to determine natural
frequencies of particular structural components or equipment
items. They are mainly used to check the design of plates,
panels and stiffeners of superstructure decks and tank walls
in the engine room area before the ship is completed. If
measured natural frequencies indicate a danger of resonance
with main excitation orders (propeller and engine), changes
at this time are still comparatively cheap for the shipyard. In
case of passenger ships, for example, a mistake here wouldbe particularly critical. This method is also used when vibration
problems occur, but the necessary conditions cannot be
realised on a sea voyage in the near future. A further field of
application is the investigation of structures and appendages
situated below the waterline. In this case, results have to be
corrected in accordance with hydrodynamic masses.
The structure concerned, on which generally two to eight
accelerometers have been attached beforehand by means of
magnets, is struck non-rhythmically with an impact hammer.
The hammer has a suitable rubber buffer at its impact surface
and is additionally equipped with an accelerometer for
measurement of the striking force (the weight of the hammer
being known). As a result of the impact, the component is
deflected locally and performs decaying vibrations at its
natural frequencies. Coherence and transfer functions, con-
tinuously monitored on an FFT analyser, indicate when the
measurement can be discontinued. The coherence should
be near unity over the frequency range of interest, and both
functions should remain stable, i.e., they should not change
when further impacts take place.
In case of a newbuilding, for example, these investigationsrequire a work pause during construction which is not
always easy to arrange. Therefore, they are often possible
only on weekends.
5.3.2 Exciter Test In this case, too, the aim is mainly to determine natural frequen-
cies. The fixing of the exciter foundation requires a certain
amount of construction work. In addition, it must be estimated
beforehand whether the frequency range and the excitation
force are adequate for the vibration problem, on the one
hand, and the guarantee that damage to the structure is
avoided, on the other.
In individual cases, for example, when a high amplitude level
was predicted, an attempt is made at an early stage to
simulate excitation characteristics of the engine or propeller
by means of an unbalance exciter test. The expected vibra-
tion level is then extrapolated from the measured level, taking
excitation forces of the engine or the propeller into account.
Small unbalance exciters (Fmax < 100 kN) are highly suitable
for the investigation of appendages, larger panels, individual
decks, or foundations of larger items of equipment. More
powerful exciters require extensive installation effort because
of their great weight and their dimensions and are, therefore,
used in exceptional cases only.
5.3.3 Measurements During Ship OperationHere, the ship’s own vibration sources provide the excitation
forces, i.e., various orders of the propeller and engine.
In rare cases, the vibration level is caused by slamming-
induced impacts or by special flow phenomena.
Measurements at Rated Output of the Propulsion Plant This measurement procedure, which reflects the most
important operating condition of a ship, is applied tocompare the measured vibration level with permissible
values stipulated in the building specification.
This requires an adequate water depth (four to five times the
draught to eliminate shallow water effects), small rudder
angles, moderate wave heights, and the absence of violent
ship motions.
For this purpose, it is sufficient to check or record about 20
measurement points distributed over superstructure decks
and workshops, using a hand-held or a 1- to 3-channel
device. The selection should cover various sizes of panels
and positions on the deck for measurements in the vertical
36
5.3 Measurement Procedures

8/8/2019 GL Ship Vibration
http://slidepdf.com/reader/full/gl-ship-vibration 36/51
direction. For upper superstructure decks transverse and
longitudinal directions should be considered as well. Only
then an informative overall picture is obtained. Furthermore,
engines and peripheral devices are subject to limits that
must not be exceeded if damage is to be avoided. Special
attention must be paid to turbochargers.
If limits are not exceeded and the vessel’s master and/or the
owner indicate that they are satisfied, then the task has
been completed with a minimum of effort.
However, if problems exist, these measurements are gener-
ally not sufficient to clarify causes, since they do not provide
information either on natural frequencies or about vibration
modes. Therefore, it is scarcely possible to develop a detailed
diagnosis with the aim of working out effective remedies.
Measurements at Variable Revolution Rates The simultaneous acquisition of 8 to 16 acceleration signals,
possibly together with other measurement quantities, permits
not only the determination of relevant vibration modes:
when combined with a run-up manoeuvre of the propulsion
plant, e.g., in the range 50 – 100% of the nominal revolution
rate, results also reveal relevant resonance points showing
corresponding natural frequencies.
E.g., four stiffly supported measurement points on the bridge
deck of merchant vessels (two longitudinal, one transverse,
one vertical) usually reflect with sufficient clarity global
vibration modes of the deckhouse (longitudinal, transverse,
torsion about the vertical axis). Combined with sensors in the
vertical direction at the forward and aft footing of the deck-
house and at the transom, relevant natural modes and natural
frequencies of the whole elastic system consisting of deck-
house and aftbody can be determined.
Accelerometers can easily be moved from one position to
another. To determine the hull’s basic vertical natural modes
and frequencies, it is sufficient, for example, to move the four
sensors placed on the bridge deck to one side of the main deck.
If the propeller has been identified as the cause of a vibra-
tion problem, it is only possible by means of pressure pulse
measurements to determine whether induced pressure fluc-
tuations are unusually high. In case of controllable pitch pro-
pellers, not only the revolution rate but also the pitch should
be varied in the range of 50 – 100% to assess cavitation
phenomena.
Measurement durations of up to 5 minutes for quasi-steady
state conditions (constant speed and propeller pitch) make it
possible to distinguish between excitation frequencies, even if
they lie close together. On the other hand, in case of speed-
up manoeuvres – either continuous or in small steps of, say,
3 or 5 revolutions – a total duration of 20 to 40 minutes must
be expected if no resonance points in the relevant range of
revolution are to remain undetected.
The measurements sketched represent the scope typically
required for trouble shooting. They are, however, also appro-
priate if shipyards or owners attempt to reduce the vibration
level or if they want to find out why an engine top bracing,
for example, has failed to produce the hoped-for success.
The measurement data then permit an identification – possibly
supported by calculations – of cost effective measures.
Basically it can be stated that local problems (“calming” of
panels, bulkheads, devices, or smaller equipment items) can
be solved with little effort. Unacceptable global vibrations, on
the other hand, require considerable modifications of the
design or of the propulsion plant – extending in extreme cases
up to changes of the revolution rate or of the number of pro-peller blades, for example.
5.4 Evaluation and Assessment
For various possibilities of data evaluation, it is necessary to
have measurement data available as time signals. These
signals are present either in digital form in bulk memories,
such as hard disk, MO disk, DAT tape or CD, or in analog
form if magnetic tape units are used. An alternative is offered
by popular DAT recorders, which behave like analog devices
(voltage output), but have finite data-rates.
37
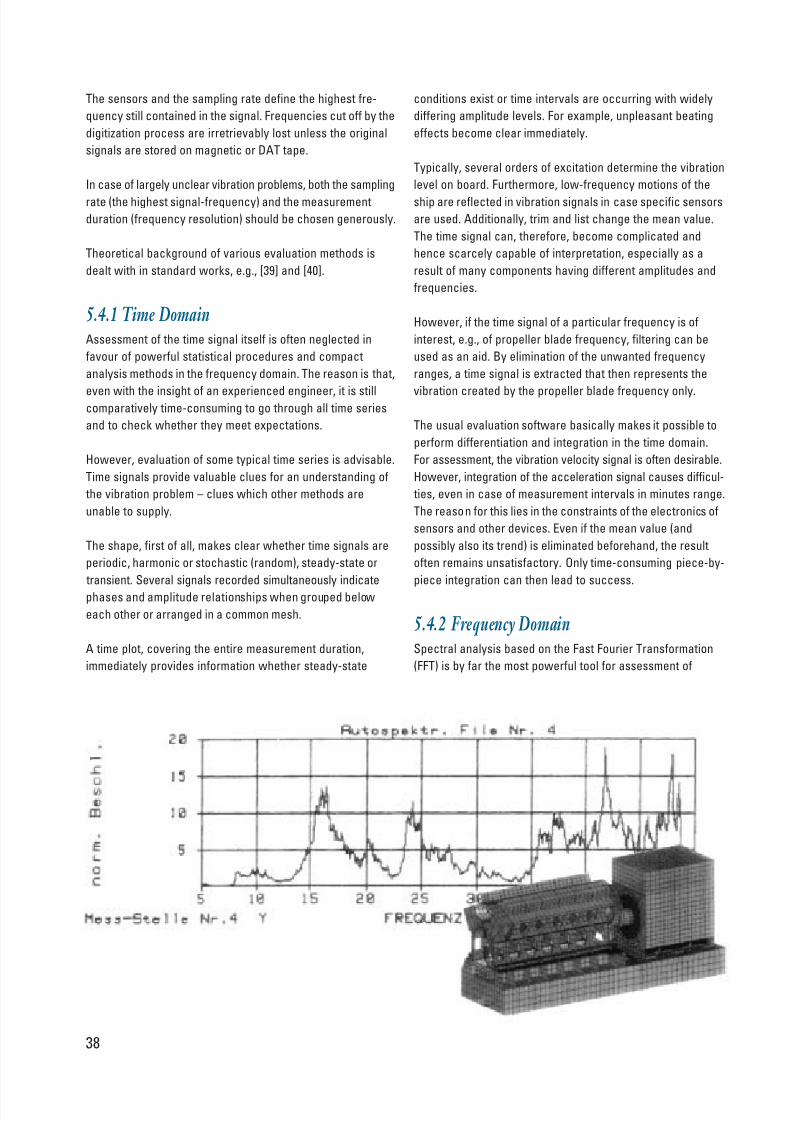
8/8/2019 GL Ship Vibration
http://slidepdf.com/reader/full/gl-ship-vibration 37/51
The sensors and the sampling rate define the highest fre-
quency still contained in the signal. Frequencies cut off by the
digitization process are irretrievably lost unless the original
signals are stored on magnetic or DAT tape.
In case of largely unclear vibration problems, both the sampling
rate (the highest signal-frequency) and the measurement
duration (frequency resolution) should be chosen generously.
Theoretical background of various evaluation methods is
dealt with in standard works, e.g., [39] and [40].
5.4.1 Time DomainAssessment of the time signal itself is often neglected in
favour of powerful statistical procedures and compact
analysis methods in the frequency domain. The reason is that,
even with the insight of an experienced engineer, it is stillcomparatively time-consuming to go through all time series
and to check whether they meet expectations.
However, evaluation of some typical time series is advisable.
Time signals provide valuable clues for an understanding of
the vibration problem – clues which other methods are
unable to supply.
The shape, first of all, makes clear whether time signals are
periodic, harmonic or stochastic (random), steady-state or
transient. Several signals recorded simultaneously indicate
phases and amplitude relationships when grouped below
each other or arranged in a common mesh.
A time plot, covering the entire measurement duration,
immediately provides information whether steady-state
conditions exist or time intervals are occurring with widely
differing amplitude levels. For example, unpleasant beating
effects become clear immediately.
Typically, several orders of excitation determine the vibration
level on board. Furthermore, low-frequency motions of the
ship are reflected in vibration signals in case specific sensors
are used. Additionally, trim and list change the mean value.
The time signal can, therefore, become complicated and
hence scarcely capable of interpretation, especially as a
result of many components having different amplitudes and
frequencies.
However, if the time signal of a particular frequency is of
interest, e.g., of propeller blade frequency, filtering can be
used as an aid. By elimination of the unwanted frequency
ranges, a time signal is extracted that then represents the
vibration created by the propeller blade frequency only.
The usual evaluation software basically makes it possible to
perform differentiation and integration in the time domain.
For assessment, the vibration velocity signal is often desirable.
However, integration of the acceleration signal causes difficul-
ties, even in case of measurement intervals in minutes range.
The reason for this lies in the constraints of the electronics of
sensors and other devices. Even if the mean value (and
possibly also its trend) is eliminated beforehand, the result
often remains unsatisfactory. Only time-consuming piece-by-
piece integration can then lead to success.
5.4.2 Frequency DomainSpectral analysis based on the Fast Fourier Transformation
(FFT) is by far the most powerful tool for assessment of
38

8/8/2019 GL Ship Vibration
http://slidepdf.com/reader/full/gl-ship-vibration 38/51
vibrations. This method identifies main sources of excitation
immediatly on board. Multichannel measurements permit the
determination of complicated vibration modes and associated
amplitudes.
Even though vibration signals are often stochastic and
transient in their nature, harmonic analysis is, nevertheless,
generally successful. If the quantity of data is large enough,
occasional faults such as signal gaps or the occurrence of
peaks only have a slight falsifying effect on the result.
However, as far as amplitudes are concerned, caution is
advisable because FFT parameters, such as windows, block
sizes and overlap can have a significant effect.
Amplitude SpectraIn the selected band, spectra reveal the amplitude level
corresponding to each frequency and thus make it possible
to identify main excitation sources.
Of course, vibration standards for comfort, structures, engines
and electronic equipment do not only differ from each other
in permissible amplitudes, but they also require widely differing
evaluation methods. These spectra likewise form the basis
for assessment according to various technical standards –
see also Chapter 2.
Waterfall Diagrams “Waterfall” diagrams (three-dimensional spectra) addition-
ally indicate the change of amplitude and frequency versus
time. Over a period of 20 to 40 minutes, for example, the main
parameter is varied either as uniformly as possible or in steps.
This parameter is principally the speed of the main engine
and hence of the propeller, but it can also be the propeller
pitch while the speed remains constant.
In this connection, it must not be forgotten that this kind of
speed-up manoeuvre also affects quantities influencing the
vibration behaviour. Naturally, relevant excitation forces and
ship’s speed increase during this speed-up process.
As described in some of the practical examples, waterfalldiagrams conspicuously reveal existing resonance points. In
addition, amplitude curves varying with the engine speed can
be distinguished from those in which the frequency remains
completely invariable. The former represents forced vibrations
and can be assigned directly to the n-th order of the engine
or to the propeller excitation. On the other hand, natural vibra-
tion modes are independent of the revolution rate. Lower natural
frequencies of the hull’s bending vibrations (vibrations with
two to four nodes) are generally revealed. This can also apply
to larger subsystems, such as a deckhouse or a radar mast.
Contrary to common assumptions, excitation of a hull’s natural
vibration modes does not require a “suitable” sea state in
the sense of a particular wave encounter frequency or parti-
cular pitching motions. For large ships, wave heights of, e.g.,
0.5 m are sufficient to excite these natural vibration modes to
an extent that amplitudes and corresponding natural
frequencies can be measured.
Order Analysis This term refers to the relationship between amplitude and
excitation frequency for a particular order of excitation.
In a waterfall diagram it corresponds to the mountain ridge.
The two-dimensional presentation shows the variation of
amplitude as a function of frequency in a convenient manner.
Modal Analysis This is generally regarded as a tool to determine vibration
modes (free and forced) of complex structures by means of
a large number of measurement signals. A necessary pre-
requisite is simultaneous acquisition of signals, so that phaserelationships between individual measurement points can be
considered.
In the event of vibration problems, knowledge of the causal
vibration mode is crucially important because it is only on
this basis that effective counter measures can be worked
out. Thus, for example, it would be useless to provide a
strongly vibrating deck panel with supports situated at nodes
of the vibration mode causing the disturbance. Corrective
measures are generally aimed at connecting structural
points characterized by large relative motions. Depending on
mass and stiffness relationships, coupling of this kind also
changes the vibration behaviour of the adjacent part of the
structure, which might result in undesirable effects.
In practice, detecting global vibration modes requires much
effort. Even with a 32-channel measuring equipment, the spatial
vibration mode can be measured for only limited areas of the
hull. It is, therefore, important to proceed with a specific purpose
in mind during measurements. Knowledge of vibration modes
acquired from FEM computations, for example, can be helpful.
In most cases, specific excitation arrangements to determinea hull’s natural vibration modes require great effort (anchor-
drop test, unbalance exciter units, stopping manoeuvres,
impact systems, hydropulsers, shock tests, etc.). For this
reason, among others, the use of modal analysis in practice
is mostly confined to parts of structures or individual items of
equipment.
Today, program packages for modal analysis not only offer
the possibility of displaying detected natural modes as
animations on a PC screen, but are also able – in conjunction
with FEM programs – to simulate effects of changes in the
structural model (stiffness, damping, mass characteristics)
on results.
39

8/8/2019 GL Ship Vibration
http://slidepdf.com/reader/full/gl-ship-vibration 39/51
40
Fig. 27: Waterfall diagram
for the longitudinal
acceleration of the
bridge deck
5.5 Practical Applications
Example 1
The first unit of a new series of container ships was investi-
gated because of significant vibration problems on a loading
voyage. In addition to severe vibration problems of some
local components on the radar mast, high global longitudinal
vibrations of the deckhouse, in particular, with values of up
to 12 mm/s, were unacceptable. The port side exhibited
higher vibration velocities. These were due to asymmetries
of the deckhouse, resulting in torsional vibrations about the
vertical axis.
In addition to resonance of the mast at propeller blade fre-
quency, the main reason for the high level turned out to be
resonance of the four-node vibration mode of the ship’s hull
with the engine’s 2nd-order excitation. It was found that theshipyard installed a compensator, driven at twice the revolu-
tion rate, at only one end of the 6-cylinder engine. A one-
sided configuration of this kind generally produces incomplete
compensation. Because the phase relationship of the compen-
sator force is fixed, an increase of vibration is even possible
to occur in the worst case, depending on the position of the
vibration node relative to the balancer force. If the balancer
acts at the node, no change occurs in the vibration level.
Depending on the loading condition, the position of the rele-
vant vibration node can move considerably. The installation
of a balancer acting at one end only, as a means of compen-
sating a free 2nd-order mass moment, must therefore, be
regarded as critical.
The shipyard initially hoped to reduce deckhouse and mast
vibrations to an acceptable level by carrying out various
structural alterations (stiffening of the radar mast, changing
of the deckhouse asymmetry). However, it turned out that
significant vibration problems still existed and that the limit
curves specified were not being complied with.
Evaluation of the first course of remedial action revealed the
following situation:
In the deckhouse (at the height of the bridge deck) there was
a level of about 9 mm/s due to the engine’s 2 nd-order
excitation. The radar mast reached amplitudes of more than
30 mm/s, caused by the propeller blade frequency (4 th order).
The vibration behaviour in ballast condition was found to be
as unfavourable as in loaded condition.
The highest level of longitudinal vibration of the deckhouseoccurred at engine speeds of about 115 r/min. This was
particularly critical because it was the service speed with
the shaft generator switched on. The radar mast, on the
other hand, reached the largest amplitudes at a maximum
revolution rate of 140 r/min.
An evaluation of the 2nd-order excitation at 115 r/min, corres-
ponding to 3.83 Hz, exhibited proximity of resonance to the
4-node vibration of the ship’s hull in ballast condition, whereas
in the loaded condition resonance with the 5-node vibration
occurred at about 126 r/min. In the waterfall diagram of
Fig. 27, the resonance for the longitudinal vibration of the
deckhouse is clearly evident for ballast condition.
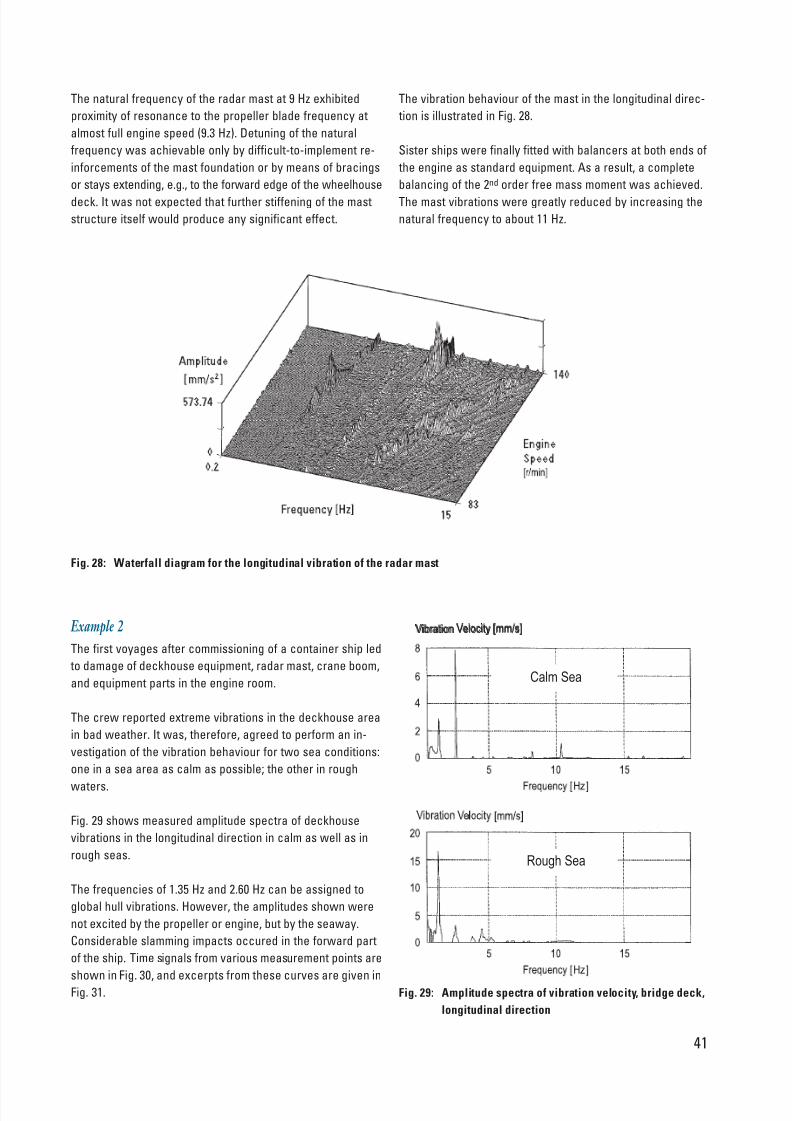
8/8/2019 GL Ship Vibration
http://slidepdf.com/reader/full/gl-ship-vibration 40/51
The natural frequency of the radar mast at 9 Hz exhibited
proximity of resonance to the propeller blade frequency at
almost full engine speed (9.3 Hz). Detuning of the natural
frequency was achievable only by difficult-to-implement re-
inforcements of the mast foundation or by means of bracings
or stays extending, e.g., to the forward edge of the wheelhouse
deck. It was not expected that further stiffening of the mast
structure itself would produce any significant effect.
Fig. 28: Waterfall diagram for the longitudinal vibration of the radar mast
Example 2
The first voyages after commissioning of a container ship led
to damage of deckhouse equipment, radar mast, crane boom,
and equipment parts in the engine room.
The crew reported extreme vibrations in the deckhouse area
in bad weather. It was, therefore, agreed to perform an in-
vestigation of the vibration behaviour for two sea conditions:
one in a sea area as calm as possible; the other in rough
waters.
Fig. 29 shows measured amplitude spectra of deckhouse
vibrations in the longitudinal direction in calm as well as in
rough seas.
The frequencies of 1.35 Hz and 2.60 Hz can be assigned to
global hull vibrations. However, the amplitudes shown were
not excited by the propeller or engine, but by the seaway.
Considerable slamming impacts occured in the forward part
of the ship. Time signals from various measurement points are
shown in Fig. 30, and excerpts from these curves are given in
Fig. 31.
Vibration Velocity [mm/s]
Calm Sea
Rough Sea
41
Fig. 29: Amplitude spectra of vibration velocity, bridge deck,
longitudinal direction
The vibration behaviour of the mast in the longitudinal direc-
tion is illustrated in Fig. 28.
Sister ships were finally fitted with balancers at both ends of
the engine as standard equipment. As a result, a complete
balancing of the 2nd order free mass moment was achieved.
The mast vibrations were greatly reduced by increasing the
natural frequency to about 11 Hz.

8/8/2019 GL Ship Vibration
http://slidepdf.com/reader/full/gl-ship-vibration 41/51
Radar Mast, Longitudinal
Navigator Deck, PS.Long. Direction
Transom, Vertical
Radar Mast, Longitudinal
Navigator Deck, PS.Long. Direction
Transom, Vertical
Fig. 31: Excerpts of above time signals
As a conclusion of the investigation, it was found that the
damage was caused by operating the vessel almost non-
stop in bad weather during the first few voyages at shallow
forward draught. This resulted in slamming impacts, which
occured more frequently and even more severely than
measured. In addition, definite structural deficiencies were
also found in the detailed design.
However, the vibration behaviour caused by the propulsion
plant was satisfactory, both for the comfort of the crew and
for the integrity of the structure, machinery and electronic
equipment (radar mast).
The investigation underlined that severe slamming impacts
extending over a long period of time must definitely be avoided.
Example 3
The starting point for these measurement-related investiga-
tions consisted of cracks that occurred on the main deck at
the aft edge of the deckhouse just shortly after commissio-
ning of the ship.
Fig. 30: Rough sea, 3 slamming impacts
42

8/8/2019 GL Ship Vibration
http://slidepdf.com/reader/full/gl-ship-vibration 42/51
2.5 5.0 7.5 10.0 12.5 15.0 17.5 20
Fig. 32: Waterfall diagram for the longitudinal acceleration on the bridge deck
The ship operator was concerned that vibrations in this area
were the cause of the damage and that other areas of the
structure might similarly be found to be damaged later on.
Therefore, measurements covered the investigation of the
vibration behaviour of the entire deckhouse as well as of its
possibly inadequate incorporation in the hull structure.
Signals of 14 accelerometers distributed over the main deck
and the deckhouse region were recorded simultaneously for
each of the following manoeuvres:
• Nominal speed, np : 204 r/min
• Run-up of main engine, np : 160 - 204 r/min
• Reversal from full speed ahead to full speed astern
• Anchor-dropping manoeuvre, propulsion plant not operating
Manoeuvre 1 gives the vibration level at nominal speed and thus presents the main part of the vibration concerning fa-
tigue strength of welded joints in question. Manoeuvre 2 makes
it possible to determine resonance points and to estimate
associated amplitudes. Manoeuvre 3 and 4 were intended,
in particular, to reveal lower natural frequencies of the ship’s
hull and corresponding vibration modes with regard to the
possibility of inadequate mounting of the deckhouse.
Evaluation of measurement results revealed the following
overall picture:
Amplitudes at various rigid points of the ship were small and
gave no cause for complaint. However, the aft bulkhead of
the deckhouse, and thus the detected cracks, were situated
close to the aft node of the vertical 2-node vibration mode
and were, therefore, in the unfavourable region of high alter-
nating stresses.
Evaluation of the speed-up manoeuvre led to a surprising
aspect that can be seen in Fig. 32, showing the longitudinal
vibration of the deckhouse:
The deckhouse turned out to vibrate completely isolated from
the hull at a frequency of 10 Hz. Amplitudes remained almost
constant over the entire speed range, briefly rising only in
case of resonance with the propeller blade frequency. Thisisolated vibration behaviour of the deckhouse is unusual.
The seaway is the only possible source of excitation, exciting
the 2- and 3-node vertical hull vibrations of the ship, which in
turn act as a source of excitation at the footing of the deck-
house.
43

8/8/2019 GL Ship Vibration
http://slidepdf.com/reader/full/gl-ship-vibration 43/51
This vibration behaviour supported the presumption of com-
paratively poor vertical connection of the deckhouse, leading
to significant amplitudes in rough seas.
In reconstructing the manufacturing process (mounting of
the deckhouse on the main deck), various deficiencies and
inaccurate fits were found in the region of the aft bulkhead
of the deckhouse. These had to be regarded as having
contributed to the cracks.
It was, therefore, recommended that, after completion of
repairs, these points should be examined for new cracks after
every period of rough weather.
Corresponding deficiencies of production did not occur
on the sister ships. No further cases of relevant vibration
damage came to light.
Example 4
The first unit of a series of container ships exhibited an un-
satisfactorily high level of longitudinal vibration of the deck-
house in the vicinity of nominal propeller speed (100 r/min).
To not jeopardize the success of this ship type by an
unfavourable impression of its vibration behaviour, the
shipyard decided to perform experimental investigations for
three different variants, both of a hydrodynamic and of a
structural nature.
• Initial situation Variant A
• Schneekluth nozzle Variant B
• Connection of funnel to deckhouse (incl. B) Variant C
• Damping tank (incl. B and C) Variant D
(Additionally, variant D differed from other
variants in that its deckhouse was 2 m taller.)
The main cause of the high vibration level was the excitation
of the 4 th order, namely, the propeller blade frequency.
For variant C, Fig. 33 shows the waterfall diagram of a speed-
up manoeuvre for longitudinal vibrations at the top of the
deckhouse. Important orders and significant amplitude
changes as a function of revolution rate are recognizable.
Comparison of the four variants concerning longitudinal
vibration of the deckhouse is shown in Fig. 34 as an order
analysis for the propeller blade frequency.
Through use of the Schneekluth nozzle (variant B), the initial
situation was somewhat improved. The aim of the funnel
connection, namely, to raise the relevant natural frequency
Fig. 33: Waterfall diagram for the longitudinal acceleration
of the bridge deck
Fig. 34: Order analysis of the propeller blade frequency
4444
of the deckhouse to a value above that of the 4 th-order exci-
tation at nominal speed, was achieved.
In the speed range up to 100 r/min, variant D shows a further
reduction in the vibration level, but above that speed there is
again a steep rise (i.e., vicinity of resonance) up to 103 r/min.
The amplitude reduction below speeds of 100 r/min is due to the
damping tank, whereas the steep rise for this variant is
attributable to the taller deckhouse. As a result of the increased
height of the deckhouse, the natural frequency has fallen
again. Due to this, stiffness effect of the funnel connection
was compensated to a certain degree.

8/8/2019 GL Ship Vibration
http://slidepdf.com/reader/full/gl-ship-vibration 44/51
The investigation firstly underline that extensive measure-
ments above the standard scope – possibly in conjunction
with theoretical analyses (FE computations) – can contribute
significantly towards optimization of the vibration behaviour.
Secondly, it turned out to be advantageous for these measure-
ments to exceed the nominal speed range as far as possible,
so that a relevant danger of resonance could be detected in
this range.
Example 5 For a diesel generator unit installed on an elastically mounted
base-frame, it had to be demonstrated experimentally that
there was no danger of resonance between a fundamental
vibration mode of the frame and the ignition frequency of 25 Hz.
In a first step, the diesel generator unit and the base-frame
were investigated with the aid of appropriate theoretical
Fig. 35: Arrangement of the exciter
45
analyses. By means of various calculations in which the
structure was varied, recommendations for the final design
were ultimately obtained.
For this kind of experimental investigation, mechanical un-
balance exciters are particularly suitable, since they generate
a defined harmonic force. Furthermore, by the use of different
masses, this excitation force – which increases quadratically
with the revolution rate – can be varied within certain limits.
Naturally, it must be ensured beforehand that the exciter’s
range of force and frequency is appropriate for the vibration
question concerned.
Because vertical and horizontal vibration modes were im-
portant here, the exciter unit was mounted in such a way
that both, horizontal and vertical forces acted on the base-
frame at points above the elastic mounting (Fig. 35).
Exciter
Exciter
Horizontal Excitation Forces Vertical Excitation Forces
Generator Set
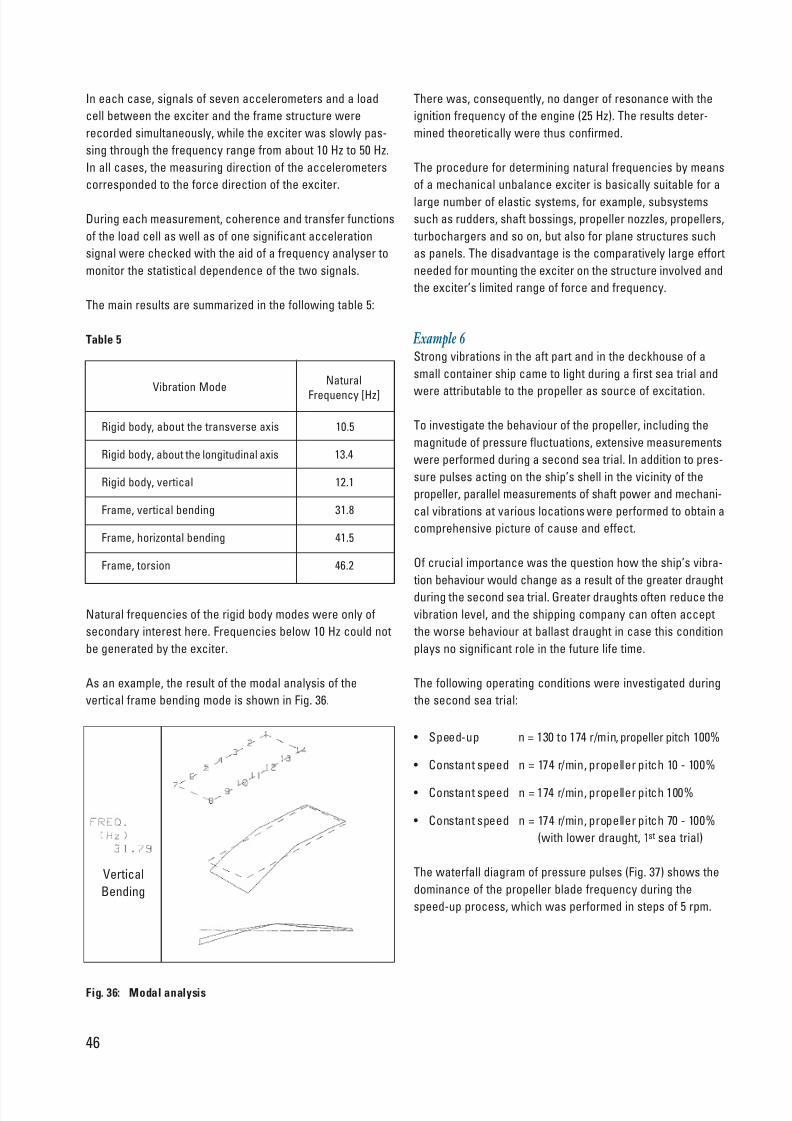
8/8/2019 GL Ship Vibration
http://slidepdf.com/reader/full/gl-ship-vibration 45/51
In each case, signals of seven accelerometers and a load
cell between the exciter and the frame structure were
recorded simultaneously, while the exciter was slowly pas-
sing through the frequency range from about 10 Hz to 50 Hz.
In all cases, the measuring direction of the accelerometers
corresponded to the force direction of the exciter.
During each measurement, coherence and transfer functions
of the load cell as well as of one significant acceleration
signal were checked with the aid of a frequency analyser to
monitor the statistical dependence of the two signals.
The main results are summarized in the following table 5:
Vibration Mode
Natural
Frequency [Hz]
Rigid body, about the transverse axis 10.5
Rigid body, about the longitudinal axis 13.4
Rigid body, vertical 12.1
Frame, vertical bending 31.8
Frame, horizontal bending 41.5
Frame, torsion 46.2
Natural frequencies of the rigid body modes were only of
secondary interest here. Frequencies below 10 Hz could not
be generated by the exciter.
As an example, the result of the modal analysis of the
vertical frame bending mode is shown in Fig. 36.
There was, consequently, no danger of resonance with the
ignition frequency of the engine (25 Hz). The results deter-
mined theoretically were thus confirmed.
The procedure for determining natural frequencies by means
of a mechanical unbalance exciter is basically suitable for a
large number of elastic systems, for example, subsystems
such as rudders, shaft bossings, propeller nozzles, propellers,
turbochargers and so on, but also for plane structures such
as panels. The disadvantage is the comparatively large effort
needed for mounting the exciter on the structure involved and
the exciter’s limited range of force and frequency.
Example 6 Strong vibrations in the aft part and in the deckhouse of a
small container ship came to light during a first sea trial and
were attributable to the propeller as source of excitation.
To investigate the behaviour of the propeller, including the
magnitude of pressure fluctuations, extensive measurements
were performed during a second sea trial. In addition to pres-
sure pulses acting on the ship’s shell in the vicinity of the
propeller, parallel measurements of shaft power and mechani-
cal vibrations at various locations were performed to obtain a
comprehensive picture of cause and effect.
Of crucial importance was the question how the ship’s vibra-
tion behaviour would change as a result of the greater draught
during the second sea trial. Greater draughts often reduce the
vibration level, and the shipping company can often accept
the worse behaviour at ballast draught in case this condition
plays no significant role in the future life time.
The following operating conditions were investigated during
the second sea trial:
• Speed-up n = 130 to 174 r/min, propeller pitch 100%
• Constant speed n = 174 r/min, propeller pitch 10 - 100%
• Constant speed n = 174 r/min, propeller pitch 100%
• Constant speed n = 174 r/min, propeller pitch 70 - 100%
(with lower draught, 1st sea trial)
The waterfall diagram of pressure pulses (Fig. 37) shows the
dominance of the propeller blade frequency during the
speed-up process, which was performed in steps of 5 rpm.
Fig. 36: Modal analysis
46
Vertical
Bending
Table 5

8/8/2019 GL Ship Vibration
http://slidepdf.com/reader/full/gl-ship-vibration 46/51
0
Fig. 37: Waterfall diagram of the propeller pressure
fluctuations
47
Pressure pulses of three measurement points P1, P2 and
P3 as a function of power exhibit a steeper rise from about
4700 kW power, or 160 rpm, upwards (Fig. 38).
Fig. 38: Pressure fluctuations as a function of power
The effect of the draught on pressure pulses at propeller blade
frequency is pronounced. Amplitudes increase from values
which are already high (10 kPa), by almost 40% to 14 kPa for
the lower draught investigated (Fig. 39).
Discussions about the propeller design revealed in retrospect
that the propeller was adequately designed for the power of
6.000 kW from a strength point of view. However, a reduced
power of 4.500 kW was used as basis for the hydrodynamic
design.
This example shows the great extent to which pressure
fluctuations depend on the design point and how a ship’s
vibration level can be influenced by an inadequate propeller
design.
In this case, an acceptable vibration level was achieved by a
new propeller.
Fig. 39: Pressure fluctuations of P1 for the two draughts
14
12
10
8
6
4
2
0
180
170
160
150
140
130
120
[kPa] [r/min]
0 1000 2000 3000 4000 5000 6000
Shaft Power [kW]
8/8/2019 GL Ship Vibration
http://slidepdf.com/reader/full/gl-ship-vibration 47/51
The foregoing remarks show how questions regarding ship vibrations
can be dealt with comprehensively from a contractual, theoretical and
experimental point of view. The procedures outlined can be applied to
treat vibration questions on a rational basis at the design stage. They
can, furthermore, also be used to solve vibration problems on ships
already in service.
The paper documents the “state of the art” in the field of ship vibration
technology. It is intended to be used as a manual in the daily work at
shipyards, for inspectors of shipping companies, in engineering offices,
and so on. By presenting a wide range of knowledge in this field, the
paper contributes to prevent vibration problems on newbuildings as wellas to find most cost-effective solutions for vibration problems occuring
on ships already in service from a well-planned measurement action.
The subjects dealt with do certainly not cover the entire field of vibration
technology. The treatment of further topics, such as
• torsional vibrations of shafting systems,
• elastic mounting of engines and equipment items,
• sloshing,
• slamming (whipping and springing), and
• shock
are beyond the scope of this document.
Details of these subjects may be found in the literature mentioned
although this list does not claim to be complete. It is recommended that
interested parties keep themselves informed of international activities,
in particular, such as the “International Ship & Offshore Structures
Congress”, ISSC.
6. Conclusions
Finally, we thank all those shipyards and shipping companies that
kindly gave us permission to present some results, including the
FE models.
48

8/8/2019 GL Ship Vibration
http://slidepdf.com/reader/full/gl-ship-vibration 48/51
49
7. Literature
[1] International Standard ISO 6954:
“Mechanical vibration and shock – Guidelines for
the overall evaluation of vibration in merchant
ships”, Edition 1984.
[2] International Standard ISO 2631-1:
“Mechanical vibration and shock – Evaluation of
human exposure to whole-body vibration, Part 1:
General requirements”, Edition 1997.
[3] International Standard ISO 6954:
“Mechanical vibration – Guidelines for themeasurement, reporting and evaluation of vibration
with regard to habitability on passenger and
merchant ships”, Edition 2000.
[4] International Standard ISO 2631-2:
“Mechanical vibration and shock – Evaluation of
human exposure to whole-body vibration, Part 2:
Continuous and shock induced vibration in
buildings (1-80 Hz)”, Edition 1989.
[5] Germanischer L loyd:
“Rules for Classification and Construction,
I - Ship Technology, Part 1 - Seagoing Ships,
Chapter 16 - Harmony Class - Rules on Rating
Noise and Vibration for Comfort,
Passenger Ships (v ≤ 25 kn)”, Edition 2001
[6] International Standard ISO 7919:
“Mechanical vibration of non-reciprocating
machines – Measurements on rotating shafts and
evaluation criteria”, Edition 1996.
Part 1: General guidelinesPart 2: Large land-based steam turbine
generator sets
Part 3: Coupled industrial machines
Part 4: Gas turbine sets
[7] International Standard ISO 10816:
“Mechanical vibration – Evaluation of machine
vibration by measurements on non-rotating parts”,
Edition 1996.
Part 1: General guidelines
Part 2: Large land-based steam turbine generator
sets in excess of 50 MW
Part 3: Industrial machines with nominal power
above 15 kW and nominal operating
speeds between 120 r/min and
15000 r/min when measured in situ
Part 4: Gas turbine driven sets excluding aircraft
derivatives
Part 6: Reciprocating machines with power
ratings above 100 kW
[8] Germanischer L loyd:
“Rules for Calssification and Construction,
I - Ship Technology, Part 1 - Seaging Ships,Chapter 2 - Machinery Installations”, Edition 2000.
[9] Payer, H. G., Asmussen, I.:
“Vibration Response on Propulsion-Efficient
Container Vessels”, SNAME Transactions,
Vol. 93, 1985.
[10] Lewis, F. M.:
“The Inertia of the Water Surrounding a Vibrating
Ship”, SNAME Transactions, Vol. 37, 1929.
[11] Kaleff, P.:
“Numerical Analysis of Hydroelastic Problems
using the Singularity FE-method” (in German),
Institut für Schiffbau, Report No. 401, 1980,
Hamburg.
[12] Röhr, U., Möller, P.:
“Elastic Ship Hull Girder Vibrations in Restricted
Water” (in German), Jahrbuch der STG, Vol. 91,
1997.
[13] Simon, H.:“The Lanczos Algorithm with Partial Reorthogona-
lization”, Math. Computing, Vol. 42, 1984.
[14] Cabos, C.:
“Error Bounds for Dynamic Responses in Forced
Vibration Problems”, Journal of Scientific
Computing, SIAM, Vol. 15, 1994.
[15] Asmussen, I., Mumm, H.:
“Ship Vibrations under Consideration of Gas
Pressure Forces Induced by Slow-Running Two-
Stroke Engines” (in German), Jahrbuch der STG,
Vol. 91, 1991.

8/8/2019 GL Ship Vibration
http://slidepdf.com/reader/full/gl-ship-vibration 49/51
50
[16] Asmussen, I., Müller-Schmerl, A.:
“Consideration of Medium-Speed Four-Stroke
Engines in the Assessment of Ship Vibrations” (in
German), FDS-Report No. 257, 1994.
[17] Jakobsen, S. B.:
”Coupled Axial and Torsional Vibration Calculations
of Long-Stroke Diesel Engines",
SNAME Transactions, Vol. 99, 1991.
[18] STG-Expert Panel on Ship Vibrations,
Report No MB 81-80 (in German).
[19] Lehmann, E.:
“Local Vibrations onboard Ships” (in German),
Handbuch der Werften, Vol. XIII, 1976.
[20] Köster, D.:
“Vibration Analyses in Practice” (in German),
5 th Duisburger Colloquium for Ship- and
Offshore-Structures, 1987
[21] Wedel-Heinen, Pedersen, T,:
“Vibration Analysis of Imperfect Marine Structural
Elements”, PRADS Proceedings Vol. 2, 1989.
[22] Clough, R. W., Bathe, K. J.:
“Finite Element Analysis of Dynamic Response”,
Advances in Computational Methods in Structural
Mechanics and Design, UAH Press 1972,
University of Alabama, Huntsville.
[23] Matthies, H. G., Nath, C.:
“Methods for Vibration Analysis” (in German),
Schiff und Hafen, Issue 13, 1986.
[24] Hylarides, S.:
”Damping in Propeller-Generated Ship Vibrations”,
NSMB, Publ.-No. 468, Wageningen, 1974.
[25] Willich, G.:
“A Contribution for the Determination of Damping in
Ship Vibrations” (in German), PhD-Thesis RWTH-
Aachen, 1988.
[26] Asmussen, I., et. al:
“Introduction of Main Engine Excitation into the
Ship Structure” (in German), Report No. BMFF-MTK
440 D, Hamburg, 1991.
[27] Mumm, H., Asmussen, I.:
“Simulation of Low-Speed Main Engine Excitation
Forces in Global Vibration Analyses”,
Proceedings of Int. Conf. on Noise and Vibration in
the Marine Environment, RINA, London, 1995.
[28] Kumai, T.:
“Some Aspects to the Propeller Bearing Forces
Exciting Hull Vibration of a Single Screw Ship”,
Wissenschaftliche Zeitschrift der Universität
Rostock, Vol.10, Issue 2/3, 1961.
[29] Kerwin, J. E., Lee, C. S.:
“Prediction of Steady and Unsteady Marine
Propeller Performance by Numerical Lifting-
Surface Theory”, SNAME Transactions,
Vol. 86, 1978.
[30] Weitendorf, E. A.:
“The Cavitating Tip Vortex of a Propeller and the
Resulting Pressure Fluctuations” (in German),
Schiffstechnik Vol. 24, 1977.
[31] Skaar, K. T., Raestad, A. E.:
“The Relative Importance of Ship Vibration
Excitation Forces”, RINA-Symposium on Propeller
Induced Ship Vibration, London, 1979.
[32] Yamaguchi, H., et. al:
”Development of Marine Propellers with Better
Cavitation Performance”, 3rd Report, Spring
Meeting of the Society of Naval Architects of
Japan, 1988.
[33] Holden, K. D., Fagerjord, O., Frostad, R.:
“Early Design Stage Approach to Reducing Hull
Surface Forces Due to Propeller Cavitation”,
SNAME Transactions, Vol. 88, 1980.
[34] Björheden, O.:“Highly-Skewed Controllable Pitch Propellers”,
HANSA, Vol. 118, Issue 12, 1981.
[35] Chao, K. Y., Streckwall, H.:
“Computation of the Propeller Flow using
a Vortex-Lattice Method” (in German),
Jahrbuch der STG, Vol. 83, 1989.
[36] Hoshino, T.:
“Application of Quasi-Continuous Method to
Unsteady Propeller Lifting Surface Problems”,
Journal of the Society of Naval Arch. of Japan,
Vol. 158, 1985.

8/8/2019 GL Ship Vibration
http://slidepdf.com/reader/full/gl-ship-vibration 50/51
[37] Asmussen, I., Mumm, H.:
“Quantities of Propeller Excitation as a Function of
Skew and Cavitation for Performing Vibration
Analyses” (in German), FDS-Report No. 228, 1991.
[38] Streckwall , H.:
“Comparison of Two Methods for Computation
of Propeller Induced Pressure Oscillations”
(in German), Jahrbuch der STG, Vol. 89, 1995.
[39] H. G. Natke:
“Introduction to Theory and Practice
of Time Series and Modal Analysis” (in German),
Vieweg ISBN 3-528-18145-1.
[40] M. P. Norton:
“Fundamentals of Noise and Vibration Analysis forEngineers”, Cambridge University Press,
ISBN 0 521 34941 9.
Published by Germanischer Lloyd Aktiengesellschaft, Hamburg
Edited by Germanischer Lloyd Press & Public Relations, Hamburg
Layout by Nissen | Carstensen Communications Consulting GmbH
PR Office, Germanischer Lloyd, Hamburg
Translations by Eugen Klaussner, Ritterhude
Publishing house Selbstverlag des Germanischen Lloyd
Vorsetzen 35, 20459 Hamburg/ Germany
P.O. Box 11 16 06, 20416 Hamburg/Germany
Phone: +49 40 36149-0
Fax: +49 40 36149-200
e-mail: [email protected]
Printed by Klingenberg & Rompel, 22459 Hamburg/Germany
The contents may be reproduced free of charge
on condition that an acknowledgement is sent to
Germanischer Lloyd.

8/8/2019 GL Ship Vibration
http://slidepdf.com/reader/full/gl-ship-vibration 51/51
Germanischer Lloyd Aktiengesellschaft
Head Office
Vorsetzen 35, 20459 Hamburg /Germany
Phone: +49 40 36149-0
Fax: +49 40 36149-200
E-Mail: [email protected]
24-hour fleet in service hotline
+49 40 36149-1111
Theoretical Investigations
Phone: +49 40 36149-662
Fax: +49 40 36149-7320
Experimental Investigations
Phone: +49 40 36149-310
Fax: +49 40 36149-7490
www.gl-group.com


