
GL Noble Denton - UK Response to EC Impact Assessment on Offshore Regulation
20
This Report is protected by copyright and may not be reproduced in whole or in part by any means without the approval in writing of GL Noble Denton. No Person, other than the Customer for whom it has been prepared, may place reliance on its contents and no duty of care is assumed by GL Noble Denton toward any Person other than the Customer. This Report must be read in its entirety and is subject to any assumptions and qualifications expressed therein. Elements of this Report contain detailed technical data which is intended for analysis only by persons possessing requisite expertise in its subject matter. GL Noble Denton is the trading name of GL Industrial Services UK Ltd Registered in England and Wales No. 3294136 Registered Office: Holywell Park, Ashby Road, Loughborough, Leicestershire, LE11 3GR UK Prepared for: Prepared by: Bob Lauder Carol Humphreys and Mike Johnson Oil & Gas UK 3rd Floor, The Exchange 2 62 Market Street Aberdeen AB11 5PJ GL Industrial Services UK Ltd trading as GL Noble Denton Holywell Park Ashby Road Loughborough Leicestershire LE11 3GR United Kingdom Tel: +44 (0)1509 28 2559 Fax: +44 (0)1509 28 3119 E-mail: [email protected] Website: www.gl-nobledenton.com Report Number: AA/77-01-01/11959 November 2011 UK Response to EC Impact Assessment on Offshore Regulation Not Restricted Confidential to Oil & Gas UK
description
uk response
Transcript of GL Noble Denton - UK Response to EC Impact Assessment on Offshore Regulation

This Report is protected by copyright and may not be reproduced in whole or in part by any means without the approval in writing of GL Noble Denton. No Person, otherthan the Customer for whom it has been prepared, may place reliance on its contents and no duty of care is assum ed by GL Noble Denton toward any Person other thanthe Customer.This Report must be read in its entirety and is subject to any assumptions and qualifications expressed therein. Elements of this Report contain detailed technical datawhich is intended for analysis only by persons possessing requisite expertise in its subject matter.
GL Noble Denton is the trading name of GL Industrial Services UK LtdRegistered in England and Wales No. 3294136 Registered Office: Holywell Park, Ashby Road, Loughborough, Leicestershire, LE11 3GR UK
Prepared for: Prepared by:
Bob Lauder Carol Humphreys and Mike Johnson
Oil & Gas UK
3rd Floor, The Exchange 262 Market StreetAberdeenAB11 5PJ
GL Industrial Services UK Ltd trading as GL Noble Denton
Holywell ParkAshby RoadLoughborough LeicestershireLE11 3GRUnited Kingdom
Tel: +44 (0)1509 28 2559Fax: +44 (0)1509 28 3119
E-mail: [email protected]
Website: www.gl-nobledenton.com
Report Number: AA/77-01-01/11959 November 2011
UK Response to EC ImpactAssessment on Offshore
Regulation
Not Restricted Confidential to Oil & Gas UK

Report Number: AA/77-01-01/11959Issue: 1.0
Not Restricted Page i

Report Number: AA/77-01-01/11959Issue: 1.0
Not Restricted Page ii
Executive SummaryThe European Commission (EC) has published a draft regulation on the safety of offshore oil and gasactivities. To support this draft regulation, an ‘Impact Assessment’ has been prepared, which provides boththe average annual cost of major offshore accidents in European waters and the potential benefits ofchanges to regulation through a postulated reduction in incidents. The Impact Assessment then shows thatthis benefit could be greater than the additional regulatory cost and so is used to support the recommendedapproach.
The key points in the Impact Assessment are:
The average annual cost of all major offshore accidents is estimated to be between €205 millionand €915 million, which is made up of:
o The average annual cost of blowout incidents, estimated to be between €140 million and€850 million. (A blowout is defined as ‘an incident where formation fluid flows out of thewell …after all the predefined technical well barriers or the activation of the same havefailed’.)
o The average annual cost of all other major accidents, estimated to be €65 million.
The recommended option (Option 2) is considered by the EC to have the potential to saveapproximately half of the total annual cost of major accidents (between €103 million and €455million) with annual costs of€133 to €139 million plus one off costs of €18 to€44 million.
As the annualised cost of major accident hazards is dominated by the costs associated with blowouts, Oil &Gas UK contracted GL Noble Denton to review this aspect of the Impact Assessment by examining theestimation of the frequency and consequences of blowouts and how these are used within the cost benefitanalysis.
Summary of Findings
The review of the EC Impact Assessment has shown:
The frequency assigned to blowouts in the EC Impact Assessment that have a duration of 15 daysor more is in agreement with industry data and is not disputed.
The consequences of blowouts in the EC Impact Assessment are based on high flow, 50+ dayevents which the data shows are a very low proportion of blowout events.
Industry data shows that 30% of blowout events are associated with wells being drilled forexploration and appraisal.
70% of blowout events are associated with production wells which will have much reducedconsequences compared to the upper bounding case used in the Impact Assessment, (DeepwaterHorizon).
A survey of UKCS operators carried out in 2011 showed that of the current oil production wells only54% flow naturally and only 22% flow naturally at a rate of more than 1000 barrels of oil per day(bopd), i.e. 2% of the Deepwater Horizon flow rate.
The upper bound of the cost estimates used in the EC Impact Assessment for longer durationblowout events (€30,000 million) is considerably higher than what could be considered arepresentative cost for a longer duration blowout event.

Report Number: AA/77-01-01/11959Issue: 1.0
Not Restricted Page iii
Using more realistic, yet still conservative, estimates of the costs of blowout events, the cost oflonger duration blowouts is calculated to be of the order of €62 million per year, giving a total costof all major accidents of €127 million.
The EC Impact Assessment assumes a reduction in incident costs of 50% by the introduction of EUregulation despite stating in relation to North Sea activities “…bearing in mind that the region's risk-based regulatory framework is considered at present amongst the very best in the world”.
90% of the offshore oil and gas activities in European waters fall within this risk based regulatoryframework.
The reduction in incident costs also takes no account of changes already, voluntarily, introduced bythe UK oil and gas Industry in the management of well operations post the Deepwater Horizonevent.
Accepting the EC estimate given in the Impact Assessment that a reduction in incident costs of 50%will be achieved by the introduction of EU regulation, a reduction in costs to €63.5 million will berealised. The costs of the proposed regulatory change, at over €130 million, far outweigh thebenefits.
If the benefit from the regulatory change is less, say a 20% reduction in incident costs, theregulatory costs are more than five times the benefit obtained.
Given these findings, it is concluded that the cost benefit analysis given in the EC Impact Assessment isfundamentally flawed and that the assertion that it supports the introduction of EU wide regulations (Option2) is invalid.

Report Number: AA/77-01-01/11959Issue: 1.0
Not Restricted Page iv
Contents1 Introduction ........................................................................................................................................1
2 Blowout Frequency............................................................................................................................2
2.1 Blowout Prevention and Area of Operation ...................................................................................... 2
2.2 Dependency on Type of Operation..................................................................................................... 3
3 Consequences and Annualised Cost..............................................................................................4
3.1 Basis for the EC Cost Estimates......................................................................................................... 4
3.2 Comments on EC Costs ....................................................................................................................... 4
3.3 Revised Costing..................................................................................................................................... 6
4 Cost Benefit Analysis........................................................................................................................8
5 Summary and Conclusions ............................................................................................................10
6 References ........................................................................................................................................11
Appendix A Clean up Costs...................................................................................................................12
Appendix B Incident Data.......................................................................................................................14

Report Number: AA/77-01-01/11959Issue: 1.0
Not Restricted Page 1
1 IntroductionThe European Commission (EC) has published a draft regulation on the safety of offshore oil and gasactivities. To support this draft regulation, an ‘Impact Assessment’ has been prepared [1][2], which providesboth the average annual cost of major offshore accidents in European waters and the potential benefits ofchanges to regulation through a postulated reduction in incidents. The Impact Assessment then shows thatthis benefit could be greater than the additional regulatory cost and so is used to support the recommendedapproach.
The key points in the Impact Assessment are:
The average annual cost of all major offshore accidents is estimated to be between €205 millionand €915 million, which is made up of:
o The average annual cost of blowout incidents, estimated to be between €140 million and€850 million. (A blowout is defined as ‘an incident where formation fluid flows out of thewell …after all the predefined technical well barriers or the activation of the same havefailed’. [3])
o The average annual cost of other major accidents, estimated to be €65 million.
The recommended option (Option 2) is considered by the EC to have the potential to saveapproximately half of the total annual cost of major accidents (between €103 million and €455million) with annual costs of€133 to €139 million plus one off costs of€18 to€44 million.
As the annualised cost of major accident hazards is dominated by the costs associated with blowouts, Oil &Gas UK1 contracted GL Noble Denton to review this aspect of the Impact Assessment by examining theestimation of the frequency and consequences of blowouts and how these are used within the cost benefitanalysis.
This review makes reference to a number of previously published studies. These include comments on theEC impact assessment provided by Det Norske Veritas (DNV) to the Norwegian Oil Gas industryassociation (OLF) [4].
1 Oil & Gas UK is the representative body for the UK offshore oil and gas industry. It is a not-for-profit organisation, established in April 2007 butwith a pedigree stretching back over 30 years
Report Number: AA/77-01-01/11959Issue: 1.0
Not Restricted Page 2
2 Blowout FrequencyBoth the EC Impact Assessment and the DNV review for OLF [4] use data published by the InternationalAssociation of Oil & Gas Producers (OGP) [3], which in turn is based on data published by SINTEF. TheEC Impact Assessment uses data for blowout events up to 2006 [5] whilst the DNV review uses more recentSINTEF data (up to 2010 [6]).
Both assessments arrive at broadly similar frequency assessments, i.e.
EC: 2.7x10⁻² per year in European waters, i.e. repeat occurrence once every 37 years
DNV 2.1 x10⁻² per year in UK and Norwegian waters, i.e. repeat occurrence once every 48 years
The main document of the Impact Assessment [1] states that analysis of the frequency data has beenundertaken in order to determine the frequency of long duration events, quoted as being circa 50 days induration. Annex I provides more detail on this analysis and shows that the quoted frequency is actually fora blowout event that lasts more than 14 days (i.e. 15 days or more). The quoted DNV frequency is also forblowout events lasting 15 days or more. The data shows that long duration events globally account for avery small proportion of blowouts and the rate in the North Sea area is lower than the rest of the world.Data presented in the DNV review indicates that only 20% of the blowout events lasting 15 days or morewould continue for more than 50 days.
Given the broadly similar results from the Impact Assessment and the DNV review, it is judged that there islittle benefit to be obtained in a third review of the data to provide baseline frequency estimates of blowoutslasting 15 days or more. However, there are two areas associated with blowout frequency estimation thatdeserve further comment and these are discussed below.
2.1 Blowout Prevention and Area of Operation
Further review of the OGP data shows that it deliberately separates data for ’North Sea Standardoperations2’ from data for operations that do not meet this standard. The frequency of blowouts on wellsthat meet the North Sea Standard operation are consistently lower than those that do not meet thisstandard. This suggests that North Sea operations are already performing better than the global average,though as this is a small data set care should be taken about drawing conclusions that are too wide ranging.In the EC analysis the frequency of an event lasting 15 days or more is the only frequency used inestimating the annualised cost. Any risk calculated using the frequency of a 15 day event with the costs fora 50+ day event will clearly be a gross over estimation.
Though the historical data suggests that there is a downward trend in blowout frequencies, the EC analysishas not taken any direct account of this. Given the limited amount of data, this approach is notunreasonable.
However, aside from any quantitative analysis, there are good reasons to expect that blowout frequenciesshould be reducing. DNV have reviewed [7] the technological improvements in blowout prevention. Whilethe quantification of the benefits can be disputed (DNV estimate that current frequencies are expected to be
2 North Sea Standard operation has the specific definition of a well with a blowout preventer installed including a shear ram and following thetwo barrier principle.
Report Number: AA/77-01-01/11959Issue: 1.0
Not Restricted Page 3
a factor of 3.5 lower than the historical data) there is very strong evidence to show that current blowoutfrequencies are less than those estimated from historical data. In addition, the UK oil and gas industry, aspart of the Oil Spill Prevention and Response Group (OSPRAG) response to Deepwater Horizon, carriedout a technical review of well operations to provide assurance as to the safety of such operations on the UKContinental Shelf. That review has also prompted work to produce further industry guidance, capturing goodpractice, on matters such as Well Integrity Management; Well Examination and Verification; Well Control;and Training and Competence. Guidelines for Well Operators on Well Examination and Guidelines for WellOperators on Competency of Well Examiners were officially published 29th November 2011. All of theseenhanced measures provide additional confidence in UK well operations management.
As a consequence, the blowout frequency used in the EC Impact Assessment should be viewed as highlyconservative for 50+ day events.
2.2 Dependency on Type of Operation
The published base frequency data used in the Impact Assessment is also subdivided by the different typesof operations during which blowouts could occur, i.e. during exploration and development drilling, wellintervention, and production. In the EC analysis, these separate frequencies have been combined toprovide the single estimate for blowout events lasting 15 days or more. This is then the only frequency usedin estimating the annualised cost. The combination of the data loses any distinction between blowout eventsduring exploration and appraisal drilling operations compared with those from production wells, where theconsequences may be very different. Blowouts on production wells are very unlikely to be able to sustain along duration, significant spill event. A survey of operators in the UKCS carried out by Oil & Gas UK in 2011(with responses from all the main operators) indicates that for 1070 oil production wells:
46% cannot flow naturally.
Only 22% can flow naturally and have a production rate of more than 1000 barrels of oil per day(bopd).
Though this data is specific to UKCS, it can be expected that there will be similar low flow and not naturallyflowing wells in the rest of European waters. No consideration has been given to this factor in the ECImpact Assessment.
Using the data quoted in Annex I of the Impact Assessment, about 70% of the frequency of blowouts comesfrom production wells with the remaining 30% coming from drilling and completion operations.
Again, the application of a single frequency is too simplistic and ignores the fact that larger events (both inrelease rate and durations extending significantly beyond 15 days) are less likely, particularly in the case ofproduction wells. As will be seen in the following sections, these factors can significantly affect theestimated annual costs from blowout events.

Report Number: AA/77-01-01/11959Issue: 1.0
Not Restricted Page 4
3 Consequences and Annualised Cost
3.1 Basis for the EC Cost Estimates
The Impact Assessment provides lower and upper costs for the “base case” blowout of €5,000 million and€30,000 million respectively. The Deepwater Horizon blowout in the Gulf of Mexico provides thebenchmark for the upper limit. This had an estimated release rate of 50,000 bopd for about 100 days. Thecost was derived from BP estimates and is therefore relatively well defined. However, its use in calculatingthe upper limit of the annualised cost assumes that all blowout events lasting 15 days or more will cost€30,000 million, giving an upper bound annualised cost of €850 million.
The Impact Assessment is less definitive regarding the derivation of the lower bound cost estimate for ablowout event lasting 15 days or more. The assessment refers to an environmental statement produced byHess for an appraisal well off Shetland [8] detailing two cases:
A blowout event involving the release of 88,000 barrels (approximately 12,000 tonnes) of oil per daywhich is then brought under control
A much longer duration event lasting 2 ½ months with a total oil spill of about 500,000 tonnes (3.7million barrels) of oil.
The first event represents the worst case uncontrolled blowout where intervention is successful in bringingthe well under control. The second case is again the worst case uncontrolled blowout, but in this case thewell is not brought under control and the reservoir pressure depletes over a period of 2½ months to a pointwhere the release effectively stops.
The Hess environmental statement provides no information on the cost of such an event. In order to derivea cost associated with these incidents, the Impact Assessment makes reference to published data on oilclean up costs [9] to derive the clean up costs of US$1.6 billion and US$6.6 billion for the two Hess blowoutevents based on just over US$13,000 clean up cost per tonne. It is not entirely clear how the minimumcost for a blowout event is then calculated from these values as the final cost includes compensation costsas well as clean up costs. However, the minimum cost of any blowout event lasting 15 days or more on anexploration, development or production well derived from these cases is finally given as €5,000 million.
The lower bound of the annualised cost for blowout events is then determined by multiplying the totalfrequency of blowouts lasting 15 days or more (2.7x10⁻² per year) by the minimum cost of €5,000 million togive an annualised cost of €140 million. That is it is assumed that all of these blowouts have at least theconsequences identified in the Hess statement for an appraisal well, ignoring the fact that many wellscannot release oil at anything like the rate assumed by the EC.
3.2 Comments on EC Costs
The comments on cost analysis provided in the EC Impact Assessment cover a number of areas.
Likelihood and Magnitude of the Upper Bound
The upper bound on the annualised cost is clearly highly conservative as events such as DeepwaterHorizon are at the very high end of the possible range of consequences. They therefore have a much lowerchance of occurring than the probability used in the Impact Assessment, which is the frequency of all events

Report Number: AA/77-01-01/11959Issue: 1.0
Not Restricted Page 5
lasting 15 days or more. It could also be argued that the compensation costs are high in the US and suchcosts are unlikely to be incurred within European waters.
Minimum Blowout Event
The lower bound blowout event in the Impact Assessment, based on an appraisal well for Hess, isconsidered to have flow rates significantly higher than the majority of the currently producing wells on theUKCS. This event was the scenario used as the basis for the recent UK emergency response exerciseSula, organised to test the industry’s response to a significant oil spill in conjunction with the NationalContingency Plan. As discussed earlier, the data quoted in Annex I of the Impact Assessment shows thatabout 70% of blowouts are from production wells rather than during drilling. Given that only 22% of UKCSwells flow naturally and produce more than 1000 bopd, an event resulting in a spillage of 88,000 bopd isconsidered completely unrepresentative of production well blowouts in the UKCS3.
Even when extended to all European waters, the blowout event used in the Impact Assessment to definethe minimum consequences is actually much worse than most production well blowouts could ever be.
Cost of Oil Spill
The clean up costs quoted in the Impact Assessment are the baseline values in [9] and are reproduced inAppendix A. The costs vary depending on the location and initially it appears that the Impact Assessmenthas selected a reasonable average. However the reference includes tables for modifying factors that allowclean up costs to be adjusted to provide a more case specific assessment (these factors are alsoreproduced in Appendix A). In the case of larger offshore oil spills, these modifiers would reduce the cleanup costs by more than an order of magnitude but the Impact Assessment has chosen not to apply thesefactors building in yet more conservatism to the estimate.
On its own, this would reduce the lower cost estimate to less than €500 million with an average cost of only€14 million, compared to the€140 million given in the Impact Assessment.
Oil Spill Response
The analysis does not take any account of the work voluntarily carried out by the UK Industry under theauspices of the Oil Spill Prevention and Response Group (OSPRAG) set up in response to the DeepwaterHorizon event. OSPRAG carried out a technical review of well operations to provide assurance as to thesecurity of such operations on the UK Continental Shelf. That review has also prompted work to producefurther industry guidance on matters such as Well Integrity Management; Well Examination and Verification;Well Control; and Training and Competence. A particular response of the group was the design andmanufacture of a capping device that can be used to bring a blowout event under control in 30 days. All ofthese enhanced measures provide additional confidence in UK well operations management.
Oil & Gas UK are also currently developing estimates for oil spill costs for significant blowouts on the UKCS[10]. This includes detailed modelling of a number of blowout scenarios and calculation of the likely costs,
3 It is recognised that the production rate is only indicative of the blowout release rate, however this does not make any difference to theconsiderable disparity between the average UKCS production well and the minimum case given in the Impact Assessment.
Report Number: AA/77-01-01/11959Issue: 1.0
Not Restricted Page 6
including compensation. The release rates used for the modelling range from a minimum of 9,200 bopd upto approximately 58,000 bopd,
The modelling also considers two cases in terms of duration, one where the blowout continues for 90 days,representative of the case where a relief well is required, and a second where the blowout lasts 30 days,representing a case where the flow can be stopped by other means.
It should be stressed that these modelled events are by no means ‘average’ blowout events. The range ofspills used in the modelling spans the worst oil spillages that have occurred worldwide, with the top eventbeing equivalent to the Deepwater Horizon blowout. Further comparison with major blowouts is provided inAppendix B. Given the well information gained from the survey of UKCS operators, these represent eventsat the very high end of possibilities for most wells.
The costs calculated in the Oil & Gas UK modelling are:
90 day spill: €260 million to€645 million
30 day spill :€88 million to €330 million
It can be seen that all of these costs are significantly below the minimum cost estimate of €5,000 millionquoted in the Impact Assessment. It is worth noting, however, that if the Impact Assessment had takenaccount of the ‘modification factors’ given in [9], the calculated costs would have been relatively consistentwith the values calculated in the Oil & Gas UK modelling.
It is also important to distinguish between blowout events and tanker spills. Tanker spills often occur nearthe coastline and the proportion of oil that reaches the shore will be greater, leading to a significant increasein clean up costs. Tanker spills are therefore not a good guide to the likely costs of blowouts.
3.3 Revised Costing
In order to illustrate the considerable pessimism in the EC Impact Assessment, a more representative, yetstill mostly conservative, analysis has been carried out. The assumptions made in these calculations are:
1. The frequency of blowouts lasting 15 days or more is taken to be the same as that used in the ECImpact Assessment, i.e. 2.7x10⁻² per year.
2. The probability of such events lasting more than 50 days is the same as that given in the DNVresponse to OLF. This gives the frequency of events lasting 15-50 days and 50 days or more as2.12x10-2 and 5.8x10⁻³ per year respectively.
3. Drilling and completion activities account for 30% of blowouts.
4. Production and well intervention activities account for 70% of events.
5. Only 40% of naturally flowing wells will produce more than 1000 bopd.
6. For 15-50 day events:
a. The assumed costs for drilling and completion blowouts is the maximum cost estimated inthe OSPRAG study€645 million (which is actually a 90 day event)
b. Production blowouts from wells that flow at more than 1000 bopd cost the maximum valuecalculated in the OSPRAG study for 30 day events, €330 million.
c. Production blowouts from wells that flow at less than 1000 bopd cost the minimum valuecalculated in the OSPRAG study for 30 day events, €88 million.

Report Number: AA/77-01-01/11959Issue: 1.0
Not Restricted Page 7
7. For 50+ day events:
a. The assumed costs for drilling and completion blowouts is €30,000 million (the cost of theDeepwater Horizon event)
b. All production blowouts have the maximum cost in the OSPRAG study,€645 million
The revised costing based on these assumptions is shown in Table 1, which also provides a total overallcost, including other offshore major accidents.
Table 1: Revised Annualised Costs
Duration Frequencyper year
Activity Proportion ofEvents
Cost AnnualisedCost
15-50 days 2.12x10⁻²
[ repeats every 47
years]
Drilling &Completion
30% €645 million €4.1 million
Production (inclwell intervention)
on >1000bopdwells
42% €330 million €2.9 million
Production (inclwell intervention)
on <1000bopdwells
28% €88 million €0.5 million
50+ days 5.79x10⁻³
[repeats every 172
years]
Drilling &Completion
30% €30,000 million €52.1 million
Production (inclwell intervention
70% €645 million €2.6 million
Total for blowouts* €62 million
Costs for other major accidents €65 million
Overall total €127 million
EC Impact Assessment €205 million -€915 million
* This has been rounded to the nearest whole number
It should be noted that the revised costing still includes a group of events that are conservatively assumedto always result in the same costs as the Deepwater Horizon blowout. These dominate the total annualisedcost and as a result, the annualised cost estimate is also not particularly sensitive to the other costs. Even ifthe costs associated with all other events were doubled, the total annual cost would only increase by about€10 million.
The purpose in providing this revised costing is not to provide a definitive evaluation of the annualised costs,but to use a more representative analysis to illustrate considerable overestimation within the EC ImpactAssessment. However, given that the revised costing is significantly less than the EC estimate, it isimportant to revisit the cost benefit analysis.

Report Number: AA/77-01-01/11959Issue: 1.0
Not Restricted Page 8
4 Cost Benefit AnalysisAs already described, the cost benefit analysis for the EC recommended option (Option 2) has been carriedout on the basis that implementation of the option will reduce accidents to 50% of their current level.
If for the moment this level of reduction is accepted, the upper limit of the EC ‘benefit’ is based on theassumption that all blowout events cost €30,000 million, The impact of this is shown in Figure 1 where theannualised benefit is shown for different types of accident.. This figure also shows the minimum annualregulatory cost.
0
50
100
150
200
250
300
350
400
450
EC Impact Assessment Revised Costing
Annu
alise
dCo
sts/
Bene
fits(€m
illio
ns) 15-50 days production on
<1000bopd wells
15-50 days production on>1000bopd wells
15-50 days drilling &completion
50+ days production
50+ days drilling & completion
Non-blowout incidents (othermajor accidents)
Minimum regulatory cost
Figure 1: Comparison of Maximum Benefits against Minimum Regulatory Cost
Report Number: AA/77-01-01/11959Issue: 1.0
Not Restricted Page 9
It can be seen the revised costing still conservatively retains the postulated benefits related to 50+ daydrilling and completion blowouts and other major accidents. However, other benefits are significantlyreduced by the introduction of the more representative costing. It clearly shows that the EC upper limit,based on assigning the worst case scenario costs to all scenarios, is highly pessimistic and cannot besubstantiated. The benefit based on the revised approach proposed in this report is less than half of theestimated regulatory costs despite retaining much of the conservatism in the EC assessment.
The postulated 50% reduction in incident costs also seems particularly optimistic given that more than 90%of the offshore oil and gas activities in European waters already fall within the already highly regulatedUKCS and NCS area. The EC Impact Assessment itself says of North Sea regulations “…bearing in mindthat the region's risk-based regulatory framework is considered at present amongst the very best in theworld”. Since the Deepwater Horizon event the Industry has introduced more guidelines around welloperations the benefits of which are not included in the EC Impact Assessment.
If the reduction in major accidents costs were less, then the disparity between the regulatory costs and thebenefits becomes greater. For example, if the reduction in accident costs in Option 2 was 20% rather than50%, then the regulatory costs would be more than five times the benefit achieved. This provides a clearillustration of the fundamental flaws in the cost benefit analysis presented in the EC Impact Assessment.
Report Number: AA/77-01-01/11959Issue: 1.0
Not Restricted Page 10
5 Summary and ConclusionsThe review of the EC Impact Assessment has shown:
The frequency assigned to blowouts in the EC Impact Assessment that have a duration of 15 daysor more is in agreement with industry data and is not disputed.
The consequences of blowouts in the EC Impact Assessment are based on high flow, 50+ dayevents which the data shows are a very low proportion of blowout events.
Industry data shows that 30% of blowout events are associated with wells being drilled forexploration and appraisal.
70% of blowout events are associated with production wells which will have much reducedconsequences compared to the upper bounding case used in the Impact Assessment, (DeepwaterHorizon).
A survey of UKCS operators carried out in 2011 showed that of the current oil production wells only54% flow naturally and only 22% flow at naturally a rate of more than 1000 barrels of oil per day(bopd), i.e. 2% of the Deepwater Horizon flow rate.
The upper bound of the cost estimates used in the EC Impact Assessment for longer durationblowout events (€30,000 million) is considerably higher than what could be considered arepresentative cost for a longer duration blowout event.
Using more realistic, yet still conservative, estimates of the costs of blowout events, the cost oflonger duration blowouts is calculated to be of the order of €62 million per year, giving a total costof all major accidents of €127 million.
The EC Impact Assessment assumes a reduction in incident costs of 50% by the introduction of EUregulation despite stating in relation to North Sea activities “…bearing in mind that the region's risk-based regulatory framework is considered at present amongst the very best in the world”
90% of the offshore oil and gas activities in European waters fall within this risk based regulatoryframework.
The reduction in incident costs also takes no account of changes already, voluntarily, introduced bythe UK oil and gas Industry in the management of well operations post the DWH event.
Accepting the EC estimate given in the Impact Assessment that a reduction in incident costs of 50%will be achieved by the introduction of EU regulation, a reduction in costs to €63.5 million will berealised. The costs of the proposed regulatory change, at over €130 million, far outweigh thebenefits.
If the benefit from the regulatory change is less, say a 20% reduction in incident costs, theregulatory costs are more than five times the benefit obtained.
Given these findings, it is concluded that the cost benefit analysis given in the EC Impact Assessment isfundamentally flawed and that the assertion that it supports the introduction of EU wide regulations (Option2) is invalid.
Report Number: AA/77-01-01/11959Issue: 1.0
Not Restricted Page 11
6 References[1] Commission Staff Working Paper – Impact Assessment, Accompanying the document “Proposal
for a regulation of the European parliament and of the council on safety of offshore oil and gasprospection, exploration and production activities, sec(2011) 1293 final dated 27 Oct 2011.
[2] Commission Staff Working Paper – Impact Assessment Annex 1, Accompanying the document“Proposal for a regulation of the European parliament and of the council on safety of offshore oiland gas prospection, exploration and production activities, sec(2011) 1292 final dated 27 Oct2011.
[3] Blowout Frequencies, OGP report 434-17 March 2010
[4] DNV Memo No: 13QEL2Z-1/BRUDE, 06 Oct 2011.
[5] Blowout and Well Release Characteristics and Frequencies, 2006; SINTEF, STF50 F06112, 2006.
[6] Blowout and well release frequencies based on SINTEF offshore blowout database 2010(revised). Scandpower report No. 19.101.001-3009/2011/R3
[7] Environmental Risk Assessment of Exploration Drilling in Nordland VI, Det Norske Veritas, ReportNo.20/04/2010,
[8] Hess environmental statement, Appraisal Well 204/10a-D (Cambo 4), Hess document numberASE-177, May 2011
[9] Worldwide Analysis of Marine Oil Spill Cleanup Cost Factors’, Dagmar Schmidt Etkin, 2000,Presented at Arctic and Marine Oil Spill Program Technical Seminar,http://www.environmentalresearch.com/erc_papers/ERC_paper_2.pdf
[10] Oil Spill Compensation and Response Cost Study (UKCS), L40147 (Draft – under peer review),Oil Spill Modelling for UK Offshore Locations – Interim Report, L40088 (v2), BMT ARGOSS
Report Number: AA/77-01-01/11959Issue: 1.0
Not Restricted Page 12
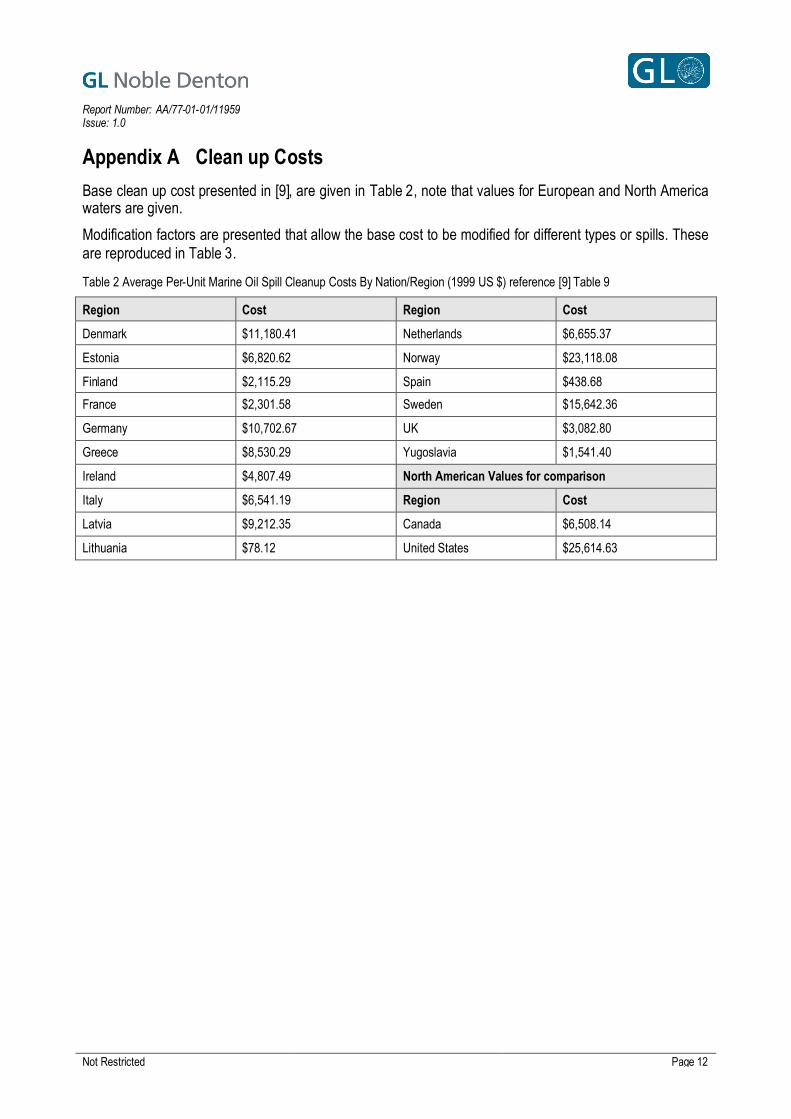
Appendix A Clean up CostsBase clean up cost presented in [9], are given in Table 2, note that values for European and North Americawaters are given.
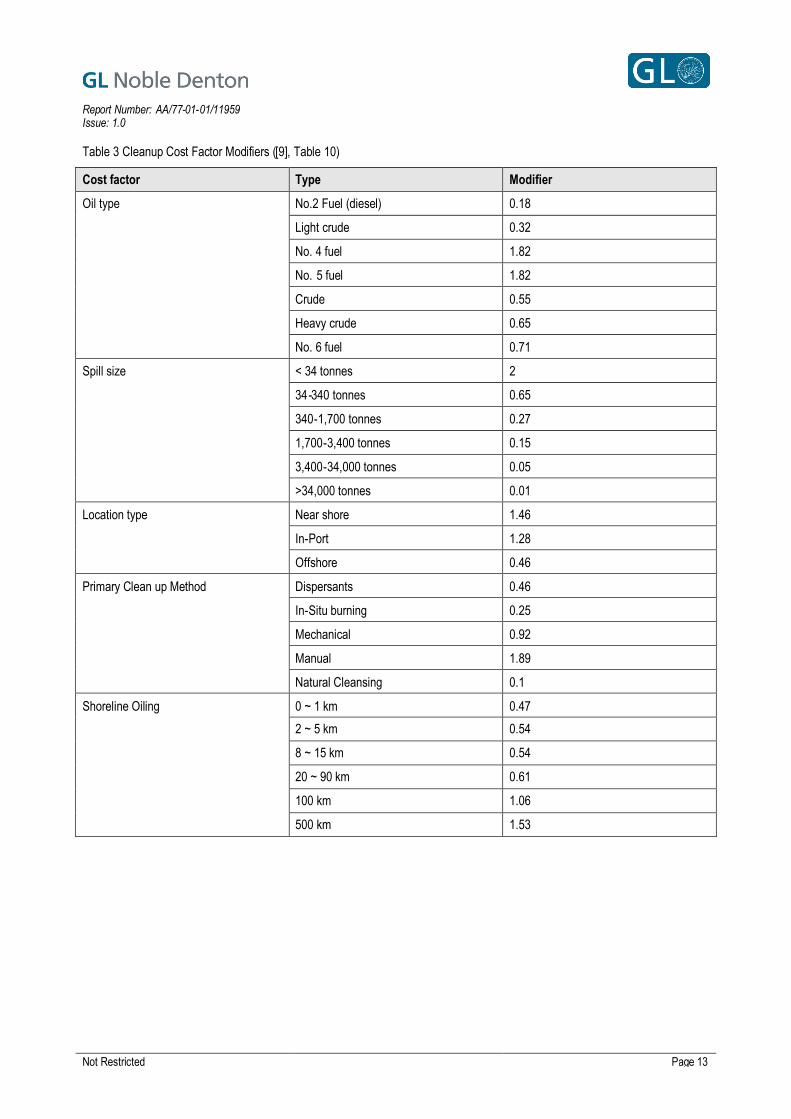
Modification factors are presented that allow the base cost to be modified for different types or spills. Theseare reproduced in Table 3.
Table 2 Average Per-Unit Marine Oil Spill Cleanup Costs By Nation/Region (1999 US $) reference [9] Table 9
Region Cost Region Cost
Denmark $11,180.41 Netherlands $6,655.37
Estonia $6,820.62 Norway $23,118.08
Finland $2,115.29 Spain $438.68
France $2,301.58 Sweden $15,642.36
Germany $10,702.67 UK $3,082.80
Greece $8,530.29 Yugoslavia $1,541.40
Ireland $4,807.49 North American Values for comparison
Italy $6,541.19 Region Cost
Latvia $9,212.35 Canada $6,508.14
Lithuania $78.12 United States $25,614.63
Report Number: AA/77-01-01/11959Issue: 1.0
Not Restricted Page 13
Table 3 Cleanup Cost Factor Modifiers ([9], Table 10)
Cost factor Type Modifier
Oil type No.2 Fuel (diesel) 0.18
Light crude 0.32
No. 4 fuel 1.82
No. 5 fuel 1.82
Crude 0.55
Heavy crude 0.65
No. 6 fuel 0.71
Spill size < 34 tonnes 2
34-340 tonnes 0.65
340-1,700 tonnes 0.27
1,700-3,400 tonnes 0.15
3,400-34,000 tonnes 0.05
>34,000 tonnes 0.01
Location type Near shore 1.46
In-Port 1.28
Offshore 0.46
Primary Clean up Method Dispersants 0.46
In-Situ burning 0.25
Mechanical 0.92
Manual 1.89
Natural Cleansing 0.1
Shoreline Oiling 0 ~ 1 km 0.47
2 ~ 5 km 0.54
8 ~ 15 km 0.54
20 ~ 90 km 0.61
100 km 1.06
500 km 1.53
Report Number: AA/77-01-01/11959Issue: 1.0
Not Restricted Page 14
Appendix B Incident DataThe National Oceanic and Atmospheric Administration (NOAA) has the responsibility, under the NationalContingency Plan, to provide scientific support to the U.S. Coast Guard (USCG) in planning for andresponding to spill emergencies in the marine environment.
NOAA produced a list of case histories covering the period 1967 to 19914. The case histories include allspills that:
Exceeded 100,000 barrels internationally
Exceeded 10,000 barrels in U.S. waters
Involved the use of dispersants
Involved bioremediation
Involved severe environmental impacts: (more than 500 birds killed, more than 100 mammals killed,smothering of over a mile of intertidal zone, closure of fisheries, etc.
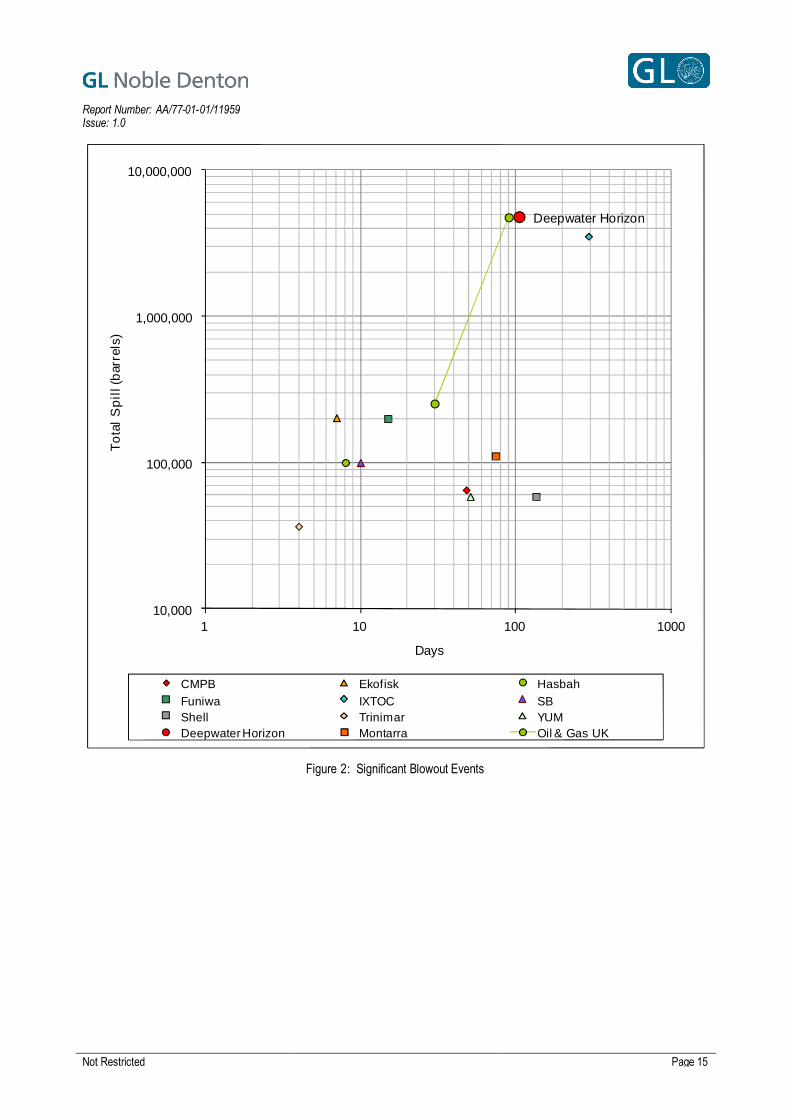
Of this list of 110 incidents during the 25 year period only nine where identified as platform spills or blowoutsthat lasted more than one day (note that two incidents due to war in Iraq and Kuwait have been excluded).The remainder of the incidents were primarily tanker spills.
The figure below shows the spill duration and total spill volume for the platform or blowout incidents quotedby NOAA. Data points for the Montara (which occurred after 1991) and Deepwater Horizon blowouts havealso been added to this figure.
The range of values covered in the Oil & Gas UK case studies have been superimposed on this figure. Thisindicates that the cases selected for the Oil & Gas UK study are toward the upper end of the “consequence”categories previously experienced worldwide.
4 Oil spills case histories 1967-1991, NOAA Hazardous materials response and assessment division
Report Number: AA/77-01-01/11959Issue: 1.0
Not Restricted Page 15
Deepwater Horizon
10,000
100,000
1,000,000
10,000,000
1 10 100 1000
To
tal
Sp
ill(
bar
rels
)
Days
CMPB Ekofisk HasbahFuniwa IXTOC SBShell Trinimar YUMDeepwater Horizon Montarra Oil & Gas UK
Figure 2: Significant Blowout Events


![Noble Denton Guidelines for Marine Lifting Operations[1]](https://static.fdocuments.in/doc/165x107/55cf994a550346d0339c9c2d/noble-denton-guidelines-for-marine-lifting-operations1-5627bda5bee64.jpg)
