GIS Virtual Workshop: Bufferinglegacy.jefferson.kctcs.edu/techcenter/pdf/gis/buffer.pdf · GIS...
16
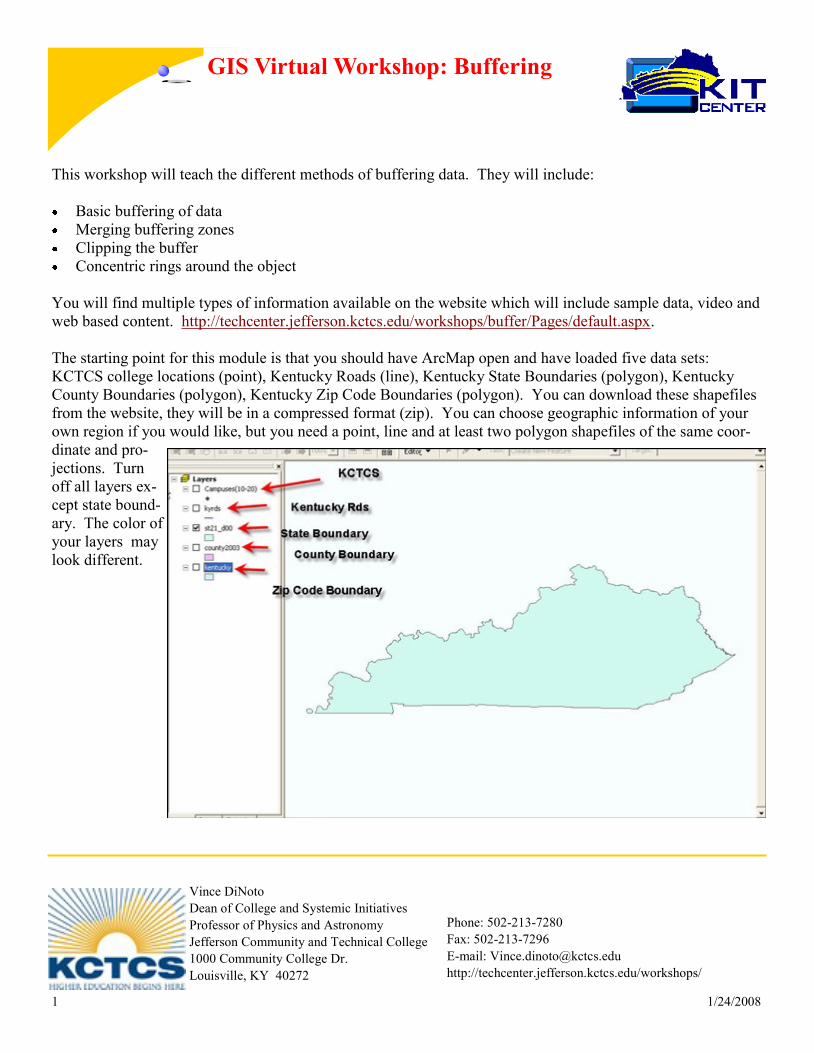
1 1/24/2008 Phone: 502-213-7280 Fax: 502-213-7296 E-mail: [email protected] http://techcenter.jefferson.kctcs.edu/workshops/ Vince DiNoto Dean of College and Systemic Initiatives Professor of Physics and Astronomy Jefferson Community and Technical College 1000 Community College Dr. Louisville, KY 40272 GIS Virtual Workshop: Buffering This workshop will teach the different methods of buffering data. They will include: Basic buffering of data Merging buffering zones Clipping the buffer Concentric rings around the object You will find multiple types of information available on the website which will include sample data, video and web based content. http://techcenter.jefferson.kctcs.edu/workshops/buffer/Pages/default.aspx . The starting point for this module is that you should have ArcMap open and have loaded five data sets: KCTCS college locations (point), Kentucky Roads (line), Kentucky State Boundaries (polygon), Kentucky County Boundaries (polygon), Kentucky Zip Code Boundaries (polygon). You can download these shapefiles from the website, they will be in a compressed format (zip). You can choose geographic information of your own region if you would like, but you need a point, line and at least two polygon shapefiles of the same coor- dinate and pro- jections. Turn off all layers ex- cept state bound- ary. The color of your layers may look different.
Transcript of GIS Virtual Workshop: Bufferinglegacy.jefferson.kctcs.edu/techcenter/pdf/gis/buffer.pdf · GIS...
1 1/24/2008
Phone: 502-213-7280
Fax: 502-213-7296
E-mail: [email protected]
http://techcenter.jefferson.kctcs.edu/workshops/
Vince DiNoto
Dean of College and Systemic Initiatives
Professor of Physics and Astronomy
Jefferson Community and Technical College
1000 Community College Dr.
Louisville, KY 40272
GIS Virtual Workshop: Buffering
This workshop will teach the different methods of buffering data. They will include:
Basic buffering of data
Merging buffering zones
Clipping the buffer
Concentric rings around the object
You will find multiple types of information available on the website which will include sample data, video and
web based content. http://techcenter.jefferson.kctcs.edu/workshops/buffer/Pages/default.aspx.
The starting point for this module is that you should have ArcMap open and have loaded five data sets:
KCTCS college locations (point), Kentucky Roads (line), Kentucky State Boundaries (polygon), Kentucky
County Boundaries (polygon), Kentucky Zip Code Boundaries (polygon). You can download these shapefiles
from the website, they will be in a compressed format (zip). You can choose geographic information of your
own region if you would like, but you need a point, line and at least two polygon shapefiles of the same coor-
dinate and pro-
jections. Turn
off all layers ex-
cept state bound-
ary. The color of
your layers may
look different.

2 1/24/2008
Phone: 502-213-7280
Fax: 502-213-7296
E-mail: [email protected]
http://techcenter.jefferson.kctcs.edu/workshops/
Vince DiNoto
Dean of College and Systemic Initiatives
Professor of Physics and Astronomy
Jefferson Community and Technical College
1000 Community College Dr.
Louisville, KY 40272
GIS Virtual Workshop: Buffering
Double click on the State
Boundary Layer Color Box to
display the window like the
one to the right. We want the
color of the fill for the map to
be hollow, so that other layers
can be displayed through this
layer. Double click on the
hollow icon, then click on the
properties button to display a
window to change other prop-
erties.

3 1/24/2008
Phone: 502-213-7280
Fax: 502-213-7296
E-mail: [email protected]
http://techcenter.jefferson.kctcs.edu/workshops/
Vince DiNoto
Dean of College and Systemic Initiatives
Professor of Physics and Astronomy
Jefferson Community and Technical College
1000 Community College Dr.
Louisville, KY 40272
GIS Virtual Workshop: Buffering
Once you selected the hollow fill it created a black outline
around the state. In this step you will change the outline to be
a standard state border. The window displayed to the left is
only a part of the window that will open. Click on the outline
button to open a window to change the property of the outline
for the state of Kentucky shapefile.
Select the Boundary, State
from the list of line types.
Note there are many other
types of lines that might be
used in other parts of this
module or other modules.

4 1/24/2008
Phone: 502-213-7280
Fax: 502-213-7296
E-mail: [email protected]
http://techcenter.jefferson.kctcs.edu/workshops/
Vince DiNoto
Dean of College and Systemic Initiatives
Professor of Physics and Astronomy
Jefferson Community and Technical College
1000 Community College Dr.
Louisville, KY 40272
GIS Virtual Workshop: Buffering
The white area of the map is really hollow, but
since all other layers are currently turned off it
appears white.
The next step is that we want to display the
county boundaries on this map. Click the check
box next to the county boundary layer to turn it
on.
Once the county boundary layer is turned on it
should look something like the map to the right.
The color of the fill may be different. We want
to make the fill for this map hollow and the
boundaries represented with the standard county
boundary representation. You will need to do
the same steps as was previously done for the
entire state. The one difference is selecting the
boundary as county boundary instead of state
boundary.

5 1/24/2008
Phone: 502-213-7280
Fax: 502-213-7296
E-mail: [email protected]
http://techcenter.jefferson.kctcs.edu/workshops/
Vince DiNoto
Dean of College and Systemic Initiatives
Professor of Physics and Astronomy
Jefferson Community and Technical College
1000 Community College Dr.
Louisville, KY 40272
GIS Virtual Workshop: Buffering
The resulting map should have an appearance
similar to the one on the right. At this scale it is
a little difficult to see the difference between the
state and county boundary information, but
when you enlarge a region you will be able to
observe the differences.
Next turn on the zip code layer by clicking the
check box. It should look like the map to the
left. The fill color maybe different. Again we
want to make the fill hollow and change the
boundary lines to being neighborhood. You will
follow the same steps as done for the state or
county layers to complete this operation.

6 1/24/2008
Phone: 502-213-7280
Fax: 502-213-7296
E-mail: [email protected]
http://techcenter.jefferson.kctcs.edu/workshops/
Vince DiNoto
Dean of College and Systemic Initiatives
Professor of Physics and Astronomy
Jefferson Community and Technical College
1000 Community College Dr.
Louisville, KY 40272
GIS Virtual Workshop: Buffering
The results of changing the fill and boundary
type for the zip code layer should produce a
map similar to the one at the right.
Next you will turn on the KCTCS layer. This is
a point shapefile and it maybe difficult to see
the dots for each campuses at this scale. The
campuses are represented by a dot and we want
to change the symbol to a school symbol with a
larger size.
Click on the dot symbol in the layer menu for
the KCTCS layer to open the following dialog
box.

7 1/24/2008
Phone: 502-213-7280
Fax: 502-213-7296
E-mail: [email protected]
http://techcenter.jefferson.kctcs.edu/workshops/
Vince DiNoto
Dean of College and Systemic Initiatives
Professor of Physics and Astronomy
Jefferson Community and Technical College
1000 Community College Dr.
Louisville, KY 40272
GIS Virtual Workshop: Buffering
Select the School 2 symbol
and keep the color with the
default green color and the
size as 18. You can change
these later by clicking on the
symbol to open this window
again.
The results of this operation can be seen in the
map to the right. You can now see the locations
of the KCTCS campuses and see that a more
appropriate symbol is being used. The refer-
enced point is the center of the symbol.

8 1/24/2008
Phone: 502-213-7280
Fax: 502-213-7296
E-mail: [email protected]
http://techcenter.jefferson.kctcs.edu/workshops/
Vince DiNoto
Dean of College and Systemic Initiatives
Professor of Physics and Astronomy
Jefferson Community and Technical College
1000 Community College Dr.
Louisville, KY 40272
GIS Virtual Workshop: Buffering
Next we want to turn on the road shapefile
(line). There are many different types of road
classifications. They are in general classified by
a code known as, Census Feature Class Codes
(CFCC) a description of these can be found at
http://www.census.gov/geo/www/tiger/
appendxe.asc. The road file that you have
loaded has only the major roads and does not
include city and county roads, but does include
state and interstate highways. For our work we
will not worry about classify-
ing the roads as different
types. Click on the road sym-
bol in the layer menu to select
the roads display properties.
Click on the Major Road sym-
bol, leave the color and the
width at the default levels.
You may wish to change the
width later so that the display
is easier to view.

9 1/24/2008
Phone: 502-213-7280
Fax: 502-213-7296
E-mail: [email protected]
http://techcenter.jefferson.kctcs.edu/workshops/
Vince DiNoto
Dean of College and Systemic Initiatives
Professor of Physics and Astronomy
Jefferson Community and Technical College
1000 Community College Dr.
Louisville, KY 40272
GIS Virtual Workshop: Buffering
We have now modified the data appropriately
from the initial load of information. If we are
viewing the entire state there are far to many
layers turned on for any meaningful information
to be obtained. Some of these layers are more
useful when we are at a zoom level of one or a
few counties. If the map was being plotted on a
large scale plotter than all layers could be left
on, but for a desktop size map we need to turn
off some of the layers as we view the entire
state.
Turn off the road and zip code layers, do not
remove the layers from the map.
Click on the toolbox symbol. Next click on
the Analysis Tools and the Proximity tray to
show the Buffer tool. In a later part of this
module we will also use the multiple ring
buffer. Select the buffer tool. Note in
ArcMap 9.1 the buffer tool was also in a
menu known as the Tool Menu. The view to
the right is only part of the full screen, you
should see your map to the right of the part
of the screen currently displayed.

10 1/24/2008
Phone: 502-213-7280
Fax: 502-213-7296
E-mail: [email protected]
http://techcenter.jefferson.kctcs.edu/workshops/
Vince DiNoto
Dean of College and Systemic Initiatives
Professor of Physics and Astronomy
Jefferson Community and Technical College
1000 Community College Dr.
Louisville, KY 40272
GIS Virtual Workshop: Buffering
The pull down
arrows next to
the boxes allow
you to use files
that are open on
your map. The
open folders icon
are used for files
that are not open
on your map.
The input feature
will be the
KCTCS Campus
layer. The out-
put feature will
be a file that is
created by the
process of buffering, you need to note the name of the file and the storage location, you can change both of
these items before the process is completed. The distance is a linear distance and we will select 25 miles for
this example. All other items will remain at the default levels. In the image below we are using the pull down
arrow and the list
shown is of all
layers currently
loaded on our
map. We will
select the
KCTCS layer.
11 1/24/2008
Phone: 502-213-7280
Fax: 502-213-7296
E-mail: [email protected]
http://techcenter.jefferson.kctcs.edu/workshops/
Vince DiNoto
Dean of College and Systemic Initiatives
Professor of Physics and Astronomy
Jefferson Community and Technical College
1000 Community College Dr.
Louisville, KY 40272
GIS Virtual Workshop: Buffering
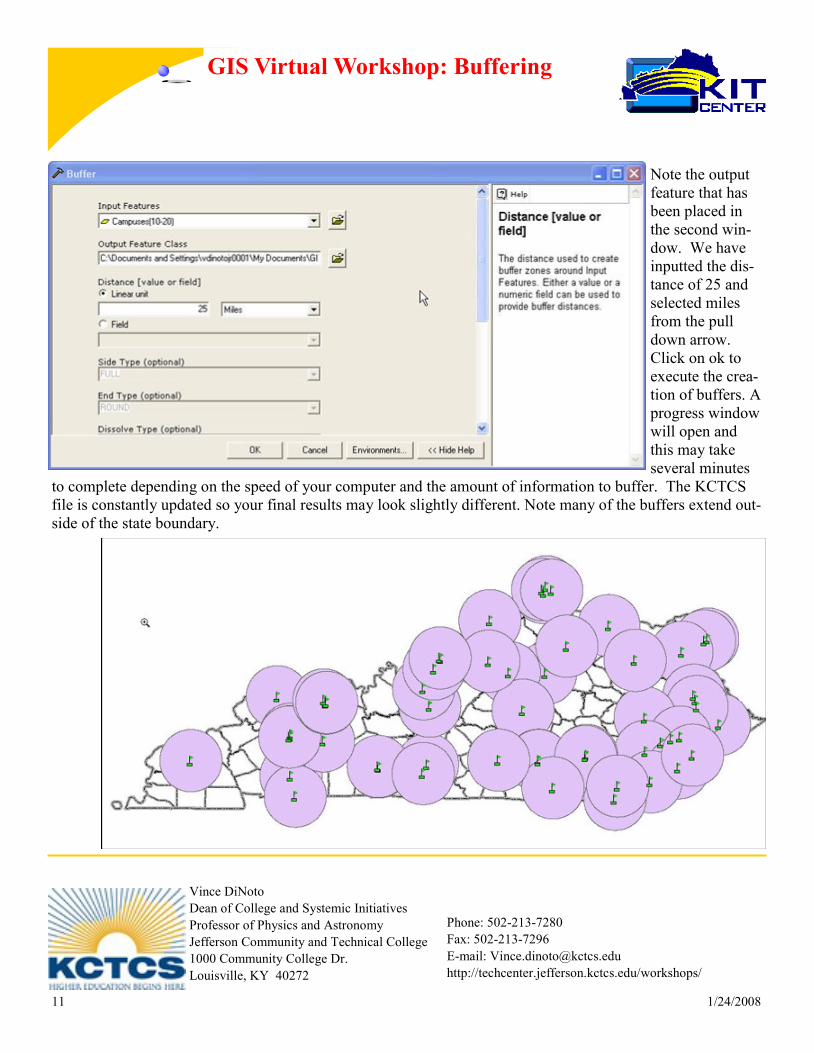
Note the output
feature that has
been placed in
the second win-
dow. We have
inputted the dis-
tance of 25 and
selected miles
from the pull
down arrow.
Click on ok to
execute the crea-
tion of buffers. A
progress window
will open and
this may take
several minutes
to complete depending on the speed of your computer and the amount of information to buffer. The KCTCS
file is constantly updated so your final results may look slightly different. Note many of the buffers extend out-
side of the state boundary.

12 1/24/2008
Phone: 502-213-7280
Fax: 502-213-7296
E-mail: [email protected]
http://techcenter.jefferson.kctcs.edu/workshops/
Vince DiNoto
Dean of College and Systemic Initiatives
Professor of Physics and Astronomy
Jefferson Community and Technical College
1000 Community College Dr.
Louisville, KY 40272
GIS Virtual Workshop: Buffering
To make the cir-
cles remain within
the state bounda-
ries we will use the
clip feature. You
may wish to refer
to the module on
Clipping for more
details. The clip
tool is located in
the Toolbox under
the Analysis Tools
in the Extract
Tray.
The clip window
requires a file and
a boundary poly-
gon to clip with.
Our file will be the recently created buffer file
and the boundary will be the state boundary file.
Since both of these files are loaded you can use
the pull down arrows to select. The third win-
dow is the location in which the new file, the
clipped buffer file will be stored and the name
that the system assigns to it. Make sure the
name is appropriate and that the storage location
is part of your tree structure. The remaining
items in this window will use the default values.
The results of clipping against the state bound-
ary can be seen in the image at the left. Your
county boundary file should be a higher layer in
the layer menu than the new clipped buffer file,
so that the county boundaries display on top of
the buffer.

13 1/24/2008
Phone: 502-213-7280
Fax: 502-213-7296
E-mail: [email protected]
http://techcenter.jefferson.kctcs.edu/workshops/
Vince DiNoto
Dean of College and Systemic Initiatives
Professor of Physics and Astronomy
Jefferson Community and Technical College
1000 Community College Dr.
Louisville, KY 40272
GIS Virtual Workshop: Buffering
In the next part we want to dissolve the bounda-
ries between the circles. To do this we are going
to create a new buffer around the KCTCS cam-
pus locations. Therefore, you need to go back
to the toolbox and open the buffer window
again. We have expanded the buffer window to
see all of the different options that can be used.
Near the bottom of the window you see Dis-
solve Type. The default is None. We will
change this value to All. We will also need to
input the layer for buffer to be defined about
which is the KCTCS campuses. Remember a
new shapefile will be created and stored with a
default name and note the location unless you
changed the information in the second window.
You will also need to input a distance for the
buffer with units. The window to the right
shows the values filled in.

14 1/24/2008
Phone: 502-213-7280
Fax: 502-213-7296
E-mail: [email protected]
http://techcenter.jefferson.kctcs.edu/workshops/
Vince DiNoto
Dean of College and Systemic Initiatives
Professor of Physics and Astronomy
Jefferson Community and Technical College
1000 Community College Dr.
Louisville, KY 40272
GIS Virtual Workshop: Buffering
The results of the dis-
solve is that circles that
touch have been dis-
solved. The country
boundary shapefile
needs to be placed above
the buffer layer. Note
the information extends
outside of the state
boundary because we
have not clipped this
layer. If you wish you
can do a clip, as was
done previously.
The final part of this
module will be to create concentric rings around the campuses of different distances. You will need to go back
to the Toolbox and select Multiple Ring Buffer this time.
Remember buffering can also be done with lines and polygons, in this module we have only looked at point
shapefiles. You have already loaded road and zip code information and you should try to buffer these layers to
see the results of buffers around these geometries.

15 1/24/2008
Phone: 502-213-7280
Fax: 502-213-7296
E-mail: [email protected]
http://techcenter.jefferson.kctcs.edu/workshops/
Vince DiNoto
Dean of College and Systemic Initiatives
Professor of Physics and Astronomy
Jefferson Community and Technical College
1000 Community College Dr.
Louisville, KY 40272
GIS Virtual Workshop: Buffering
The multiple ring buffer window looks similar
to the standard buffer window and the first two
boxes are the same. Select the layer to be buff-
ered using the pull down arrows. Again we will
buffer the KCTCS campuses. The output fea-
ture will be automatically filled in, make sure
that it make sense both in storage location and
name. Input the first distance and click on the
plus button. Repeat this for two additional dis-
tances. In this example we have used 10, 25 and
35. Next select the unit, for this example we
will use miles. We have also turned on the dis-
solve option to ALL to dissolve overlapping
rings. In the window to the right you can see all
of the selected and inputted values.

16 1/24/2008
Phone: 502-213-7280
Fax: 502-213-7296
E-mail: [email protected]
http://techcenter.jefferson.kctcs.edu/workshops/
Vince DiNoto
Dean of College and Systemic Initiatives
Professor of Physics and Astronomy
Jefferson Community and Technical College
1000 Community College Dr.
Louisville, KY 40272
GIS Virtual Workshop: Buffering
The image to left is
the results from the
completed operation.
You will note that the
rings are dissolved,
they extend beyond
the state boundary
since they have not
been clipped. To bet-
ter understand the
results it would be
good if each distance
was represented by a
different color. To do
this you will need to
open the property
window and use the symbology tab. Select quantities and then select the field which has the distance measure-
ments, select a ramp color. You should have three classes since we used three different distances. For a final
map you should also move the country and state boundaries to a higher level and clip about the state boundary.