Center for Public Technology Information Technology for Small Municipalities.

GIS Ostrava 2011 23. – 26. 1. 2011, Ostrava
GIS FOR SMALL MUNICIPALITIES
Irena OPATŘILOVÁ1, Dalibor BARTONĚK2
1Institute of Geodesy, Faculty of Civil Engineering, Brno University of Technology, Veveří 95, 602 00, Brno,
Czech Republic, [email protected]
2Institute of Geodesy, Faculty of Civil Engineering, Brno University of Technology, Veveří 95, 602 00, Brno,
Czech Republic, [email protected]
Abstract
GIS for small municipalities is the topic of this paper. The project is based on the information needs of self-
government of small municipalities or city districts. It solves the compromise between the lack of funds to
build special-purpose GIS and the need for computer support in accounting and decision making processes.
The article describes the construction of the project. The first phase is the design of the system included the
determination of user requirements and data collection. The layers integrated into the system (national map
series, ortho-photomaps, cadastre of real estates, town-planning documentation, environment, etc.) and data
providers are described in this first part. The second phase is the implementation of this design system
contained steps as the choosing appropriate software (primary ArcGIS software), the input, the data
transformation and data analyses. The analyses were made for two types, the surface analyses based on
created digital terrain model (terrain maps of exposure, slope, shadow, visibility, etc.) and thematic spatial
analyses (finding the optimal place to live, selection localities for the construction of wind or solar power, a
good place for a playground, etc.). The final phase is about the creating of required outputs and the
installation of the system on the local authority. The project was exported into format *.pmf for freeware
browser ArcReader because users have not had ArcGIS software. Some problems that appear in individual
phases of creating are described in the article, too. To date the technology of GIS has been deployed using
this method into small municipalities Křetín, Vranová, Jinačovice, Moravice, Želešice, Silůvky and into the
District of Brno-Jundrov, Brno-Líšeň and Brno-Jih (Komárov, Horní and Dolní Heršpice, Přízřenice).
Keywords: GIS, municipality, administration, spatial analysis.
1. INTRODUCTION
In the recent years information technology belongs to the fastest growing science disciplines and cuts across
all branches of knowledge. There is no difference in areas of the state administration, where the demand
grows for its own geographic information system (GIS) over the territory of its autonomy. GIS arise at the
regional level, as well as at the level of the small municipalities and smaller city districts.
The deployment of GIS technology into the ambience of small municipalities or city districts has its own
special specifics. On the one hand, there is the modern technology that is certainly a very useful tool in the
practice of the state administration and in many cases can be enforced by the legislation; on the other hand,
there are very restrictive means for the acquisition of hardware and software components of GIS, including
training of the operator, due to financial unavailability.
Both of these opposing factors have led to the idea of farming out the implementation of GIS for small
municipalities (or city districts) in the form of master’s thesis. The advantages are negligible cost of the
system design and low, user-controlled costs on its running. To date the technology of GIS has been
deployed using this method into small municipalities Křetín, Vranová, Jinačovice, Moravice, Želešice, Silůvky
and into the District of Brno-Jundrov, Brno-Líšeň and Brno-Jih (Komárov, Horní and Dolní Heršpice,
Přízřenice) [1].

GIS Ostrava 2011 23. – 26. 1. 2011, Ostrava
2. DESIGN OF THE SYSTEM
2.1. Requirements for the system
The uniform frame of the structure of GIS for needs of small municipalities can’t be defined easily, because
each municipality has different requirements for the content of the system depending on the position,
historical and industrial specifics of the municipality. Therefore there was firstly the need to arrange a
personal meeting by the mayor (or mayoress) of the municipality or the city district. The interview determined
what the requirements the representatives of the office have and what the idea about of the overall structure
of the system the representatives have as future users of GIS. At the same time it was checked whether the
office has some materials that could be utilized for the following creation of GIS. In conclusion of a meeting
the creator of system arranged with representatives of the office to the possible future cooperation.
THE MOST COMMON USER REQUIREMENTS
drawing of all underground services
display of objects registered in the cadastre of real estates, including the database of the file of
descriptive information relating to these objects
valid town-planning documentation
ortho-photos of the interest area
planimetry and altimetry of map for given location
technical characteristics and master plans (transport, greenery, waste management, culture,
etc.)
register of population, register of ratepayers behind dogs and waste
price map of plots
information about the environment
thematic spatial analysis.
2.2. The collection of needed data
The data collection is a crucial phase of the design of the GIS because in simple terms any GIS would not
have been created without data. Generally, data are located in different places, under different
administrators or heads of departments. The result of system design is dependent not only on the availability
of materials, but also on the willingness and helpfulness of the administrator of these data.
The following is a list of categories of data layers, which were included into the system on the basis of user
requirements and the discretion of the system creator. Further, the main data providers are introduced here.
THE TOPOGRAPHIC LAYERS
ortho-photomaps of the interest area (source: Geodis Brno, The Czech Office for Surveying,
Mapping and Cadastre (COSMC))
planimetry and altimetry of map, digital terrain model (source: ZABAGED - COSMC)
cadastral maps (digital cadastral map, thematic cadastral map, raster of the cadastre of lands,
orientation map of parcels; source: the cadastre office, the local authority (LA))
tourist and bike tourist maps, nature trails (source: SHOCart, LA)
GIS Ostrava 2011 23. – 26. 1. 2011, Ostrava
THE THEMATIC LAYERS
town-planning documentation (source: Brno City Municipality (BCM), LA)
utilities (source: BCM, network administrators - E.ON, JMP Net, Jihomoravské vodovody a
kanalizace, Telefonica O2 and others)
infrastructure - maps of roads, railways, public transport networks etc. (source: BCM, LA,
ZABAGED – Fundamental Base of Geographic Data)
Price map of building or agricultural plots (source: BCM)
environment - waste management, significant green space, maps of protected areas, air quality
maps, map of the main wind directions, noise maps, floodplains, soil maps and cover forest
maps etc. (source: BCM, The Agency for Nature Conservation and Landscape Protection of the
Czech Rebublic, T. G. Masaryk Water Research Institute, Lesy ČR)
geological and geophysical maps - radon index, gamaspektrometry, radiometric and
geomagnetic maps (source: Czech Geological Survey, Geofyzika Brno)
historical maps, maps of immovable cultural monuments (source: server mapy.cz, The South
Moravian Regional Authority)
interactive maps with hyperlinks created on the basis of own photographs of objects in a given
locality
The biggest problem in collecting data was the reluctance of some data administrators to provide data free of
charge and therefore not been possible to integrate the data into the system. Another problem can be time-
consuming communication between data providers and the applicant because it was not always easy to
simply explain what one asks for, what purposes the data are needed, in what form, etc. Another
complication was the incompleteness of the data so in some cases necessary data was supplemented by
direct field measurements. In one case the problem was the lack of data for the requested data layer.
It is worth mentioning that a large amount of information and data can also be found on the Internet. Map
services that may be used are particular so-called IMS (Internet Map Service) and WMS (Web Map Service).
The important provider is primarily The Czech Environmental Information Agency that provides services
through web geoportal of the public administration. You can find there a large amount of useful data not only
from the environment, but also information on the administrative division, noise maps, population,
transportation, etc. Other providers of WMS are for example COSMC and the Czech Geological Survey.
It is rewarding to use the data from these services for the creation of GIS. Either we can make the
vectorization of maps from service and then enter the object information into the attribute table (this is useful
when we know that the municipality has a problem with connecting to the Internet), or suffice to have these
services connected with our GIS using the URL address.
3. IMPLEMENTATION OF THE DESIGNED SYSTEM
3.1. The choosing appropriate software
After designing the system followed by a phase of data processing and displaying in the appropriate
software. The implementation itself can be divided into several steps.
For creating GIS was chosen primarily the software ArcGIS from ESRI Company, specifically product ArcGIS
Desktop with the highest level of services, ArcInfo. Also the software Geomedia from Intergraph was used in
several cases.

GIS Ostrava 2011 23. – 26. 1. 2011, Ostrava
3.2. The input and the data transformation
This is generally about integrating the materials into the layers of a single coordinate system, in this case of
the Czech system S-JTSK. The obtained data were in double form, either in the form of digital (vector or
raster) or analog. With the materials that were digital and have already had the defined coordinate system S-
JTSK was the least work. The data that were not delivered in this system had first to be transformed.
Problems were for example in the transformation of historic maps because it was difficult to look for identical
points needed for the transformation. In this part some errors in planimetry of individual layers had to be
resolved.
The most of work was done with analog materials. The maps of these documents had to be first converted to
raster form by scanning. These data were incorporated into the system either in the newly created bitmap
format, or even further converted to vector form using editing tools.
Other materials obtained by analog can be various databases that the municipalities lead in the paper form
(e.g. the population register). In this case, do nothing else but the database manually transcribe into digital
form and then connect it with the graphic part of the system.
After the integration of various GIS layers remained the last step. To classify properly these layers, i.e. to
define the graphic attributes of each class of elements and then to fill in attribute table of layers for additional
needed information. If we do not create metadata, at least every object should contain in its attribute table
the basic information about the type of object, data source, updating data, date of creation of layer, author,
possibly hyperlinks to related documents, photos or web pages.
3.3. The analyses of data
Once we have created the GIS we can proceed to the next phase: the data analyses of this system. Thus we
get more data and new information. Analyses can be divided into two groups: on the surface and thematic
spatial analyses.
THE SURFACE ANALYSES
The digital terrain model (DTM) was created from the 3D contour of ZABAGED. The following rasters were
derived from DTM on the basis of surface analyses:
exposure terrain map - gives information about the orientation to cardinal point
slope terrain map - informs about slope conditions in the area
shadow terrain map - shows rate of reflected light for each surface of terrain towards a defined
light source
visibility terrain map - specifies the visible area from a predefined position. The results of the
analysis are places that are visible from this station and which are not visible and are shaded
terrain.
grid terrain model - the interpretation of elevation using colored hypsometry
contour.
These layers were then used for following analyses.
THE THEMATIC SPATIAL ANALYSES
The following analyses were processed for the given locations using ArcGIS tools from data of created GIS
and derived layers from the DTM:
GIS Ostrava 2011 23. – 26. 1. 2011, Ostrava
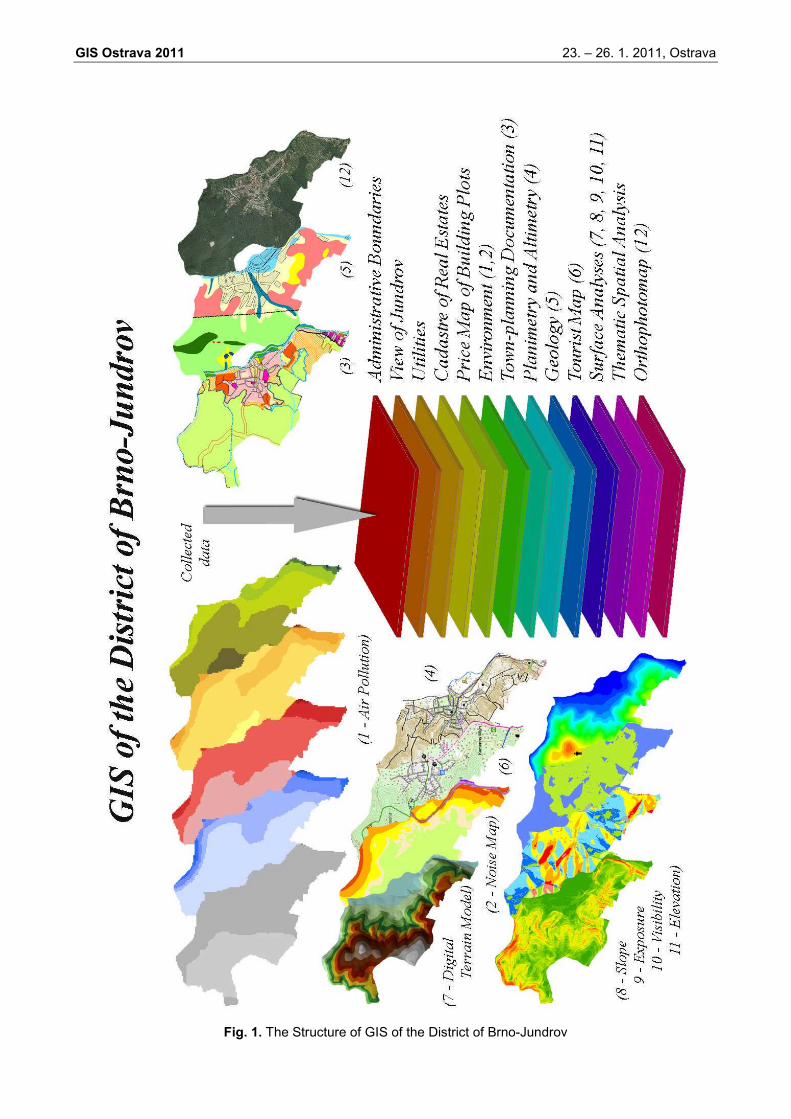
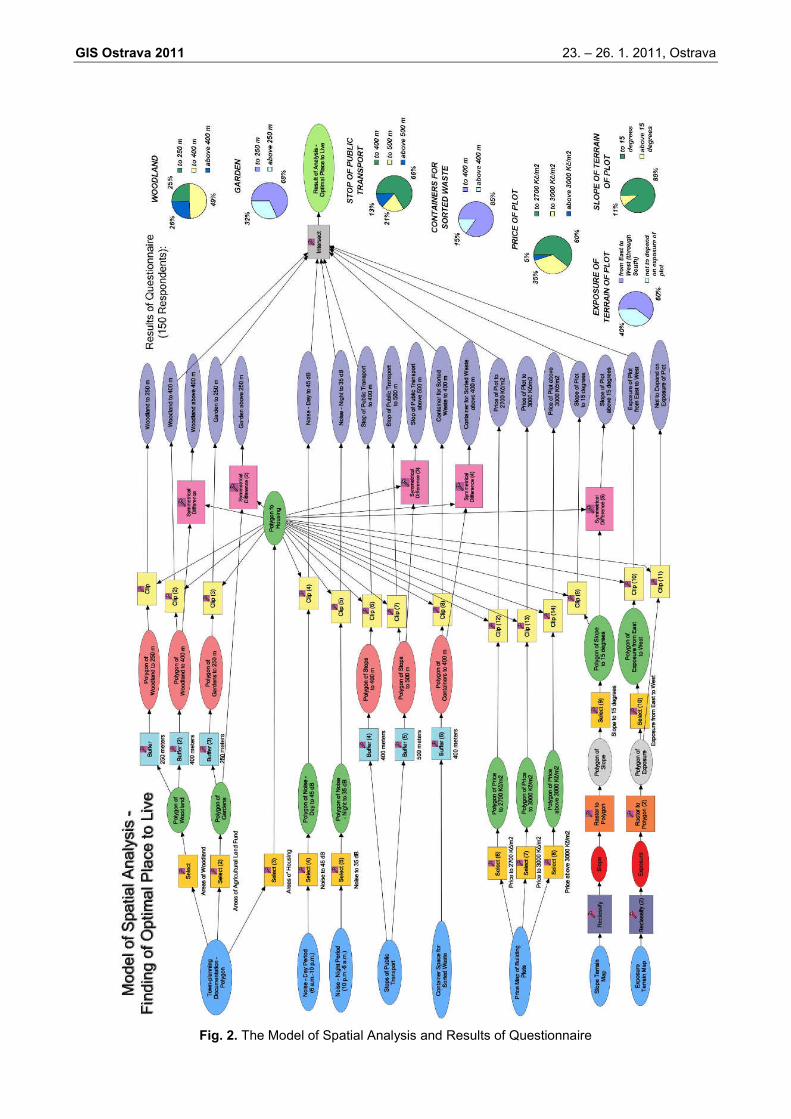
Finding the optimal place to live – the specific parameters of this place were identified on the
base of the questionnaire. The layers used for the analysis were town-planning documentation
(areas of housing, woodland, gardens and public transport stops), the noise maps of road
transport, container space for waste separation, the price of building land map, slope and
exposure map of the terrain [2].
Site selection for construction of houses – data included in the analysis were from noise maps
of road transport, thematic cadastral map (a nature of land use arable land, gardens and
permanent grassland), bus stops and the boundaries of the floodplains Q100 [3].
Assessment of stressor factors in the areas of housing from standpoint of environmental studies
- the analysis was based on ten stressor factors. The data were used from dispersion studies,
flood plain area, noise maps of road transport, area of groundwater contamination and areas of
former landfill [4].
Finding a location for solar power plant - the parameters given to companies engaged in
construction of these buildings. Used data for the analysis were particularly from exposure and
slope terrain map, from solar study and data of the Czech Hydrometeorological Institute (CHMI)
[5].
Finding sites for wind power plant - the parameters chosen for a specific type of wind power.
Used data from the CHMI and the design of wiring [6].
Appropriate location of a playground - the parameters of the plot for the location of a playground
were given by the processor. Used data from the cadastral map and the slope terrain map [5].
Location of ground water purifier - the parameters chosen according to the specific type of plant.
It was worked with the data of cadastre of real estate [6].
Choosing of location for the observation tower - used data from the maps of visibility terrain [6].
Values of erosion for the interest area in the farmed land and the proposal of anti-erosive steps
- used a cadastre data, DTM and BPEJ [6].
Selection of parcels in the noise band - using cadastral map [7].
4. PRESENTATION OF DATA AND THE OUTPUTS
The last phase is the creation of so-called layouts, outputs from GIS, for presentation of project results. Next
it was made an overview of all data layers that are located in the created GIS. In the end the animation of
flight over the given territory and 3D visualization were created whose materials were ortho-photos and DTM.
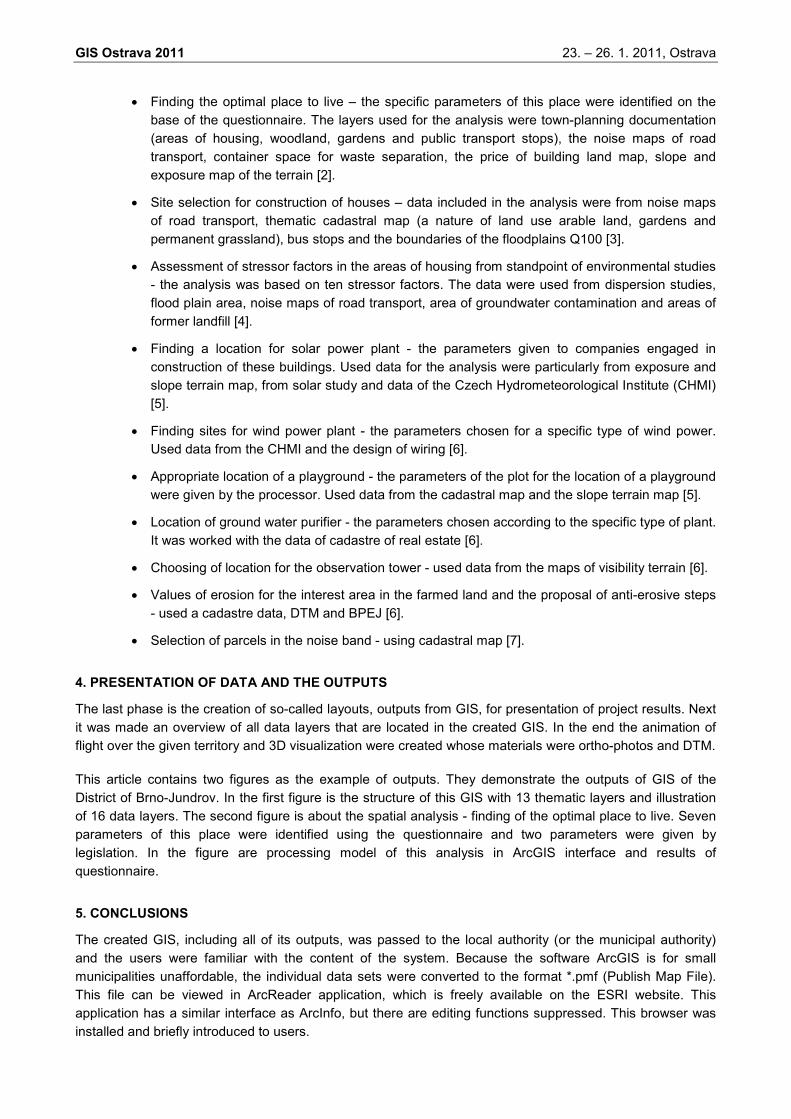
This article contains two figures as the example of outputs. They demonstrate the outputs of GIS of the
District of Brno-Jundrov. In the first figure is the structure of this GIS with 13 thematic layers and illustration
of 16 data layers. The second figure is about the spatial analysis - finding of the optimal place to live. Seven
parameters of this place were identified using the questionnaire and two parameters were given by
legislation. In the figure are processing model of this analysis in ArcGIS interface and results of
questionnaire.
5. CONCLUSIONS
The created GIS, including all of its outputs, was passed to the local authority (or the municipal authority)
and the users were familiar with the content of the system. Because the software ArcGIS is for small
municipalities unaffordable, the individual data sets were converted to the format *.pmf (Publish Map File).
This file can be viewed in ArcReader application, which is freely available on the ESRI website. This
application has a similar interface as ArcInfo, but there are editing functions suppressed. This browser was
installed and briefly introduced to users.
GIS Ostrava 2011 23. – 26. 1. 2011, Ostrava
Fig. 1. The Structure of GIS of the District of Brno-Jundrov
GIS Ostrava 2011 23. – 26. 1. 2011, Ostrava
Fig. 2. The Model of Spatial Analysis and Results of Questionnaire

GIS Ostrava 2011 23. – 26. 1. 2011, Ostrava
Among the most useful layers for representatives of municipality and citizens are undoubtedly plotting of
utilities, cadastral map, town-planning documentation or information about the environment. The information
system serves as support at making a decision and related processes for self-government municipalities.
Can be used as a suitable material in the case of town planning or as a basis for construction activities. The
results of the work may also serve to inform local citizens or visitors to the municipality.
Problems can occur at all phases of creating. For data collection the problems are especially reluctance to
provide data, then the deficiency or absence of data. For data processing the aggravating factor can be
laborious converting analog to digital form. The analog form of the materials occurs mainly in the office of
smaller municipalities. For GIS of city districts data were obtained mostly on the BCM in digital form. Further
complications may occur during data transformation. In the final phase of the project the training of a
representative of users was always necessary, because unfortunately most workers on the offices of
municipality have no experience with such an information system, as opposed to regional offices where there
are separate departments with GIS staffers.
The biggest problem is the data update. Because it is assumed that an update will not be often under way
(maximum once a year), it can be solved a one-off contract or again farming out the master’s thesis. Some
data layers can be solved from standpoint of updates at least through the IMS or WMS services (cadastral
map, ortho-photomaps, ZABAGED etc.).
The most common reason why some smaller municipalities or city districts still do not use GIS is financial
unavailability. Other reasons are lack of awareness of GIS, the supply of use GIS exceeds the need of the
office, or the possibility that so far municipalities only think about the introduction of the GIS [8]. So the main
target of this project was and still is the successful creation of a GIS for the needs of small communities
without charge, as well as to familiarize them with issues of GIS and convince them that this system is
benefit to its users.
REFERENCES
[1] Bartoněk, D. – Pospíšil, L. (2009) GIS pro potřeby malých obcí. Geodetický a kartografický obzor, 55
(97), pp 97-99, (in Czech).
[2] Opatřilová, I. (2010) GIS Městské části Brno-Jundrov. (Master’s thesis), 73 pp. Brno University of
Technology, Faculty of Civil Engineering, Institute of Geodesy (in Czech).
[3] Čepera, D. (2009) Enviromentální zhodnocení Městské části Brno-Jih na bázi GIS. (Master’s thesis), 48
pp. Brno University of Technology, Faculty of Civil Engineering, Institute of Geodesy (in Czech).
[4] Černý, M. (2009) Enviromentální zhodnocení MČ-ti Brno-Jih (Komárov) na bázi GIS. (Master’s thesis), 54
pp. Brno University of Technology, Faculty of Civil Engineering, Institute of Geodesy, (in Czech).
[5] Andiel, J. (2010) GIS obce Jinačovice. (Master’s thesis.), 59 pp. Brno University of Technology, Faculty of
Civil Engineering, Institute of Geodesy (in Czech).
[6] Tratinová, J. (2010) GIS malých obcí. (Master’s thesis.), 59 pp, Brno University of Technology, Faculty of
Civil Engineering, Institute of Geodesy (in Czech).
[7] Vybíralová, A. (2008) GIS pro potřeby malých obcí. (Master’s thesis.), 52 pp. Brno University of
Technology, Faculty of Civil Engineering, Institute of Geodesy (in Czech).
[8] Kulíčková, Š. (2009) Marketingový výzkum ve vybrané firmě. (Master’s Thesis.), 116 pp. University of
South Bohemia in České Budějovice, Faculty of Economics, Department of Management (in Czech).