GIS Business - irgu.unigoa.ac.in
20
GIS Business ISSN: 1430-3663 Vol-15-Issue-5-May -2020 Page | 156 Copyright ⓒ 2020Authors Impact of Foreign Portfolio Investments (FPIs) on Indian Stock Market Dr Pournima Dhume (Assistant Professor, Goa Business School, Faculty Block F, Goa University, Taleigao Plateau, Taleigao- Goa, 403206, Contact: 9923958235, Email: [email protected] ) & Ms Ankita Naik (M.Com. Student, Goa Business School, Faculty Block F, Goa University, Taleigao Plateau, Taleigao-Goa, 403206) ABSTRACT Foreign Portfolio Investments (FPIs) has been playing a significant role in developing the financial market of the country. Indian stock markets were opened to foreign investors in September 1992 and were allowed to invest in the primary and secondary market. The major portion of FPIs has been into equities. India is now the most favourite destination for FPI investors due to the increasing growth of economy. Foreign Portfolio Investment inflows were in large volume during the year 2015. In this paper, we identify the determinants, trends and pattern of Foreign Portfolio Investments in India and examine the relationship between the determinants and FPI flows in India. Further we explore the causal relationship between Foreign Portfolio Investment inflows and Stock market returns. For this purpose, the data is collected from 1 st January 2001 to 31 st December 2016. The study also examines the effect of Foreign Portfolio Investment on Stock market Volatility using GARCH Model of conditional volatility. Keywords: Foreign Portfolio Investment, Indian Capital Market, Stock Market Volatility, GARCH INTRODUCTION TO FOREIGN PORTFOLIO INVESTMENT IN INDIA: AN OVERVIEW Foreign Portfolio Investment has been playing a significant role in developing the financial market of the country. Since there was a problem of scarcity of capital in India and domestic sources to raise finance were also limited, certain measures were taken by Indian Government in order to attract the foreign investors to make investment in India. Indian stock markets were opened to foreign investors in September 1992 and they were allowed to invest in primary and secondary markets. The major portion of FPIs has gone through equities. Since then, capital flow through Foreign Direct Investment and Foreign Portfolio Investment (FPIs) has played a significant role in the growth of Capital market and the Indian economy. Foreign Investment means the flow of capital from one country to another country especially the scarce economy. Foreign Portfolio Investment basically means that, the companies which are established outside India are investing in the Indian stock market. To make investments in India, the investors should get registered with Securities and Exchange Board of India (SEBI), the regulator for Indian Capital Markets. Foreign Portfolio Investors have the foreign based categories that can be registered for FPI such as Pension Funds, Mutual Funds, Investment Trust, Insurance and Reinsurance Companies, Banks, Endowments, University Funds, Foundations, Charitable Trusts or Charitable Societies, Asset Management Companies and Trustees.
Transcript of GIS Business - irgu.unigoa.ac.in

GIS Business
ISSN: 1430-3663
Vol-15-Issue-5-May -2020
P a g e | 156 Copyright ⓒ 2020Authors
Impact of Foreign Portfolio Investments (FPIs) on Indian Stock Market
Dr Pournima Dhume
(Assistant Professor, Goa Business School, Faculty Block F, Goa University, Taleigao Plateau, Taleigao-
Goa, 403206, Contact: 9923958235, Email: [email protected])
&
Ms Ankita Naik
(M.Com. Student, Goa Business School, Faculty Block F, Goa University, Taleigao Plateau, Taleigao-Goa,
403206)
ABSTRACT
Foreign Portfolio Investments (FPIs) has been playing a significant role in developing the financial market of the
country. Indian stock markets were opened to foreign investors in September 1992 and were allowed to invest in the primary and secondary market. The major portion of FPIs has been into equities. India is now the most favourite
destination for FPI investors due to the increasing growth of economy. Foreign Portfolio Investment inflows were in
large volume during the year 2015. In this paper, we identify the determinants, trends and pattern of Foreign Portfolio Investments in India and examine the relationship between the determinants and FPI flows in India. Further we
explore the causal relationship between Foreign Portfolio Investment inflows and Stock market returns. For this
purpose, the data is collected from 1st January 2001 to 31
st December 2016. The study also examines the effect of
Foreign Portfolio Investment on Stock market Volatility using GARCH Model of conditional volatility.
Keywords: Foreign Portfolio Investment, Indian Capital Market, Stock Market Volatility, GARCH
INTRODUCTION TO FOREIGN PORTFOLIO INVESTMENT IN INDIA: AN OVERVIEW
Foreign Portfolio Investment has been playing a significant role in developing the financial market of the country.
Since there was a problem of scarcity of capital in India and domestic sources to raise finance were also limited, certain measures were taken by Indian Government in order to attract the foreign investors to make investment in
India. Indian stock markets were opened to foreign investors in September 1992 and they were allowed to invest in
primary and secondary markets. The major portion of FPIs has gone through equities. Since then, capital flow through Foreign Direct Investment and Foreign Portfolio Investment (FPIs) has played a significant role in the growth of
Capital market and the Indian economy. Foreign Investment means the flow of capital from one country to another
country especially the scarce economy. Foreign Portfolio Investment basically means that, the companies which are
established outside India are investing in the Indian stock market. To make investments in India, the investors should get registered with Securities and Exchange Board of India (SEBI), the regulator for Indian Capital Markets. Foreign
Portfolio Investors have the foreign based categories that can be registered for FPI such as Pension Funds, Mutual
Funds, Investment Trust, Insurance and Reinsurance Companies, Banks, Endowments, University Funds, Foundations, Charitable Trusts or Charitable Societies, Asset Management Companies and Trustees.
GIS Business
ISSN: 1430-3663
Vol-15-Issue-5-May -2020
P a g e | 157 Copyright ⓒ 2020Authors
Foreign Institutional Investment (FII) was recently re-nomenclated as Foreign Portfolio Investment (FPI) by making the registration process with SEBI more easier and simpler and existing three investor’s classes were combined viz.,
FIIs, Sub accounts and Qualified Foreign Investors (QFIs). The Portfolio investor registered in accordance with SEBI
guidelines shall be called Registered Foreign Portfolio Investor (RFPI). RFPI may purchase and sell shares and convertible debentures of Indian companies through registered broker or recognized Stock Exchange in India as well
as which are offered to public in terms of relevant SEBI guidelines. Foreign Portfolio Investment (FPI) values are
usually taken from the Net Investment made by FPIs that is, the difference between Gross Purchases and Gross Sales (Net Investment = Gross Purchases – Gross Sales). The FPI values include both the equity as well as debt segment of
the Indian Capital Markets. FPI investments are volatile in nature; these investors prefer to invest in emerging
markets, those which have potential to grow in near future. The emerging markets benefit from FPIs inflows in terms
of mobilization of domestic resources, reduction in the cost of capital due to inflow of foreign funds thereby development of Indian Capital Markets and overall Indian Economy.
According to conducted poll by Bank of America Merrill Lynch (BofA-ML), in the year 2015 India was the most preferred equity market for foreign investors. FPIs net investment stood at $ 2.68 Billion in March 2016. Cumulative
value of investment by FPIs during April 2000- December2015 stood at US $ 179.32 Billion. Till 2013, Mauritius
was the largest source of FPI into country, followed by United States in the year 2014. The FPI inflows in the year 2014 touched to $10 Billion. In November 2016, foreign investors pulled out nearly $ 5 Billion from Indian market
due to Demonetization of Indian Currency (Rupee) by the Indian Government. United states of America contribute
31% of FPI investment followed by Mauritius which is about 21%. After Mauritius, number of FPIs is from
Singapore i.e. 11%, Europe is about 15% (Luxembourg 8%, UK 4%, Norway 3%) and United Arab Emirates contributing 3% which causes volatility in Indian stock market. Number of FPI inflows from Ireland, Japan and
Canada is about 2%, 2% & 2%, which also causes volatility in Indian stock market.
LITERATURE REVIEW
(Joo and Mir, 2014) examines the impact of FIIs on volatility of Indian stock market on a monthly data set for the period from January 1999 to December 2013. ADF unit root test correlation GARCH model have been used. The
study reveals there is moderate low positive correlation between Net FII & Indian stock markets. So results suggest
that there is impact of FIIs on Indian stock market. (Amita, 2014) identified the determinants of FII and showed the
relationship between the variables namely FII, Foreign exchange rate, BSE Sensex, exchange rate and inflation. The study was conducted for 12 years between 2001-02 to 2012-13 on monthly basis by using Correlation coefficient,
ADF unit root test and Granger causality. The study concluded that there is bi-directional causality between FII and
Sensex; and FII & Exchange rate has no causality between FII and Foreign exchange reserve. (Saxena and
Bhadauria, 2011) investigates causal relationship between FII inflows and stock market returns. The study concluded
that, there is no bidirectional causal relationship between FII inflows and stock market returns. The study finds that
stock market volatility is cause to FII inflows and the trend of FII inflows does not have much impact on stock market volatility. (Jain et al, 2013) shows the effect of FII flow on capital market and examines the causal relationship
between FII flows & capital market growth using Granger causality test and co-integration test for a period of 2000-
2013. The study indicates that FII and Nifty did not have any causal relationship with each other. (Chakrabarti R. ,
2001) observed the causal linkage between FII flows and stock returns. The paper divides sample period into pre-Asian crisis from May 1993 – June 1997 and the Asian crisis from July 1997 to December 1999. The result
demonstrates that in post- Asian crisis period there is no impact of FII on Indian stock market returns. (Shrivastav,
2013) attempted to find out relationship between FII and Indian stock market for the year 2001-2010. The study uses correlation and regression technique to check whether relation exist between them. The study observed that there is
GIS Business
ISSN: 1430-3663
Vol-15-Issue-5-May -2020
P a g e | 158 Copyright ⓒ 2020Authors
correlation between FII and movement of Sensex and FIIs significantly influences movement of Sensex. (Loomba, 2012) examined the effect of FIIs on Indian stock market volatility using daily data. The study was conducted for
period of 10 years that is from January 2001-December 2011. Pearsons correlation were used as technique and found
that there is significant relation between BSE Sensex & FII in Indian stock market. (Arora and Kumar, 2015) In their study they analyzed the relationship between FII flows and Indian capital market. Using the methods of ADF
unit root test, GARCH model, they found that there is no significant changes in Indian capital market return and after
opening market to foreign investors the volatility were reduced. (Kulshrestra, 2014) The research explores determinants of FIIs in India and also finds impact of FII on Indian capital market by using regression and correlation
techniques. The period of study was 2000-2011 with 2931 observation of FII. The study states that FII investment and
movement of BSE Sensex & CNX nifty are closely correlated and FIIs have impact on Indian capital market.
(Sundari and Shareef, 2015) This study shows the impact of FII on stock market in India for the period from 2000 to 2013, ADF unit root test, Johansen co integration and Granger causality test is used to investigate relation between FII
and NIFTY in India. The result of cointegration test states a long run relation between variable and Granger causality
reveals no relation between the variables. (Kumar, 2014) This paper show the effect of FII investment in Indian capital market by considering FII activity in Nifty index futures trading on NSE and Singapore exchange VAR
framework and Granger causality test were used, so result was FII investment are statistically related with Nifty
returns. (Walia et al, 2012) The paper analyses behavioral pattern of FII and examines the changes in Sensex due to FII flows. The period of study was 2001 to 2010 by using Karl Pearson’s coefficient of correlation test. The
conclusion was, there is volatility in Sensex due to FII inflows to a great extent. Based on the review of literature we
formulate the following objectives of the study.
OBJECTIVES OF THE STUDY
1. To study determinants, trends and pattern of Foreign Portfolio Investments in India and to examine the relationship between the determinants and FPI flows in India.
2. To explore the causal relationship between Foreign Portfolio Investment inflows and Stock market returns.
3. To examine the effect of Foreign Portfolio Investment on Stock market Volatility.
RESEARCH METHODOLOGY
Period of the Study: The study is undertaken for a period of 16 years from 1st January 2001 to 31
st December 2016.
Data sources: The study is based on Secondary data for analysis. The monthly data on Foreign Portfolio Investment
is collected from SEBI website (www.sebi.gov.in) up to April 2014 & from June 2014 onwards the data is available on NSDL website (www.nsdl.co.in). The monthly data on Nifty 50, Nifty Bank, Nifty Pharma, Nifty IT and Nifty
FMCG is collected from NSE website (www.nseindia.com).
Sample size: The study considers selected Sectoral indices and the variables are as follows

GIS Business
ISSN: 1430-3663
Vol-15-Issue-5-May -2020
P a g e | 159 Copyright ⓒ 2020Authors
TABLE 1: SAMPLE SIZE
Period of The Study Observations
Dependent variables
Nifty 50 1 Jan’01- Dec’16 192
Nifty Bank 1 Jan’01- Dec’16 192
Nifty Pharma 1 Jan’01- Dec’16 192
Nifty IT 1 Jan’01- Dec’16 192
Nifty FMCG 1 Jan’01- Dec’16 192
Independent variable
Foreign Portfolio Investment 1 Jan’01- Dec’16 192
Statistical Tools and Techniques used:
Descriptive Statistics and Multiple Regression: Descriptive Statistics helps us to present the data in more meaningful manner. Mean, Standard Deviation, Skewness, Kurtosis, Jarque Bera tests has been used to analyze determinants and
variables taken for the study. Regression analysis has been used to measure the determinants of FPI that attracts the
FPI inflows in India. FPI inflows were considered as Dependent Variable and Determinants were considered as Independent Variable. Correlation: This test is used to show whether there is Correlation existing between FPI
inflows and Determinants of FPI. Unit root analysis (Augmented Dickey Fuller): The study uses Unit root test to
check whether data series of variables that is, FPI inflows and Stock market indices are stationary or not. Co-
integration and Granger Causality: Co-integration test is used to check whether two variables that is, FPI inflows and Nifty 50 & Sectoral indices have long term relationship between them. Johansen Co-integration test is used in the
study. Granger Causality test examines to determine whether one variable is useful to predict the other variable. In
other words, it checks the causal relationship between above mentioned variables. Vector Error Correction Model: is used when Co-integrated equation is detected between the variables which mean there is long term relationship
between them. Therefore we use VECM to analyze the short term properties of co-integrated series. If the coefficient
of VECM is negative and significant than there will be long run relationship between independent and dependent
variable if there are any short run fluctuations in variables. GARCH Model: Generalized Autoregressive Conditional Heteroskedasticity model is used to determine the nature of Conditional Volatility.
The conditional variance equation can be written as a function of three terms:
A constant term (α).
ARCH term (RESt-1): news about volatility from the past period which is measured as lag of squared residuals.
The GARCH term: last period forecast variance.
DETERMINANTS OF FOREIGN PORTFOLIO INVESTMENT IN INDIA
When India opened its door for foreign portfolio investors, portfolio flows in Indian market was the major source of
capital for India. This led to economic growth of the country and growth of Indian capital market in particular. This
study examines the determinants which influence the FPI inflows in India. As evidenced by previous studies that there

GIS Business
ISSN: 1430-3663
Vol-15-Issue-5-May -2020
P a g e | 160 Copyright ⓒ 2020Authors
is a relationship between the FPI inflows and determinants like Foreign exchange rates, Inflation, etc. These determinants are as follows-
1. Inflation: Inflation refers to country’s internal stability. Increased instability of Inflation rate makes the economy unattractive to make investment. The high return also declines the real return of fixed income securities like bonds.
2. Exchange rate: Large fluctuations in exchange rate decrease the inflows of FPI and increase the uncertainty in the
economy of the host country. In emerging countries the exchange rate fluctuations brings restrictions on the inflows of FPI.
3. Gross Domestic Product: it is the indicators of economy activities. By using GDP growth rate, economic growth
can be measured. If there is increase in host country of GDP it decreases the volatility of GDP.
4. Interest rate: when interest rate rises, cost of borrowing increases so it has negative impact on their profits. So the investors may delay the investment activity to later period, when the interest rate are decreased so to reduce their
cost of investment.
For the purpose of data analysis, Foreign portfolio investment is used as a Dependent variable and Bank rate,
Exchange rate, Gross domestic product and Wholesale price index is used as an independent variable.
𝑙𝐹𝑃𝐼 = 𝛽0 + 𝛽1𝐵𝑅 + 𝛽2𝐸𝑅 + 𝛽3𝐺𝐷𝑃 + 𝛽4𝑊𝑃𝐼
Where, BR= Bank Rate, ER= Exchange Rate, GDP= Gross Domestic Product, WPI= Whole Price Index
TABLE 2: CORRELATION CO-EFFICIENT MATRIX BETWEEN NET FPI FLOWS AND
DETERMINANTS OF FPI
BANK RATE EXCHANGE
RATE GDP FPI WPI
BANK RATE 1.000000
EXCHANGE RATE 0.749401
1.000000
GDP 0.224762
0.184683
1.000000
FPI 0.353050
0.100983
0.189153
1.000000
WPI -0.351360
-0.284856
-0.042489
-0.064187
1.000000
Table 2 displays correlation coefficient between Foreign Portfolio Investment inflows and Determinants of FPI viz.,
Bank rate, Exchange rate, GDP and WPI. There exists a positive correlation between Bank rate and Exchange rate. In
case of GDP and Bank rate, there is low degree of positive correlation. There is correlation between Bank rate and FPI inflows (0.35%). It implies that if Bank rate increases, it is likely to attract more FPI inflows in India. The degree
of correlation between Bank rate and WPI has been found to be negative which means that increase in Bank rate will
bring decline in WPI by 0.35%. There is no correlation between exchange rate and GDP. Further it displays that, there exist a negative relationship between Exchange rate and WPI (0.28%). It implies that increase in Exchange rate will
GIS Business
ISSN: 1430-3663
Vol-15-Issue-5-May -2020
P a g e | 161 Copyright ⓒ 2020Authors
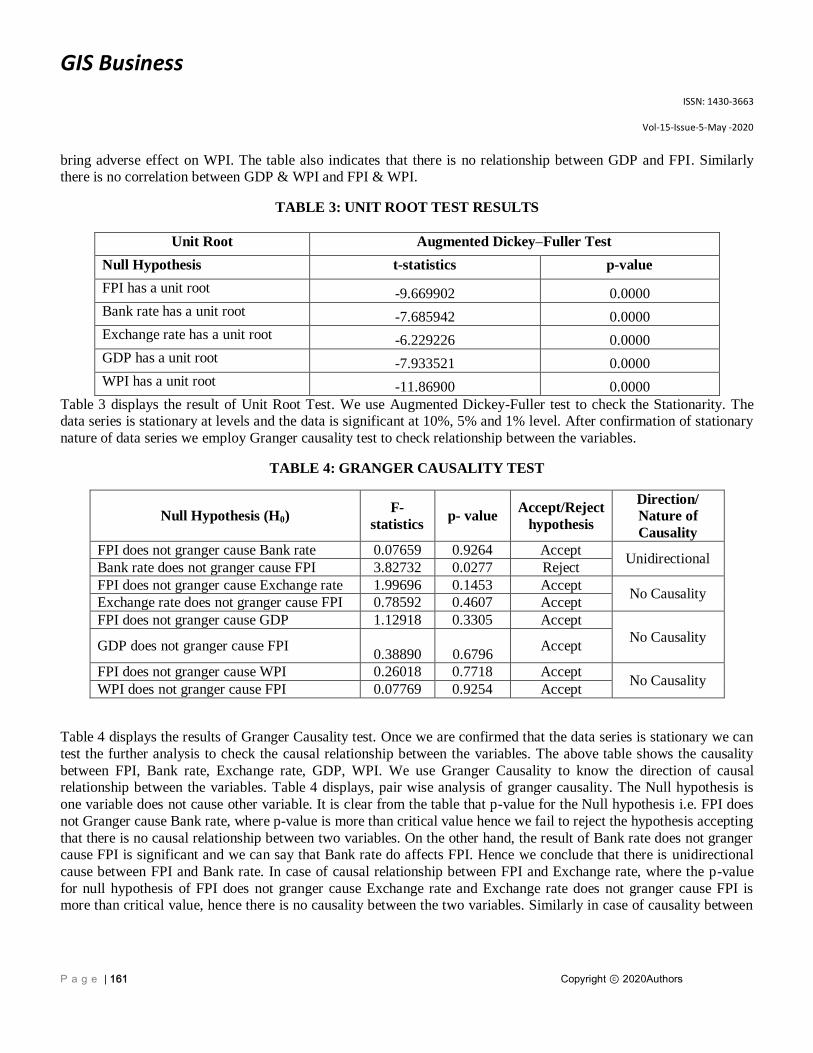
bring adverse effect on WPI. The table also indicates that there is no relationship between GDP and FPI. Similarly there is no correlation between GDP & WPI and FPI & WPI.
TABLE 3: UNIT ROOT TEST RESULTS
Unit Root Augmented Dickey–Fuller Test
Null Hypothesis t-statistics p-value
FPI has a unit root -9.669902 0.0000
Bank rate has a unit root -7.685942 0.0000
Exchange rate has a unit root -6.229226 0.0000
GDP has a unit root -7.933521 0.0000
WPI has a unit root -11.86900 0.0000
Table 3 displays the result of Unit Root Test. We use Augmented Dickey-Fuller test to check the Stationarity. The data series is stationary at levels and the data is significant at 10%, 5% and 1% level. After confirmation of stationary
nature of data series we employ Granger causality test to check relationship between the variables.
TABLE 4: GRANGER CAUSALITY TEST
Null Hypothesis (H0) F-
statistics p- value
Accept/Reject
hypothesis
Direction/
Nature of
Causality
FPI does not granger cause Bank rate 0.07659 0.9264 Accept Unidirectional
Bank rate does not granger cause FPI 3.82732 0.0277 Reject
FPI does not granger cause Exchange rate 1.99696 0.1453 Accept No Causality
Exchange rate does not granger cause FPI 0.78592 0.4607 Accept
FPI does not granger cause GDP 1.12918 0.3305 Accept
No Causality GDP does not granger cause FPI
0.38890
0.6796 Accept
FPI does not granger cause WPI 0.26018 0.7718 Accept No Causality
WPI does not granger cause FPI 0.07769 0.9254 Accept
Table 4 displays the results of Granger Causality test. Once we are confirmed that the data series is stationary we can
test the further analysis to check the causal relationship between the variables. The above table shows the causality
between FPI, Bank rate, Exchange rate, GDP, WPI. We use Granger Causality to know the direction of causal relationship between the variables. Table 4 displays, pair wise analysis of granger causality. The Null hypothesis is
one variable does not cause other variable. It is clear from the table that p-value for the Null hypothesis i.e. FPI does
not Granger cause Bank rate, where p-value is more than critical value hence we fail to reject the hypothesis accepting
that there is no causal relationship between two variables. On the other hand, the result of Bank rate does not granger cause FPI is significant and we can say that Bank rate do affects FPI. Hence we conclude that there is unidirectional
cause between FPI and Bank rate. In case of causal relationship between FPI and Exchange rate, where the p-value
for null hypothesis of FPI does not granger cause Exchange rate and Exchange rate does not granger cause FPI is more than critical value, hence there is no causality between the two variables. Similarly in case of causality between

GIS Business
ISSN: 1430-3663
Vol-15-Issue-5-May -2020
P a g e | 162 Copyright ⓒ 2020Authors
FPI and GDP, The Null hypothesis for both the direction of variables p-value is more than critical value so we conclude that there is no causality between the variables. In case of FPI and WPI, the p-value for null hypothesis for
FPI does not granger cause WPI and WPI does not granger cause FPI is more than critical values so we accept the
null hypothesis concluding that neither FPI granger cause WPI nor WPI granger cause FPI so there is no causality between variables.
TRENDS AND PATTERNS OF FPI AND SECTORAL INDICES OF NSE
FIGURE 1: YEARLY TREND OF FPI FLOW
Source: SEBI
As shown in Figure 1, there is variation in the FII inflows for the period of 16 years, i.e. 2001-2016. The net
investment has risen from Rs. 12,494.8 crores in the year 2001 to Rs. 2, 56,213 crores in 2014 with ups and downs in
the inflows during the period. For the period of 16 years there has been increase in most of the years, i.e. 12 years,
while decrease in rest of the years. Therefore, it can be concluded that there were variations in the inflows of FPI into Indian Stock Market.
FIGURE 2: SECTORAL INVESTMENT BY FPI
Source: NSE fact book 2016
-100000
-50000
0
50000
100000
150000
200000
250000
300000
2001
2002
2003
2004
2005
2006
2007
2008
2009
2010
2011
2012
2013
2014
2015
2016
Bank13%
Engineering3%
Financial Services
15%
FMCG8% Infrastructure
9%
IT10%
Manufacturing6%
Media & Entertainment
7%
Pharmaceuticals
10%
Telecommunication10%
Others9%

GIS Business
ISSN: 1430-3663
Vol-15-Issue-5-May -2020
P a g e | 163 Copyright ⓒ 2020Authors
Figure 2 exhibits the FPI inflows into Indian stock market (National Stock Exchange). It can be seen from above; the major portion of Foreign Portfolio Investment is into Financial Services followed by Bank and IT. It can be concluded
that India is favorite destination of FPI in Indian Stock Market.
Descriptive Statistics
TABLE 5: DESCRIPTIVE STATISTICS
Variables Obs Mean Std.Dev Skewness Kurtosis Jarque-
Bera Prob.
Foreign Portfolio
Investment
191 5475.329 12230.30 -0.126654 4.875349 28.49958 0.000001
Nifty 50 191 4345.382 2397.725 0.138054 1.901360 10.21249 0.006059
Nifty Bank 191 7995.816 5536.768 0.478074 2.173224 12.71566 0.001733
Nifty IT 191 8816.693 5719.682 1.271527 4.741478 75.60312 0.000000
Nifty Pharma 191 4477.807 3522.760 1.086568 2.962937 37.59432 0.000000
Nifty FMCG 191 8850.829 6575.729 0.722281 2.021185 24.23185 0.000005
Table 5 exhibits the descriptive statistic for FPI inflows affecting NSE Sectoral indices, namely Nifty50, Nifty Bank, Nifty IT, Nifty Pharma and Nifty FMCG. It can be seen that Nifty FMCG has highest mean and the standard
deviation is highest in case of FPI followed by Nifty FMCG and Nifty IT. This means there is wide range of
fluctuations in FPI inflows in India. Whereas, Nifty-50 shows lowest standard deviation among the variables which
indicates less fluctuations of Nifty50 returns.The data is said to be normal if skewness is ‘zero’, therefore in above table, the data of FPI, Nifty50 and Nifty Bank are fairly symmetrical. In case of Nifty FMCG the data is moderately
skewed and Nifty IT and Nifty Pharma are highly skewed where the data is not normal. The data is said to be normal
if Kurtosis has value 3, so Nifty Pharma is said to be normally distributed. The data distribution of FPI and Nifty IT is called Leptokurtic since value is greater than 3 and Nifty50, Nifty bank and Nifty FMCG is called Platykurtic since
value is less than 3. The Hypothesis of Jarque Bera test is normally distributed, since the data is significant for all
variables we reject the hypothesis concluding data is not normally distributed.
GIS Business
ISSN: 1430-3663
Vol-15-Issue-5-May -2020
P a g e | 164 Copyright ⓒ 2020Authors
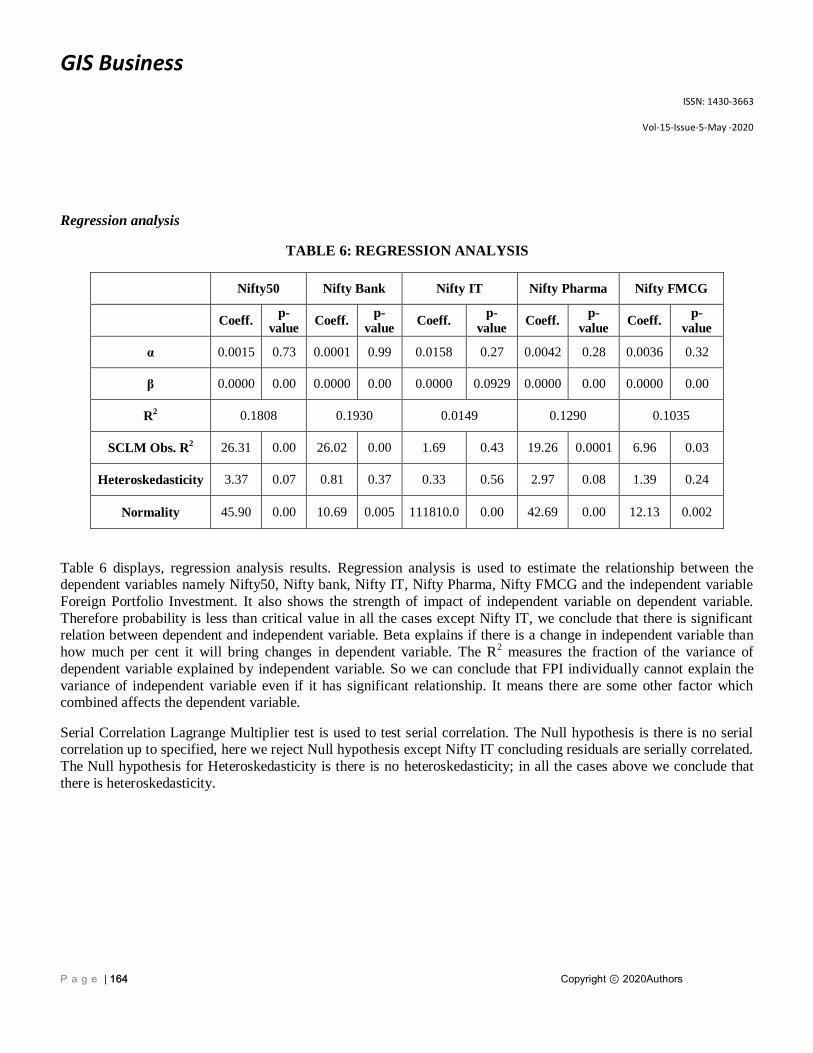
Regression analysis
TABLE 6: REGRESSION ANALYSIS
Nifty50 Nifty Bank Nifty IT Nifty Pharma Nifty FMCG
Coeff. p-
value Coeff.
p-
value Coeff.
p-
value Coeff.
p-
value Coeff.
p-
value
α 0.0015 0.73 0.0001 0.99 0.0158 0.27 0.0042 0.28 0.0036 0.32
β 0.0000 0.00 0.0000 0.00 0.0000 0.0929 0.0000 0.00 0.0000 0.00
R2 0.1808 0.1930 0.0149 0.1290 0.1035
SCLM Obs. R2 26.31 0.00 26.02 0.00 1.69 0.43 19.26 0.0001 6.96 0.03
Heteroskedasticity 3.37 0.07 0.81 0.37 0.33 0.56 2.97 0.08 1.39 0.24
Normality 45.90 0.00 10.69 0.005 111810.0 0.00 42.69 0.00 12.13 0.002
Table 6 displays, regression analysis results. Regression analysis is used to estimate the relationship between the dependent variables namely Nifty50, Nifty bank, Nifty IT, Nifty Pharma, Nifty FMCG and the independent variable
Foreign Portfolio Investment. It also shows the strength of impact of independent variable on dependent variable.
Therefore probability is less than critical value in all the cases except Nifty IT, we conclude that there is significant relation between dependent and independent variable. Beta explains if there is a change in independent variable than
how much per cent it will bring changes in dependent variable. The R2 measures the fraction of the variance of
dependent variable explained by independent variable. So we can conclude that FPI individually cannot explain the
variance of independent variable even if it has significant relationship. It means there are some other factor which combined affects the dependent variable.
Serial Correlation Lagrange Multiplier test is used to test serial correlation. The Null hypothesis is there is no serial correlation up to specified, here we reject Null hypothesis except Nifty IT concluding residuals are serially correlated.
The Null hypothesis for Heteroskedasticity is there is no heteroskedasticity; in all the cases above we conclude that
there is heteroskedasticity.
GIS Business
ISSN: 1430-3663
Vol-15-Issue-5-May -2020
P a g e | 165 Copyright ⓒ 2020Authors
TABLE 7: UNIT ROOT TEST RESULTS
Unit Root Augmented Dickey–Fuller Test
Null Hypothesis t-statistics p-value
FPI has a unit root -8.399972 0.0000
Nifty-50 has a unit root -9.932850 0.0000
Nifty Bank has a unit root -10.07360 0.0000
Nifty IT has a unit root -12.50519 0.0000
Nifty FMCG has a unit root -11.64985 0.0000
Nifty Pharma has a unit root -10.25852 0.0000
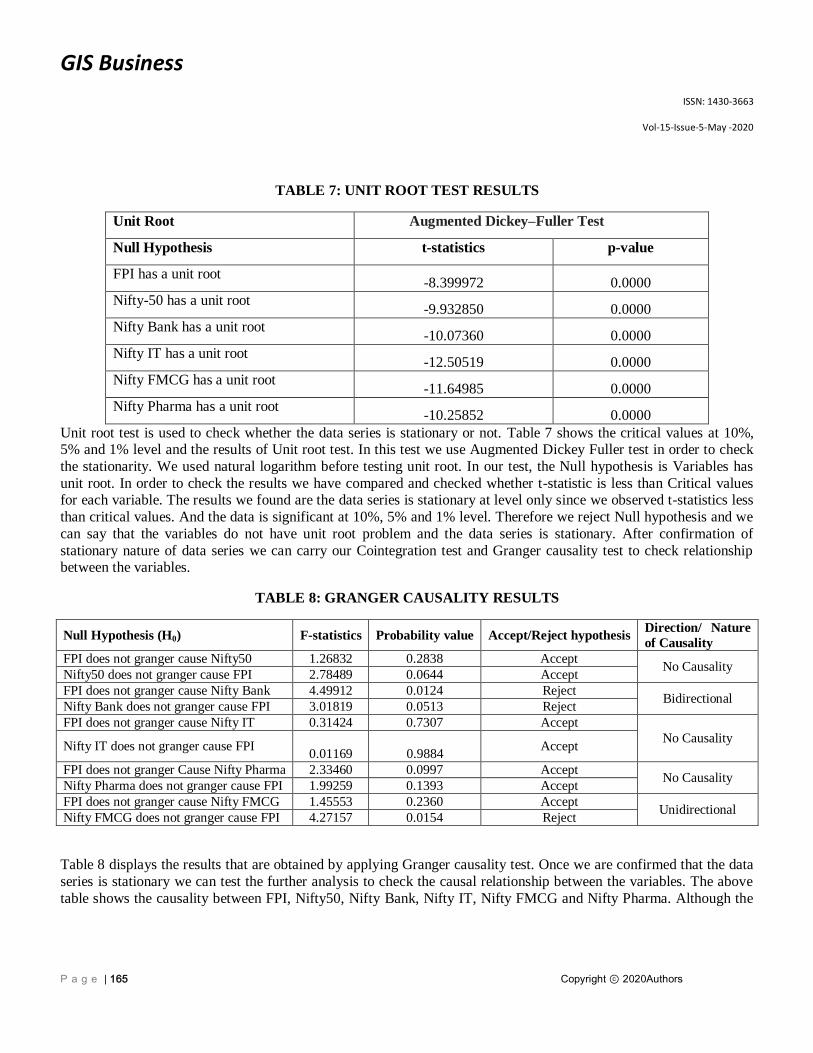
Unit root test is used to check whether the data series is stationary or not. Table 7 shows the critical values at 10%, 5% and 1% level and the results of Unit root test. In this test we use Augmented Dickey Fuller test in order to check
the stationarity. We used natural logarithm before testing unit root. In our test, the Null hypothesis is Variables has
unit root. In order to check the results we have compared and checked whether t-statistic is less than Critical values for each variable. The results we found are the data series is stationary at level only since we observed t-statistics less
than critical values. And the data is significant at 10%, 5% and 1% level. Therefore we reject Null hypothesis and we
can say that the variables do not have unit root problem and the data series is stationary. After confirmation of
stationary nature of data series we can carry our Cointegration test and Granger causality test to check relationship between the variables.
TABLE 8: GRANGER CAUSALITY RESULTS
Null Hypothesis (H0) F-statistics Probability value Accept/Reject hypothesis Direction/ Nature
of Causality
FPI does not granger cause Nifty50 1.26832 0.2838 Accept No Causality
Nifty50 does not granger cause FPI 2.78489 0.0644 Accept
FPI does not granger cause Nifty Bank 4.49912 0.0124 Reject Bidirectional
Nifty Bank does not granger cause FPI 3.01819 0.0513 Reject
FPI does not granger cause Nifty IT 0.31424 0.7307 Accept
No Causality Nifty IT does not granger cause FPI
0.01169
0.9884 Accept
FPI does not granger Cause Nifty Pharma 2.33460 0.0997 Accept No Causality
Nifty Pharma does not granger cause FPI 1.99259 0.1393 Accept
FPI does not granger cause Nifty FMCG 1.45553 0.2360 Accept Unidirectional
Nifty FMCG does not granger cause FPI 4.27157 0.0154 Reject
Table 8 displays the results that are obtained by applying Granger causality test. Once we are confirmed that the data
series is stationary we can test the further analysis to check the causal relationship between the variables. The above
table shows the causality between FPI, Nifty50, Nifty Bank, Nifty IT, Nifty FMCG and Nifty Pharma. Although the

GIS Business
ISSN: 1430-3663
Vol-15-Issue-5-May -2020
P a g e | 166 Copyright ⓒ 2020Authors
Cointegration test used further examines the long term relationship between the variables but it does not specify the direction of Causal relation. Therefore to know the direction of causal relationship between the variables, Granger
Causality test is used.
In the above table, pair wise analysis of granger causality is shown. The Null hypothesis is one variable does not
cause other variable. It is clear from the table that p-value for the Null hypothesis i.e. FPI does not Granger cause
Nifty 50, where p-value is more than critical value hence we fails to reject the hypothesis concluding there is no causal relationship between two variables. Whereas, the result of Nifty50 does not granger cause FPI is insignificant
and we can say that nifty50 does not granger cause FPI. Hence we conclude that neither FPI granger cause Nifty50
nor Nifty50 granger cause FPI so there is no causality between variables.
Further, p-value for Null hypothesis of FPI does not granger cause Nifty Bank is less than critical value, similarly p-
value for Null hypothesis of Nifty bank does not granger cause FPI is less than critical value, therefore both the Null
hypothesis is rejected concluding FPI as well as Nifty Bank affects each other. Hence there is Bidirectional causality between variables. In case of causal relationship between FPI and Nifty IT, where the p-value for null hypothesis of
FPI does not granger cause Nifty IT and Nifty IT does not granger cause FPI is more than critical value, hence there is
no causality between the two variables. Similarly in case of causality between FPI and Nifty Pharma, p-value is more than critical value so we conclude that there is no causality between the variables.
The p-value for Null hypothesis that FPI does not granger cause Nifty FMCG is more than critical value therefore we fail to reject the Null hypothesis and concludes FPI does not granger cause Nifty FMCG. For next Null hypothesis
that is Nifty FMCG does not granger cause FPI is less than critical value, hence we reject the Null hypothesis
concluding Nifty FMCG affects FPI and there is Unidirectional causality between two variables.
TABLE 9: JOHANSEN COINTEGRATION TEST RESULTS
Hypothesized
No. of CE(s)
Trace Max-Eigen
Trace statistics p-value Max-Eigen
statistics p-value
None * 99.76745 0.0257* 44.03600 0.0170*
At most 1 55.73145 0.3888 25.46223 0.3544
At most 2 30.26922 0.7052 13.72819 0.8409
At most 3 16.54103 0.6737 10.96052 0.6513
At most 4 5.580504 0.7444 5.281850 0.7059
At most 5 0.298654 0.5847 0.298654 0.5847
Trace test & Max-Eigen indicates 1 cointegrating eqn(s) at the 0.05 level
* denotes rejection of the hypothesis at the 0.05 level Cointegration test is used to examine the long term relationship between the variables. Cointegration means that even
if the time series data individually being non stationary but linear combination of more time series can be stationary.

GIS Business
ISSN: 1430-3663
Vol-15-Issue-5-May -2020
P a g e | 167 Copyright ⓒ 2020Authors
Therefore we use Johansen Cointegration test to check long term relationship. Table 9 reveals the results for testing number of cointegrating relations. Two types of test statistics are reported namely Trace statistics and Maximum
Eigen value statistics, which reveal long run relation, exist between FPI and NSE sectoral indices.
In the above study, we reject the null hypothesis at 5% level and we accept that there is cointegrating equation. The
result indicates that there is 1 cointegrating equation between variables. But if we fail to reject Null hypothesis it
means that there is no Cointegrating variables in equation. Since we found at least one cointegrating equation between the variables we use Vector Error Correction Model.
Vector Error Correction Model
Vector Error Correction Model is used after it is confirmed the existence of long term relationship among the
variables and have at least one cointegrating equation. VECM explains the short run adjustments of cointegrated
variables towards their equilibrium values.
Equation 1-
Dependent variable- Nifty50, Independent variable- FPI
∆lnNifty50 = 0.0003C- 0.0034EC -0.0058∆lFPIt-1 +0.0228*∆LFPIt-2 -0.3620*∆LnNIFTY50t-1
(0.0041) (0.0198) (0.0165) (0.01221) (0.0667)
-0.4935*∆LnNIFTY50t-2
(0.0656)
The above equation shows the vector error correction model for Nifty50 as dependent variable and FPI as
independent variable. The term {-0.0034EC} helps to determine the speed of correction within the variables. The
coefficient of Error correction term of Nifty50 is negative but insignificant which suggests that even if long run relation exists, the relation cannot be explained by VECM. That means it shows the independent relation between the
variables. The other variables which are significant are to be tested by using Wald test to examine the joint short run
impact of variables on dependent variable.
Wald test
The table shows the test of joint significance of variables using Wald test.
H0: There is no significant impact of variables jointly on the NSE Sectoral Indices
H1: There is significant impact of variables jointly on the NSE Sectoral Indices

GIS Business
ISSN: 1430-3663
Vol-15-Issue-5-May -2020
P a g e | 168 Copyright ⓒ 2020Authors
TABLE 10: WALD TEST
Test statistics Value Df Probability
F-statistic 33.29862 (2, 182) 0.0000
Three variables are significant based on the VECM equation namely ∆LFPIt-2, ∆LnNIFTY50t-1 and ∆LnNIFTY50t-2. The probability value of F-statistic is less than 0.05; so we reject the Null hypothesis and we accept the impact of the
variables jointly on the dependent in short run.
Equation 2-
Dependent variable- Nifty Bank, Independent variable- FPI
∆LnNiftyBank = -0.0001C +0.0767EC -0.0482∆LFPIt-1 +0.0149∆LFPIt-2
(0.0055) (0.0250) (0.0215) (0.0161)
-0.2019∆LnNiftyBankt-1 -0.4125∆LnNiftyBankt-2
(0.0741) (0.0686)
The above equation shows the vector error correction model for Nifty Bank as dependent variable and FPI as
independent variable. The term {+0.0767EC} helps to determine the speed of correction within the variables. The
coefficient of Error correction term of Nifty Bank is positive but significant which suggests that even long run relation exist, the error correction is not happening by testing VECM. The other variables which are significant are to be
tested by using Wald test to examine the joint short run impact of variables on dependent variable.
Wald test
The table shows the test of joint significance of variables using Wald test.
TABLE 11: WALD TEST
Test statistics Value Df Probability
F-statistic 11.31476 (2, 182) 0.0000
Three variables are significant based on the VECM equation namely LFPIt-1, ∆LnNiftyBankt-1 and ∆LnNiftyBankt-2.
The probability value of F-statistic is less than 0.05; so we reject the Null hypothesis and we accept the impact of the
variables jointly on the dependent in short run.
Equation 3-
Dependent variable- Nifty Pharma, Independent variable- FPI
∆lnNiftyPharma= 0.0001C+ 0.0574EC -0.0463∆lFPIt-1 -0.0051*∆LFPIt-2 –

GIS Business
ISSN: 1430-3663
Vol-15-Issue-5-May -2020
P a g e | 169 Copyright ⓒ 2020Authors
(0.0038) (0.0143) (0.0133) (0.0106)
0.1936∆LnNiftyPharmat-1 -0.2791∆LnNiftyPharmat-2
(0.0782) (0.0712)
The above equation shows the vector error correction model for Nifty Pharma as dependent variable and FPI as independent variable. The term {+0.0574EC} helps to determine the speed of correction within the variables. The
coefficient of Error correction term of Nifty Pharma is positive but significant which suggests that even long run
relation exist, error correction is not happening by using VECM. The other variables which are significant are to be tested by using Wald test to examine the joint short run impact of variables on dependent variable.
Wald test
The table shows the test of joint significance of variables using Wald test.
TABLE 12: WALD TEST
Test statistics Value Df Probability
F-statistic 4.657418 (2, 182) 0.0107
Three variables are significant based on the VECM equation namely LFPIt-1, ∆LnNiftyPharmat-1 and ∆LnNiftyPharmat-2. The probability value of F-statistic is less than 0.05; so we reject the Null hypothesis and we
accept the impact of the variables jointly on the dependent in short run.
Equation 4-
Dependent variable- Nifty FMCG, Independent variable- FPI
∆lnNiftyFMCG= -0.0003C+ 0.0378EC -0.0357∆lFPIt-1 -0.0085*∆LFPIt-2 –
(0.0037) (0.0164) (0.0141) (0.0107)
0.4655∆LnNiftyFMCGt-1 -0.3849∆LnNiftyFMCGt-2
(0.0705) (0.0685)
The above equation shows the vector error correction model for Nifty FMCG as dependent variable and FPI as
independent variable. The term {+0.0378EC} helps to determine the speed of correction within the variables. The
coefficient of Error correction term of Nifty FMCG is positive but significant which suggests that even long run
relation exist, error correction is not happening by using VECM. The other variables which are significant are to be tested by using Wald test to examine the joint short run impact of variables on dependent variable.
Wald test
The table shows the test of joint significance of variables using Wald test.
GIS Business
ISSN: 1430-3663
Vol-15-Issue-5-May -2020
P a g e | 170 Copyright ⓒ 2020Authors
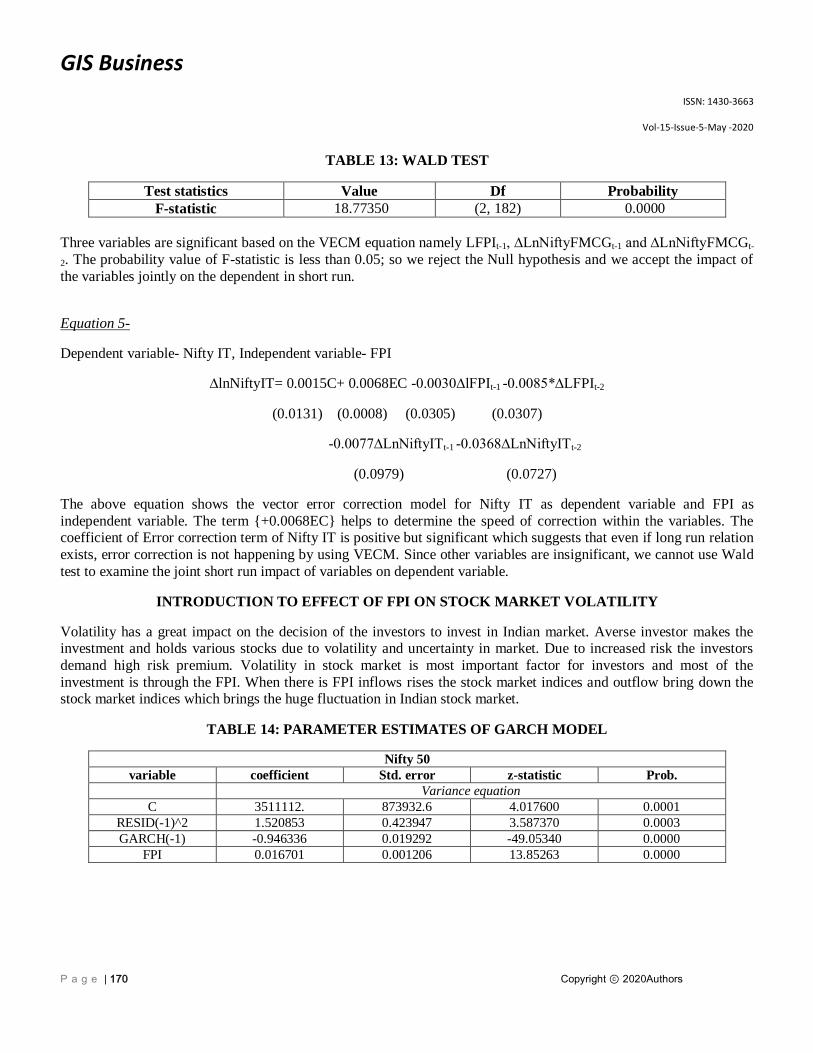
TABLE 13: WALD TEST
Test statistics Value Df Probability
F-statistic 18.77350 (2, 182) 0.0000
Three variables are significant based on the VECM equation namely LFPIt-1, ∆LnNiftyFMCGt-1 and ∆LnNiftyFMCGt-
2. The probability value of F-statistic is less than 0.05; so we reject the Null hypothesis and we accept the impact of
the variables jointly on the dependent in short run.
Equation 5-
Dependent variable- Nifty IT, Independent variable- FPI
∆lnNiftyIT= 0.0015C+ 0.0068EC -0.0030∆lFPIt-1 -0.0085*∆LFPIt-2
(0.0131) (0.0008) (0.0305) (0.0307)
-0.0077∆LnNiftyITt-1 -0.0368∆LnNiftyITt-2
(0.0979) (0.0727)
The above equation shows the vector error correction model for Nifty IT as dependent variable and FPI as
independent variable. The term {+0.0068EC} helps to determine the speed of correction within the variables. The coefficient of Error correction term of Nifty IT is positive but significant which suggests that even if long run relation
exists, error correction is not happening by using VECM. Since other variables are insignificant, we cannot use Wald
test to examine the joint short run impact of variables on dependent variable.
INTRODUCTION TO EFFECT OF FPI ON STOCK MARKET VOLATILITY
Volatility has a great impact on the decision of the investors to invest in Indian market. Averse investor makes the investment and holds various stocks due to volatility and uncertainty in market. Due to increased risk the investors
demand high risk premium. Volatility in stock market is most important factor for investors and most of the
investment is through the FPI. When there is FPI inflows rises the stock market indices and outflow bring down the stock market indices which brings the huge fluctuation in Indian stock market.
TABLE 14: PARAMETER ESTIMATES OF GARCH MODEL
Nifty 50
variable coefficient Std. error z-statistic Prob.
Variance equation
C 3511112. 873932.6 4.017600 0.0001
RESID(-1)^2 1.520853 0.423947 3.587370 0.0003
GARCH(-1) -0.946336 0.019292 -49.05340 0.0000
FPI 0.016701 0.001206 13.85263 0.0000

GIS Business
ISSN: 1430-3663
Vol-15-Issue-5-May -2020
P a g e | 171 Copyright ⓒ 2020Authors
Once we are confirmed with the stationarity of data, we can further analyze GARCH model. The dependent variable is Nifty50 and independent as FPI, where we presented the variance equation. Table 4.1 shows the parameter
estimates of GARCH model. The variance equation gives the one period ahead forecast variance based on past
experience which is called as Conditional variance. The GARCH result show that the GARCH term and FPI is significant, it means that past volatility influences the current volatility and the inflows of FPI are influencing the
volatility of Nifty50 returns. So we can conclude that the Nifty50 volatility is influenced by the past volatility and FPI
inflows.
TABLE 15: PARAMETER ESTIMATES OF GARCH MODEL
Nifty bank
variable coefficient Std. error z-statistic Prob.
Variance equation
C 18818256 5568269. 3.379552 0.0007
RESID(-1)^2 1.358338 0.283189 4.796583 0.0000
GARCH(-1) -1.000801 0.014370 -69.64607 0.0000
FPI 0.027273 0.012436 2.193100 0.0283
Table 15 shows the parameter estimates of GARCH model where we presented variance equation of dependent variable as Nifty bank and independent as FPI. The GARCH results of Nifty bank shows the similar results as shown
in results of Nifty50. The table shows the GARCH term and FPI is significant, past volatility influences the current
volatility and FPI inflows influences the volatility of Nifty bank.
TABLE 16: PARAMETER ESTIMATES OF GARCH MODEL
Nifty IT
variable coefficient Std. error z-statistic Prob.
Variance equation
C 21063831 6522957. 3.229184 0.0012
RESID(-1)^2 1.145961 0.248339 4.614501 0.0000
GARCH(-1) -0.834232 0.131063 -6.365137 0.0000
FPI -0.025542 0.020020 -1.275798 0.2020
Table 16 represents the parameter estimates of GARCH model. It shows the Variance equation of dependent variable
as Nifty IT and independent variable as FPI. The result shows that GARCH term is significant indicates current volatility is influenced by the past volatility but FPI is insignificant which indicates that FPI inflows does not
influence the volatility of Nifty IT.
TABLE 17: PARAMETER ESTIMATES OF GARCH MODEL
Nifty FMCG
variable coefficient Std. error z-statistic Prob.
Variance equation
C 26988253 8358641. 3.228785 0.0012
RESID(-1)^2 2.005930 0.482591 4.156580 0.0000
GARCH(-1) -0.999178 0.001571 -636.1425 0.0000
FPI 0.015302 0.009860 1.551943 0.1207

GIS Business
ISSN: 1430-3663
Vol-15-Issue-5-May -2020
P a g e | 172 Copyright ⓒ 2020Authors
Table 17 shows the result of GARCH model. The variance equation is represented of dependent variable as Nifty
FMCG and independent as FPI. The results indicate that FPI is insignificant at 5% level, which means volatility of FPI is not influenced by Nifty FMCG. Whereas GARCH term is significant which indicates past volatility is
influencing the current volatility.
TABLE 18: PARAMETER ESTIMATES OF GARCH MODEL
Nifty Pharma
variable coefficient Std. error z-statistic Prob.
Variance equation
C 7848711. 2440833. 3.215587 0.0013
RESID(-1)^2 2.002295 0.561853 3.563736 0.0004
GARCH(-1) -0.996148 0.003289 -302.8635 0.0000
FPI 0.005747 0.007129 0.806223 0.4201
Table 18 shows the result of parameter estimate of GARCH model. It shows that variance equation of dependent
variable Nifty Pharma and independent variable FPI. The result shows that FPI is insignificant it means that an FPI
inflow does not influence the volatility of Nifty Pharma returns. The GARCH term shows significant at 5% level of significance which indicates the volatility of Nifty Pharma is influenced by previous volatility.
FINDINGS AND CONCLUSION
The study has been carried out to analyze impact of foreign portfolio Investment on Indian stock market and to
examine the causal relationship between the variables.
Relationship between the determinants of FPI and FPI inflows
In this objective we have examined the relationship between the determinants of FPI and FPI inflows. To check
whether there is any impact of determinants of FPI on the FPI inflows in India, we used the quarterly time series data
for 16 years from 1 January 2001- 31st December 2016. We employed Correlation and Granger causality test to check
relationship between the variables. The results were:-
In case of Bank rate and FPI inflows, the correlation result shows there is correlation exist between the variables.
The granger causality result shows the Unidirectional causality i.e. Bank rate affects FPI.
In case of Exchange rate and FPI inflows, there is no correlation exist between the variables. Similarly, the results
of granger causality shows there is no causality between Exchange rate and FPI inflows.
In case of GDP and FPI inflows, the results of Correlation shows there is no relationship between the variables.
The granger causality result shows that there is no causality between the variables. That means change in GDP in
short run will not affect the FPI inflows.
In case of WPI and FPI inflows, the Correlation result shows that there is no correlation between the variables. The
granger causality analysis shows that there is no causality exists between the variables. Which indicates change in WPI will in short run will not affect the FPI inflows.

GIS Business
ISSN: 1430-3663
Vol-15-Issue-5-May -2020
P a g e | 173 Copyright ⓒ 2020Authors
Causal relationship between Foreign portfolio Investment and Stock market returns
In this objective, we analyzed the causal relationship between the FPI inflows and NSE sectoral indices namely
Nifty50, Nifty Bank, Nifty IT, Nifty Pharma and Nifty FMCG. We used monthly time series data for 16 years from 1st
January 2001 to 31st December 2016 and apply Granger causality, Cointegration and Vector Error Correction Model
for analysis.
In case of variables Nifty50 and FPI inflows are negative and insignificant where there is independent relation
between the variables but the variables are cointegrated. The result of granger causality shows that there is no
causality between the variables.
In case of variables Nifty Bank and FPI inflows are cointegrated and coefficient of ECM is positive and significant
therefore error correction is not happening. The result of granger causality shows that there is bidirectional relation between Nifty bank and FPI.
In case of variables Nifty Pharma and FPI inflows are cointegrated and coefficient of ECM is positive and
significant therefore error correction is not happening. The result of granger causality shows no causality between
the variables.
In case of variables Nifty IT and FPI inflows are cointegrated and coefficient of ECM is positive and significant
therefore error correction is not happening. The result of granger causality shows no causality between the variables.
In case of variables Nifty FMCG and FPI inflows result shows even if variables are cointegrated and coefficient of
ECM is positive and significant therefore error correction is not happening. The result of granger causality shows
that there is unidirectional causality between variables where Nifty FMCG granger causes FPI.
Effect of FPI on Stock market volatility
In this objective, we analyzed the effect of foreign portfolio Investment on Stock market Volatility. We analyzed
Monthly data of FPI, nifty50, Nifty Bank, Nifty IT, Nifty Pharma, Nifty FMCG for the period of 16 years i.e. from 1st
January 2001- 31st December 2016. GARCH model was used for analysis purpose.
In case of variables Nifty50 and FPI, the GARCH term is significant indicating that the past volatility influences
the current volatility of Nifty50.
In case of variables Nifty Bank and FPI, the GARCH term and FPI inflows are significant which states that the
current volatility is influenced by the past volatility of Nifty Bank and FPI inflows.
In case of variables Nifty IT and FPI, the GARCH term is significant which indicates that the current volatility of
Nifty IT is influenced by the past volatility but FPI inflows are insignificant indicating FPI inflows does not influence volatility of Nifty IT.
In case of variables Nifty FMCG and FPI, the GARCH term is significant indicating past volatility influences the
Current volatility whereas, FPI inflows is insignificant stating FPI inflows does not influences the volatility of
Nifty FMCG.
In case of variables Nifty Pharma and FPI, the GARCH term is significant stating past volatility influences the
current volatility whereas, FPI inflows is insignificant indicating FPI inflows does not influences the volatility of
Nifty Pharma.

GIS Business
ISSN: 1430-3663
Vol-15-Issue-5-May -2020
P a g e | 174 Copyright ⓒ 2020Authors
CONCLUSION
The study presents the Impact of Determinants or factors of FPI on Foreign Portfolio Investment in India. It also
represents the impact of FPI inflows on Indian Stock market. The study shows that determinants are influencing FPI in different ways. Quarterly data was collected for 16 years from 2001-2016 and the study uses Correlation and
Granger causality analysis. The result of correlation shows that Bank rate has a relationship with FPI inflows whereas
other variables do not have any relation with FPI inflows. In case of Granger causality, the result indicates that there is unidirectional causality between the Bank rate and FPI where Bank rate affects FPI inflows and there is no
causality between the other variables with FPI.
To study the causal relationship between FPI and NSE sectoral indices namely Nifty50, Nifty bank, Nifty Pharma,
Nifty IT and Nifty FMCG, monthly data is used for 16 years from 2001-2016. In this study we have used Descriptive
statistic to check the normality of data where we found data was not normal. Than results of unit root test shows the
stationary data. Since all the variables shows the existence of cointegration to check long term relationship between the variables which shows the positive and significant Coefficient of ECM by using Vector Error Correction model.
The result of granger causality shows the bidirectional relationship between Nifty bank and FPI, and unidirectional
relation between Nifty FMCG and FPI inflows where Nifty FMCG affects FPI inflows. Rest of the variables has no causality exist between them.
The study presents the Effect of FPI on stock market volatility for the period of 2001-2016 by using GARCH model. The independent variable is FPI and dependent variables are Nifty50, Nifty Bank, Nifty Pharma, Nifty IT and Nifty
FMCG. The result of GARCH analysis for the stock market returns for selected indices depicts the past volatility of
all the dependent variable influences the current volatility.
REFERENCES
BIBLIOGRAPHY
Amita. (2014). Determinants of FIIs: Evidence from India. IJITKM , 8 (1), 85-95.
Bashir Ahmad Joo & Zahoor Ahmad Mir. (2014). Impact of FII Investment Volatility of an Indian Stock
Market : An Empirical Investigation. Journal of Business and Economic Policy , 1 (2), 106-114.
Chakrabarti. (2001). FII Flows to India: Nature and Causes. ICRA Bulletin, Money and Finance , 61-87.
Chakrabarti, R. (2001). FII flows to India: Nature & Cause.
http://www.rediff.com. (n.d.). Retrieved from rediff.com.
Jasneek Arora & Santhosh Kumar. (2015). Impact of foreign Institutional Investors on Indian capital
market. Pacific Business Review International , 8 (6), 17-23.

GIS Business
ISSN: 1430-3663
Vol-15-Issue-5-May -2020
P a g e | 175 Copyright ⓒ 2020Authors
Karan walia , Dr. Rimpi walia & Monica Jain. (2012). Impact of Foreign institutional investment on stock
market. International Journal of Computing and Corporate Research , 2 (5).
Kulshrestra, H. (2014). Impact of foreign Institutional investors (FIIs) on Indian capital market.
International Journal of Research in Business Management , 2 (3), 35-52.
Kumar, S. (2014). Re- examining the impact of FII investments on the Indian market.
Loomba, J. (2012). Do FIIs impact volatility of Indian stock market. International Journal of Marketing,
Financial Services and Management Research , 1 (7), 80-93.
NSDL FPI MONITOR. (2015). Retrieved from https://www.fpi.nsdl.co.in/.
shankar, S. (2014). http://www.ibtimes.com. Retrieved from International Business times.
Shrivastav, A. (2013). A Study of influence of FII flows on Indian stock market. Gyanpratha-ACCman
Journal of Management , 5 (1).
Swami P. Saxena & Sonam Bhadauria. (2011). FII flows & stock market volatility: Exploring causal link.
International Conference on Practice & Research in Management. Agra.
Tripura Sundari & Rifash Shareef. (2015). An Econometric Analysis to test the causal link between Foreign
Institutional Investors & Indian stock market.
Vaishani Jain, K. S. (2013). Impact of FII flows on Indian capital market. In Financial Markets and Mutual
Funds.