GIS-based environmental modeling and contaminant budgeting
45
Transcript of GIS-based environmental modeling and contaminant budgeting
UNIVERSITY OF GOTHENBURG Department of Earth Sciences Geovetarcentrum/Earth Science Centre ISSN 1400-3821 B681
Master of Science (Two Years) thesis Göteborg 2012
Mailing address Address Telephone Telefax Geovetarcentrum Geovetarcentrum Geovetarcentrum 031-786 19 56 031-786 19 86 Göteborg University S 405 30 Göteborg Guldhedsgatan 5A S-405 30 Göteborg SWEDEN
GIS model of heavy metal supply to the Kvillebäcken
stream, Gothenburg
Deyala Alazem
3
Abstract
Stormwater is an important issue in urban environments since it is been established as one of the major
source contaminating urban water ways. A GIS-based model of stormwater and contaminant fluxes is a
cost effective, valuable and simplified method to explore the conditions in urban areas and to direct
decision makers to obtain the most efficient stormwater management.
The Kvillebäcken stream is a sensitive stream which passes through a heterogeneous area of landuse
types. The stream also supplies contaminants to the Göta älv River which makes it an interesting site to
investigate. ArcMap is the used GIS-software to develop the model and calculations in the Kvillebäcken
study area. In this case study Cu, Zn and Pb are separately modeled for four seasons. The main
contaminant source in the Kvillebäcken area is runoff from landuse types, such as roads and copper plated
roofs and both runoff and groundwater flow from the Grimbo dumping site.
According to the model, contaminant sources in the Kvillebäcken study area contribute significant
amounts of contaminants to the Kvillebäcken stream by stormwater transport along different pathways.
This puts water quality of the stream at risk at certain runoff times, and the Göta älv River as a
consequence. The waste water treatment plant also receives large amounts of contaminants via the
combined sewer system. Hence better stormwater management is required in many cases within the study
area.
Keywords: Kvillebäcken stream, GIS-based stormwater model, urban environments, urban stormwater,
contaminant transportation pathways
Sammanfattning
Dagvatten är en viktig parameter i urbana miljöer, då den är etablerad som en av de största
föroreningskällorna av de urbana vattenmottagarna. En GIS-baserad dagvattenmodell och
föroreningsbudgetering är en kostnadseffektiv, värdefull och förenklad metod för att undersöka
förhållandena i den urbana miljön. GIS-modellen kan även upplysa beslutsfattarna för att uppnå den mest
effektiva dagvattenhanteringen.
Kvillebäcken är en känslig bäck som passerar genom ett heterogent område av markanvändningstyper.
Dessutom levererar bäcken föroreningar till Göta älv, vilket gör den intressant att undersöka. ArcMap är
den använda GIS-mjukvaran för att utveckla modellen och göra beräkningar i Kvillebäckens
studieområde. I den här fallstudien är Cu, Zn och Pb modellerat separat för fyra säsonger. Den viktigaste
föroreningskällan i Kvillebäckensområde är avrinning från markanvändningstyper, såsom vägar och
koppartak och både avrinning och grundvattenflöde från Grimbo dumpningsplats.
Enligt modellen, bidrar föroreningskällor i Kvillebäckensstudieområde med betydande mängder
föroreningar till Kvillebäcken genom olika dagvattentransportvägar. Detta riskerar vattenkvaliteten i
bäcken och Göta älv vid vissa avrinningstillfällen. Reningsverket får också stora mängder
föroreningar via det kombinerade avloppssystemet i studieområdet. Vissa delar av detta studerade område
är i behov av en bättre dagvattenhantering.
4
Table of Contents
1. Introduction ........................................................................................................................................... 5
1.1. Project aim
1.2. Area description
1.3. Precipitation data
1.4. Pollution data and contaminate sources
1.5. Previous studies
2. Construction of the GIS-based model ................................................................................................. 15
2.1. Contaminant sources
2.2. Transport pathways of contaminants
2.3. Contaminant supply calculations
2.4. Contaminant load in the Kvillebäcken stream
2.5. Hydrogeological settings and their vulnerability of pollution spreading
2.6. Stormwater and contaminant supply via the combined sewer system to waste water treatment plant
2.7. Recommendations and model improvement
3. Result ................................................................................................................................................... 22
3.1. Contaminant sources in Kvillebäcken study area ............................................................................ 22
3.2. Contaminant supply from different landuse pathways
3.3. Contaminant supply via stormwater pipes
3.4. Contaminant supply from Roads, Copper plated roofs, and Grimbo dumping site
3.5. Contaminant loading in the Kvillebäcken stream
3.6. Hydrogeological settings and their vulnerability of pollution spreading
3.7. Stormwater and contaminant supply from the combined sewer system
4. Discussion ........................................................................................................................................... 32
5. Conclusions ......................................................................................................................................... 42
6. Acknowledgments ............................................................................................................................... 43
7. References ........................................................................................................................................... 43

5
1. Introduction
Stormwater is an important issue in urban environments since it has been established as one of the major
contaminant contributors to recipients in these environments (Pennington and Webster-Brown 2008,
Regionplan- och trafikkontoret 2009).
Many researchers have explored the side effects of polluted stormwater on recipient water quality and
aquatic life (Wie and Morrison 1992, Larm 2000, Åberg 2007), since societies are very conscious about
stormwater and stream water quality issues an efficient management of urban stormwater is frequently
demanded in recent time (Åberg 2007, Björklund et al. 2008). As a consequence, stormwater in urban
environments requires frequent monitoring and contaminant budgeting. However, it is very complicated
and costly approach to achieve direct and representative measurements in the field. Therefore, a model
simulation of urban stormwater quality and contaminant budgeting might be the most cost effective,
valuable and simplified method to explore the condition in urban areas. Additionally, such model would
be a useful tool to direct decision makers to obtain the most efficient urban stormwater management based
upon properties of the specific urban area and water recipient (Larm 2000, Ahlam 2002, Björklund et al.
2008).
In addition to roads, metallic roofing and atmospheric deposition, urban environments usually consist of a
variety of landuse types where each may have potential negative effects on nearby recipients, such as
streams (Larm 2000, Eliasson 2005). However, hard surfaces are often dominant in several landuse types
in these environments and are tend to accumulate contaminants which can increase the pollution
concentration of stormwater. Stormwater transports contaminants from these hard surfaces along two main
pathways, which are direct surface runoff and via the sewer system. Also, stormwater can infiltrate
through some “green surfaces” when these exist, in urban areas. This leads to lateral flow of soil water and
groundwater flow, which also can transport contaminants to nearby recipients and even affects the existing
groundwater negatively (Eliasson 2005). Therefore, a simulated stormwater model should be able to
investigate all these different aspects based on various inputs and under different weather and climate
conditions (short or long time conditions) (Larm 2000).
Urban stormwater also contributes contaminants to waste water treatment plant via the combined sewer
system, besides the supply to nearby water recipients (Larm 2000, Eliasson 2005). A simulation model
will also be a useful tool for treatment facilities to facilitate an effective management of the contaminant
supplied with stormwater.
This master’s thesis deals with the Kvillebäcken stream in Gothenburg city and the impact of polluted
stormwater from the surrounding area of Kvillebäcken on the stream. The Kvillebäcken study area is an
interesting area because of the heterogeneousity of landuse types, such as industrial, rural and residential
which the Kvillebäcken stream passes through. The stream is recognized as a sensitive stream which
receives large amounts of contaminants by stormwater runoff from rural and industrial areas surround it
(Wie and Morrison 1992, Göteborgs va-verket 2001). It has a slow flow rate which increases the
possibility of contaminant accumulation. Additionally, the Kvillebäcken stream is one of the three main
streams in Gothenburg which discharge to the Göta älv River and, therefore, it is expected to supply
contaminants to the Gothenburg harbor and the Göta älv River (Eriksson 1999, Johannesson et al. 2003).
6
This project is associated with the Dipol project (The Interreg IVB North Sea Region Program 2007-2013)
which focused on the “Impact of Climate Change on the Quality of Urban and Coastal Waters-Diffuse
pollution”. Dipol is an integrated program of five cities in five different countries of the northern region.
Gothenburg City is one of the involved cities, with three partners: IVL (the Swedish Environmental
Research Institution), SGI (the Swedish Geotechnical Institute) and the University of Gothenburg
(www.northsearegion.eu).
1.1. Project aim
The aim of this master’s thesis is to develop an applicable GIS-based model to 1) investigate the
environmental conditions of urban streams 2) make water budgeting 3) make contaminant budgeting from
sources and 4) estimate contaminant supply to nearby recipients in an urban environment, based on
several factors and inputs. It is also a goal to make a model which is able to estimate contaminant
contribution to the waste water treatment plant.
Since weather and climate variations are influential factors in contaminant budgeting, it is necessary to
examine the GIS-model in different climate conditions, such as the seasonal variations used in this case
study.
Furthermore, the obtained result from the GIS-model, of the Kvillebäcken study area, will be applied to
discuss the possible applications of the model, such as:
How can landuse changes in urban areas impact on water and contaminant budget?
Is it more efficient to replace some hard surfaces with permeable surfaces to enhance infiltration of
stormwater into the ground rather than drain it directly into nearby water recipients from stormwater
pipes or surface runoff? How can the quality of groundwater get affected by this concept?
Is it better to lead stormwater, which is drained in stormwater pipes, to treatment plant, if the metal
supply is high and risky (depending on landuse types) rather than drain it directly into a water
recipient?
Should road runoff in an area be treated in a different way than other hard surface runoff or
stormwater drainage, if the metal loads are high?
Is there a correlation between the extent of copper roofing in an area and Cu-concentration in nearby
water recipient? Can copper plated roofs be the main source of copper to a recipient? Is it effective to
replace copper plated roofs in this area? Are there other alternatives other than replacement?
How can contaminant supply from point sources be controlled and reduced if needed, so that they will
not negatively affect nearby water bodies and/or groundwater?
Based on urban landuse types, how large is the metal supply from the combined sewer system in a
study area to the waste water treatment plant?
How can waste water treatment facilities deal with seasonal variation of stormwater volume, which is
drained into the combined sewer system? Or with any future increases in precipitation?
7
0 710 1,420355 Meters
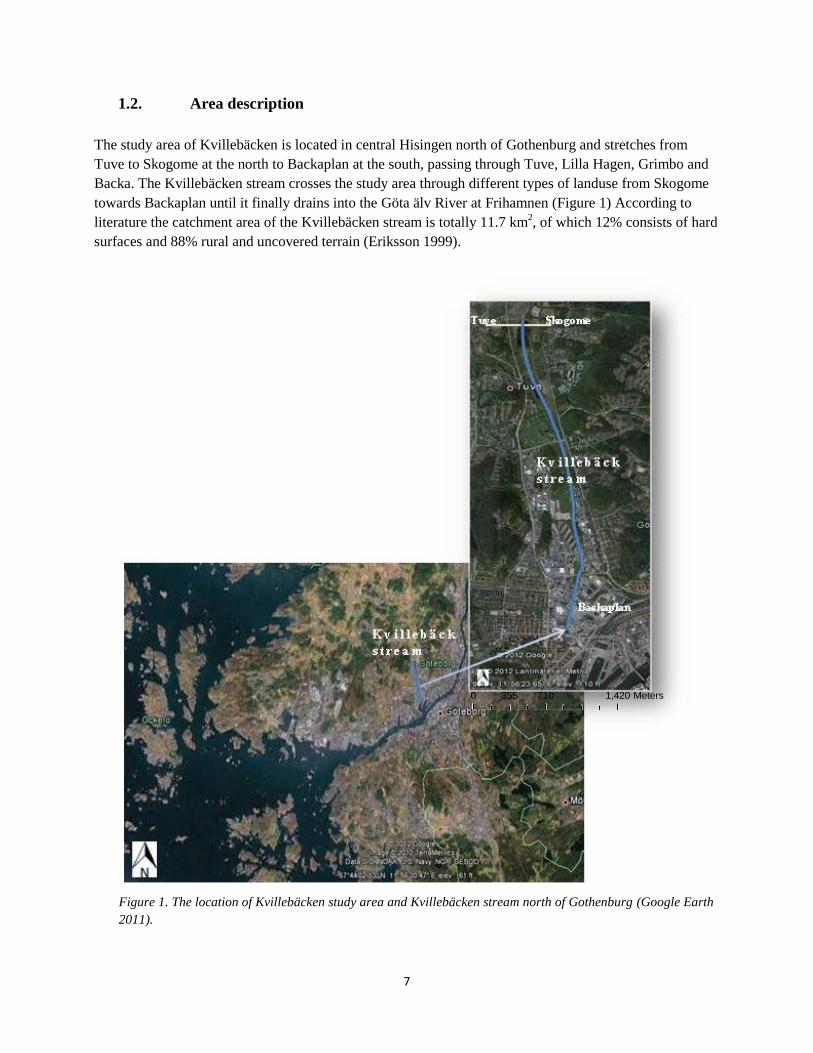
1.2. Area description
The study area of Kvillebäcken is located in central Hisingen north of Gothenburg and stretches from
Tuve to Skogome at the north to Backaplan at the south, passing through Tuve, Lilla Hagen, Grimbo and
Backa. The Kvillebäcken stream crosses the study area through different types of landuse from Skogome
towards Backaplan until it finally drains into the Göta älv River at Frihamnen (Figure 1) According to
literature the catchment area of the Kvillebäcken stream is totally 11.7 km2, of which 12% consists of hard
surfaces and 88% rural and uncovered terrain (Eriksson 1999).
Figure 1. The location of Kvillebäcken study area and Kvillebäcken stream north of Gothenburg (Google Earth
2011).
8
0 710 1,420355 Meters
Historical background
Until the middle of the 20th century this part of Hisingen was mostly agricultural and rural, but
industrialization took over afterward corresponding to population booming in the area (Andréasson et al.
2005, Almqvist et al. 2005). Due to population growth, especially during the 1960’s, most of the
agricultural land was replaced with houses, apartments and hard surfaces in the vicinity of the harbor.
Currently, large parts of the northern Kvillebäcken area are mainly residential areas (Almqvist et al.
2005).
St. Jörgen was built in 1872 as a hospital under the name “Göteborgs hospital”, and it is one of the oldest
buildings in the area. It is located in Lille Hagen adjacent to the Lillehagsbäcken brook, which drains into
the Kvillebäcken stream, but the facility was shut down during the 1980’s and it is currently used as a
daycare school, nursing home and small business offices. One of the very first industrial activities in the
area, in the Backaplan part, was the “Rosengrens safe-box Factory” which was established in 1905. The
activity of the factory was shut down in 1967. The building is still standing however. During this period
many other industrial activities were established, such as the paper-mass factory and wood and iron
related activities. However, most of these activities were shut down and replaced with shopping centers,
storage facilities and light industries (Andréasson et al. 2005).
Most of these old buildings have copper plated roofs and they have never been replaced in this area, which
makes them a well known source of copper pollution in Gothenburg city (Lindgren 2001).
The Grimbo field area during the 1900’s was only wetlands of agricultural interest, but this shifted
subsequently to light industrial activities. These activities diminished in
Grimbo and were replaced by offices, storage buildings and mechanic
services. A large part of the Grimbo field was converted afterward to
athletic fields, such as soccer fields and golf coarse (Almqvist et al. 2005).
The subsurface of the Grimbo field is anthropogenic to a great extent, since
most of the natural glaciofluvial material was excavated and it was used as
a dumping site during the 1950´s and -1960´s and between 1973 and 1975
for scrap iron, non-usable excavation materials and construction and
industrial wastes (Karnstedt et al. 2003).
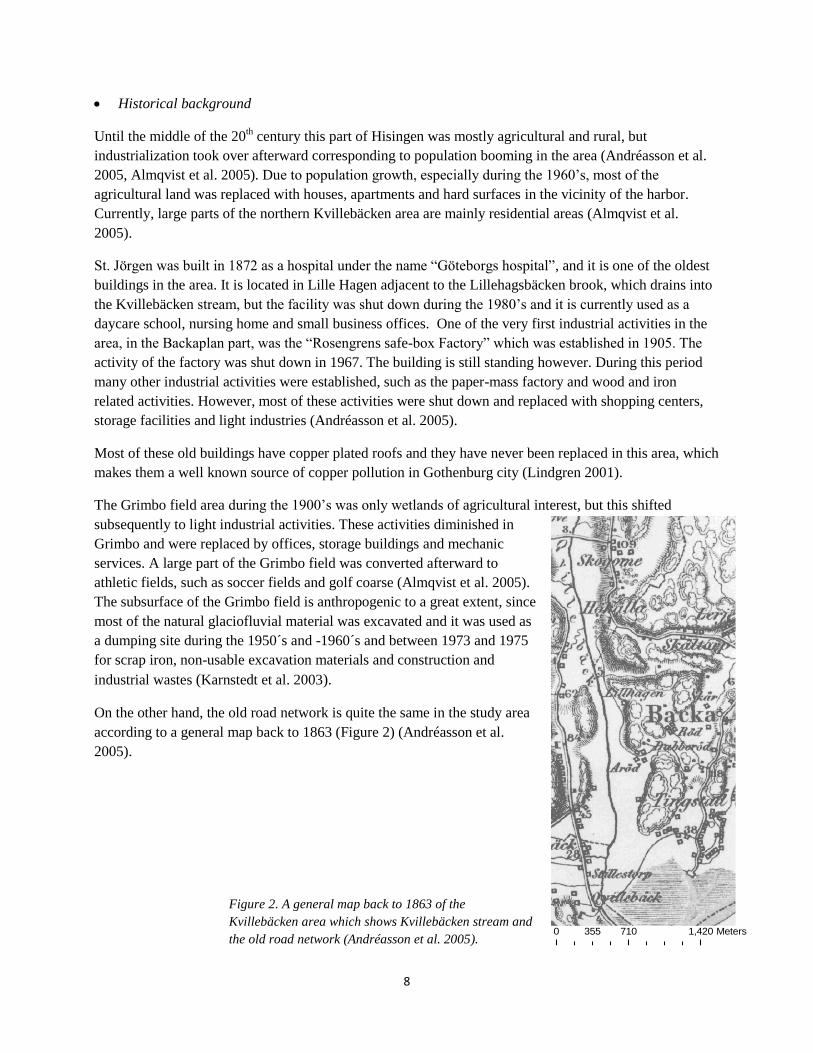
On the other hand, the old road network is quite the same in the study area
according to a general map back to 1863 (Figure 2) (Andréasson et al.
2005).
Figure 2. A general map back to 1863 of the
Kvillebäcken area which shows Kvillebäcken stream and
the old road network (Andréasson et al. 2005).
9
N
0 700 1,400350 Meters
0 710 1,420355 Meters
Geological background
Bedrock geology:
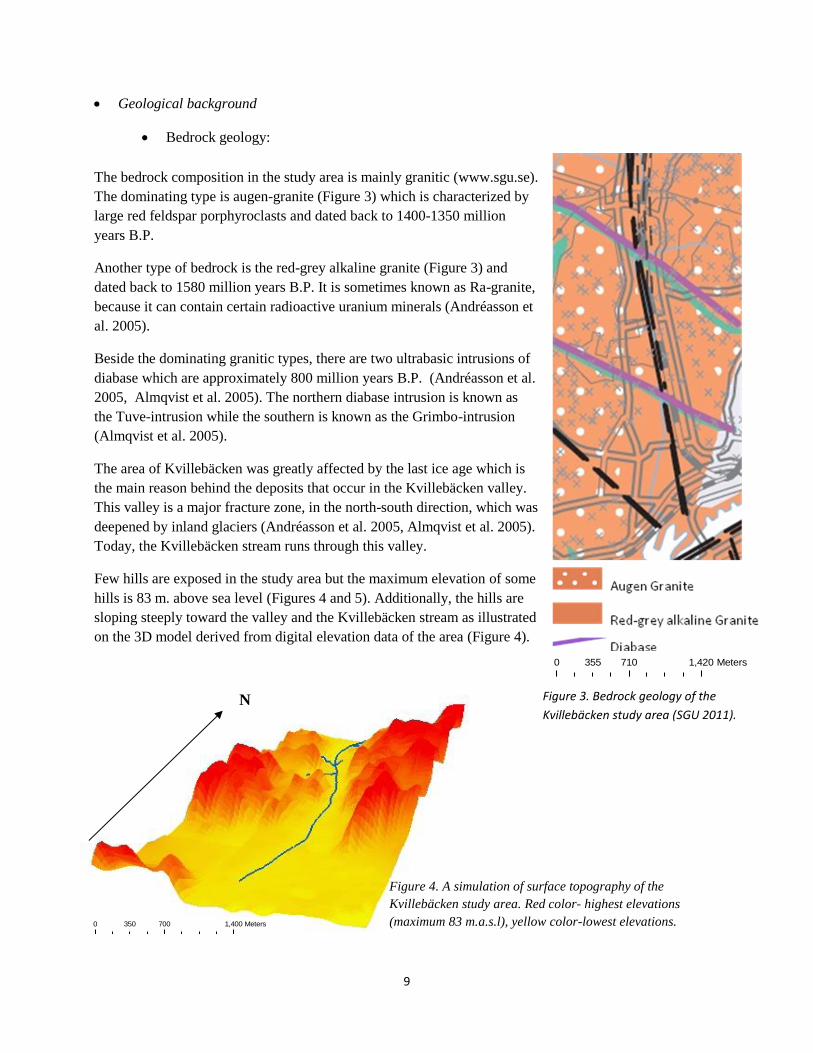
The bedrock composition in the study area is mainly granitic (www.sgu.se).
The dominating type is augen-granite (Figure 3) which is characterized by
large red feldspar porphyroclasts and dated back to 1400-1350 million
years B.P.
Another type of bedrock is the red-grey alkaline granite (Figure 3) and
dated back to 1580 million years B.P. It is sometimes known as Ra-granite,
because it can contain certain radioactive uranium minerals (Andréasson et
al. 2005).
Beside the dominating granitic types, there are two ultrabasic intrusions of
diabase which are approximately 800 million years B.P. (Andréasson et al.
2005, Almqvist et al. 2005). The northern diabase intrusion is known as
the Tuve-intrusion while the southern is known as the Grimbo-intrusion
(Almqvist et al. 2005).
The area of Kvillebäcken was greatly affected by the last ice age which is
the main reason behind the deposits that occur in the Kvillebäcken valley.
This valley is a major fracture zone, in the north-south direction, which was
deepened by inland glaciers (Andréasson et al. 2005, Almqvist et al. 2005).
Today, the Kvillebäcken stream runs through this valley.
Few hills are exposed in the study area but the maximum elevation of some
hills is 83 m. above sea level (Figures 4 and 5). Additionally, the hills are
sloping steeply toward the valley and the Kvillebäcken stream as illustrated
on the 3D model derived from digital elevation data of the area (Figure 4).
Figure 3. Bedrock geology of the
Kvillebäcken study area (SGU 2011).
Figure 4. A simulation of surface topography of the
Kvillebäcken study area. Red color- highest elevations
(maximum 83 m.a.s.l), yellow color-lowest elevations.
10
0 710 1,420355 Meters
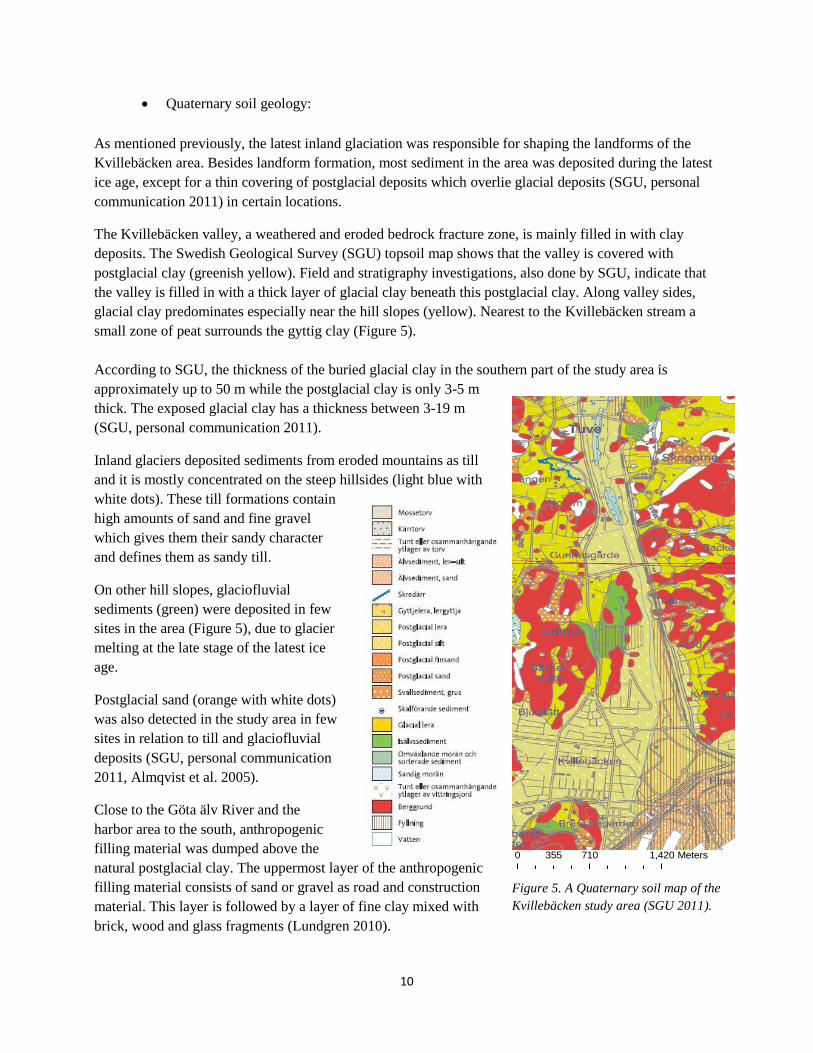
Quaternary soil geology:
As mentioned previously, the latest inland glaciation was responsible for shaping the landforms of the
Kvillebäcken area. Besides landform formation, most sediment in the area was deposited during the latest
ice age, except for a thin covering of postglacial deposits which overlie glacial deposits (SGU, personal
communication 2011) in certain locations.
The Kvillebäcken valley, a weathered and eroded bedrock fracture zone, is mainly filled in with clay
deposits. The Swedish Geological Survey (SGU) topsoil map shows that the valley is covered with
postglacial clay (greenish yellow). Field and stratigraphy investigations, also done by SGU, indicate that
the valley is filled in with a thick layer of glacial clay beneath this postglacial clay. Along valley sides,
glacial clay predominates especially near the hill slopes (yellow). Nearest to the Kvillebäcken stream a
small zone of peat surrounds the gyttig clay (Figure 5).
According to SGU, the thickness of the buried glacial clay in the southern part of the study area is
approximately up to 50 m while the postglacial clay is only 3-5 m
thick. The exposed glacial clay has a thickness between 3-19 m
(SGU, personal communication 2011).
Inland glaciers deposited sediments from eroded mountains as till
and it is mostly concentrated on the steep hillsides (light blue with
white dots). These till formations contain
high amounts of sand and fine gravel
which gives them their sandy character
and defines them as sandy till.
On other hill slopes, glaciofluvial
sediments (green) were deposited in few
sites in the area (Figure 5), due to glacier
melting at the late stage of the latest ice
age.
Postglacial sand (orange with white dots)
was also detected in the study area in few
sites in relation to till and glaciofluvial
deposits (SGU, personal communication
2011, Almqvist et al. 2005).
Close to the Göta älv River and the
harbor area to the south, anthropogenic
filling material was dumped above the
natural postglacial clay. The uppermost layer of the anthropogenic
filling material consists of sand or gravel as road and construction
material. This layer is followed by a layer of fine clay mixed with
brick, wood and glass fragments (Lundgren 2010).
Figure 5. A Quaternary soil map of the
Kvillebäcken study area (SGU 2011).
11
0 700 1,400350 Meters
0 710 1,420355 Meters
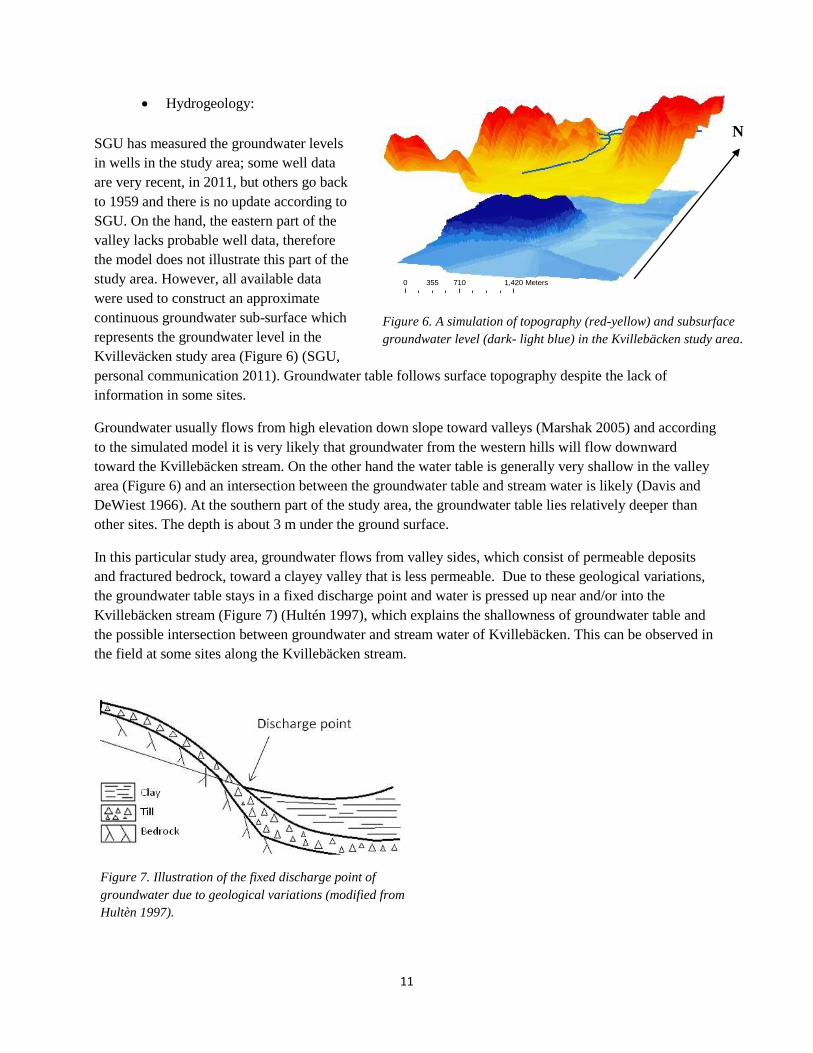
Hydrogeology:
SGU has measured the groundwater levels
in wells in the study area; some well data
are very recent, in 2011, but others go back
to 1959 and there is no update according to
SGU. On the hand, the eastern part of the
valley lacks probable well data, therefore
the model does not illustrate this part of the
study area. However, all available data
were used to construct an approximate
continuous groundwater sub-surface which
represents the groundwater level in the
Kvilleväcken study area (Figure 6) (SGU,
personal communication 2011). Groundwater table follows surface topography despite the lack of
information in some sites.
Groundwater usually flows from high elevation down slope toward valleys (Marshak 2005) and according
to the simulated model it is very likely that groundwater from the western hills will flow downward
toward the Kvillebäcken stream. On the other hand the water table is generally very shallow in the valley
area (Figure 6) and an intersection between the groundwater table and stream water is likely (Davis and
DeWiest 1966). At the southern part of the study area, the groundwater table lies relatively deeper than
other sites. The depth is about 3 m under the ground surface.
In this particular study area, groundwater flows from valley sides, which consist of permeable deposits
and fractured bedrock, toward a clayey valley that is less permeable. Due to these geological variations,
the groundwater table stays in a fixed discharge point and water is pressed up near and/or into the
Kvillebäcken stream (Figure 7) (Hultén 1997), which explains the shallowness of groundwater table and
the possible intersection between groundwater and stream water of Kvillebäcken. This can be observed in
the field at some sites along the Kvillebäcken stream.
N
Figure 6. A simulation of topography (red-yellow) and subsurface
groundwater level (dark- light blue) in the Kvillebäcken study area.
Figure 7. Illustration of the fixed discharge point of
groundwater due to geological variations (modified from
Hultèn 1997).
12
0 700 1,400350 Meters0 700 1,400350 Meters0 700 1,400350 Meters0 700 1,400350 Meters
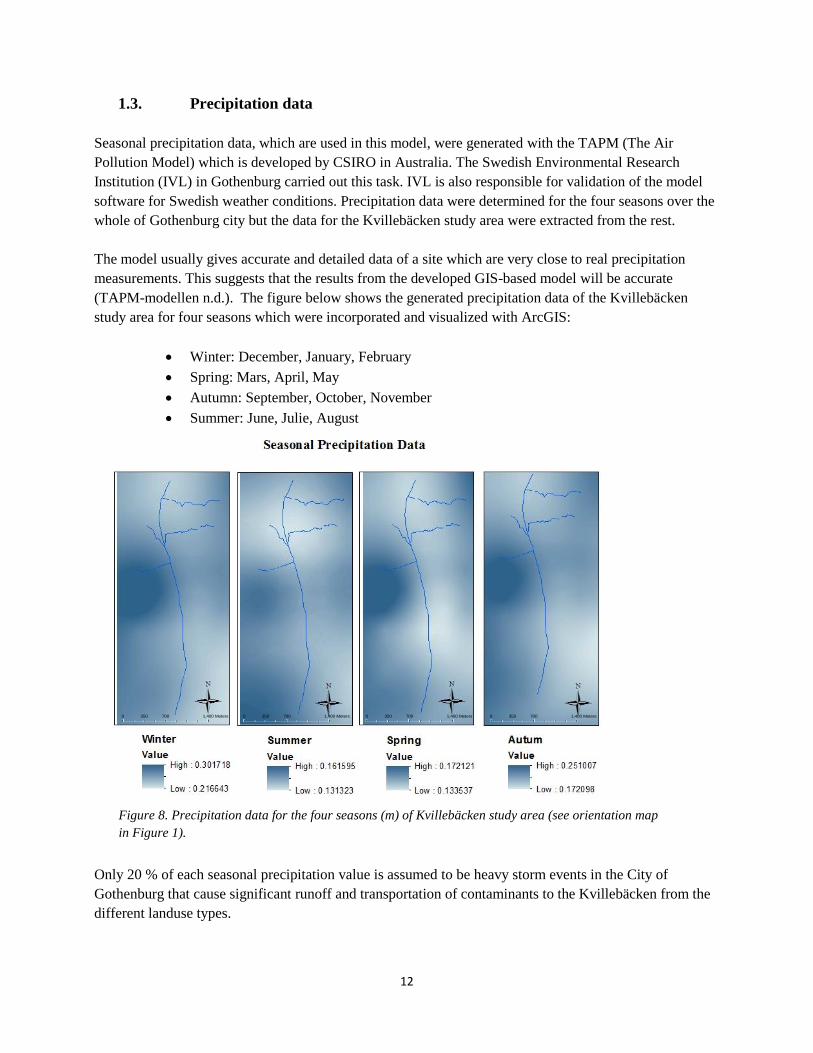
1.3. Precipitation data
Seasonal precipitation data, which are used in this model, were generated with the TAPM (The Air
Pollution Model) which is developed by CSIRO in Australia. The Swedish Environmental Research
Institution (IVL) in Gothenburg carried out this task. IVL is also responsible for validation of the model
software for Swedish weather conditions. Precipitation data were determined for the four seasons over the
whole of Gothenburg city but the data for the Kvillebäcken study area were extracted from the rest.
The model usually gives accurate and detailed data of a site which are very close to real precipitation
measurements. This suggests that the results from the developed GIS-based model will be accurate
(TAPM-modellen n.d.). The figure below shows the generated precipitation data of the Kvillebäcken
study area for four seasons which were incorporated and visualized with ArcGIS:
Winter: December, January, February
Spring: Mars, April, May
Autumn: September, October, November
Summer: June, Julie, August
Only 20 % of each seasonal precipitation value is assumed to be heavy storm events in the City of
Gothenburg that cause significant runoff and transportation of contaminants to the Kvillebäcken from the
different landuse types.
Figure 8. Precipitation data for the four seasons (m) of Kvillebäcken study area (see orientation map
in Figure 1).
13
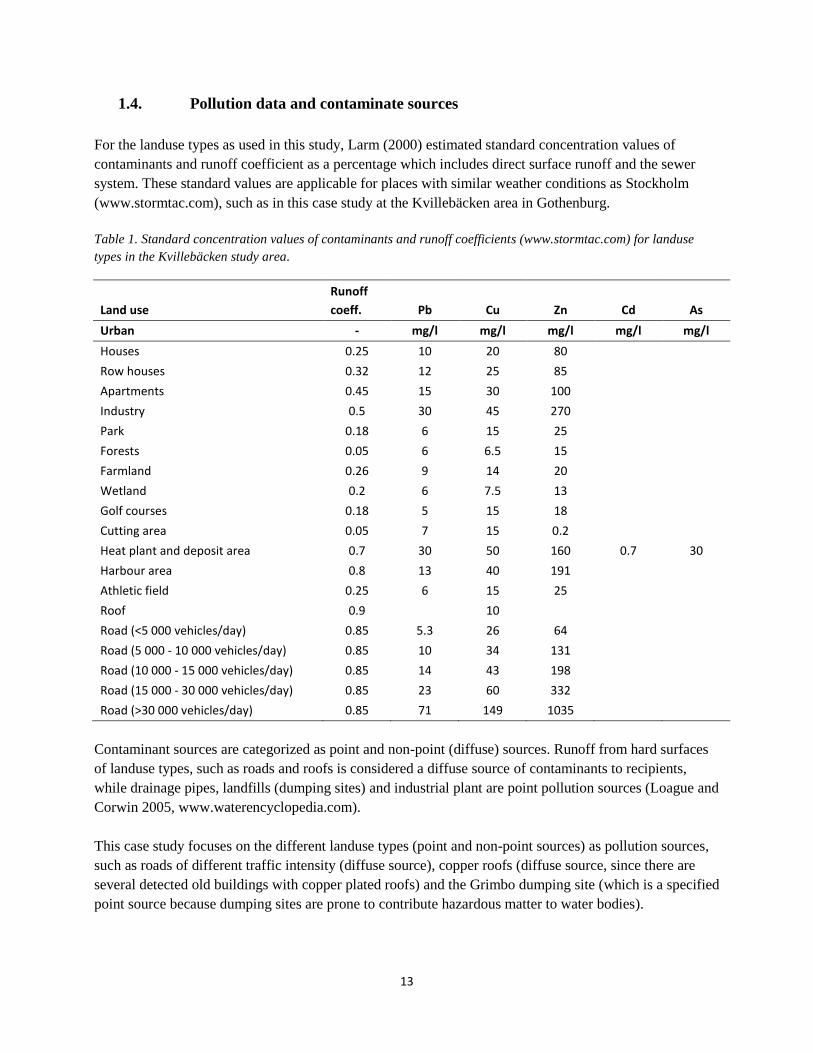
1.4. Pollution data and contaminate sources
For the landuse types as used in this study, Larm (2000) estimated standard concentration values of
contaminants and runoff coefficient as a percentage which includes direct surface runoff and the sewer
system. These standard values are applicable for places with similar weather conditions as Stockholm
(www.stormtac.com), such as in this case study at the Kvillebäcken area in Gothenburg.
Table 1. Standard concentration values of contaminants and runoff coefficients (www.stormtac.com) for landuse
types in the Kvillebäcken study area.
Land use
Runoff
coeff. Pb Cu Zn Cd As
Urban - mg/l mg/l mg/l mg/l mg/l
Houses 0.25 10 20 80
Row houses 0.32 12 25 85
Apartments 0.45 15 30 100
Industry 0.5 30 45 270
Park 0.18 6 15 25
Forests 0.05 6 6.5 15
Farmland 0.26 9 14 20
Wetland 0.2 6 7.5 13
Golf courses 0.18 5 15 18
Cutting area 0.05 7 15 0.2
Heat plant and deposit area 0.7 30 50 160 0.7 30
Harbour area 0.8 13 40 191
Athletic field 0.25 6 15 25
Roof 0.9
10
Road (<5 000 vehicles/day) 0.85 5.3 26 64
Road (5 000 - 10 000 vehicles/day) 0.85 10 34 131
Road (10 000 - 15 000 vehicles/day) 0.85 14 43 198
Road (15 000 - 30 000 vehicles/day) 0.85 23 60 332
Road (>30 000 vehicles/day) 0.85 71 149 1035
Contaminant sources are categorized as point and non-point (diffuse) sources. Runoff from hard surfaces
of landuse types, such as roads and roofs is considered a diffuse source of contaminants to recipients,
while drainage pipes, landfills (dumping sites) and industrial plant are point pollution sources (Loague and
Corwin 2005, www.waterencyclopedia.com).
This case study focuses on the different landuse types (point and non-point sources) as pollution sources,
such as roads of different traffic intensity (diffuse source), copper roofs (diffuse source, since there are
several detected old buildings with copper plated roofs) and the Grimbo dumping site (which is a specified
point source because dumping sites are prone to contribute hazardous matter to water bodies).
14
1.5. Previous studies
Dipol project Gothenburg summer workshop
In 2010 the Dipol-project provided a summer workshop for students in the city of Gothenburg in order to
accomplish some of the project goals. One of the many goals in Gothenburg was to develop a GIS-based
model to investigate the “source- to- sink” concept which includes contaminant budgeting, contaminant
supply and the effect on urban streams. The model was first applied on the Mölndalsån stream, but it was
a very simplified approach which needed more information, planning and coordination.
The SEWSYS model
Ahlman (2002) developed a stormwater model, which he called SEWSYS, during his doctoral thesis at
Chalmers University. The SEWSYS is a MATLAB/Simulink- based model which is able to perform four
different alternatives: 1) sewage water and rain water in the combined sewer system 2) rain water in the
separated sewer system 3) sewage water individually and 4) rain water separately (Ahlam 2002, Eliasson
2005)
In one of Ahlmans PHD papers, he presents a case study at Vasastaden in Gothenburg city in which the
SEWYS model was applied. Since the combined system is pre-dominant sewer system in this specific
area, it was interesting for him to investigate the “stormwater management” in the area and evaluate if
there were any suitable and efficient alternatives to consider. In that case study, contaminant sources such
as metallic roofs, traffic and landuse types were identified as well as the areas where combined and
separated sewer systems exist. Additionally, the supply of Cu, Zn and Pb and PAH from the identified
sources via the combined and separated system was determined with the SEWSYS-model.
His main questions were “What direction will Göteborg take in the future when it comes to the combined
sewer systems? “and” Is the most sustainable solution to rebuild the old combined systems to duplicate
systems or should the combined systems be left alone?” (Ahlam 2002).
The StormTac model
StormTak is an advanced stormwater model which was developed by doctoral student Thomas Larm at the
Royal Institution of Technology, Stockholm. The model is able to quantify contaminant supply from
different landuse types with stormwater to recipients, based on simple mathematical equations. In addition
to stormwater, it is also capable to quantify atmospheric deposition and base flow contaminant supply, and
also the supply to waste water treatment plant. The model is able to determine the amount of contaminant
supply over time, such as yearly or monthly periods.
The StormTac model is a “flowchart” where default inputs can be modified based on the study area
properties such as standard contaminant concentrations of each landuse type, the area of the landuse,
runoff coefficient and monthly or yearly precipitation data. Results obtained with the StormTac can be
incorporated into a GIS-software in order to illustrate them as visual maps and pictures and to produce
data tables (Larm 2000). The StormTac model went through revision since 1996 until it reached a
15
0 710 1,420355 Meters
developed web application in 2012, and it has been applied in several case studies (www.stormtac.com)
but the first two studies were achieved in Trekanten and Sätra in Stockholm (Larm 2000).
2. Construction of the GIS-based model
2.1. Contaminant sources
The main contaminant sources in the Kvillebäcken study area are the landuse types, such as industrial and
residential sites, roads of different traffic intensity, copper plated roofs and the Grimbo dumping site.
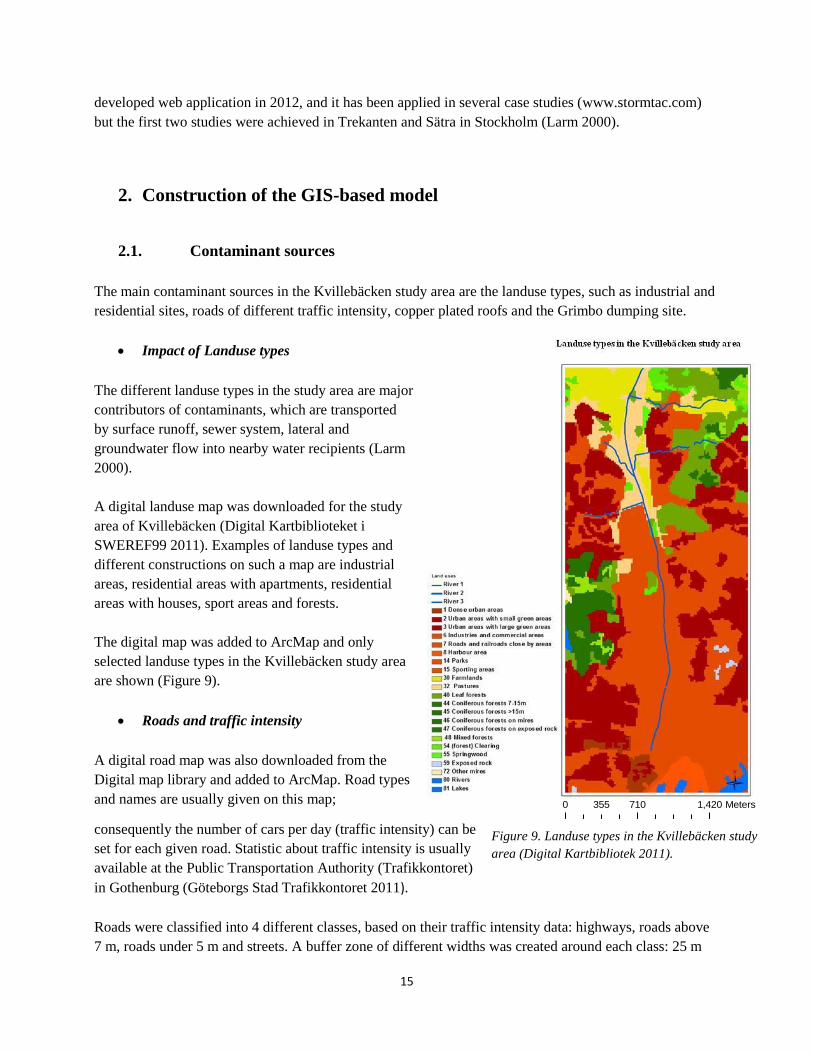
Impact of Landuse types
The different landuse types in the study area are major
contributors of contaminants, which are transported
by surface runoff, sewer system, lateral and
groundwater flow into nearby water recipients (Larm
2000).
A digital landuse map was downloaded for the study
area of Kvillebäcken (Digital Kartbiblioteket i
SWEREF99 2011). Examples of landuse types and
different constructions on such a map are industrial
areas, residential areas with apartments, residential
areas with houses, sport areas and forests.
The digital map was added to ArcMap and only
selected landuse types in the Kvillebäcken study area
are shown (Figure 9).
Roads and traffic intensity
A digital road map was also downloaded from the
Digital map library and added to ArcMap. Road types
and names are usually given on this map;
consequently the number of cars per day (traffic intensity) can be
set for each given road. Statistic about traffic intensity is usually
available at the Public Transportation Authority (Trafikkontoret)
in Gothenburg (Göteborgs Stad Trafikkontoret 2011).
Roads were classified into 4 different classes, based on their traffic intensity data: highways, roads above
7 m, roads under 5 m and streets. A buffer zone of different widths was created around each class: 25 m
Figure 9. Landuse types in the Kvillebäcken study
area (Digital Kartbibliotek 2011).
16
around highways, 18 m for roads over 7 m, 15 m for roads under 5 m and 10 m around streets. This step
was done to be able to calculate the area of each road class.
Copper plated roofs and Grimbo dumping site
Copper plated roofs were defined and digitized as polygons on the downloaded property map. This was
accomplished by comparing roofs on the property map and a bare ground map, since copper roofs are
blue-green colored it is easy to distinguish them among other roof types. The digitized copper plated roofs
were extracted afterward from the rest of the existing roofs in the area.
The approximate geographic location of Grimbo dumping site is known from previous studies and it was
digitized as a polygon.
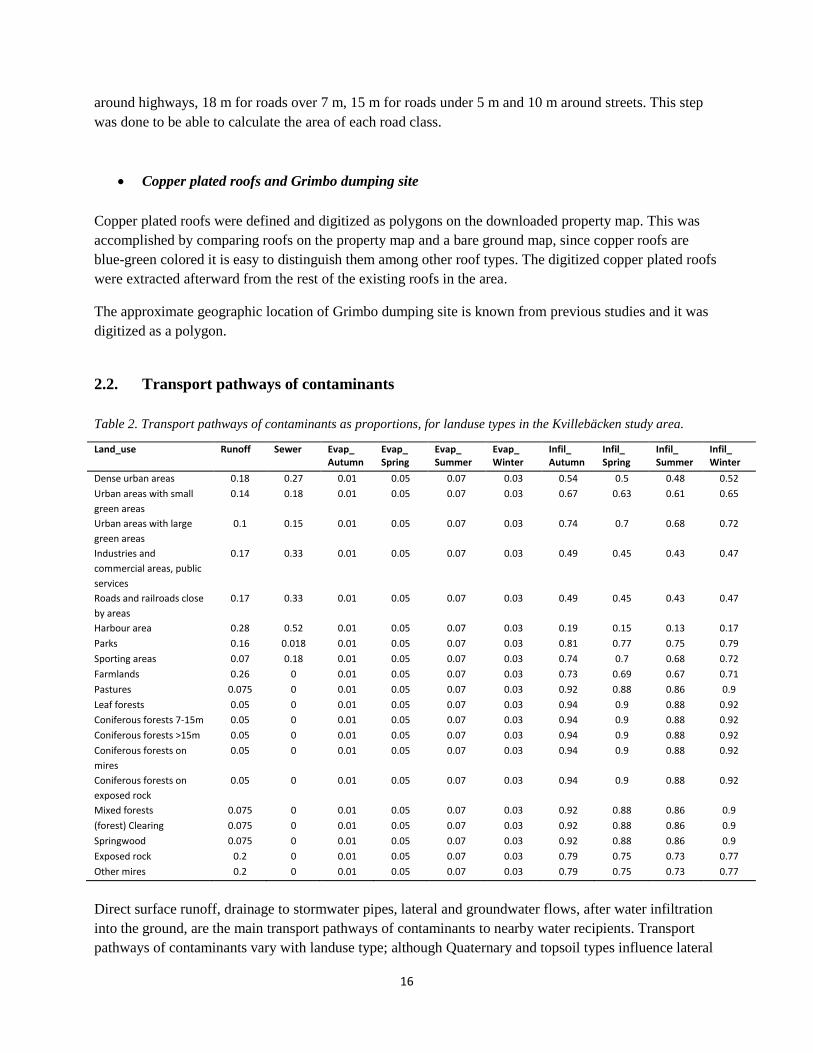
2.2. Transport pathways of contaminants
Table 2. Transport pathways of contaminants as proportions, for landuse types in the Kvillebäcken study area.
Land_use Runoff Sewer Evap_ Autumn
Evap_ Spring
Evap_ Summer
Evap_ Winter
Infil_ Autumn
Infil_ Spring
Infil_ Summer
Infil_ Winter
Dense urban areas 0.18 0.27 0.01 0.05 0.07 0.03 0.54 0.5 0.48 0.52
Urban areas with small
green areas
0.14 0.18 0.01 0.05 0.07 0.03 0.67 0.63 0.61 0.65
Urban areas with large
green areas
0.1 0.15 0.01 0.05 0.07 0.03 0.74 0.7 0.68 0.72
Industries and
commercial areas, public
services
0.17 0.33 0.01 0.05 0.07 0.03 0.49 0.45 0.43 0.47
Roads and railroads close
by areas
0.17 0.33 0.01 0.05 0.07 0.03 0.49 0.45 0.43 0.47
Harbour area 0.28 0.52 0.01 0.05 0.07 0.03 0.19 0.15 0.13 0.17
Parks 0.16 0.018 0.01 0.05 0.07 0.03 0.81 0.77 0.75 0.79
Sporting areas 0.07 0.18 0.01 0.05 0.07 0.03 0.74 0.7 0.68 0.72
Farmlands 0.26 0 0.01 0.05 0.07 0.03 0.73 0.69 0.67 0.71
Pastures 0.075 0 0.01 0.05 0.07 0.03 0.92 0.88 0.86 0.9
Leaf forests 0.05 0 0.01 0.05 0.07 0.03 0.94 0.9 0.88 0.92
Coniferous forests 7-15m 0.05 0 0.01 0.05 0.07 0.03 0.94 0.9 0.88 0.92
Coniferous forests >15m 0.05 0 0.01 0.05 0.07 0.03 0.94 0.9 0.88 0.92
Coniferous forests on
mires
0.05 0 0.01 0.05 0.07 0.03 0.94 0.9 0.88 0.92
Coniferous forests on
exposed rock
0.05 0 0.01 0.05 0.07 0.03 0.94 0.9 0.88 0.92
Mixed forests 0.075 0 0.01 0.05 0.07 0.03 0.92 0.88 0.86 0.9
(forest) Clearing 0.075 0 0.01 0.05 0.07 0.03 0.92 0.88 0.86 0.9
Springwood 0.075 0 0.01 0.05 0.07 0.03 0.92 0.88 0.86 0.9
Exposed rock 0.2 0 0.01 0.05 0.07 0.03 0.79 0.75 0.73 0.77
Other mires 0.2 0 0.01 0.05 0.07 0.03 0.79 0.75 0.73 0.77
Direct surface runoff, drainage to stormwater pipes, lateral and groundwater flows, after water infiltration
into the ground, are the main transport pathways of contaminants to nearby water recipients. Transport
pathways of contaminants vary with landuse type; although Quaternary and topsoil types influence lateral
17
and groundwater flow. The runoff coefficient (Table 1) includes both percentages of direct surface runoff
and the sewer systems, thus these two pathways were separated and defined individually, based on the
properties of each landuse type in Table 2. To be able to determine
infiltration percentage of each landuse, the seasonal evaporation
percentages were generated from the available SMHI climate data
(www.smhi.se).
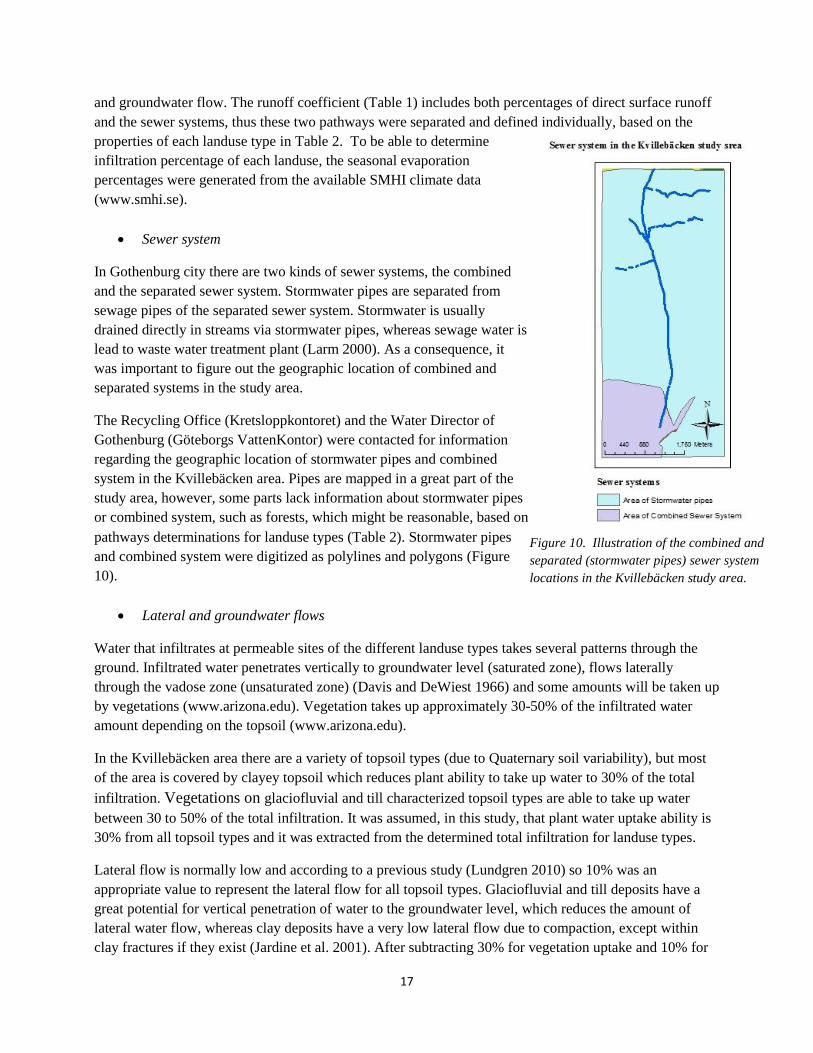
Sewer system
In Gothenburg city there are two kinds of sewer systems, the combined
and the separated sewer system. Stormwater pipes are separated from
sewage pipes of the separated sewer system. Stormwater is usually
drained directly in streams via stormwater pipes, whereas sewage water is
lead to waste water treatment plant (Larm 2000). As a consequence, it
was important to figure out the geographic location of combined and
separated systems in the study area.
The Recycling Office (Kretsloppkontoret) and the Water Director of
Gothenburg (Göteborgs VattenKontor) were contacted for information
regarding the geographic location of stormwater pipes and combined
system in the Kvillebäcken area. Pipes are mapped in a great part of the
study area, however, some parts lack information about stormwater pipes
or combined system, such as forests, which might be reasonable, based on
pathways determinations for landuse types (Table 2). Stormwater pipes
and combined system were digitized as polylines and polygons (Figure
10).
Lateral and groundwater flows
Water that infiltrates at permeable sites of the different landuse types takes several patterns through the
ground. Infiltrated water penetrates vertically to groundwater level (saturated zone), flows laterally
through the vadose zone (unsaturated zone) (Davis and DeWiest 1966) and some amounts will be taken up
by vegetations (www.arizona.edu). Vegetation takes up approximately 30-50% of the infiltrated water
amount depending on the topsoil (www.arizona.edu).
In the Kvillebäcken area there are a variety of topsoil types (due to Quaternary soil variability), but most
of the area is covered by clayey topsoil which reduces plant ability to take up water to 30% of the total
infiltration. Vegetations on glaciofluvial and till characterized topsoil types are able to take up water
between 30 to 50% of the total infiltration. It was assumed, in this study, that plant water uptake ability is
30% from all topsoil types and it was extracted from the determined total infiltration for landuse types.
Lateral flow is normally low and according to a previous study (Lundgren 2010) so 10% was an
appropriate value to represent the lateral flow for all topsoil types. Glaciofluvial and till deposits have a
great potential for vertical penetration of water to the groundwater level, which reduces the amount of
lateral water flow, whereas clay deposits have a very low lateral flow due to compaction, except within
clay fractures if they exist (Jardine et al. 2001). After subtracting 30% for vegetation uptake and 10% for
Figure 10. Illustration of the combined and
separated (stormwater pipes) sewer system
locations in the Kvillebäcken study area.
18
the lateral flow from total infiltration, the remaining percentage was given to the groundwater recharge,
which develops groundwater flow toward the stream in few cases. This situation is not representative for
clay deposits since they do not allow significant groundwater recharge or flow, and the largest amount of
infiltrated water is expected to evaporate back to the atmosphere in few days after the storm event (Davis
and DeWiest 1966).
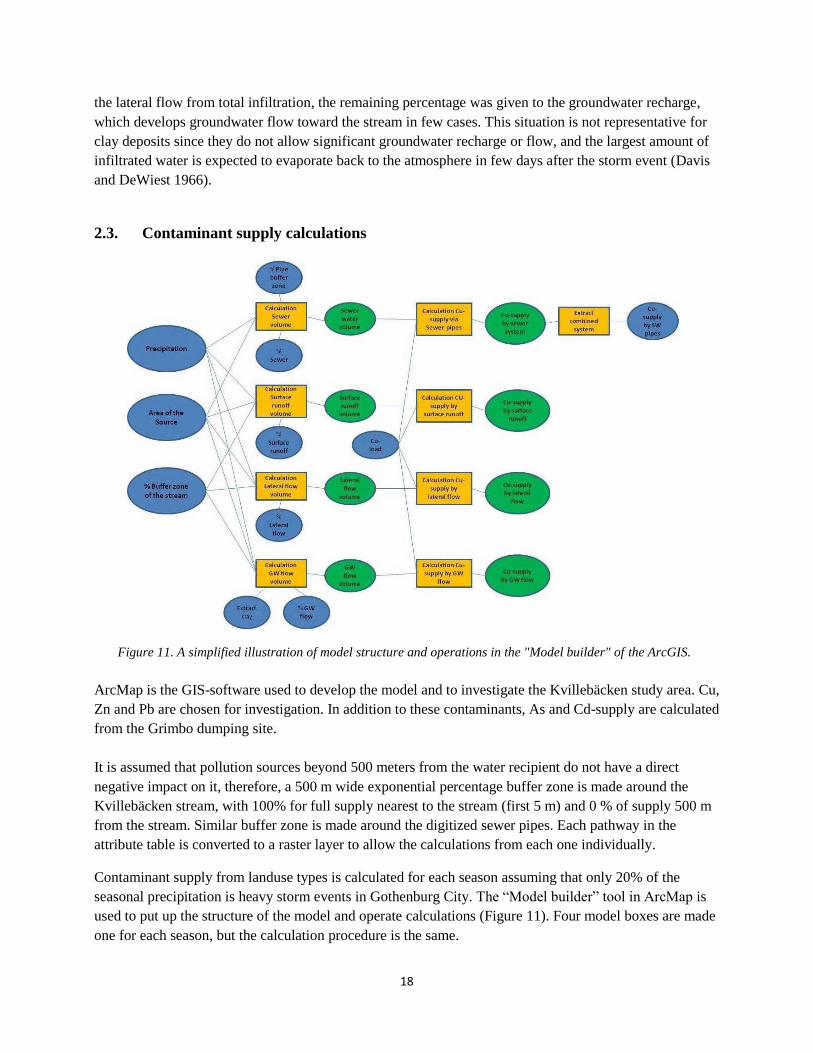
2.3. Contaminant supply calculations
Figure 11. A simplified illustration of model structure and operations in the "Model builder" of the ArcGIS.
ArcMap is the GIS-software used to develop the model and to investigate the Kvillebäcken study area. Cu,
Zn and Pb are chosen for investigation. In addition to these contaminants, As and Cd-supply are calculated
from the Grimbo dumping site.
It is assumed that pollution sources beyond 500 meters from the water recipient do not have a direct
negative impact on it, therefore, a 500 m wide exponential percentage buffer zone is made around the
Kvillebäcken stream, with 100% for full supply nearest to the stream (first 5 m) and 0 % of supply 500 m
from the stream. Similar buffer zone is made around the digitized sewer pipes. Each pathway in the
attribute table is converted to a raster layer to allow the calculations from each one individually.
Contaminant supply from landuse types is calculated for each season assuming that only 20% of the
seasonal precipitation is heavy storm events in Gothenburg City. The “Model builder” tool in ArcMap is
used to put up the structure of the model and operate calculations (Figure 11). Four model boxes are made
one for each season, but the calculation procedure is the same.
19
Figure 11 above is an overview of the “Model builder” concept and operations in the ArcMap. Model
inputs and parameters (such as precipitation data, area of a source and the percentage of a pathway) are
represented as blue boxes while green boxes are model outputs. Yellow boxes represent the tools used to
operate the calculation in this model: “Raster calculator”, “Zonal statistic” and “Extract by mask” tools.
Contaminant supply from landuse types by different pathways
Direct surface runoff:
The volume of surface runoff from landuse types is calculated with the “Raster calculator” function by
multiplying 20% of precipitation values over the study area, area of landuse types, runoff percentages
(Table 2) and the percentages buffer zone, around the stream, with each other. The equation below is an
example of the mathematical process done in the “Raster calculator” function.
Surface runoff (L) = Seasonal precipitation * 0.20 of the precipitation * Area of landuses types*
Runoff percentages * Percentages stream buffer zone
Surface runoff volume, of each season, is multiplied afterward with the standard concentration values of
contaminants (Table 1) to determine contaminant supply by surface runoff for each season.
Contaminant Supply to the stream (Cu, Pb or Zn) (g) = Surface runoff (L)* Standard
concentrations of contaminants
Drainage into Stormwater pipes:
The total stormwater volume via the sewer system is calculated at the beginning. Afterward, the area of
the combined sewer system is extracted from the calculations, since contaminated stormwater via
stormwater pipes of the separated system is the one drained directly to the water recipient, such as the
Kvillebäcken stream. Model inputs are multiplied with a percentages pipe buffer zone instead of the
percentages buffer zone around the stream.
Stormwater volume into sewer system (L) = Seasonal precipitation* 0.20 of the precipitation * Area
of landuses types* Sewer system percentages * Percentages pipes buffer zone
Contaminant supply via stormwater pipes separately is calculated for each season and for each
contaminant.
Contaminant Supply to the stream (Cu, Pb or Zn) (g) = Stormwater volume into stormwater pipes
(L) * Standard concentrations of contaminants
Lateral and Groundwater flow:
Lateral and groundwater flow volumes, for each season, are calculated with the same procedure explained
above.
20
Lateral/Groundwater flow volumes (L) = Seasonal precipitation * 0.20 of the precipitation *Area of
landuses types* Lateral/Groundwater percentages * Percentages stream buffer zone
Contaminant supply by lateral and groundwater flow was also calculated, but the inputs are multiplied by
50% since it is assumed that approximately half of contamination amounts will be taken up by the
surrounding soils and particles (Etemadi et al. 2003).
Contaminant Supply to the stream (Cu, Pb or Zn) (g) = (Seasonal lateral/Groundwater flow volume
* Standard concentrations of contaminants) * 0.50
A calculation example with actual values:
Determination of Cu-supply during storm events from an industrial site at the Kvillebäcken study area,
with an area of 2037992 m2, by direct surface runoff:
Surface runoff volume (L) = 0.20 (m/season)* 0.20 (20% of precipitation) * 2037992 (m2) * 0.17 (runoff
percentage) * 0.58 (e. g. of buffer percentage) * 1000 = 8E+6 L
Cu-supply to the stream (g) = 3.9E+7 (L) * 45 (µg/l) /1000000 = 362 g
The water volume is multiplied by 1000 in order to obtain the result in liter instead of cubic meter. Cu-
supply, on the other hand, is divided by 1000000 to convert the result from microgram to gram.
Contaminant supply from roads
Road runoff volume and contaminant supply is calculated with the same procedure explained above, for
each road type, each season and each contaminant (Cu, Pb and Zn).
According to StormTac (Table 1), the runoff coefficient for roads is 0.85 and contaminant standard values
are based on road traffic intensity (cars/day). 20% of the seasonal precipitation values, road type area, road
runoff coefficient, and the percentages from the stream buffer zone are multiplied in “Raster calculator” to
calculate road runoff volume. The calculated stormwater volume from each road type is multiplied with
the standard values of Cu, Pb and Zn.
Copper supply from copper roofs
Roofs have a runoff coefficient which is 0.9 (Table 1). The greatest stormwater volume will be drained
directly into drainage pipes. Therefore, it is assumed that only 10% of stormwater will directly runoff
from roofs, while 80% will drain into pipes. Cu-standard value for copper plated roofs (Table 1) is
multiplied afterward with the direct roof runoff to determine Cu-supply to the Kvillebäcken stream for
each season.
Contaminant supply from Grimbo dumping site
21
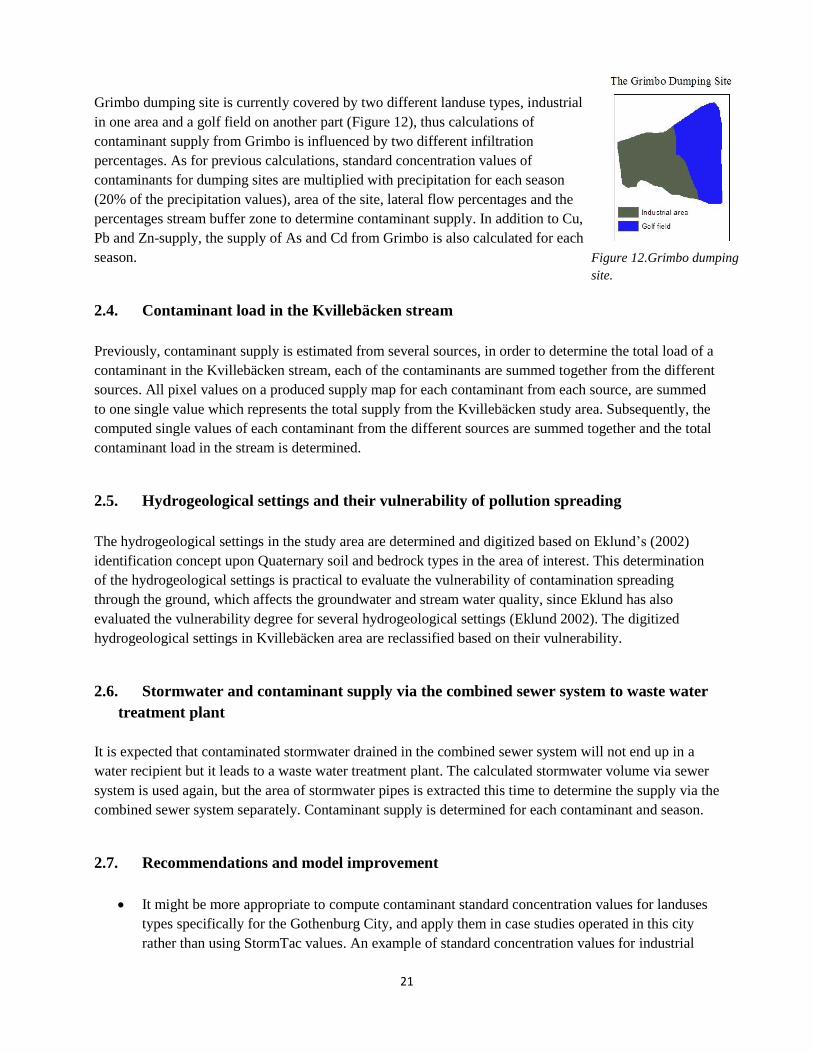
Grimbo dumping site is currently covered by two different landuse types, industrial
in one area and a golf field on another part (Figure 12), thus calculations of
contaminant supply from Grimbo is influenced by two different infiltration
percentages. As for previous calculations, standard concentration values of
contaminants for dumping sites are multiplied with precipitation for each season
(20% of the precipitation values), area of the site, lateral flow percentages and the
percentages stream buffer zone to determine contaminant supply. In addition to Cu,
Pb and Zn-supply, the supply of As and Cd from Grimbo is also calculated for each
season.
2.4. Contaminant load in the Kvillebäcken stream
Previously, contaminant supply is estimated from several sources, in order to determine the total load of a
contaminant in the Kvillebäcken stream, each of the contaminants are summed together from the different
sources. All pixel values on a produced supply map for each contaminant from each source, are summed
to one single value which represents the total supply from the Kvillebäcken study area. Subsequently, the
computed single values of each contaminant from the different sources are summed together and the total
contaminant load in the stream is determined.
2.5. Hydrogeological settings and their vulnerability of pollution spreading
The hydrogeological settings in the study area are determined and digitized based on Eklund’s (2002)
identification concept upon Quaternary soil and bedrock types in the area of interest. This determination
of the hydrogeological settings is practical to evaluate the vulnerability of contamination spreading
through the ground, which affects the groundwater and stream water quality, since Eklund has also
evaluated the vulnerability degree for several hydrogeological settings (Eklund 2002). The digitized
hydrogeological settings in Kvillebäcken area are reclassified based on their vulnerability.
2.6. Stormwater and contaminant supply via the combined sewer system to waste water
treatment plant
It is expected that contaminated stormwater drained in the combined sewer system will not end up in a
water recipient but it leads to a waste water treatment plant. The calculated stormwater volume via sewer
system is used again, but the area of stormwater pipes is extracted this time to determine the supply via the
combined sewer system separately. Contaminant supply is determined for each contaminant and season.
2.7. Recommendations and model improvement
It might be more appropriate to compute contaminant standard concentration values for landuses
types specifically for the Gothenburg City, and apply them in case studies operated in this city
rather than using StormTac values. An example of standard concentration values for industrial
Figure 12.Grimbo dumping
site.
22
0 710 1,420355 Meters
areas in Gothenburg City, are provided in a thesis project “Urban road dust near Göta älv River,
Gothenburg” (Alazem 2010).
Landuse map from the “Digital Kartbibliotek” has a relatively low resolution; therefore it might
be better to digitize landuse types of the study area manually, if a map with better resolution is not
available.
The estimation of pathways proportions might be improved by field determinations specifically
for landuse types in the Gothenburg city.
The percentage of lateral flow is set to 10% for all topsoil deposits. This percentage can be
modified for each topsoil type, especially for clay deposits, if a good argument is available.
For a better understanding of contaminant supply by groundwater flow so incorporating a
groundwater model might be useful.
It might be better to adjust the width of the percentages stream buffer zone based on the watershed
area of the stream.
The assumption of heavy storm events proportion needs further investigations based on the
weather conditions of Gothenburg.
3. Result
3.1. Contaminant sources in Kvillebäcken
study area
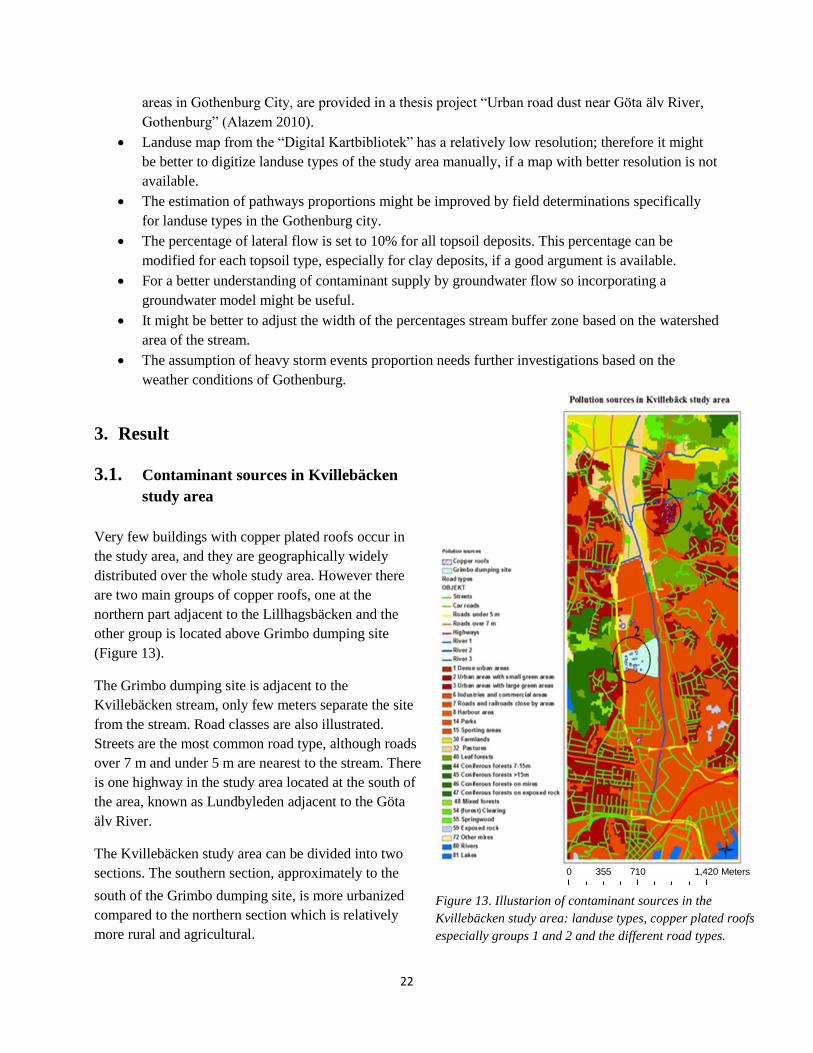
Very few buildings with copper plated roofs occur in
the study area, and they are geographically widely
distributed over the whole study area. However there
are two main groups of copper roofs, one at the
northern part adjacent to the Lillhagsbäcken and the
other group is located above Grimbo dumping site
(Figure 13).
The Grimbo dumping site is adjacent to the
Kvillebäcken stream, only few meters separate the site
from the stream. Road classes are also illustrated.
Streets are the most common road type, although roads
over 7 m and under 5 m are nearest to the stream. There
is one highway in the study area located at the south of
the area, known as Lundbyleden adjacent to the Göta
älv River.
The Kvillebäcken study area can be divided into two
sections. The southern section, approximately to the
south of the Grimbo dumping site, is more urbanized
compared to the northern section which is relatively
more rural and agricultural.
Figure 13. Illustarion of contaminant sources in the
Kvillebäcken study area: landuse types, copper plated roofs
especially groups 1 and 2 and the different road types.
23
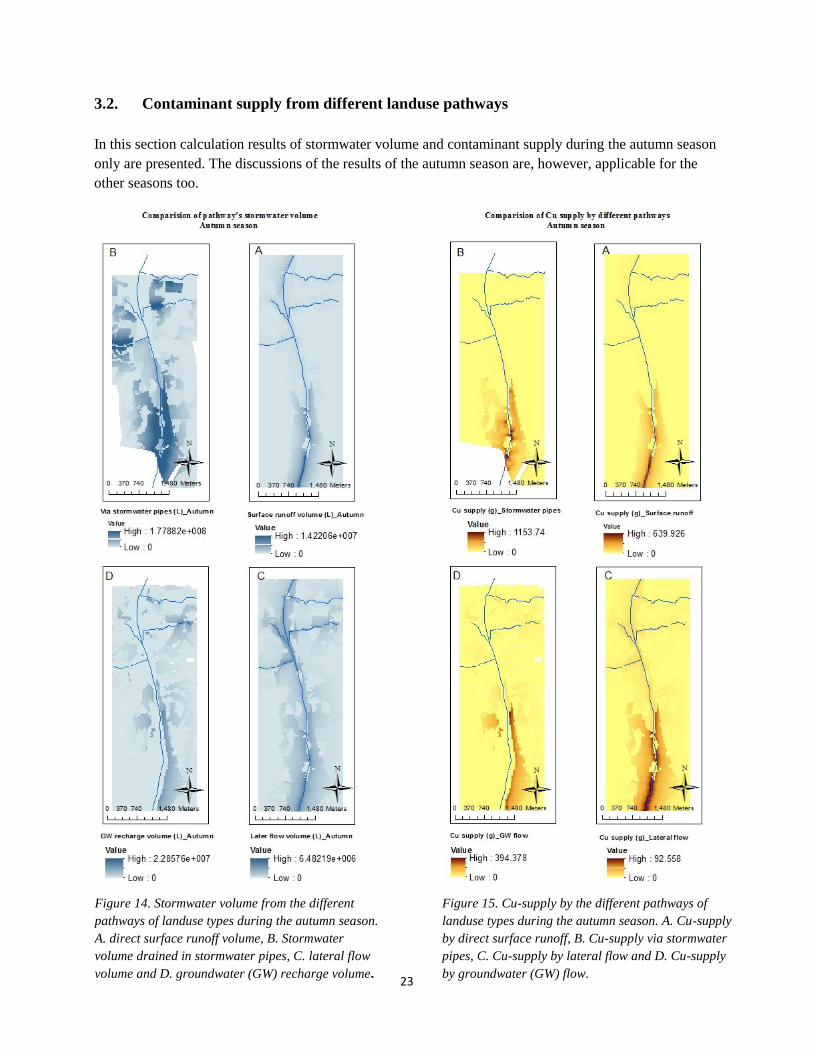
3.2. Contaminant supply from different landuse pathways
In this section calculation results of stormwater volume and contaminant supply during the autumn season
only are presented. The discussions of the results of the autumn season are, however, applicable for the
other seasons too.
A B
C D
Figure 14. Stormwater volume from the different
pathways of landuse types during the autumn season.
A. direct surface runoff volume, B. Stormwater
volume drained in stormwater pipes, C. lateral flow
volume and D. groundwater (GW) recharge volume.
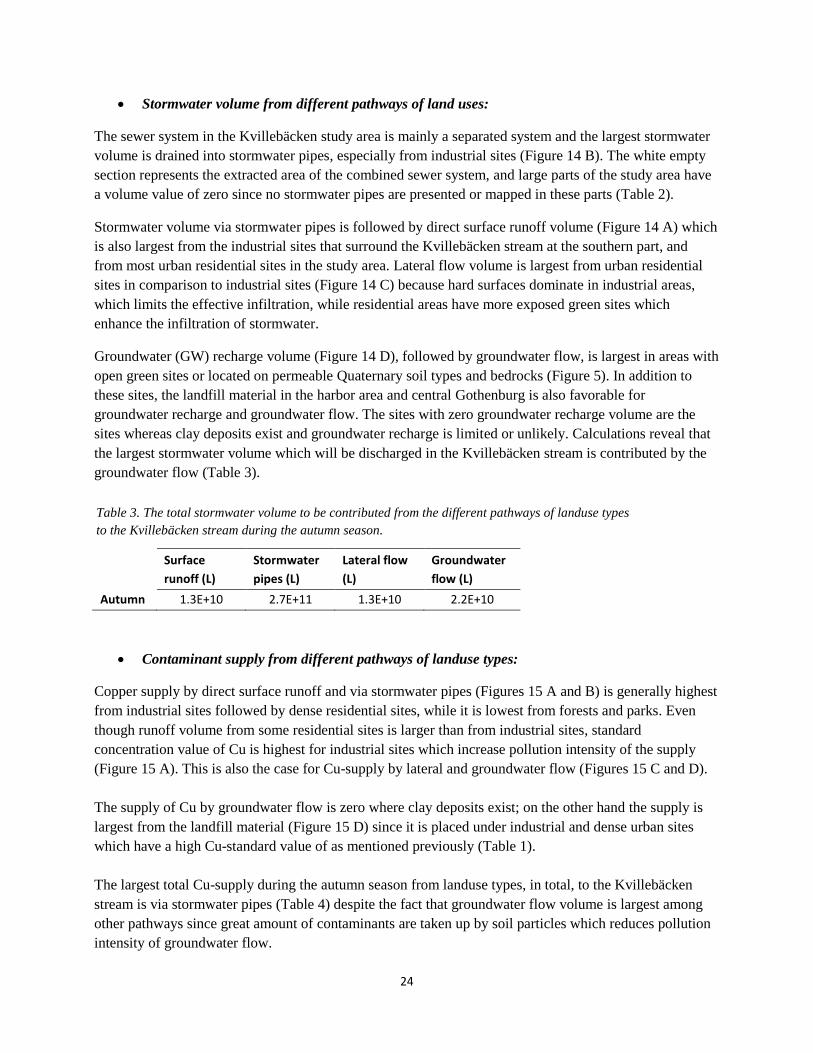
Figure 15. Cu-supply by the different pathways of
landuse types during the autumn season. A. Cu-supply
by direct surface runoff, B. Cu-supply via stormwater
pipes, C. Cu-supply by lateral flow and D. Cu-supply
by groundwater (GW) flow.
24
Stormwater volume from different pathways of land uses:
The sewer system in the Kvillebäcken study area is mainly a separated system and the largest stormwater
volume is drained into stormwater pipes, especially from industrial sites (Figure 14 B). The white empty
section represents the extracted area of the combined sewer system, and large parts of the study area have
a volume value of zero since no stormwater pipes are presented or mapped in these parts (Table 2).
Stormwater volume via stormwater pipes is followed by direct surface runoff volume (Figure 14 A) which
is also largest from the industrial sites that surround the Kvillebäcken stream at the southern part, and
from most urban residential sites in the study area. Lateral flow volume is largest from urban residential
sites in comparison to industrial sites (Figure 14 C) because hard surfaces dominate in industrial areas,
which limits the effective infiltration, while residential areas have more exposed green sites which
enhance the infiltration of stormwater.
Groundwater (GW) recharge volume (Figure 14 D), followed by groundwater flow, is largest in areas with
open green sites or located on permeable Quaternary soil types and bedrocks (Figure 5). In addition to
these sites, the landfill material in the harbor area and central Gothenburg is also favorable for
groundwater recharge and groundwater flow. The sites with zero groundwater recharge volume are the
sites whereas clay deposits exist and groundwater recharge is limited or unlikely. Calculations reveal that
the largest stormwater volume which will be discharged in the Kvillebäcken stream is contributed by the
groundwater flow (Table 3).
Surface
runoff (L)
Stormwater
pipes (L)
Lateral flow
(L)
Groundwater
flow (L)
Autumn 1.3E+10 2.7E+11 1.3E+10 2.2E+10
Contaminant supply from different pathways of landuse types:
Copper supply by direct surface runoff and via stormwater pipes (Figures 15 A and B) is generally highest
from industrial sites followed by dense residential sites, while it is lowest from forests and parks. Even
though runoff volume from some residential sites is larger than from industrial sites, standard
concentration value of Cu is highest for industrial sites which increase pollution intensity of the supply
(Figure 15 A). This is also the case for Cu-supply by lateral and groundwater flow (Figures 15 C and D).
The supply of Cu by groundwater flow is zero where clay deposits exist; on the other hand the supply is
largest from the landfill material (Figure 15 D) since it is placed under industrial and dense urban sites
which have a high Cu-standard value of as mentioned previously (Table 1).
The largest total Cu-supply during the autumn season from landuse types, in total, to the Kvillebäcken
stream is via stormwater pipes (Table 4) despite the fact that groundwater flow volume is largest among
other pathways since great amount of contaminants are taken up by soil particles which reduces pollution
intensity of groundwater flow.
Table 3. The total stormwater volume to be contributed from the different pathways of landuse types
to the Kvillebäcken stream during the autumn season.
25
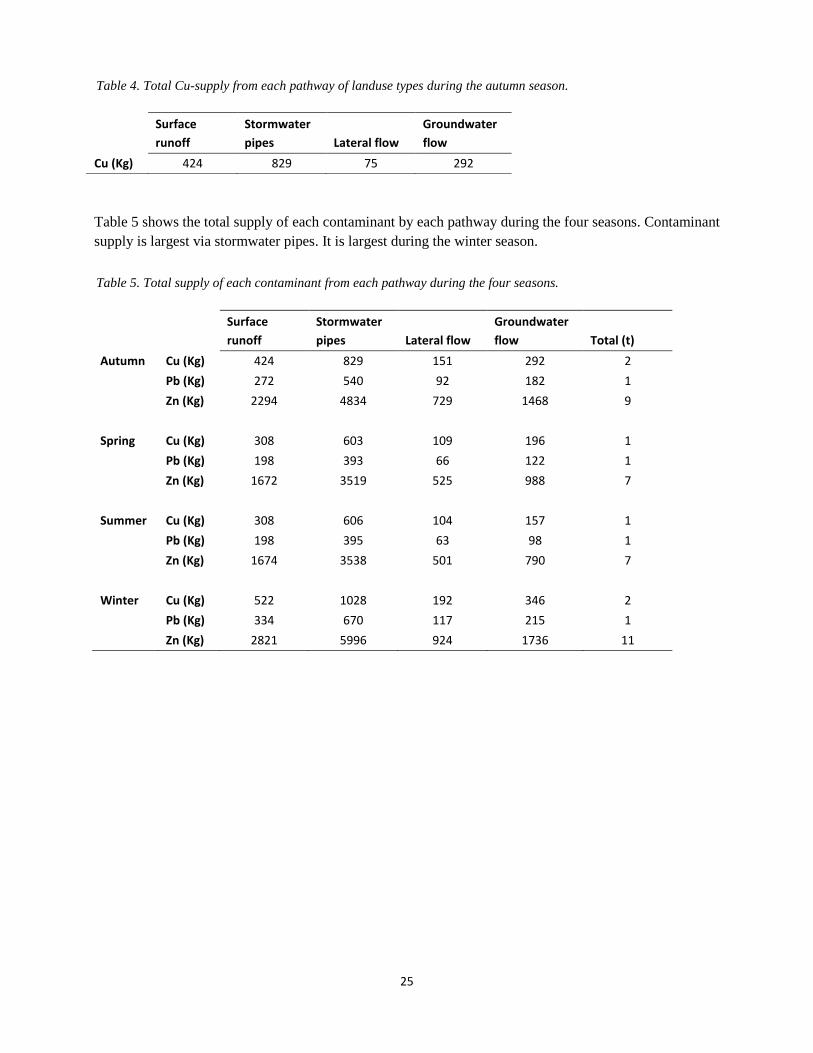
Table 5 shows the total supply of each contaminant by each pathway during the four seasons. Contaminant
supply is largest via stormwater pipes. It is largest during the winter season.
Surface
runoff
Stormwater
pipes Lateral flow
Groundwater
flow Total (t)
Autumn Cu (Kg) 424 829 151 292 2
Pb (Kg) 272 540 92 182 1
Zn (Kg) 2294 4834 729 1468 9
Spring Cu (Kg) 308 603 109 196 1
Pb (Kg) 198 393 66 122 1
Zn (Kg) 1672 3519 525 988 7
Summer Cu (Kg) 308 606 104 157 1
Pb (Kg) 198 395 63 98 1
Zn (Kg) 1674 3538 501 790 7
Winter Cu (Kg) 522 1028 192 346 2
Pb (Kg) 334 670 117 215 1
Zn (Kg) 2821 5996 924 1736 11
Surface
runoff
Stormwater
pipes Lateral flow
Groundwater
flow
Cu (Kg) 424 829 75 292
Table 4. Total Cu-supply from each pathway of landuse types during the autumn season.
Table 5. Total supply of each contaminant from each pathway during the four seasons.
26
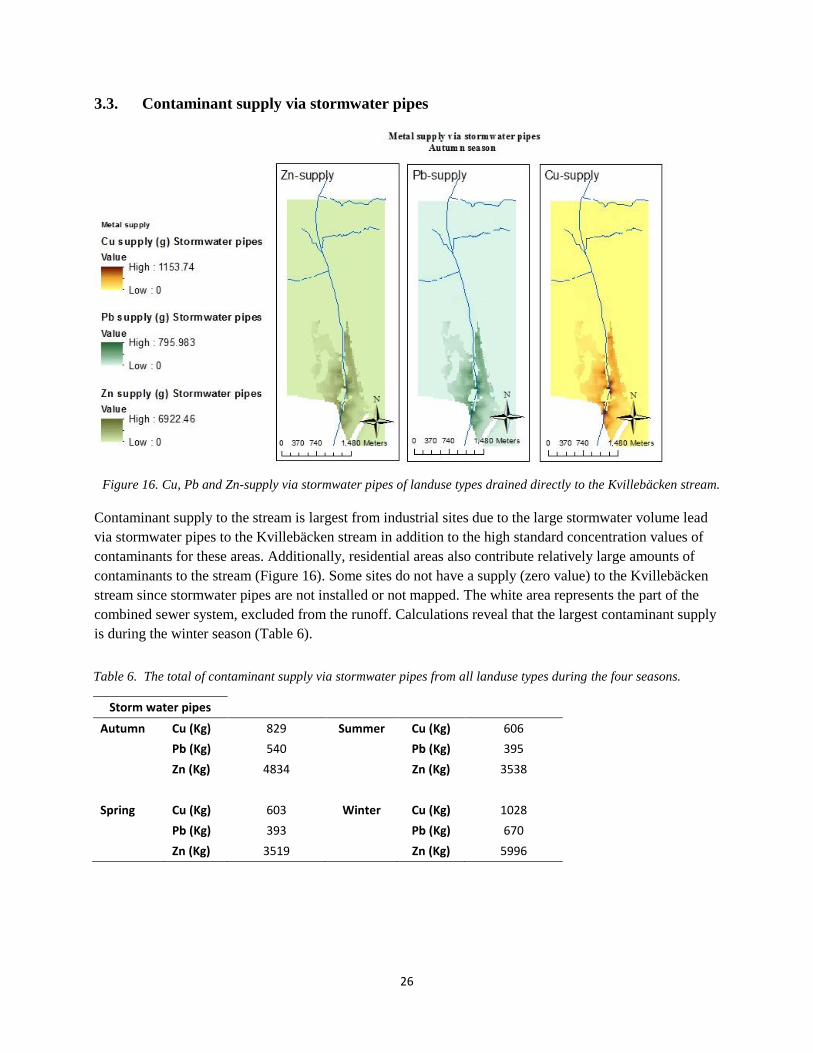
3.3. Contaminant supply via stormwater pipes
Contaminant supply to the stream is largest from industrial sites due to the large stormwater volume lead
via stormwater pipes to the Kvillebäcken stream in addition to the high standard concentration values of
contaminants for these areas. Additionally, residential areas also contribute relatively large amounts of
contaminants to the stream (Figure 16). Some sites do not have a supply (zero value) to the Kvillebäcken
stream since stormwater pipes are not installed or not mapped. The white area represents the part of the
combined sewer system, excluded from the runoff. Calculations reveal that the largest contaminant supply
is during the winter season (Table 6).
Storm water pipes
Autumn Cu (Kg) 829 Summer Cu (Kg) 606
Pb (Kg) 540
Pb (Kg) 395
Zn (Kg) 4834
Zn (Kg) 3538
Spring Cu (Kg) 603 Winter Cu (Kg) 1028
Pb (Kg) 393
Pb (Kg) 670
Zn (Kg) 3519 Zn (Kg) 5996
Figure 16. Cu, Pb and Zn-supply via stormwater pipes of landuse types drained directly to the Kvillebäcken stream.
Table 6. The total of contaminant supply via stormwater pipes from all landuse types during the four seasons.
27
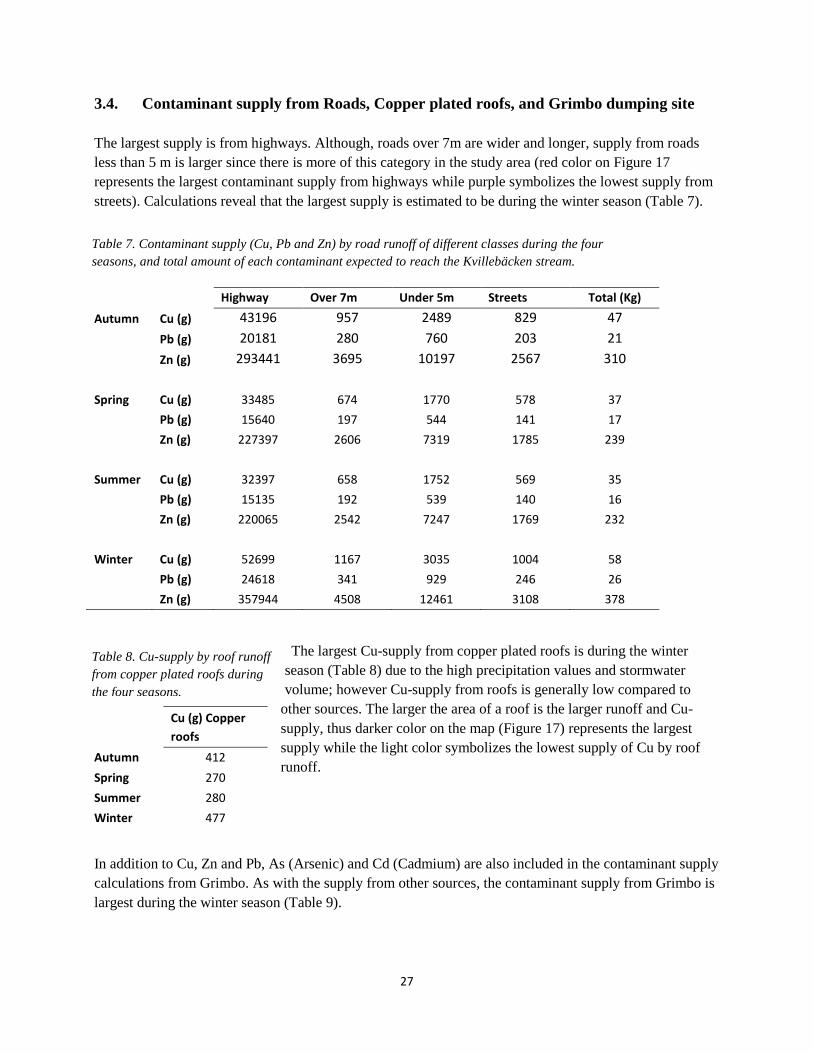
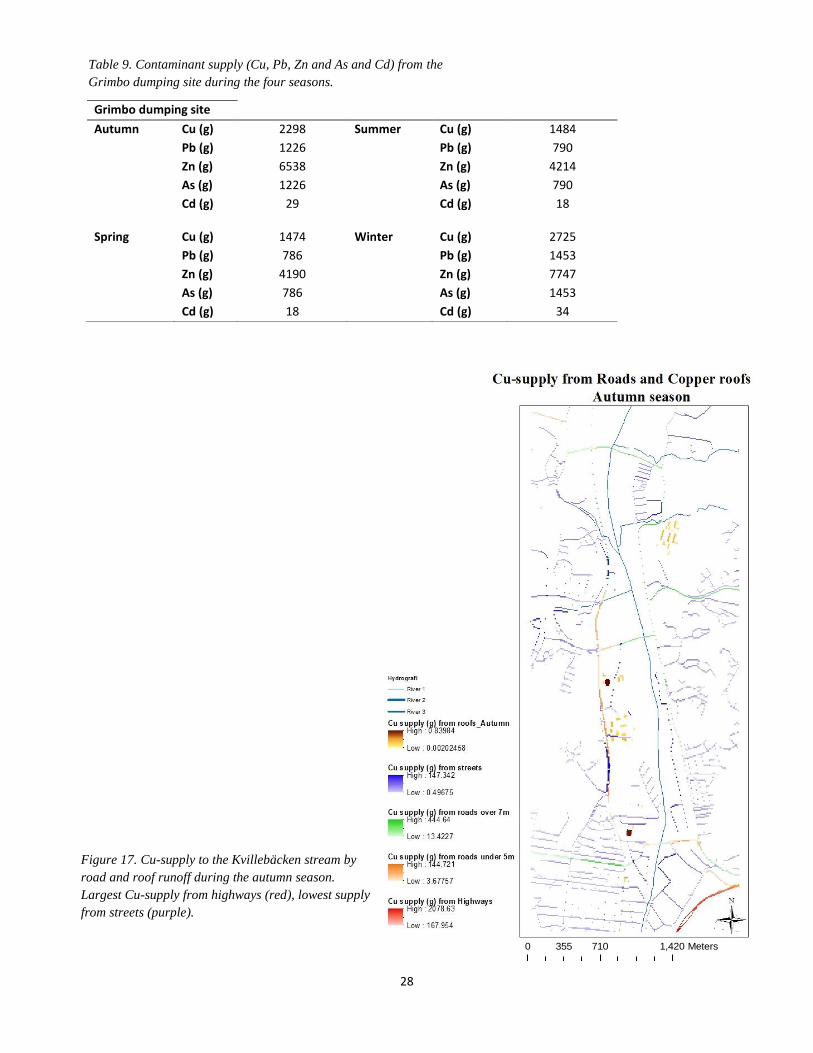
3.4. Contaminant supply from Roads, Copper plated roofs, and Grimbo dumping site
The largest supply is from highways. Although, roads over 7m are wider and longer, supply from roads
less than 5 m is larger since there is more of this category in the study area (red color on Figure 17
represents the largest contaminant supply from highways while purple symbolizes the lowest supply from
streets). Calculations reveal that the largest supply is estimated to be during the winter season (Table 7).
The largest Cu-supply from copper plated roofs is during the winter
season (Table 8) due to the high precipitation values and stormwater
volume; however Cu-supply from roofs is generally low compared to
other sources. The larger the area of a roof is the larger runoff and Cu-
supply, thus darker color on the map (Figure 17) represents the largest
supply while the light color symbolizes the lowest supply of Cu by roof
runoff.
In addition to Cu, Zn and Pb, As (Arsenic) and Cd (Cadmium) are also included in the contaminant supply
calculations from Grimbo. As with the supply from other sources, the contaminant supply from Grimbo is
largest during the winter season (Table 9).
Highway Over 7m Under 5m Streets Total (Kg)
Autumn Cu (g) 43196 957 2489 829 47
Pb (g) 20181 280 760 203 21
Zn (g) 293441 3695 10197 2567 310
Spring Cu (g) 33485 674 1770 578 37
Pb (g) 15640 197 544 141 17
Zn (g) 227397 2606 7319 1785 239
Summer Cu (g) 32397 658 1752 569 35
Pb (g) 15135 192 539 140 16
Zn (g) 220065 2542 7247 1769 232
Winter Cu (g) 52699 1167 3035 1004 58
Pb (g) 24618 341 929 246 26
Zn (g) 357944 4508 12461 3108 378
Cu (g) Copper
roofs
Autumn 412
Spring 270
Summer 280
Winter 477
Table 7. Contaminant supply (Cu, Pb and Zn) by road runoff of different classes during the four
seasons, and total amount of each contaminant expected to reach the Kvillebäcken stream.
Table 8. Cu-supply by roof runoff
from copper plated roofs during
the four seasons.
28
0 710 1,420355 Meters
Grimbo dumping site
Autumn Cu (g) 2298 Summer Cu (g) 1484
Pb (g) 1226
Pb (g) 790
Zn (g) 6538
Zn (g) 4214
As (g) 1226
As (g) 790
Cd (g) 29
Cd (g) 18
Spring Cu (g) 1474 Winter Cu (g) 2725
Pb (g) 786
Pb (g) 1453
Zn (g) 4190
Zn (g) 7747
As (g) 786
As (g) 1453
Cd (g) 18 Cd (g) 34
Figure 17. Cu-supply to the Kvillebäcken stream by
road and roof runoff during the autumn season.
Largest Cu-supply from highways (red), lowest supply
from streets (purple).
Figure 17. Cu-supply to the Kvillebäcken stream by
road and roof runoff during the autumn season.
Largest Cu-supply from highways (red), lowest supply
from streets (purple).
Table 9. Contaminant supply (Cu, Pb, Zn and As and Cd) from the
Grimbo dumping site during the four seasons.
29
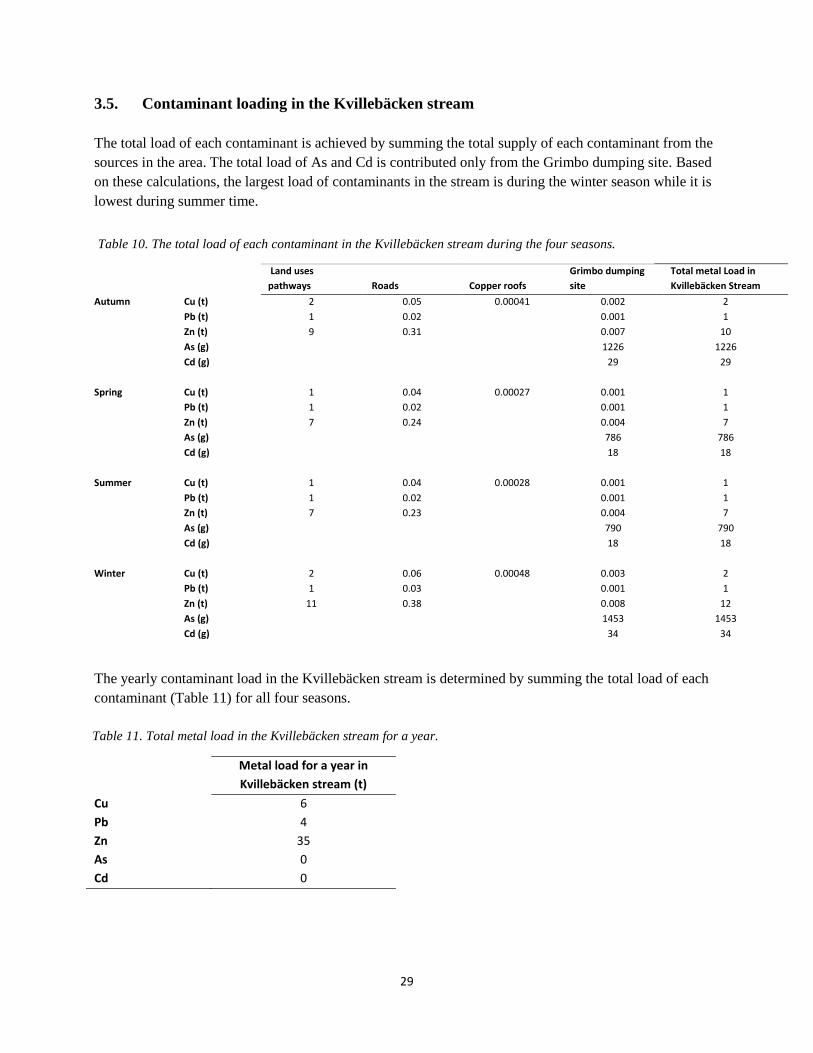
3.5. Contaminant loading in the Kvillebäcken stream
The total load of each contaminant is achieved by summing the total supply of each contaminant from the
sources in the area. The total load of As and Cd is contributed only from the Grimbo dumping site. Based
on these calculations, the largest load of contaminants in the stream is during the winter season while it is
lowest during summer time.
The yearly contaminant load in the Kvillebäcken stream is determined by summing the total load of each
contaminant (Table 11) for all four seasons.
Land uses
pathways Roads Copper roofs
Grimbo dumping
site
Total metal Load in
Kvillebäcken Stream
Autumn Cu (t) 2 0.05 0.00041 0.002 2
Pb (t) 1 0.02
0.001 1
Zn (t) 9 0.31
0.007 10
As (g)
1226 1226
Cd (g)
29 29
Spring Cu (t) 1 0.04 0.00027 0.001 1
Pb (t) 1 0.02
0.001 1
Zn (t) 7 0.24
0.004 7
As (g)
786 786
Cd (g)
18 18
Summer Cu (t) 1 0.04 0.00028 0.001 1
Pb (t) 1 0.02
0.001 1
Zn (t) 7 0.23
0.004 7
As (g)
790 790
Cd (g)
18 18
Winter Cu (t) 2 0.06 0.00048 0.003 2
Pb (t) 1 0.03
0.001 1
Zn (t) 11 0.38
0.008 12
As (g)
1453 1453
Cd (g) 34 34
Metal load for a year in
Kvillebäcken stream (t)
Cu 6
Pb 4
Zn 35
As 0
Cd 0
Table 10. The total load of each contaminant in the Kvillebäcken stream during the four seasons.
Table 11. The total load of each contaminant in the Kvillebäcken stream during the four seasons.
Table 11. Total metal load in the Kvillebäcken stream for a year.
Table 12. Total metal load in the Kvillebäcken stream for a year.
30
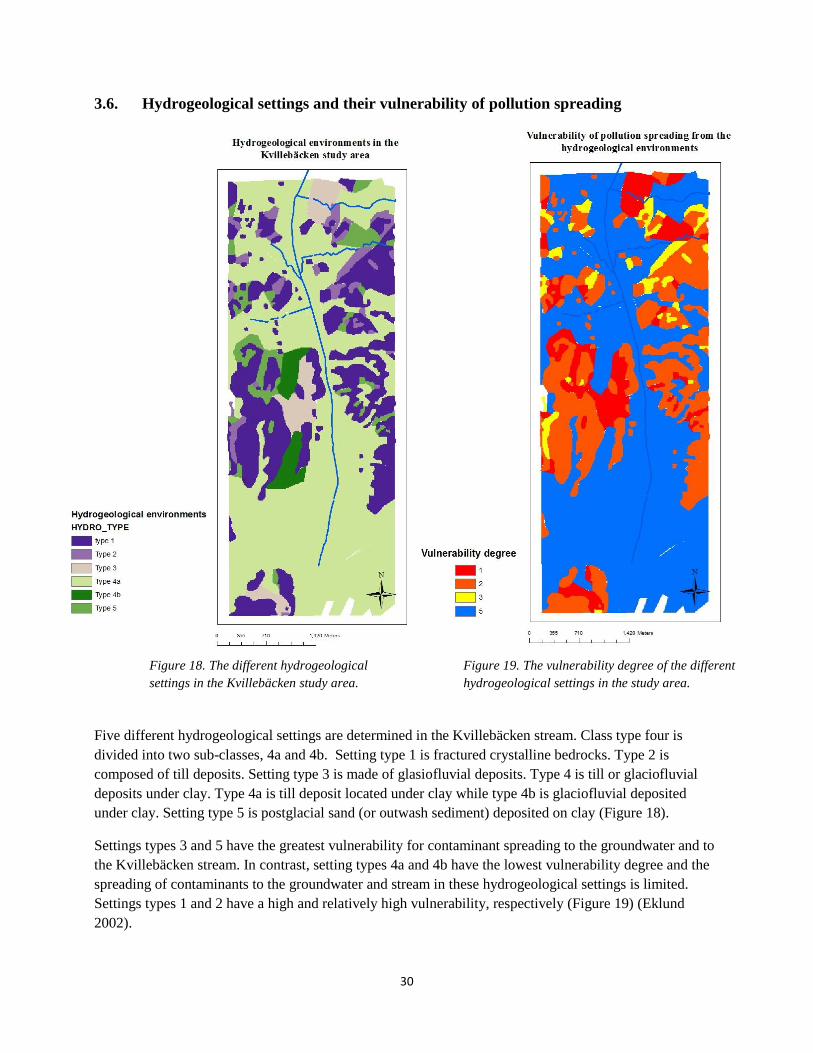
3.6. Hydrogeological settings and their vulnerability of pollution spreading
Five different hydrogeological settings are determined in the Kvillebäcken stream. Class type four is
divided into two sub-classes, 4a and 4b. Setting type 1 is fractured crystalline bedrocks. Type 2 is
composed of till deposits. Setting type 3 is made of glasiofluvial deposits. Type 4 is till or glaciofluvial
deposits under clay. Type 4a is till deposit located under clay while type 4b is glaciofluvial deposited
under clay. Setting type 5 is postglacial sand (or outwash sediment) deposited on clay (Figure 18).
Settings types 3 and 5 have the greatest vulnerability for contaminant spreading to the groundwater and to
the Kvillebäcken stream. In contrast, setting types 4a and 4b have the lowest vulnerability degree and the
spreading of contaminants to the groundwater and stream in these hydrogeological settings is limited.
Settings types 1 and 2 have a high and relatively high vulnerability, respectively (Figure 19) (Eklund
2002).
Figure 18. The different hydrogeological
settings in the Kvillebäcken study area.
Figure 18. The different hydrogeological
settings in the Kvillebäcken study area.
Figure 19. The vulnerability degree of the different
hydrogeological settings in the study area.
Figure 19. The vulnerability degree of the different
hydrogeological settings in the study area.
31
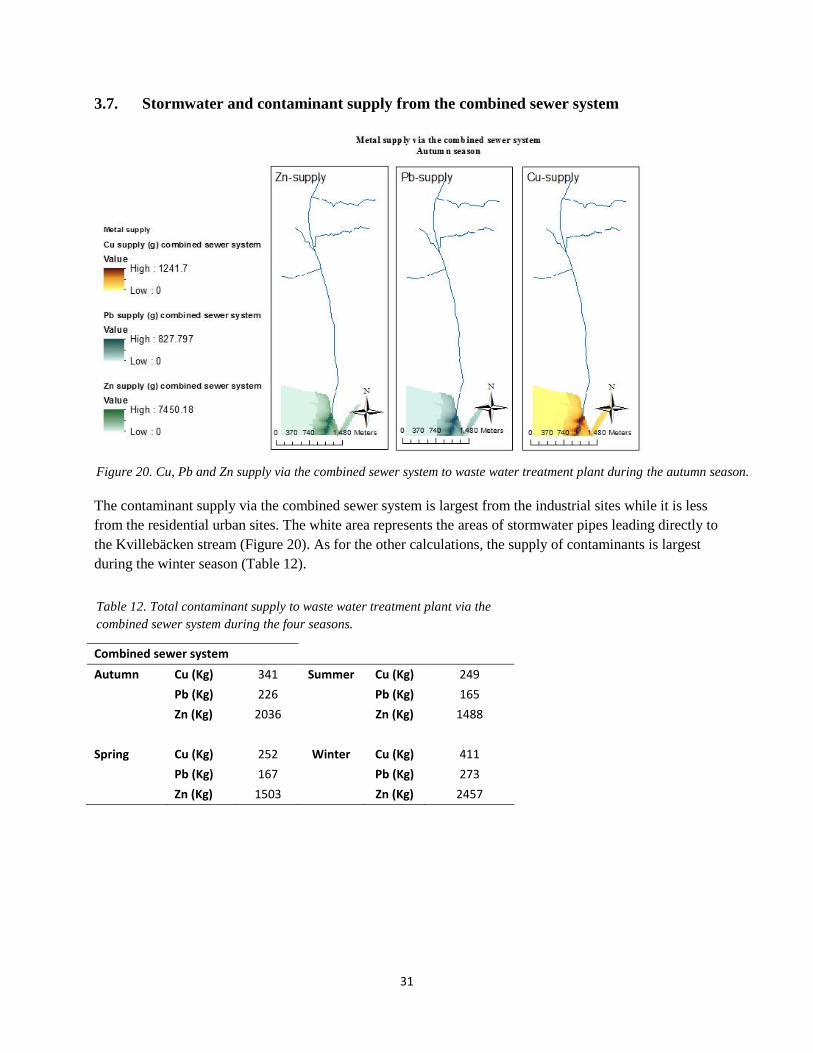
3.7. Stormwater and contaminant supply from the combined sewer system
The contaminant supply via the combined sewer system is largest from the industrial sites while it is less
from the residential urban sites. The white area represents the areas of stormwater pipes leading directly to
the Kvillebäcken stream (Figure 20). As for the other calculations, the supply of contaminants is largest
during the winter season (Table 12).
Combined sewer system
Autumn Cu (Kg) 341 Summer Cu (Kg) 249
Pb (Kg) 226
Pb (Kg) 165
Zn (Kg) 2036
Zn (Kg) 1488
Spring Cu (Kg) 252 Winter Cu (Kg) 411
Pb (Kg) 167
Pb (Kg) 273
Zn (Kg) 1503 Zn (Kg) 2457
Figure 20. Cu, Pb and Zn supply via the combined sewer system to waste water treatment plant during the autumn season.
Figure 20. Cu, Pb and Zn supply via the combined sewer system to waste water treatment plant during the autumn season.
Table 12. Total contaminant supply to waste water treatment plant via the
combined sewer system during the four seasons.
Table 13. Total contaminant supply to waste water treatment plant via the
combined sewer system during the four seasons.
32
4. Discussion
A GIS-based model makes it possible to investigate the environmental condition of urban recipients, such
as the Kvillebäcken stream, with different climate scenarios. In this particular case study, investigation of
contaminant supply to the Kvillebäcken stream is carried out for four scenarios (seasons) during a year.
However, contaminant supply and loading in the Kvillebäcken stream can be calculated with the GIS-
based model for one storm event, daily variations over a month or for the effect of future climate changes,
such as for 15, 30 or 50 year scenarios.
It was calculated with the GIS-based model that contaminant supply from the Kvillebäcken study area is
largest during the winter season due to high precipitation values, while it is lowest during the summer
season. The total load in the Kvillebäcken stream is also largest for the winter season, but during this
season it is expected that most precipitation (in Sweden) is snow which accumulates on surfaces and melts
gradually resulting a delay of contaminant transportation to the stream. During the summer season, on the
contrary, the accumulated contaminants on hard surfaces will flush rapidly by the first heavy rain event
after a relatively dry period (Göteborgs va-verket 2001, Vägverket 2004, TRV rådsdokument 2011),
which makes pollution intensity of the first flush by direct surface runoff, drainage into stormwater pipes,
roof runoff and infiltration high. A large amount of the total load (Tables 10 and 11) is expected to be
concentrated in the southern section of the Kvillebäcken stream, approximately to the south of Grimbo,
because of the pollution activities in this part of the study area, as shown on landuse map (Figure 9).
The area of a pollution source influences greatly the supply volume of contaminants. Some landuse types,
such as industrial and residential sites, are major sources of contaminants to the Kvillebäcken stream
(Table 10) because of their large surface area compared to roads, even if some road types such as
highways and roads over 7 m have higher standard concentration values of contaminants than most other
landuse types (Table 1). Copper plated roofs have very small areas and therefore the Cu-supply from this
source is much less than roads and other landuse types (Tables 5, 7and 8). Compared to other calculations
in Gothenburg City by SMHI and SGI, the obtained contaminant supply and total load by this GIS-based
model in the Kvillebäcken stream is large. This might be due to the standard contaminant concentration
values which are determined for Stockholm environments and not specifically for Gothenburg
environments and activities. Therefore, calculations of contaminant supply to the Kvillebäcken stream, or
any site in Gothenburg, can be improved by including standard contaminant concentration values
computed specially for Gothenburg environments. Groundwater modeling is usually limited with the
ArcGIS; it was difficult to estimate the groundwater flow volume toward the Kvillebäcken stream after the
recharge. The calculated groundwater recharge volume (Figure 14D) was assumed to be the volume of the
groundwater flow (Table 13). This might be a source of error in contaminant supply calculation since the
groundwater flow to the stream is probably small (less than the suggested volume in the Table 13) and
from specific sites only, such as the Grimbo dumping site and the landfill material in central Gothenburg.
In addition to direct surface runoff and the drainage into stormwater pipes, stormwater infiltrates into the
ground in some green or permeable surfaces (Göteborgs va-verket 2001) of the Kvillebäcken study area,
to develop lateral and groundwater flow toward the stream. These permeable surfaces belong to the
classified hydrogeological settings (Figure 18) which each have a high vulnerability for contaminant
spreading (Figure 19). Lateral and groundwater flow can be rapid and spread contaminants quickly from
hydrogeological settings with highest vulnerability (Eklund 2002), which are environments 3 and 5.
33
Lateral flow through weathered and fractured clay deposits (Figure 14C) is expected to occur during the
first 3 to 4 days after a storm event, since clay expands and become saturated and all empty pores or mud
clay cracks will be filled, which than limits or prevent the lateral flow toward the stream (Davis and
DeWiest 1966). Consequently, the estimated contaminant supply with lateral flow through clay (Figure
15C) to the Kvillebäcken stream occurs during the first 3 to 4 days after a storm event.
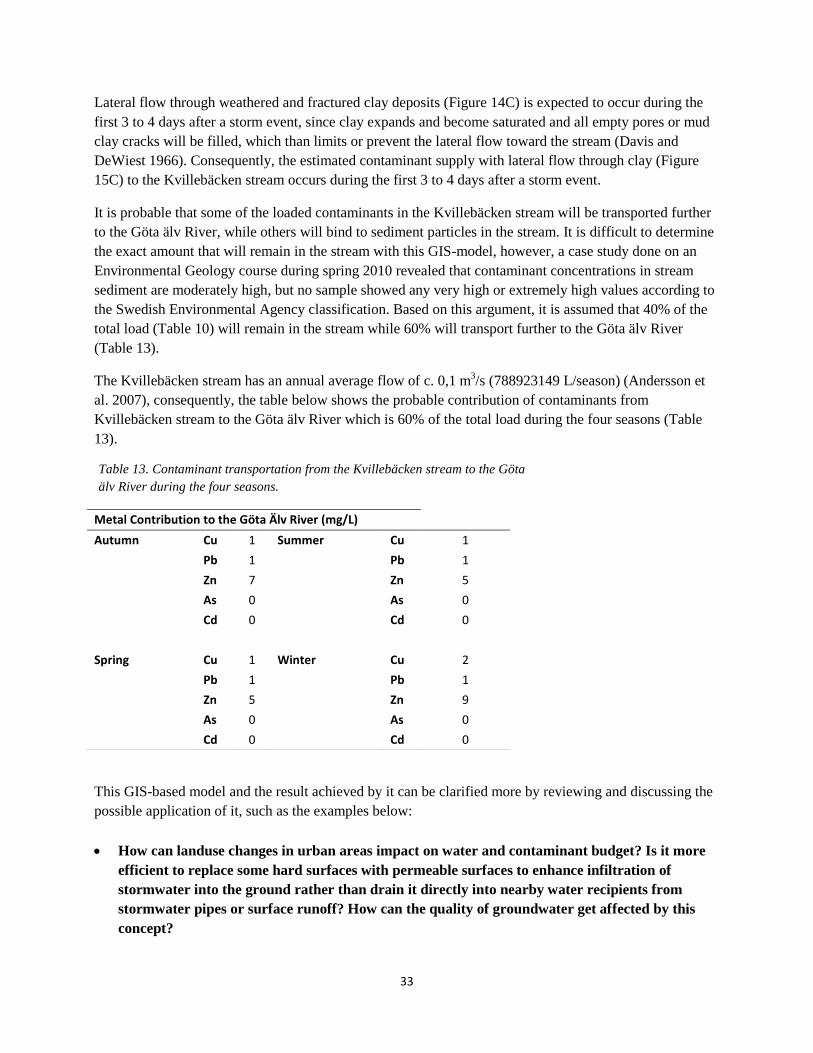
It is probable that some of the loaded contaminants in the Kvillebäcken stream will be transported further
to the Göta älv River, while others will bind to sediment particles in the stream. It is difficult to determine
the exact amount that will remain in the stream with this GIS-model, however, a case study done on an
Environmental Geology course during spring 2010 revealed that contaminant concentrations in stream
sediment are moderately high, but no sample showed any very high or extremely high values according to
the Swedish Environmental Agency classification. Based on this argument, it is assumed that 40% of the
total load (Table 10) will remain in the stream while 60% will transport further to the Göta älv River
(Table 13).
The Kvillebäcken stream has an annual average flow of c. 0,1 m3/s (788923149 L/season) (Andersson et
al. 2007), consequently, the table below shows the probable contribution of contaminants from
Kvillebäcken stream to the Göta älv River which is 60% of the total load during the four seasons (Table
13).
This GIS-based model and the result achieved by it can be clarified more by reviewing and discussing the
possible application of it, such as the examples below:
How can landuse changes in urban areas impact on water and contaminant budget? Is it more
efficient to replace some hard surfaces with permeable surfaces to enhance infiltration of
stormwater into the ground rather than drain it directly into nearby water recipients from
stormwater pipes or surface runoff? How can the quality of groundwater get affected by this
concept?
Metal Contribution to the Göta Älv River (mg/L)
Autumn Cu 1 Summer Cu 1
Pb 1
Pb 1
Zn 7
Zn 5
As 0
As 0
Cd 0
Cd 0
Spring Cu 1 Winter Cu 2
Pb 1
Pb 1
Zn 5
Zn 9
As 0
As 0
Cd 0 Cd 0
Table 13. Contaminant transportation from the Kvillebäcken stream to the Göta
älv River during the four seasons.
Table 14. Contaminant transportation from the Kvillebäcken stream to the Göta
älv River during four seasons.
34
Contaminant supply by landuses pathways is relatively easy to estimate since landuse types can be defined
in a study area and pathways proportions can be determined for each landuse type. Calculation of
contaminant supply from the Kvillebäcken study area to the Kvillebäcken stream revealed that the largest
supply is conducted from landuse types. Thus, changes that might occur on landuse types in an area would
affect the budgeting of stormwater volume and contaminant supply.
Stormwater volume by direct surface runoff and via stormwater pipes is large from the Kvillebäcken study
area. Therefore, if hard surfaces replaced with permeable surfaces more water is expected to infiltrate into
the ground rather than directly runoff from these surfaces. On the other hand, replacing these hard surfaces
may also decrease the amount of stormwater drained directly into stormwater pipes due to infiltration
enhancement. This replacement and the increasing of stormwater infiltration into the ground will
consequently raise groundwater recharge and thereafter water discharge into the stream by lateral and
groundwater flow (Göteborgs va-verket 2001). Direct surface runoff and drainage into stormwater pipes
are largest from industrial and urban residential areas whereas hard surfaces dominate thus, replacement
and minimizing of hard surfaces, and consequently stormwater pipes, should take place in these sites if
necessary. However, contaminant supply is largest by direct surface runoff and via stormwater pipes from
these site (Table 5) hence, it might be risky to replace these with permeable surfaces that increase
infiltration and elevates contaminant amounts in the ground and groundwater as a consequence (Göteborgs
va-verket 2001).
This can be further evaluated with the hydrogeological settings and their vulnerability differences. Most
industrial sites in Kvillebäcken study area are located on hydrogeolocical setting type 4a (Figures 13 and
18) which has a vulnerability of 5 (Figure 19). This indicates that groundwater in hydrogeological setting
4a will not be negatively affected by hard surfaces and stormwater pipes replacement since it is a confined
type. Additionally, later flow in the upper most clayey topsoil of this setting is very low due to the low
conductivity value (Eklund 2002), which limits contaminant transportation to the Kvillebäcken stream,
and it is expected that stormwater will evaporates back to the atmosphere leaving behind contaminants
which are expected to be taken up by clay particles and vegetations. Replacement of hard surfaces and
stormwater pipes in these sites might be a good option in order to reduce contaminant supply by surface
runoff and via stormwater pipes to the Kvillebäcken stream without negatively affecting the preserved
groundwater.
Some urban residential sites are also located on setting types 1, 3 and 5, which are unconfined
hydrogeological settings (Figures 13 and 18). These settings have a vulnerability of 1 (Figure 19) and
aquifer components and groundwater preserved in these are very sensitive. Since these sites are very
sensitive, replacement of hard surfaces and stormwater pipes and infiltration enhancement will affect the
groundwater quality negatively due to contaminant increases. Lateral and groundwater flow in these
settings is larger than for type 4a, so contaminant transportation to the stream is not limited and
replacement of hard surfaces is not very efficient in sites located on such hydrogeological settings.
Contaminant supply is still expected to be significant by lateral and groundwater flow after the
replacement of hard surfaces and stormwater pipes, although contaminants infiltrated into the ground are
usually reduced by at least 50% due to soil and sediment particles and plant roots up-taken (Etemadi et al.
2003, www.arizona.edu).
35
There is a local zoning plan for “Östra Kvillebäcken” in the Backaplan area (also included in the
Kvillebäcken study area) to build new apartments instead at the old industrial site and to replace hard
surfaces with as much permeable surfaces as possible. The local plan of the site suggests that hard
surfaces replacement and infiltration enhancement is an effective solution to limit direct surface runoff to
the Kvillebäcken stream. However, the local plan did not conceder contaminant supply or the possible
negative effect of infiltration on the groundwater (Göteborgs stadsbyggnadskontor 2008). The site is
located on a thick clay layer which limits the percolation of contaminants to the groundwater preserved in
the aquifer beneath it. More stormwater is expected to be taken up by plant and evaporates back to the
atmosphere which reduces the direct surface runoff as a consequence.
A special section at the study area is the landfill materials near the harbor area and central Gothenburg.
Landfills are usually permeable and have a function as a shallow aquifer (Lundgren 2010) where
groundwater is preserved. Some industrial and dense urban areas are constructed on the landfills (Figures
5 and 9) thus, replacement of hard surfaces and stormwater pipes will probably be hazardous for the
groundwater preserved in the landfill materials. The hydraulic conductivity in landfills varies but it is
generally low, approximately close to clay conductivity values (Hultén 1997), which limits contaminant
transportation by lateral and groundwater flow to the Kvillebäcken stream.
Another concept of landuse type is ditches. Ditches are usually constructed along roads and especially
highways (roadside ditches). They significantly capture road runoff to reduce contaminants supply to
water recipients (Elfering 2002). According to Elfering (2002) vegetative ditches have a capacity to
reduce contaminants from road runoff be up to 54%. Additionally, Elfering (2002) proposed what is called
“check dam system” which is filled with peat to captures road runoff and reduce contaminant amounts,
since peat is established as an effective matter to absorb contaminants. Peat should be removed when it is
saturated. The replacement time varies, it might remain effective up to one year or it may be necessary to
remove and replace it after a heavy storm event. The “check dam system” is effective where there is a lack
of vegetation cover during some periods. The experiment revealed that the “check dam system” is
effective in reducing the amounts of heavy metals up to 50%.
It might be effective to place such ditches and “check dam systems” near to hard surface with high
contaminant risk, which should not be replaced. In addition to roads, industrial and dense residential sites
of the Kvillebäcken study area should be considered. Vegetative ditches and check dams placement
around such sensitive sites will reduce or limit the supply of contaminants to the Kvillebäcken stream. On
the other hand, they improve stormwater infiltration into the ground (Elfering 2002) but groundwater will
not be negatively affected in hydrogeological settings with high vulnerability since contaminants are
absorbed by the peat before infiltration. Table 5 shows that contaminant supply from the different
pathways is largest during winter, which usually lacks the vegetation cover. Therefore “check dam
systems” are effective especially during the winter seasons that lack the vegetation cover which reduces
contaminant supply to the Kvillebäcken stream. However, this should be investigated from an economical
aspect if it is more efficient to replace hard surfaces and stormwater pipes with permeable surfaces or to
construct ditches and “check dam systems”.
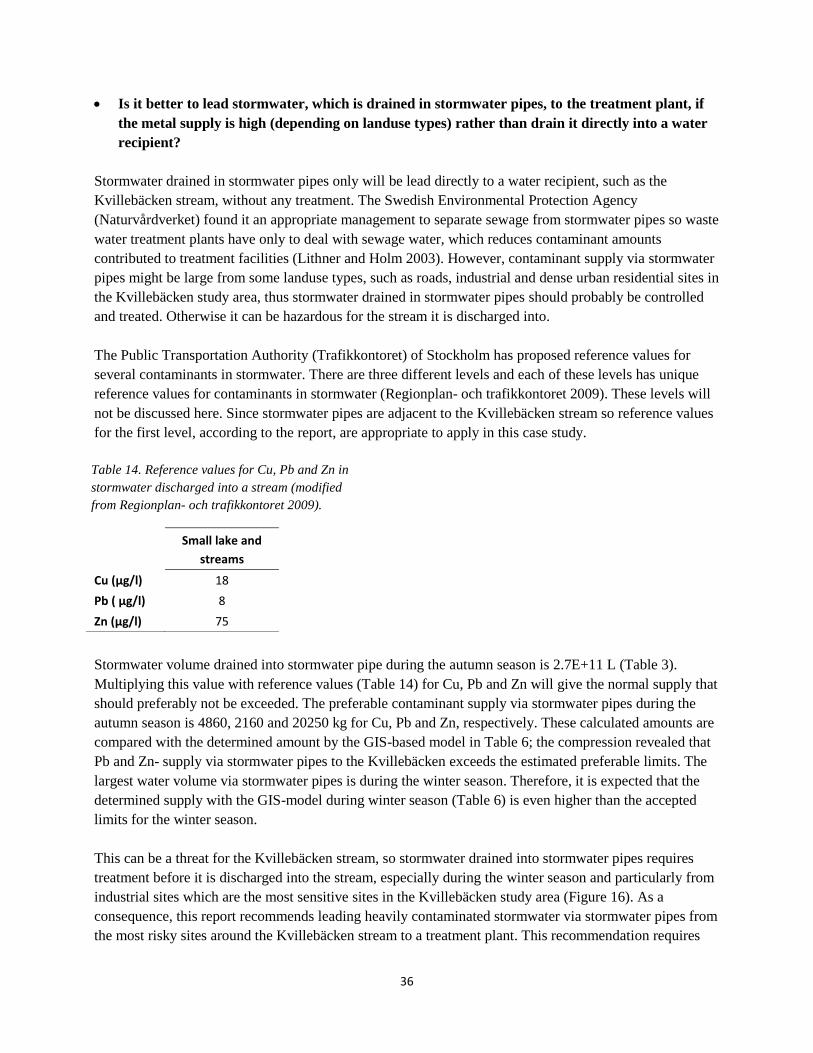
36
Is it better to lead stormwater, which is drained in stormwater pipes, to the treatment plant, if
the metal supply is high (depending on landuse types) rather than drain it directly into a water
recipient?
Stormwater drained in stormwater pipes only will be lead directly to a water recipient, such as the
Kvillebäcken stream, without any treatment. The Swedish Environmental Protection Agency
(Naturvårdverket) found it an appropriate management to separate sewage from stormwater pipes so waste
water treatment plants have only to deal with sewage water, which reduces contaminant amounts
contributed to treatment facilities (Lithner and Holm 2003). However, contaminant supply via stormwater
pipes might be large from some landuse types, such as roads, industrial and dense urban residential sites in
the Kvillebäcken study area, thus stormwater drained in stormwater pipes should probably be controlled
and treated. Otherwise it can be hazardous for the stream it is discharged into.
The Public Transportation Authority (Trafikkontoret) of Stockholm has proposed reference values for
several contaminants in stormwater. There are three different levels and each of these levels has unique
reference values for contaminants in stormwater (Regionplan- och trafikkontoret 2009). These levels will
not be discussed here. Since stormwater pipes are adjacent to the Kvillebäcken stream so reference values
for the first level, according to the report, are appropriate to apply in this case study.
Stormwater volume drained into stormwater pipe during the autumn season is 2.7E+11 L (Table 3).
Multiplying this value with reference values (Table 14) for Cu, Pb and Zn will give the normal supply that
should preferably not be exceeded. The preferable contaminant supply via stormwater pipes during the
autumn season is 4860, 2160 and 20250 kg for Cu, Pb and Zn, respectively. These calculated amounts are
compared with the determined amount by the GIS-based model in Table 6; the compression revealed that
Pb and Zn- supply via stormwater pipes to the Kvillebäcken exceeds the estimated preferable limits. The
largest water volume via stormwater pipes is during the winter season. Therefore, it is expected that the
determined supply with the GIS-model during winter season (Table 6) is even higher than the accepted
limits for the winter season.
This can be a threat for the Kvillebäcken stream, so stormwater drained into stormwater pipes requires
treatment before it is discharged into the stream, especially during the winter season and particularly from
industrial sites which are the most sensitive sites in the Kvillebäcken study area (Figure 16). As a
consequence, this report recommends leading heavily contaminated stormwater via stormwater pipes from
the most risky sites around the Kvillebäcken stream to a treatment plant. This recommendation requires
Small lake and
streams
Cu (μg/l) 18
Pb ( μg/l) 8
Zn (μg/l) 75
Table 14. Reference values for Cu, Pb and Zn in
stormwater discharged into a stream (modified
from Regionplan- och trafikkontoret 2009).
Table 15. Reference values for Cu, Pb and Zn in
stormwater discharged into a stream (modified
from Regionplan- och trafikkontoret 2009).
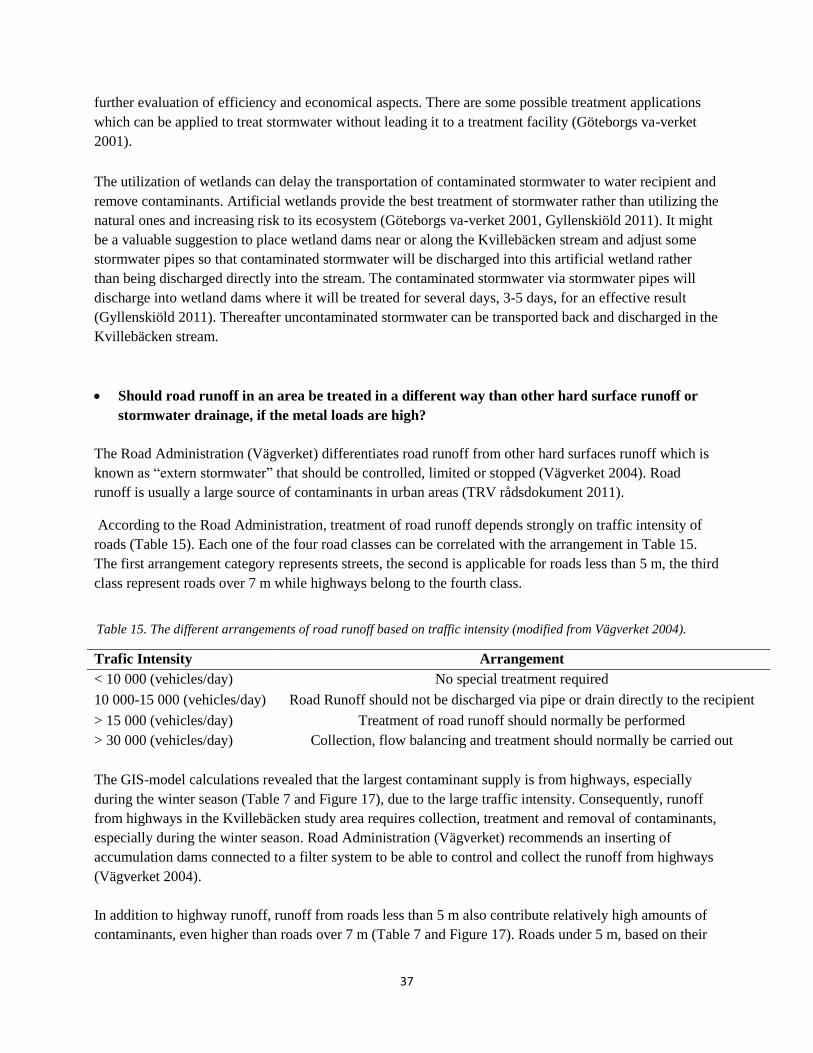
37
further evaluation of efficiency and economical aspects. There are some possible treatment applications
which can be applied to treat stormwater without leading it to a treatment facility (Göteborgs va-verket
2001).
The utilization of wetlands can delay the transportation of contaminated stormwater to water recipient and
remove contaminants. Artificial wetlands provide the best treatment of stormwater rather than utilizing the
natural ones and increasing risk to its ecosystem (Göteborgs va-verket 2001, Gyllenskiöld 2011). It might
be a valuable suggestion to place wetland dams near or along the Kvillebäcken stream and adjust some
stormwater pipes so that contaminated stormwater will be discharged into this artificial wetland rather
than being discharged directly into the stream. The contaminated stormwater via stormwater pipes will
discharge into wetland dams where it will be treated for several days, 3-5 days, for an effective result
(Gyllenskiöld 2011). Thereafter uncontaminated stormwater can be transported back and discharged in the
Kvillebäcken stream.
Should road runoff in an area be treated in a different way than other hard surface runoff or
stormwater drainage, if the metal loads are high?
The Road Administration (Vägverket) differentiates road runoff from other hard surfaces runoff which is
known as “extern stormwater” that should be controlled, limited or stopped (Vägverket 2004). Road
runoff is usually a large source of contaminants in urban areas (TRV rådsdokument 2011).
According to the Road Administration, treatment of road runoff depends strongly on traffic intensity of
roads (Table 15). Each one of the four road classes can be correlated with the arrangement in Table 15.
The first arrangement category represents streets, the second is applicable for roads less than 5 m, the third
class represent roads over 7 m while highways belong to the fourth class.
The GIS-model calculations revealed that the largest contaminant supply is from highways, especially
during the winter season (Table 7 and Figure 17), due to the large traffic intensity. Consequently, runoff
from highways in the Kvillebäcken study area requires collection, treatment and removal of contaminants,
especially during the winter season. Road Administration (Vägverket) recommends an inserting of
accumulation dams connected to a filter system to be able to control and collect the runoff from highways
(Vägverket 2004).
In addition to highway runoff, runoff from roads less than 5 m also contribute relatively high amounts of
contaminants, even higher than roads over 7 m (Table 7 and Figure 17). Roads under 5 m, based on their
Trafic Intensity Arrangement
< 10 000 (vehicles/day) No special treatment required
10 000-15 000 (vehicles/day) Road Runoff should not be discharged via pipe or drain directly to the recipient
> 15 000 (vehicles/day) Treatment of road runoff should normally be performed
> 30 000 (vehicles/day) Collection, flow balancing and treatment should normally be carried out
Table 15. The different arrangements of road runoff based on traffic intensity (modified from Vägverket 2004).
Table 16. The different arrangements of road runoff based on traffic intensity (modified from Vägverket 2004).
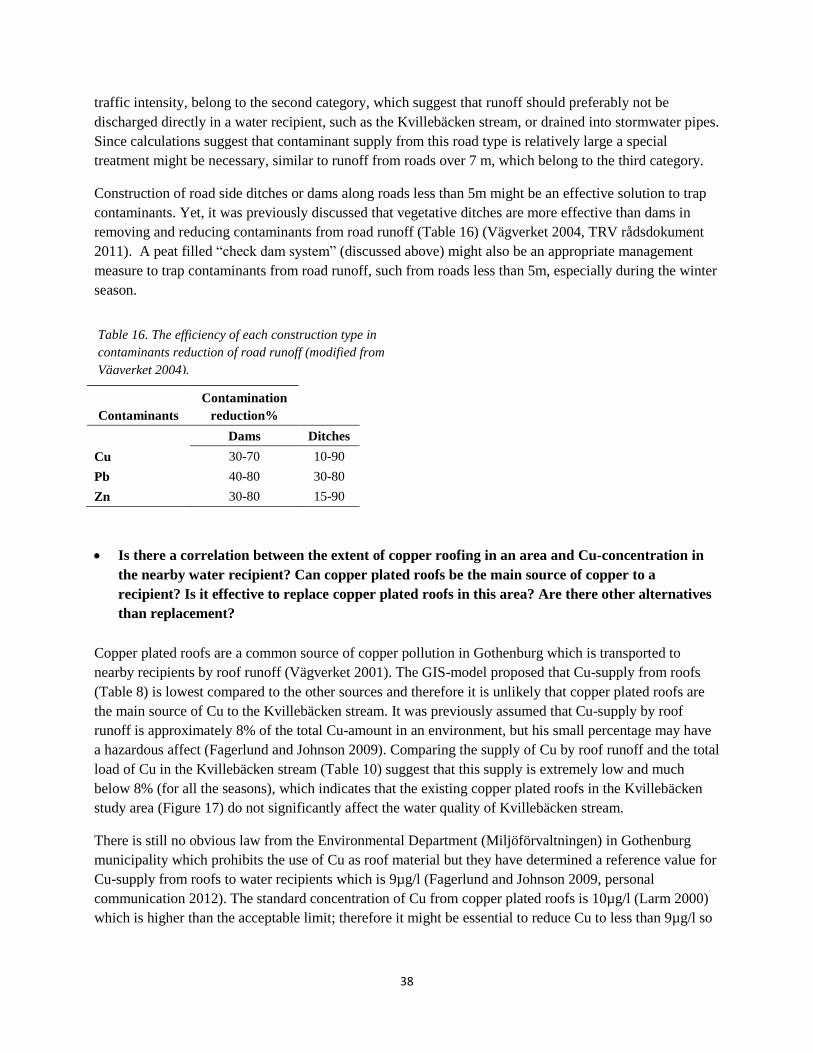
38
traffic intensity, belong to the second category, which suggest that runoff should preferably not be
discharged directly in a water recipient, such as the Kvillebäcken stream, or drained into stormwater pipes.
Since calculations suggest that contaminant supply from this road type is relatively large a special
treatment might be necessary, similar to runoff from roads over 7 m, which belong to the third category.
Construction of road side ditches or dams along roads less than 5m might be an effective solution to trap
contaminants. Yet, it was previously discussed that vegetative ditches are more effective than dams in
removing and reducing contaminants from road runoff (Table 16) (Vägverket 2004, TRV rådsdokument
2011). A peat filled “check dam system” (discussed above) might also be an appropriate management
measure to trap contaminants from road runoff, such from roads less than 5m, especially during the winter
season.
Contaminants
Contamination
reduction%
Dams Ditches
Cu 30-70 10-90
Pb 40-80 30-80
Zn 30-80 15-90
Is there a correlation between the extent of copper roofing in an area and Cu-concentration in
the nearby water recipient? Can copper plated roofs be the main source of copper to a
recipient? Is it effective to replace copper plated roofs in this area? Are there other alternatives
than replacement?
Copper plated roofs are a common source of copper pollution in Gothenburg which is transported to
nearby recipients by roof runoff (Vägverket 2001). The GIS-model proposed that Cu-supply from roofs
(Table 8) is lowest compared to the other sources and therefore it is unlikely that copper plated roofs are
the main source of Cu to the Kvillebäcken stream. It was previously assumed that Cu-supply by roof
runoff is approximately 8% of the total Cu-amount in an environment, but his small percentage may have
a hazardous affect (Fagerlund and Johnson 2009). Comparing the supply of Cu by roof runoff and the total
load of Cu in the Kvillebäcken stream (Table 10) suggest that this supply is extremely low and much
below 8% (for all the seasons), which indicates that the existing copper plated roofs in the Kvillebäcken
study area (Figure 17) do not significantly affect the water quality of Kvillebäcken stream.
There is still no obvious law from the Environmental Department (Miljöförvaltningen) in Gothenburg
municipality which prohibits the use of Cu as roof material but they have determined a reference value for
Cu-supply from roofs to water recipients which is 9µg/l (Fagerlund and Johnson 2009, personal
communication 2012). The standard concentration of Cu from copper plated roofs is 10µg/l (Larm 2000)
which is higher than the acceptable limit; therefore it might be essential to reduce Cu to less than 9µg/l so
Table 16. The efficiency of each construction type in
contaminants reduction of road runoff (modified from
Vägverket 2004).
Table 17. The efficiency of each construction type in
contaminants reduction of road runoff (modified from
Vägverket 2004).
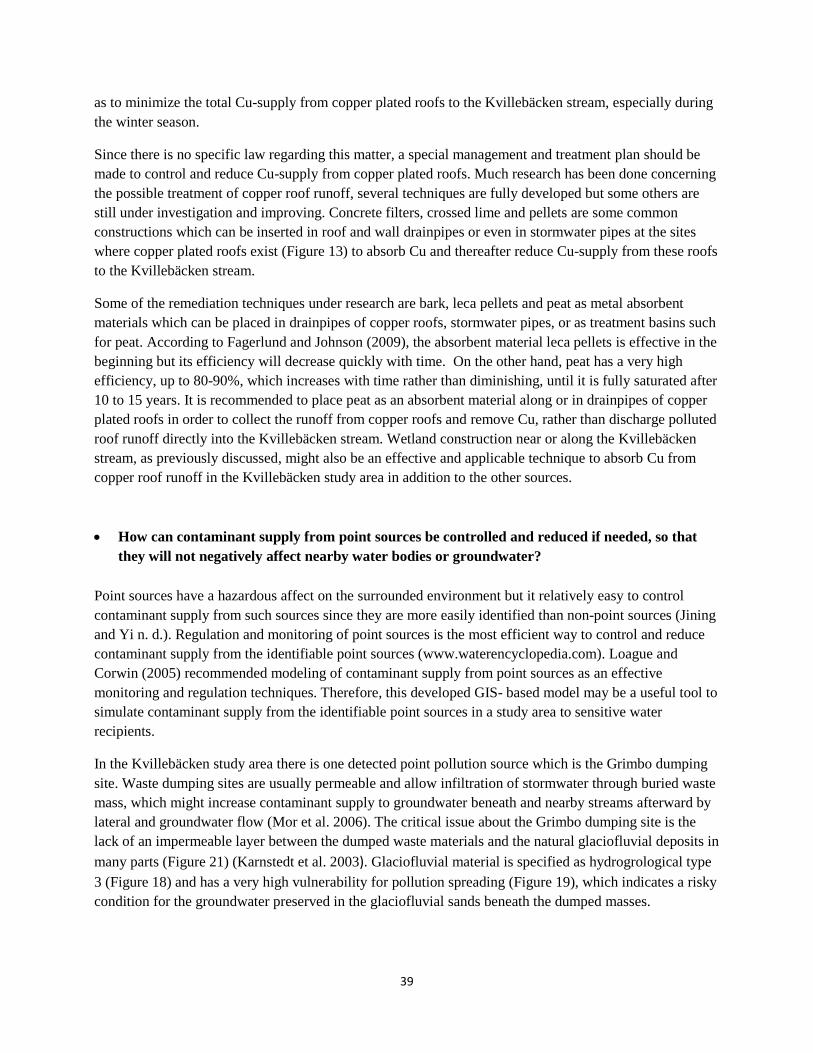
39
as to minimize the total Cu-supply from copper plated roofs to the Kvillebäcken stream, especially during
the winter season.
Since there is no specific law regarding this matter, a special management and treatment plan should be
made to control and reduce Cu-supply from copper plated roofs. Much research has been done concerning
the possible treatment of copper roof runoff, several techniques are fully developed but some others are
still under investigation and improving. Concrete filters, crossed lime and pellets are some common
constructions which can be inserted in roof and wall drainpipes or even in stormwater pipes at the sites
where copper plated roofs exist (Figure 13) to absorb Cu and thereafter reduce Cu-supply from these roofs
to the Kvillebäcken stream.
Some of the remediation techniques under research are bark, leca pellets and peat as metal absorbent
materials which can be placed in drainpipes of copper roofs, stormwater pipes, or as treatment basins such
for peat. According to Fagerlund and Johnson (2009), the absorbent material leca pellets is effective in the
beginning but its efficiency will decrease quickly with time. On the other hand, peat has a very high
efficiency, up to 80-90%, which increases with time rather than diminishing, until it is fully saturated after
10 to 15 years. It is recommended to place peat as an absorbent material along or in drainpipes of copper
plated roofs in order to collect the runoff from copper roofs and remove Cu, rather than discharge polluted
roof runoff directly into the Kvillebäcken stream. Wetland construction near or along the Kvillebäcken
stream, as previously discussed, might also be an effective and applicable technique to absorb Cu from
copper roof runoff in the Kvillebäcken study area in addition to the other sources.
How can contaminant supply from point sources be controlled and reduced if needed, so that
they will not negatively affect nearby water bodies or groundwater?
Point sources have a hazardous affect on the surrounded environment but it relatively easy to control
contaminant supply from such sources since they are more easily identified than non-point sources (Jining
and Yi n. d.). Regulation and monitoring of point sources is the most efficient way to control and reduce
contaminant supply from the identifiable point sources (www.waterencyclopedia.com). Loague and
Corwin (2005) recommended modeling of contaminant supply from point sources as an effective
monitoring and regulation techniques. Therefore, this developed GIS- based model may be a useful tool to
simulate contaminant supply from the identifiable point sources in a study area to sensitive water
recipients.
In the Kvillebäcken study area there is one detected point pollution source which is the Grimbo dumping
site. Waste dumping sites are usually permeable and allow infiltration of stormwater through buried waste
mass, which might increase contaminant supply to groundwater beneath and nearby streams afterward by
lateral and groundwater flow (Mor et al. 2006). The critical issue about the Grimbo dumping site is the
lack of an impermeable layer between the dumped waste materials and the natural glaciofluvial deposits in
many parts (Figure 21) (Karnstedt et al. 2003). Glaciofluvial material is specified as hydrogrological type
3 (Figure 18) and has a very high vulnerability for pollution spreading (Figure 19), which indicates a risky
condition for the groundwater preserved in the glaciofluvial sands beneath the dumped masses.
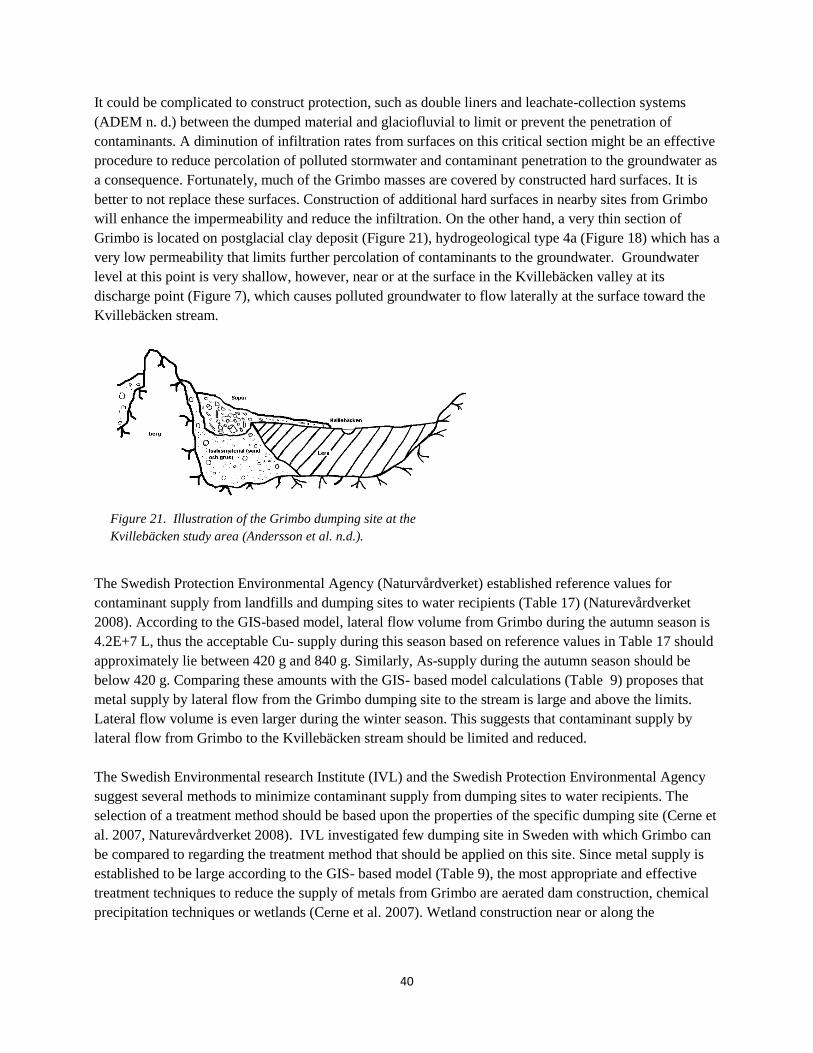
40
It could be complicated to construct protection, such as double liners and leachate-collection systems
(ADEM n. d.) between the dumped material and glaciofluvial to limit or prevent the penetration of
contaminants. A diminution of infiltration rates from surfaces on this critical section might be an effective
procedure to reduce percolation of polluted stormwater and contaminant penetration to the groundwater as
a consequence. Fortunately, much of the Grimbo masses are covered by constructed hard surfaces. It is
better to not replace these surfaces. Construction of additional hard surfaces in nearby sites from Grimbo
will enhance the impermeability and reduce the infiltration. On the other hand, a very thin section of
Grimbo is located on postglacial clay deposit (Figure 21), hydrogeological type 4a (Figure 18) which has a
very low permeability that limits further percolation of contaminants to the groundwater. Groundwater
level at this point is very shallow, however, near or at the surface in the Kvillebäcken valley at its
discharge point (Figure 7), which causes polluted groundwater to flow laterally at the surface toward the
Kvillebäcken stream.
The Swedish Protection Environmental Agency (Naturvårdverket) established reference values for
contaminant supply from landfills and dumping sites to water recipients (Table 17) (Naturevårdverket
2008). According to the GIS-based model, lateral flow volume from Grimbo during the autumn season is
4.2E+7 L, thus the acceptable Cu- supply during this season based on reference values in Table 17 should
approximately lie between 420 g and 840 g. Similarly, As-supply during the autumn season should be
below 420 g. Comparing these amounts with the GIS- based model calculations (Table 9) proposes that
metal supply by lateral flow from the Grimbo dumping site to the stream is large and above the limits.
Lateral flow volume is even larger during the winter season. This suggests that contaminant supply by
lateral flow from Grimbo to the Kvillebäcken stream should be limited and reduced.
The Swedish Environmental research Institute (IVL) and the Swedish Protection Environmental Agency
suggest several methods to minimize contaminant supply from dumping sites to water recipients. The
selection of a treatment method should be based upon the properties of the specific dumping site (Cerne et
al. 2007, Naturevårdverket 2008). IVL investigated few dumping site in Sweden with which Grimbo can
be compared to regarding the treatment method that should be applied on this site. Since metal supply is
established to be large according to the GIS- based model (Table 9), the most appropriate and effective
treatment techniques to reduce the supply of metals from Grimbo are aerated dam construction, chemical
precipitation techniques or wetlands (Cerne et al. 2007). Wetland construction near or along the
Figure 21. Illustration of the Grimbo dumping site at the
Kvillebäcken study area (Andersson et al. n.d.).
Figure 21. Illustration of the Grimbo dumping site at the
Kvillebäcken study area (Andersson et al. n.d.).
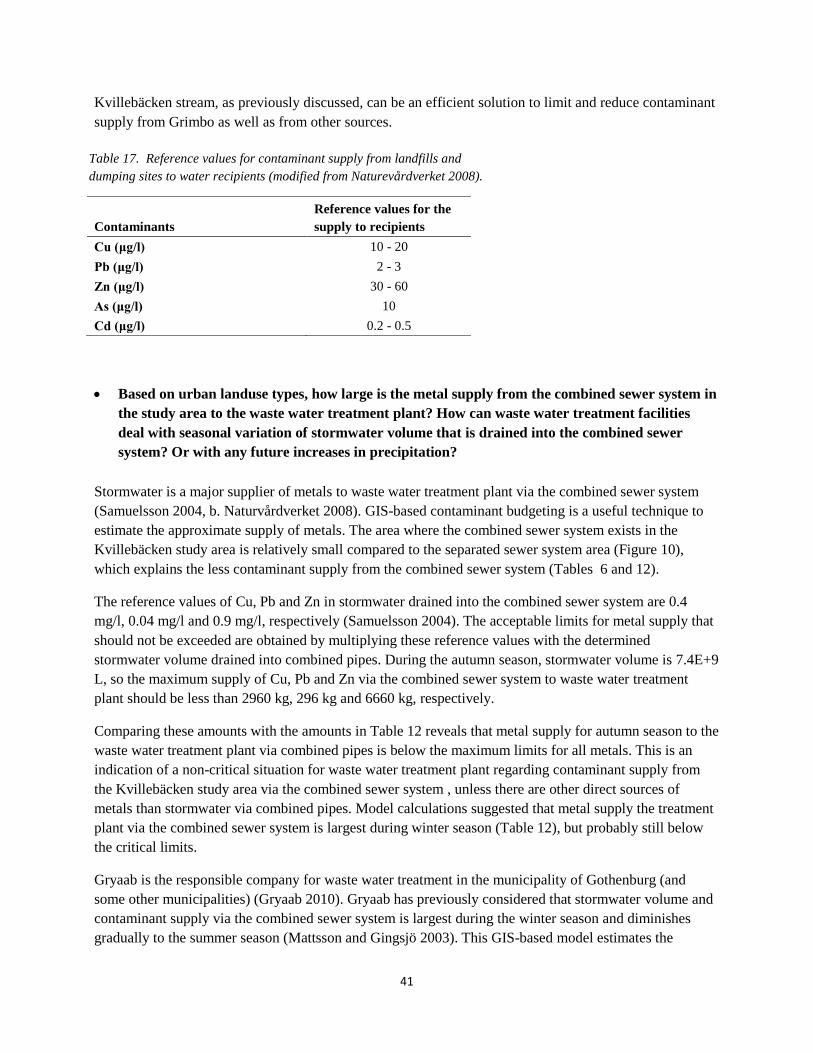
41
Kvillebäcken stream, as previously discussed, can be an efficient solution to limit and reduce contaminant
supply from Grimbo as well as from other sources.
Based on urban landuse types, how large is the metal supply from the combined sewer system in
the study area to the waste water treatment plant? How can waste water treatment facilities
deal with seasonal variation of stormwater volume that is drained into the combined sewer
system? Or with any future increases in precipitation?
Stormwater is a major supplier of metals to waste water treatment plant via the combined sewer system
(Samuelsson 2004, b. Naturvårdverket 2008). GIS-based contaminant budgeting is a useful technique to
estimate the approximate supply of metals. The area where the combined sewer system exists in the
Kvillebäcken study area is relatively small compared to the separated sewer system area (Figure 10),
which explains the less contaminant supply from the combined sewer system (Tables 6 and 12).
The reference values of Cu, Pb and Zn in stormwater drained into the combined sewer system are 0.4
mg/l, 0.04 mg/l and 0.9 mg/l, respectively (Samuelsson 2004). The acceptable limits for metal supply that
should not be exceeded are obtained by multiplying these reference values with the determined
stormwater volume drained into combined pipes. During the autumn season, stormwater volume is 7.4E+9
L, so the maximum supply of Cu, Pb and Zn via the combined sewer system to waste water treatment
plant should be less than 2960 kg, 296 kg and 6660 kg, respectively.
Comparing these amounts with the amounts in Table 12 reveals that metal supply for autumn season to the
waste water treatment plant via combined pipes is below the maximum limits for all metals. This is an
indication of a non-critical situation for waste water treatment plant regarding contaminant supply from
the Kvillebäcken study area via the combined sewer system , unless there are other direct sources of
metals than stormwater via combined pipes. Model calculations suggested that metal supply the treatment
plant via the combined sewer system is largest during winter season (Table 12), but probably still below
the critical limits.
Gryaab is the responsible company for waste water treatment in the municipality of Gothenburg (and
some other municipalities) (Gryaab 2010). Gryaab has previously considered that stormwater volume and
contaminant supply via the combined sewer system is largest during the winter season and diminishes
gradually to the summer season (Mattsson and Gingsjö 2003). This GIS-based model estimates the
Contaminants
Reference values for the
supply to recipients
Cu (μg/l) 10 - 20
Pb (μg/l) 2 - 3
Zn (μg/l) 30 - 60
As (μg/l) 10
Cd (μg/l) 0.2 - 0.5
Table 17. Reference values for contaminant supply from landfills and
dumping sites to water recipients (modified from Naturevårdverket 2008).
Table 18. Reference values for contaminant supply from landfills and
dumping sites to water recipients (modified from Naturevårdverket 2008).
42
stormwater volume and metal supply during each season, which is a useful tool for treatment facilities to
regulate pumping rates for each season depending on the incoming water volume and supply.
Additionally, Gryaab has investigated several climate scenarios and concluded that increased precipitation
might affect the efficiency of treatment facility and water treatment (Mattsson and Gingsjö 2003). This
GIS-based model could assist Gryaab to define these scenarios with approximate numerical estimation of
stormwater volume and metal supply for better planning.
5. Conclusions
The developed GIS-based model is a useful and time saving tool to explore pollution intensity of
urban stormwater and contaminant supply from possible sources and pathways of a study area to a
nearby water recipient. Additionally, this GIS-based model helps investigate the environmental
conditions for a study area in different time, weather or climate conditions.
This developed GIS-based model has many applications and it is able to clarify many issues
which might assist decision makers regarding the most suitable managements of stormwater and
water resource protection in urban areas.
The Kvillebäcken study area contributes significant amounts of contaminants to the Kvillebäcken
stream, especially during the winter season, which puts water quality and aquatic life of the stream
under risk. A rapid contaminant supply occurs during the summer season when transportation of
contaminants occurs under a shorter time than during the winter season. Contaminant supply is
largest via stormwater pipes followed by the direct surface runoff, both of which will drain
directly into the Kvillebäcken stream, especially from industrial and dense residential sites
surrounding the Kvillebäcken stream.
Replacement of hard surfaces and stormwater pipes which would enhance infiltration and reduces
the direct supply of contaminants to the Kvillebäcken stream should not take place on sensitive
hydrogeological settings, because their vulnerability for contaminant spreading is high.
Contaminant supply via stormwater pipes is high from the Kvillebäcken study area, especially
from the industrial and dense residential sites. It is recommended that polluted stormwater drained
into stormwater pipes be treated before it is lead to the Kvillebäcken stream.
Contaminant supply is largest from highways and roads less than 5 m. Surface runoff from
highways is usually collected and treated but road runoff from roads under 5 m should also be
treated in a special way, or at least treated as runoff from roads over 7 m. Cu- supply from copper
plated roofs in the Kvillebäcken area is lowest among other sources, but it might be limited or
treated before it is discharged into the stream, especially during the winter season since the supply
exceeds the acceptable limits. The supply from Grimbo dumping site is higher than the acceptable
limits for the supply from dumping sites. On the other hand, the groundwater preserved in the
quifer under the dumped masses is a risk, which requires frequent monitoring.
43
The calculated contaminant supply amounts are larger than SMHI and SGI’s calculations.
Calculations of this GIS-based model might be improved by using standard contaminant
concentration values computed especially for Gothenburg City, and by determining the
approximate groundwater flow volume with a special groundwater model rather than ArcGIS.
In addition to the Kvillebäcken stream, the area where the combined sewer system exists
contributes contaminants to the waste water treatment plant but this amount still within the
acceptable limits according to the treatment facilities.
6. Acknowledgments
Special thanks for my supervisor, Professor Rodney Stevens, my examiner, Mark Johnson, Marie Haeger-
Eugensson at the IVL for generating precipitation data, Alexander Walther, a Ph. D. student at GVC for
his helpful suggestions regarding some ArcGIS technical problems. A special thank you for Olof
Johansson Ström and Martin Persson for their supportive discussions and ArcGIS guidance.
7. References
ADEM. (n. d.). Groundwater Contamination, Groundwater Guardian, Vanity press, Alabama.
Ahlman, S. (2002). The impact of source control measures on stormwater pollution load – discussion
from a sustainability point of view, Department of Water Environment Transport. (Unpublished)
Göteborg Sweden: Chalmers University of Technology.
Alazem, D. (2010). Urban road dust near Göta Älv River, Gothenburg. Göteborg Sweden: Department of
Earth Science, University of Gothenburg. (B-611)
Almqvist, J., Buovac, S., Höglund, E. & Wikensten, N. (2005). Landskap i förvandling. Göteborg Sverige:
Göteborgs universitet.
Andersson, K., Roos, B. & Hård, S. (2007). Systemstudie Avlopp: En studie av framtida hållbara system
för hantering av avlopp och bioavfall i Göteborgsregionen. Göteborgs Sverige: Kretsloppskontoret.
Andersson, M, Moberg, S. & Stevens, R. (n. d.). Grimbo Landfill – illustrating Earth science applications
for pre-university students. Göteborg Sweden: Department of Earth Science, Göteborg University.
Andréasson, C., Frick, J., Larsson, K. & Sernestrand, M. (2005). BACKA. Göteborg Sverige: Göteborgs
universitet.
Björklund, K., Almqvist, H., Malmqvist, P-A. & Strömvall, A-M. (2008). Best Management Practices to
Reduce Phthalate and Nonylphenol Loads in Urban Runoff. 11th International Conference on Urban
Drainage, Edinburgh, Scotland, UK.
Davis, S. & DeWiest, R. (1966). Hydrogeology. John Wiley & Sons, Inc.
Digital Kartbiblioteket i SWEREF99. (2011). Retrieved from: https://butiken.metria.se/digibib/index.php
(Accessed 02-09-2011).
Dipol project. (2007). Retrieved from: http://www.northsearegion.eu/ivb/projects/details/&tid=91
(Accessed 15-02-2012).
44
Eliasson, M. (2005). Kvantifiering av föroreningstillskott från dagvatten inom skyddsområdet för Göta
Älv- en simuleringsstudie med modellen SEWSYS. Uppsala Sverige: Institutionen för
informationsteknologi, Uppsala Universitet. (ISSN 1401-5765).
Eklund, H. (2002). Hydrogeologiska typmiljöer: Verktyg för bedömning av grundvattenkvalitet,
identifiering av grundvattenförekomster samt underlag för riskhantering längs vägar
Göteborg Sverige: Geologiska Institutionen, Chalmers Tekniska Högskola. (Publ. A101).
Elfering, J. (2002). Improving the Design of Roadside Ditches to Decrease Transportation Related
Surface Water Pollution. US: Department of Water Resource Sciences, University of Minnesota.
Eriksson, K. (1999). Metal Geochemistry In The Kvillebäcken Stream and the Lundbyhamnen-Frihamnen
Dock. Göteborg Sweden: Earth Science Centre, Göteborg University. (B206).
Etemadi, O., Petrisor, L., Kim, D., Wan, M. & Yen, T. (2003). Stabilization of Metals in Subsurface by
Biopolymers: Laboratory Drainage Flow Studies. Soil & Sediment Contamination, 12, 647–661.
Fagerlund, S. & Johnson, D. (2009). Rening av kopparhaltigt dagvatten från koppartak.
Göteborg Sverige: Institutionen för bygg- och miljöteknik, Chalmers Tekniska Högskola. (2009:4).
Gryaab. (2010). Gryaabs verksamhet 2010 (annual report 2010). Göteborg Sverige: Gryaab.
Gyllenskiöld, S. (2011). Våtmarken som renare av dagvatten. Uppsala Sverige: Institutionen för Stad och
Land, SLU. (EX0588).
Göteborgs Stad Trafikkontoret. (2011). Retrieved from:
http://www.statistik.tkgbg.se/statistik.asp?sLetter=A (Accessed 09-09-2011).
Göteborgs stadsbyggnadskontor. (2008). Detaljplan för Östra Kvillebäcken södra delen. Göteborg
Sverige: Stadsbyggnadskontor.
Göteborgs va-verket. (2001). Dagvatten inom planlagda områden. Göteborg Sverige: Va-verket.
Hultén, A. (1997). Grundvatten I Urban Miljö: Grundvattnets nivåvariationer i de övre marklagren I
Göteborg. Göteborg Sverige: Geologiska Institutionen, Chalmers Tekniska Högskola. (Publ. A 85).
IVL Svenska Miljöinstitutet AB. (2007). Utvärdering av behandlingsmetoder
för lakvatten från deponier: Kemisk karakterisering av lakvatten före och efter olika behandlingssteg
på ett antal svenska deponier (Rapport B1748).
Jardine, P., Wilson, G., Luxmoore, R. & Gwo, J. P. (2001). Conceptual Model of Vadose-Zone Transport
in Fractured Weathered Shales. In (ed. 2001), Conceptual Models of Flow and Transportation in the
Fractured Vadose Zone. Washington, DC: National Academy Press.
Jining, C. & Yi, Q. (n. d.). Point Sources of Pollution: Local Effects and Control. Japan: Department of
Environmental Science and Engineering, Tsinghua University.
Johannesson, L., Stevens, S. & Eriksson, K. (2003). The influence of an urban stream on sediment
geochemistry in Göteborg Harbour. Sweden, Environmental Geology, 43, 434–444.
Karnstedt, T., Örne, M. & Östling, F. (2003). Grimbo landfill – En markmiljöundersökning. Göteborg
Sweden: Department of Earth Sciences, Gothenburg University.
Kopec, D. (1995). Soil Characteristics and How They Affect Soil Moisture. University of Arizona
Cooperative Extension (2:10). Retrieved from: http://ag.arizona.edu/turf/tips1095.html
(Accessed 23-10-2011).
Larm, T. (2000). Watershed-based design of stormwater treatment facilities: model development and
Applications. Stockholm Sweden: Royal Institution of Technology. (PHD 1038-SE).
Lindgren, Å. (2001). Dagvattenbelastning på sjöar och vattendrag i förhållande till andra
Föroreningskällor (Publ 2001:114). Sverige: Vägverket, Vägavdelningen.
Lundgren, A. (2010). Groundwater flow and quality in the vicinity of an urbanised part of the Säveån
45
stream, Gothenburg. Göteborg Sweden: Department of Earth Science, University of Gothenburg. (B
597).
Loague, K. & Corwin, D. (2005). 94: Point and NonPoint Source Pollution, Encyclopedia of Hydrological
Sciences, John Wiley & Sons, Ltd.
Lithner, G. & Holm, K. (2003). Nya metaller och föroreningar i svensk miljö. Stockholm Sverige:
Institutet för tillämpad miljöforskning, Stockholms Universitet, Naturvårdsverket. (Rapport 5306).
Marshak, S. (2005). Earth: Portrait of A Planet (2nd
ed.). W. W. Norton & Company, Inc.
Mattson, A. & Gingsjö, U. (2003). Miljödom 2003 – förstudie av utbyggnadsalternativ för att uppnå lägre
utsläppshalter av fosfor och kväve (Rapport 2003: 4). Göteborg Sverige: Gryaab.
Mor, S., Ravindra, K., Dahiya, R. & Chandra, A. (2006). Leachate Characterization and Assessment of
Groundwater Pollution near Municipal Solid Waste Landfill Site. Environmental Monitoring and
Assessment, 118, 435–456.
Naturvårdverket. (2008). Lakvatten från Deponier (Fakta: 8306). Sverige: Naturvårdverket.
Naturvårdverket. (2008b). Rening av avloppsvatten i Sverige. Sverige: Naturvårdverket.
Pennington, S. & Webster-Brown, J. (2008). Stormwater runoff quality from copper roofing, Auckland,
New Zealand. New Zealand Journal of Marine and Freshwater Research, 42, 99–108.
Regionplan- och trafikkontoret. (2009). Förslag till riktvärden för dagvattenutsläpp. Stockholm Sverige:
Regionala dagvattennätverket i Stockholms län.
Samuelsson, P. (2004). Halter av farliga ämnen i slam och avloppsvatten i Uddebo avloppsreningsverk.
Luleå Sverige: Institutionen för samhällsbyggnad, Avdelningen för VA-teknik, Luleå Tekniska
Universitet. (2004:310).
SGU- Swedish Geological Survey. (2012). Retrieved from:
http://maps2.sgu.se/kartgenerator/maporder_sv.html (Accessed 18-02-2012).
SMHI- Swedish Meteorological and Hydrological Institute. (2011). Retrieved from: www.smhi.se
(Accessed 23-09-2011).
StormTac- Stormwater solution. (2011). Retrieved from: http://stormtac.com/ (Accessed 09-09-2011).
TAPM-modellen (n. d.). Kort beskrivning av TAPM-modellen. Vanity press. TRV rådsdokument. (2011).
Vägdagvatten: Råd och rekommendationer för val av miljöåtgärd (Publ.2011:112). Göteborg Sverige:
Trafikverket.
Vägverket. (2001). Dagvattenbelastning på sjöar och vattendrag i förhållande till andra föroreningskällor
(Publ 2001:114). Sverige: Vägavdelningen, Vägverket.
Vägverket. (2004). Vägdagvatten - Råd och rekommendationer för val av miljöåtgärder (Publ. 2004:195).
Sverige: Vägverket,Vägtekniksektionen.
Water Encyclopedia: Science and Issues (2011). Retrieved from: http://www.waterencyclopedia.com/Po
Re/Pollution-Sources-Point-and-Nonpoint.html (Accessed 13-09-2011).
Wei, C. & Morrison, G. (1992). Bacterial enzymee activity and metal speciation in urban river sediments.
Hydrobiologia, 235/236, 597-603.
Åberg, T. (2007). Öppen dagvattenhantering i urbana miljöer. Institutionen för landskapsplanering.
(ISSN 1652-8152).


![Air Contaminant _54.12_ [Preamb]](https://static.fdocuments.in/doc/165x107/5695cf481a28ab9b028d6988/air-contaminant-5412-preamb.jpg)