GIS-Assisted Modelling of Soil Erosion in a South African ...
20
Chapter 3 GIS-Assisted Modelling of Soil Erosion in a South African Catchment: Evaluating the USLE and SLEMSA Approach G. D. Breetzke, E. Koomen and W. R. S. Critchley Additional information is available at the end of the chapter http://dx.doi.org/10.5772/52314 1. Introduction Soil erosion – the detachment and transportation of particles from soil aggregates by erosive agents (Stocking, 1984) – is regarded as one of South Africa’s most significant environmental problems (Meadows, 2003). In South Africa, roughly 6 million households derive all or some of their income from agriculture (South African Department of Agriculture, 2007). Roughly 25 % of the population is directly dependant on agriculture, an activity that utilises about 80% of the total surface area of the country (Lutchmaih, 1999). The implications of high soil erosion rates are reflected in agricultural costs as well as social welfare costs where the de‐ cline in soil productivity causes the migration of the workers to urban areas. For a develop‐ ing country, such as South Africa, these social impacts further burden the national economy. Crucial in combating the scourge of soil erosion in South Africa is to estimate amounts and rates of soil loss in the country at various levels of scale. This will facilitate the initiation of regional land-use and management planning strategies, and the application of appropriate conservation and management practices at various scales of development. Studies on soil erosion in South Africa have been summarised by Garland, Hoffman & Todd (1999); annual soil loss estimates for the whole country range from 363 million tonnes (Midgley, 1952), to 233 million tonnes (Schwartz & Pullen, 1966) and to 100-150 million tonnes (Rooseboom, 1976). These overall national figures are based on the sediment yield of main rivers in South Africa. While indicating the importance of soil erosion on a national level these figures are unhelpful in drafting local or regional plans to combat erosion. Conservation strategies are conventionally planned on the scale of river catchments; at this scale the complete erosion process is included while it is still possible to spatially pinpoint actual control measures. © 2013 Breetzke et al.; licensee InTech. This is an open access article distributed under the terms of the Creative Commons Attribution License (http://creativecommons.org/licenses/by/3.0), which permits unrestricted use, distribution, and reproduction in any medium, provided the original work is properly cited.
Transcript of GIS-Assisted Modelling of Soil Erosion in a South African ...

Chapter 3
GIS-Assisted Modelling ofSoil Erosion in a South African Catchment:Evaluating the USLE and SLEMSA Approach
G. D. Breetzke, E. Koomen and W. R. S. Critchley
Additional information is available at the end of the chapter
http://dx.doi.org/10.5772/52314
1. Introduction
Soil erosion – the detachment and transportation of particles from soil aggregates by erosiveagents (Stocking, 1984) – is regarded as one of South Africa’s most significant environmentalproblems (Meadows, 2003). In South Africa, roughly 6 million households derive all or someof their income from agriculture (South African Department of Agriculture, 2007). Roughly25 % of the population is directly dependant on agriculture, an activity that utilises about80% of the total surface area of the country (Lutchmaih, 1999). The implications of high soilerosion rates are reflected in agricultural costs as well as social welfare costs where the de‐cline in soil productivity causes the migration of the workers to urban areas. For a develop‐ing country, such as South Africa, these social impacts further burden the national economy.
Crucial in combating the scourge of soil erosion in South Africa is to estimate amounts andrates of soil loss in the country at various levels of scale. This will facilitate the initiation ofregional land-use and management planning strategies, and the application of appropriateconservation and management practices at various scales of development. Studies on soilerosion in South Africa have been summarised by Garland, Hoffman & Todd (1999); annualsoil loss estimates for the whole country range from 363 million tonnes (Midgley, 1952), to233 million tonnes (Schwartz & Pullen, 1966) and to 100-150 million tonnes (Rooseboom,1976). These overall national figures are based on the sediment yield of main rivers in SouthAfrica. While indicating the importance of soil erosion on a national level these figures areunhelpful in drafting local or regional plans to combat erosion. Conservation strategies areconventionally planned on the scale of river catchments; at this scale the complete erosionprocess is included while it is still possible to spatially pinpoint actual control measures.
© 2013 Breetzke et al.; licensee InTech. This is an open access article distributed under the terms of theCreative Commons Attribution License (http://creativecommons.org/licenses/by/3.0), which permitsunrestricted use, distribution, and reproduction in any medium, provided the original work is properly cited.

Geographical Information Systems (GIS) provide a much-favoured tool in regional soil ero‐sion studies in South Africa (Le Roux et al., 2007). Such tools facilitate the upscaling of plot-scale soil loss predictions to a catchment or bigger scale.
In this paper we apply GIS technology to estimate soil loss rates per land use type in a qua‐ternary catchment using two common approaches that generate rapid soil erosion assess‐ment results at a low cost: the Universal Soil Loss Equation (USLE) and the Soil LossEstimator for Southern Africa (SLEMSA). The objective of our research is to critically com‐pare these popular approaches and discuss potential ways of improving their application.This paper starts with a concise introduction to the study site and then discusses how soilerosion is described in the USLE and SLEMSA approaches. Specific attention is paid to theway the various constituting factors are made operational. Subsequently the resulting soliloss estimates are described and their relation with the underlying factors is analysed. In afinal concluding section the main results are highlighted and their implications for other ap‐plications of these approaches are discussed.
2. Study site and methodology
As study site we selected a catchment in the KwaZulu-Natal province of South Africa. Thecatchment is situated between latitudes 29º 30' 36'' S and 29º 52' 48'' S and longitudes 29º 8'24'' E and 29º 5' 24'' E and has a surface area of approximately 341 km2 (Figure 1). The alti‐tude of the catchment ranges from 1160 m a.s.l from the Wagendrift Dam, at the outlet of thecatchment, to 2080 m at the Giant’s Castle nature reserve at the western corner of the catch‐ment. The topography is characterised by deeply incised valleys and steep slopes mainlycovered by grassland. The catchment is located in a sub-humid environment and receives anannual average rainfall of 932mm. Rainfall is concentrated in the summer months (Novem‐ber - March) with the winter months (May – August) receiving as little as 10mm of rainfallper month. The most notable water body in the catchment is the Bushman’s River thatdrains into the Wagendrift Dam at the outlet of the catchment.
Grassland covers over 80% of the catchment with the remainder consisting mainly offorest plantations and thicket and scrubland. A small percentage (4,3%) of the catch‐ment consists of small-scale subsistence, and large-scale commercial agricultural settle‐ments. The commercial settlements comprise of six holdings in the catchment. Thesmall-scale settlements, where subsistence agriculture is practiced, are numerous andsporadic. The commercial farmers focus mainly on dairy production, while subsistenceagriculture, practiced by approximately 5000 families, is based mainly on the foodgrains of maize and sorghum. The geology of the catchment is characterised mainly bydark-grey (often carbonaceous) shale, siltstone and fine and medium to coarse-grainedsandstone (Turner, 2000). There is a great diversity of fauna and flora in the catchmentas well as several national parks, the most notable being the Wagendrift nature reserveand the Giant’s Castle nature reserve.
Water Resources Planning, Development and Management54

Figure 1. Location of the study catchment area in KwaZulu-Natal, South Africa
GIS-Assisted Modelling of Soil Erosion in a South African Catchment: Evaluating the USLE and SLEMSA Approachhttp://dx.doi.org/10.5772/52314
55
2.1. Governing equations
The USLE was developed in 1965 by the Agricultural Research Service (ARS) scientistsWischmeier and Smith to predict long time average soil losses in run-off from specific fieldareas in specified cropping and management systems (Wischmeier & Smith, 1978). TheUSLE disaggregates the erosion process into 6 factors that were each determined based onthe analyses of more than 11 000 plot-years of research data from 47 locations in 24 states inthe United States. Notwithstanding its initial north American focus, this approach or its re‐vised successor (RUSLE, see Renard et al., 1991) has been applied in many studies aroundthe world including a particularly interesting study that estimates sediment yield in the past6000 years in the Meuse catchment area (Ward et al., 2009). The basic equation follows:
A R x K x LS x C x P= (1)
Where:
A = Mean annual soil loss (t ha-1 yr-1)
R = Rainfall and runoff erosivity index (J mm.m-2 h-1)
K = Soil erodibility factor (t J-1 mm-1)
LS = Slope and length of slope factor
C = Cropping – Management factor
P = Erosion control factor practice
The SLEMSA model was developed by Elwell (1977) in Zimbabwe to estimate the long-term mean annual soil loss from sheet erosion on arable land (Bonda et al., 1999).SLEMSA was developed on the basis of the USLE and is an attempt to adapt the USLEmodel to an African environment. It is a relatively widely used soil loss model in Afri‐can environments (Elwell & Stocking, 1982), and should be seen as a modelling techni‐que or framework, rather than mechanistic descriptions of the erosion system (Smith,1999). The SLEMSA model divides the soil erosion environment into four physical sys‐tems: crop, climate, soil and topography. The SLEMSA equation is represented schemat‐ically as follows:
Z K x C x X= (2)
Where:
Z = Mean annual soil loss from the land (t ha-1 yr-1)
K = Erodibility factor (t ha-1 yr-1)
C = Crop factor
X = Topographic factor
Water Resources Planning, Development and Management56

2.2. Calculating the USLE factor values
GIS is used to calculate the individual USLE factor grids that, upon multiplication, providethe total potential soil loss within the catchment. A short description of the assumptions andcalculations related to the creation of the factor grids is provided below. For a more compre‐hensive explanation of the methodology see Breetzke (2004).
2.2.1. Rainfall erosivity (R) factor
Cubic surface trend analysis was used to create a Mean Annual Precipitation (MAP) isohye‐tal grid of the site, based on an average of 30 years of annual rainfall data. The rainfall-ero‐sivity grid was obtained by assigning a regional specific formula based on a rainfall-erosivity relationship developed by the Department of Agriculture and Water Supply (1984)to the MAP grid. The equation is based on computed erosion index values (EI30) for a rainfallstation located within the site and is shown below. The erosion index, EI30, for a given stormis a product of the kinetic energy of the falling raindrops and its maximum 30-minute inten‐sity (Engel, 2002):
0.63 153.72R P= - (3)
Where:
P = mean annual precipitation grid (in mm)
2.2.2. Soil erodibility (K) factor
The erodibility factor was calculated according to the nomograph method outlined inWischmeier & Smith (1978) and shown mathematically below. Basic data for estimating soilerodibility were obtained by collecting 120 samples from test sites representative of the ma‐jor soil-mapping units in the catchment. The erodibility was calculated as:
( ) ( ) ( )( )4 1.14 2.1 * 10 * 12 * 3.25 2 2.5 – 3 / 759K OM M s p-= - + - + (4)
Where:
K = erodibility factor (in ton/MJ/mm)
OM = organic matter content (%)
M = texture product
s = structure class
p = permeability class.
A fine particle analysis was conducted to obtain the percentage sand, silt, clay and or‐ganic matter for each test site. These values were used to obtain a soil erodibility value
GIS-Assisted Modelling of Soil Erosion in a South African Catchment: Evaluating the USLE and SLEMSA Approachhttp://dx.doi.org/10.5772/52314
57

per test site. The K factors generated for each test site were subsequently used as a var‐iable for the erodibility grid map composed using the Inverse Distance Weighting(IDW) interpolator. This grid map was summarised to create a table containing mean Kvalues per soil type in the catchment, and a grid created with the mean K values asthe variable.
2.2.3. Topographic (LS) factor
The topographic factor consists of two sub-factors: a slope gradient factor and a slope lengthfactor. A DEM was built through digitising the contours of a 1:50 000 topographic map ofthe study site. The slope length and slope gradient factors (shown below) were calculatedusing the filled DEM and entered into the equation below to produce the topographic factorgrid, following:
( ) ( )0.5 2 / 22 0.065 0.045 0.0065LS L S S= + + (5)
Where:
L = (x/22.13)m, in which x is length of slope (in m), m is 0.5 if the slope is >5 %, 0.4 if between3 and 5 %, 0.3 if between 1 and 3 percent and 0.2 if below 1and L is the slope length factor;
S = (0.43 + 0.30 s + 0.043 s2)/6.613, where s is the gradient (%), and S is the slope gradientfactor.
2.2.4. Crop management (C) factor
Land use types in the site were assigned C factor values based on their percentage canopycover, fall height and ground cover. These values are determined using Thompson’s (1996)classification, aerial photo analysis, information from studies conducted within southern Af‐rica on specific crops and land cover types, (e.g. McPhee & Smithen, 1984) and field observa‐tion of the catchment. In this way mimicking similar research (e.g. Donald, 1997), indetermining appropriate C factor values for a South African catchment in which little localdata is available.
2.2.5. Erosion control practice (P) factor
Information on the support practices or P factor values in the site (e.g. contour intervals, ter‐racing, burning) was collected through field observation. Field examination of the land cov‐er-mapping units revealed the only form of erosion control being practiced in the site wascontour tillage on land under temporary cultivation. According to McPhee and Smithen(1984) a support practice factor value of 0.6 should be assigned to land cover under this con‐trol practice and the remainder of the site is assigned the P factor value of 1, indicating nophysical evidence of erosion control in these areas.
Water Resources Planning, Development and Management58

2.3. Calculating the SLEMSA factor values
GIS is used to calculate the individual SLEMSA factor grids that, upon multiplication, pro‐vide the total potential soil loss within the catchment. A short description of the assump‐tions and calculations related to the creation of the factor grids is provided below. For amore comprehensive explanation of the methodology see Breetzke (2004).
2.3.1. Erodibility (K) factor
The erodibility factor of SLEMSA is determined using the exponential relationship (Morgan,1995):
lnK blnE a= + (6)
Where:
E represents the kinetic energy of raindrops as they strike the soil or vegetation, in J/m2
(Schultze, 1979); and
a and b are functions of the soil erodibility factor (F).
Schultze (1979) calculated a rainfall intensity and kinetic energy equation for the regionwhich is shown below and used to calculate the kinetic energy of the raindrops, E:
2 1 15,16 – 1517.67 . E MAP J m annum- -= (7)
Where:
MAP equals mean annual precipitation (in mm)
The erodibility (F) of the soil is governed by its soil texture and soil type. Using the results ofthe particle size analysis and governed by the United States Department of Agriculture (US‐DA) textural triangle, the texture of 120 soil samples at test sites was determined. An indi‐vidual soil erodibility value (F) was subsequently assigned to each test site according to thespecifications provided by Elwell (1978). An erodibility value per test site was derived andused as a variable for the erodibility grid map composed using the IDW interpolator. Thisgrid map was summarised to create a table containing the mean K values per soil type in thecatchment, and a grid created with the mean K values as the variable.
2.3.2. Slope length (X) factor
The slope length factor consists of two sub-factors: a slope gradient factor and a slope lengthfactor. The slope length and slope gradient factors are calculated using the filled DEM andentered into the equation below to produce the slope length factor grid.
( )( )2 * 0.76 0.53 * 0.076 * / 25.65X L S S= Ö + + (8)
GIS-Assisted Modelling of Soil Erosion in a South African Catchment: Evaluating the USLE and SLEMSA Approachhttp://dx.doi.org/10.5772/52314
59

Where:
X = topographic ratio
L = slope length, in metres (m)
S = slope steepness, in percent (%)
2.3.3. Crop (C) factor
The crop factor (C) is based on a Zimbabwean model originally developed for grassland byElwell and Stocking (1976). A summary of the factor is shown below:
. )0 6( 0 when 50%iC e i-= < (9)
and
( ) 2,3 – 0,01 / 30 when 50%C i i= > (10)
Where:
C = the ratio of soil loss from a crop having an interception value of i, compared to the soilloss from bare fallow;
i = percentage rainfall energy intercepted by the crop
The average percentage cover values for the land cover types were adapted from Schultze’s(1979) index. Validation of these observations was provided through research done by El‐well (1977) and Edwards (1967).
3. Soil loss estimates
The erosion potential according to the USLE and SLEMSA models is shown in Figures 2 and3 respectively. Soil loss rates are classified into five categories ranging from very low, wheresoil loss rates range between 0–1 t-1.ha-1.yr-1, to very high where soil loss rates exceed 25t-1.ha-1.yr-1. Table 1 indicates the soil loss rate per land use type in the site. Soil loss rates wereclassified according to land use types as this allows for an effective subdivision of each soilmodel’s input parameters thus providing useful insight into the components that contributeto the calculated soil loss rates. This knowledge can further aid planners in determining ef‐fective soil conservation strategies at the regional level. The basic conclusion drawn of Table1 is that USLE and SLEMSA provide an average rate per hectare (t.ha-1.yr-1) of differing mag‐nitude. Large differences are indicated per land use type where SLEMSA greatly exceeds theUSLE models’ mean annual rates on the of unmanaged grassland, thicket and scrubland,and indigenous forest land use types, while on the cultivated land use types, the USLEmean annual rates provide higher estimates.
Water Resources Planning, Development and Management60

Figure 2. USLE soil erosion hazard in the study catchment
GIS-Assisted Modelling of Soil Erosion in a South African Catchment: Evaluating the USLE and SLEMSA Approachhttp://dx.doi.org/10.5772/52314
61

Figure 3. SLEMSA soil erosion hazard in the study catchment
Water Resources Planning, Development and Management62

Land-use type1 Area (km2) Coverage (%) Soil loss approach (t.ha-1.yr –1)
USLE SLEMSA
Grassland (unmanaged)2
Forest plantations3
Thicket and scrubland4
Cultivated: TCD 5
Cultivated: TSD6
Residential land7
Waterbodies8
Cultivated: TCI9
Indigenous Forest10
Grassland (managed)11
278.2
18.7
16.4
6.3
5.8
5.6
5.6
2.2
1.5
1.1
81.5
5.5
4.8
1.9
1.7
1.6
1.6
0.7
0.4
0.3
4.1
0.6
1.5
8.5
16.2
8.6
-
13.3
2.1
0.6
15.6
2.8
13.6
2.4
5.4
3.1
-
2.8
30.8
4.3
Average rate per hectare (t.ha-1.yr-1) 4.11 13.88
Table 1. Estimated mean annual soil loss per land use type
Notes:
1. Land cover types are in accordance with the land classification of the CSIR’s – SatelliteApplication Centre of South Africa (CSIR-SAC, 2001).
2. Essentially indigenous species, growing under natural or semi-natural conditions.
3. All areas of systematically planted, man-managed tree resources, composed of primari‐ly exotic species (including hybrids).
4. Areas of densely interlaced trees and shrub species (often forming an impenetrablecommunity).
5. TCD: temporary commercial dryland: Large, uniform, mechanised, well-managed fieldunits under temporary crops with lack of major irrigation schemes.
6. TSD: temporary subsistence dryland: Small field units in close proximity to rural popu‐lation centres. Typically crops produced for individual or local (i.e. village) markets.Low level of mechanisation. Low-level mechanisation.
7. Areas in which people reside on a permanent or near-permanent basis.
8. Areas of (generally permanent) open water.
9. TCI: temporary commercial irrigated: Large, uniform, mechanised, well managed fieldunits under temporary crops using major irrigation schemes.
10. Planted grassland, containing either indigenous or exotic species, growing under man-managed conditions for grazing, hay or turf production or recreation (e.g. golf courses)
GIS-Assisted Modelling of Soil Erosion in a South African Catchment: Evaluating the USLE and SLEMSA Approachhttp://dx.doi.org/10.5772/52314
63

3.1. USLE soil loss per factor
Overlaying the USLE erosion map on the grids of rainfall erosivity, soil erodibility, slopeand length of slope, and crop management factors provides information on those land usetypes associated with high soil loss rates. A statistical comparison of mean factor rates ofUSLE and predicted soil loss values is provided in Table 2.
In general, the mean soil loss rate per land use type correlates most significantly with themean crop management factor values. The cultivated land use types in the catchment hadtypically the highest mean crop management factor values which are indicative of the lowpercentage canopy cover, fall height and ground cover of the cultivated land. Such lowground cover values are typically found on cultivated land in South Africa where the na‐tional ground cover of cultivated land rarely exceeds 40% (Thompson, 1996). The canopycover in the catchment, although affected by the current growth phase of the crop, rarely ex‐ceeded 50% as the crops are temporary (i.e. annuals) and are harvested at the completion ofthe growing season but remain idle until replanted, therefore prone to severe erosion inheavy rainfall events. The fallow period of crops by subsistence farmers in rural KwaZulu-Natal is extensive and coincides with rainfall peaks, particularly in the summer months. Thecanopy cover of forestland in the catchment (i.e. indigenous forest and forest plantations) onthe other hand is continuous. It comprises mostly of evergreen trees beneath which the veg‐etation is multi-layered (Bredenkamp et al., 1996).
The emphasis that USLE places on the ground and canopy cover explains the low soil lossrates of forestland in the USLE approach when compared to the SLEMSA estimates thatrather consider the percentage rainfall energy that is intercepted by the crop than on the per‐centage canopy cover, fall height and ground cover.
Land use type Mean factor rate Soil loss
R K LS C P (t. h-1 yr-1)
Grassland (unmanaged) 629 0.016 10.5 0.040 1.0 4.1
Forest plantations 650 0.015 6.1 0.006 0.6 0.6
Thicket and scrubland 586 0.017 16.6 0.008 0.6 1.5
Cultivated: TCD 557 0.016 4.0 0.421 1.0 8.5
Cultivated: TSD 739 0.017 8.4 0.170 1.0 16.2
Built-up – residential 753 0.014 6.3 0.130 1.0 8.7
Water bodies - - - - - -
Cultivated: TCI 493 0.019 4.1 0.673 13.3
Indigenous forest 764 0.015 25.0 0.006 1.0 2.1
Grassland (managed) 479 0.016 7.2 0.008 1.0 0.6
Table 2. Comparison of mean factor rates of USLE and mean predicted soil loss values per land use type
Water Resources Planning, Development and Management64
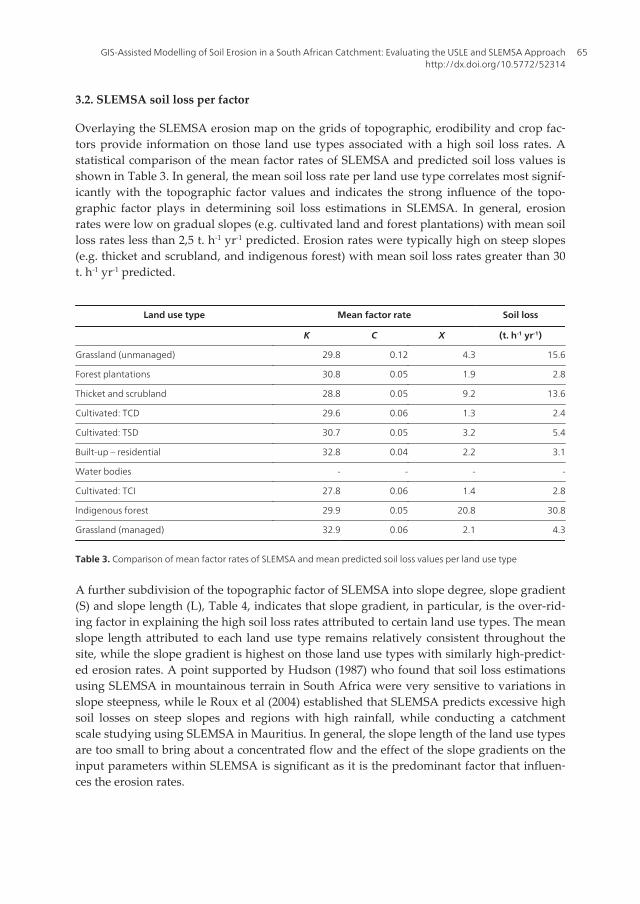
3.2. SLEMSA soil loss per factor
Overlaying the SLEMSA erosion map on the grids of topographic, erodibility and crop fac‐tors provide information on those land use types associated with a high soil loss rates. Astatistical comparison of the mean factor rates of SLEMSA and predicted soil loss values isshown in Table 3. In general, the mean soil loss rate per land use type correlates most signif‐icantly with the topographic factor values and indicates the strong influence of the topo‐graphic factor plays in determining soil loss estimations in SLEMSA. In general, erosionrates were low on gradual slopes (e.g. cultivated land and forest plantations) with mean soilloss rates less than 2,5 t. h-1 yr-1 predicted. Erosion rates were typically high on steep slopes(e.g. thicket and scrubland, and indigenous forest) with mean soil loss rates greater than 30t. h-1 yr-1 predicted.
Land use type Mean factor rate Soil loss
K C X (t. h-1 yr-1)
Grassland (unmanaged) 29.8 0.12 4.3 15.6
Forest plantations 30.8 0.05 1.9 2.8
Thicket and scrubland 28.8 0.05 9.2 13.6
Cultivated: TCD 29.6 0.06 1.3 2.4
Cultivated: TSD 30.7 0.05 3.2 5.4
Built-up – residential 32.8 0.04 2.2 3.1
Water bodies - - - -
Cultivated: TCI 27.8 0.06 1.4 2.8
Indigenous forest 29.9 0.05 20.8 30.8
Grassland (managed) 32.9 0.06 2.1 4.3
Table 3. Comparison of mean factor rates of SLEMSA and mean predicted soil loss values per land use type
A further subdivision of the topographic factor of SLEMSA into slope degree, slope gradient(S) and slope length (L), Table 4, indicates that slope gradient, in particular, is the over-rid‐ing factor in explaining the high soil loss rates attributed to certain land use types. The meanslope length attributed to each land use type remains relatively consistent throughout thesite, while the slope gradient is highest on those land use types with similarly high-predict‐ed erosion rates. A point supported by Hudson (1987) who found that soil loss estimationsusing SLEMSA in mountainous terrain in South Africa were very sensitive to variations inslope steepness, while le Roux et al (2004) established that SLEMSA predicts excessive highsoil losses on steep slopes and regions with high rainfall, while conducting a catchmentscale studying using SLEMSA in Mauritius. In general, the slope length of the land use typesare too small to bring about a concentrated flow and the effect of the slope gradients on theinput parameters within SLEMSA is significant as it is the predominant factor that influen‐ces the erosion rates.
GIS-Assisted Modelling of Soil Erosion in a South African Catchment: Evaluating the USLE and SLEMSA Approachhttp://dx.doi.org/10.5772/52314
65

Land use type Mean factor rate
Slope (º) Slope factor S Slope length L
Grassland (unmanaged) 0.07 137.5 3.0
Forest plantations 0.07 23.4 2.7
Thicket and scrubland 0.07 75.3 3.3
Cultivated: TCD 0.07 20.9 2.2
Cultivated: TSD 0.07 53.3 2.7
Built-up – residential 0.07 26.0 2.6
Water bodies - - -
Cultivated: TCI 0.07 17.1 2.5
Indigenous forest 0.30 130.9 3.3
Grassland (managed) 0.07 6.1 2.8
Table 4. Comparison of slope related mean factor rates and mean predicted SLEMSA soil loss values per land use type
4. Discussion and conclusion
An accurate validation of the soil loss rates obtained is challenging, as there is a dearth ofempirical investigations covering soil loss in South Africa and no calculated soil loss datafrom run-off plots in the catchment. It is beyond the scope of the study to develop a set offield data to assess the accuracy of each model but rather the focus is confined to qualitative‐ly contrasting the soil loss rates obtained for each model and elaborating on causal influen‐ces within each model that play a significant role in eliciting the varying soil loss ratesobtained.
The strikingly different results illustrated pose the question whether or not the use of USLEor SLEMSA for erosion modelling at a catchment scale is valid. The selection of both soil lossmodels to a mountainous quaternary catchment in South Africa must raise questions of ap‐plicability. Numerous studies have been conducted investigating the use of USLE in SouthAfrican conditions, most notably, Donald (1997), McPhee & Smithen (1984) and Crosby,McPhee & Smithen (1983), these researchers propose that USLE could be applied to SouthAfrican conditions provided input data for local conditions could be developed. Site-specificcorrect parameters however, have not been determined for both models in South Africa andneither model has been comprehensively tested and calibrated to determine its practicalityin a South African environment. Yet the majority of soil erosion prediction research conduct‐ed in South Africa has been done using the USLE, Revised Universal Soil Loss Equation(RUSLE) and SLEMSA models (Smith, 1999). The USLE (e.g. Smith et al., 2000) and SLEMSA(e.g. Schulze, 1979; Hudson, 1987) have, however, been applied on catchment scales else‐where and these studies demonstrate that the models are capable of adequately predicting
Water Resources Planning, Development and Management66

soil loss under different land use, despite being applied to conditions beyond the originaldatabase (Le Roux et al., 2004).
The spatial scales with which these models have been applied in practice are not the spatialscale for which they have been conceived. The mismatch between the small spatial and tem‐poral scales of data collection and model conceptualisation, and the large spatial and tempo‐ral scales of most intended uses of models (Renschler & Harbor, 2002) is a major challenge insoil erosion modelling, which has become even more important with the increasing use ofmodels linked to GIS. The problem with spatial scale and erosion modelling is two fold – onthe one hand by estimating potential soil loss at a catchment scale the spatial error in theapplication is propagated. Jetten et al (1999) states the reason being that at a catchment scalethe input maps are often created from a limited amount of field data and with a lot of as‐sumptions and therefore highly subjective; there are also many methods of interpolationthat are equally valid but give different results. He concludes that all these problems meanthat there is a greater opportunity for concatenation and amplification of any errors and un‐certainties in the input data within the model. On the other hand however GIS is able tomodel catchment-scale applications and treat heterogeneous catchments of varying size toproduce regional results for a catchment-scale conservation strategy.
4.1. Future developments
The USLE and SLEMSA soil loss models were used to estimate soil loss rates in a quaternarycatchment in the KwaZulu-Natal province of South Africa. The mean annual soil loss is esti‐mated approximately at 4.11 t.ha-1.yr-1 by the USLE and 13.88 t.ha-1.yr-1 by SLEMSA. TheSLEMSA rates greatly exceed the USLE rates on the unmanaged grassland, thicket andscrubland, and indigenous forest land use types, while on the cultivated land use types, theUSLE mean annual rates provide higher estimates. Overlaying the USLE and SLEMSA ero‐sion maps on the respective factor grids provided an insight into factors that played a signif‐icant role in eliciting the varying soil loss rates obtained. For the USLE, the cropmanagement factor provided the most significant influence in determining high soil lossrates, whereas in SLEMSA the topographic factor was the predominant factor that influ‐enced the erosion rates per land use type. Our analysis shows that SLEMSA is very sensitiveto variations in slope steepness whereas the effects of crop and canopy cover within USLEare the strongest determinants of high erosion potential.
The USLE and SLEMSA factor calculations and resulting local soil loss estimates need to bevalidated by measuring erosion from run-off plots or applying a correction for inter-catch‐ment deposition by means of a Sediment Delivery Ratio (SDR). To date such validationwork is lacking (Le Roux et al., 2007). Developing effective regional values for land usetypes and soils within each soil erosion assessment should occur as uncertainty regardingthe allocation of crop factor and soil erodibility values within a study can have a significantimpact on the results produced, particularly within a South African context. The focus onthe variable results obtained should however be shifted towards what models are best suit‐ed for each spatial application, the problem for developing countries, where data is scarceand unreliable, is that they do not have a choice in the selection of a model for determining
GIS-Assisted Modelling of Soil Erosion in a South African Catchment: Evaluating the USLE and SLEMSA Approachhttp://dx.doi.org/10.5772/52314
67

erosion potential simply because of a lack of data resources. Both the methodology and re‐sults obtained through the paper pose the question whether or not such a study can standup to scientific scrutiny, the answer is provided in the lack of the realistic alternatives forsoil loss estimation in South Africa. For the foreseeable future, the USLE and SLEMSA aswell as the methodology employed still have a role to play.
Acknowledgements
Pam. Porter and Nicolene Fourie at the Chief Directorate of Surveys and Mapping in Mow‐bray, Cape Town provided electronic data. Hendrik Smith at the ARC - Institute for Soil,Climate and Water provided documents required for application in the study. Merete Styc‐zen at the Danish Hydrology Institute (DHI) provided the ArcView software extension,SEAGIS that led to the development of the study. Use of laboratory facilities at the Universi‐ty of Pretoria.
Author details
G. D. Breetzke1, E. Koomen2 and W. R. S. Critchley3
1 Department Of Geography, University Of Canterbury, New Zealand
2 Department of Spatial Economics, VU University Amsterdam, the Netherlands
3 Resource Development Unit, Centre For International Cooperation, VU UniversityAmsterdam, the Netherlands
References
[1] Bonda, F., Mlava, J., Mughogho, M., and Mwafongo, K., 1999. Recommendations forfuture research to support erosion hazard assessment in Malawi. Malawi Environ‐mental Monitoring Programme Report. University of Arizona, USA.
[2] Bredenkamp, G., Granger, J.E., Hoffman, T., Low, B., Lubke, R.A. Mckenzie, B., Rebe‐lo, G. and Van Rooyen, N., 1996. Vegetation of South Africa, Lesotho and Swaziland.Department of Environmental Affairs and Tourism, Pretoria.
[3] Breetzke, G. D., 2004. A critique of soil erosion modelling at a catchment scale usingGIS. Unpublished MSc thesis, Vrije Universiteit Amsterdam, The Netherlands.
[4] CSIR-SAC, 2001. Illustrated field guide. Council For Scientific And Industrial Re‐search - Satellite Applications Centre (CSIR-SAC), Pretoria.
Water Resources Planning, Development and Management68

[5] Crosby, C.T., Mcphee, P.J. and Smithen, A.A., 1983. Role of soil loss equations in esti‐mating sediment production, In: H. Maaren (ed), Proceedings of the Workshop onthe effect of rural land use and catchment management on water resources, TR 113,Pretoria, 188-213.
[6] Department of Agricultural and Technical Services, 1976. Soil Loss Estimator forSouthern Africa, Natal Agricultural Research Bulletin 7.
[7] Department of Agriculture and Water Supply, 1984. National Soil ConservationManual, Chapter 6: Predicting rainfall erosion losses, 1-12.
[8] Donald, P.D., 1997. GIS modelling of erosion and sediment yield in a semi-arid envi‐ronment. MSc. Thesis, University of the Witwatersrand.
[9] Edwards, D., 1967. A plant ecological survey of the Tugela River Basin. Natal Townand Regional Planning Commission, Pietermaritzburg.
[10] Elwell, H.A. and Stocking, M.A., 1976. Vegetal cover to estimate soil erosion hazardin Rhodesia. Geoderma (Amsterdam), 15, 61-70.
[11] Elwell, H.A. and Stocking, M.A., 1982. Developing a simple yet practical method ofsoil loss estimation. Tropical Agriculture (Trinidad), 59, 43-48.
[12] Elwell, H.A., 1977. A soil loss estimation system for southern Africa. Rhodesian De‐partment of Conservation and Extension, Research Bulletin, No. 22.
[13] Elwell, H.A., 1978. Soil loss estimation; compiled works of the Rhodesian multi-disci‐plinary team on soil loss estimation. Institute of Agricultural Engineering, Borrow‐dale, Salisbury.
[14] Engel, B., 2002. Appendix A: Estimating Soil Loss with the USLE. College of engi‐neering, Purdue University, West Lafayette, IN
[15] Garland, G., Hoffman, T. and Todd, S., 1999. Soil Degradation. In: Hoffman, T.,Todd, S., Ntshona, Z. and Turner, S., 1999, Land Degradation in South Africa. Na‐tional Botanical Institute of South Africa.
[16] Hudson, C.A., 1987. A regional application of SLEMSA in the Cathedral Peak area ofthe Drakensberg. Unpublished MSc. Thesis, University of Cape Town, South Africa.
[17] Jetten, V., De Roo, A. and Favis-Mortlock, D., 1999. Evaluation of field-scale andcatchment-scale soil erosion models. Catena, 37, 521–541.
[18] Le Roux, J.J., Sumner, P.D. and Rughooputh, S.D.D.V., 2005. Erosion modelling andsoil loss prediction under changing land use for a catchment on Mauritius. South Af‐rican Geographical Journal, 87, 129-140.
[19] Le Roux, J.J., Newby, T.S., Sumner, P.D., 2007. Monitoring soil erosion in South Afri‐ca at a regional scale: review and recommendations. South African Journal of Sci‐ence, 103 (7-8), 329-335.
GIS-Assisted Modelling of Soil Erosion in a South African Catchment: Evaluating the USLE and SLEMSA Approachhttp://dx.doi.org/10.5772/52314
69

[20] Lutchmiah, J., 1999. Soil erosion in the central midlands of KwaZulu-Natal: A com‐parative study. The South African Geographical Journal, 81, 143-147.
[21] Mcphee, P.J. and Smithen, A.A., 1984. Application of the USLE in the Republic ofSouth Africa. Agricultural Engineering in South Africa. 18 (1), 5-13.
[22] Meadows, M.E., 2003. Soil erosion in the Swartland, Western Cape Province, SouthAfrica: Implications of past and present policy and practice. Environmental Science& Policy, 6, 17–28.
[23] Midgley, D.C., 1952. A preliminary survey of the surface water resources of the Un‐ion of South Africa. PhD thesis. University of KwaZulu-Natal, Pietermaritzburg.
[24] Morgan, R.P.C., 1995. Soil Erosion and Conservation. (2nd ed.), (UK: Longman).
[25] Renard, K.G., Foster, G.R., Weesies, G.A. and Porter, J.P., 1991. RUSLE-revised uni‐versal soil loss equation. Journal of Soil and Water Conservation 46, 30-33.
[26] Renschler, C.S. and Harbor, J., 2002. Soil erosion assessment tools from point to re‐gional scales – the role of geomorphologists in land management research and imple‐mentation. Geomorphology, 47, 189-209.
[27] Rooseboom, A., 1976. Reservoir sediment deposition rates. In 2nd International Con‐gress on Large Dams, Mexico.
[28] Schultze, R.E., 1979. Soil loss in the Key Area of the Drakensberg – a regional applica‐tion of the ‘Soil Loss Estimation Model for Southern Africa’ (SLEMSA). In: Hydrolo‐gy and Water Resources of the Drakensberg, Pp. 149-167, Natal Town and RegionalPlanning Commission, Pietermaritzburg, South Africa.
[29] Schwartz, H.I. and Pullen, R.A., 1966. A guide to the estimation of sediment yield inSouth Africa. Civil engineering in South Africa, pp. 343-346.
[30] Smith, H.J., 1999. Application of Empirical Soil Loss Models in southern Africa: a re‐view. South African Journal of Plant and Soil, 16, 158-164.
[31] Smith, H.J., Van Zyl, A.J., Claasens, A.S., Schoeman, J.L. and Laker, M.C., 2000. Soilloss modelling in the Lesotho Highlands Water Project catchment areas, South Afri‐can Geographical Journal, 82, 64-69.
[32] South African Department Of Agriculture, 2007, Strategic plan DoA 2007; Part 2: Sec‐toral overview and performance. Department of Agriculture, Pretoria.
[33] Stocking, M.A., 1984. Erosion and Soil Productivity: a Review. Soil Conservation Pro‐gramme, Land and Water Development Division, Rome.
[34] Thompson, M., 1996. A standard land-cover classification for remote-sensing applica‐tions in South Africa. South African Journal of Science, 92, 34-42.
[35] Turner, D.P., 2000, Soils of KwaZulu-Natal and Mpumalanga: recognition of naturalsoil bodies. PhD thesis. University of Pretoria, Pretoria.
Water Resources Planning, Development and Management70

[36] Ward, P.J., Van Balen, R.T., Verstraeten, G., Renssen, H. and Vandenberghe, J., 2009.The impact of land use and climate change on late Holocene and future suspendedsediment yield of the Meuse catchment. Geomorphology 103, 389–400.
[37] Wischmeier, W.H. and Smith, D.D., 1978. Predicting rainfall erosion losses. Agricul‐tural Handbook 537. United States Department of Agriculture. Agricultural ResearchService, Washington, DC.
GIS-Assisted Modelling of Soil Erosion in a South African Catchment: Evaluating the USLE and SLEMSA Approachhttp://dx.doi.org/10.5772/52314
71