GIS applications in teaching and research
57
GIS applications in teaching and research: Final report of MSc course at the Department of Geosciences and Geography, University of Helsinki, spring 2019 KUJALA, S. & MUUKKONEN, P. (Eds.) DEPARTMENT OF GEOSCIENCES AND GEOGRAPHY C17
Transcript of GIS applications in teaching and research

GIS applications in teaching
and research: Final report of MSc course at the Department of
Geosciences and Geography, University of
Helsinki, spring 2019 KUJALA, S. & MUUKKONEN, P. (Eds.)
DEPARTMENT OF GEOSCIENCES AND GEOGRAPHY C17

GIS applications in teaching and research:
Final report of MSc course at the Department of Geosciences and
Geography, University of Helsinki, spring 2019
EDITORS:
SANNA KUJALA
PETTERI MUUKKONEN
DEPARTMENT OF GEOSCIENCES AND GEOGRAPHY C17 / HELSINKI 2019

Publisher:
Department of Geosciences and Geography
Faculty of Science
P.O. Box 64, 00014 University of Helsinki, Finland
Journal:
Department of Geosciences and Geography C17
ISSN-L 1798-7938
ISBN 978-951-51-4923-7 (PDF)
http://helda.helsinki.fi/
Helsinki 2019

Kujala, S. & Muukkonen, P. (Eds.): GIS applications in teaching and research. Helsinki:
University of Helsinki, Faculty of Science. Department of Geosciences and Geography C17.
Table of contents
Preface
Muukkonen, P. & Kujala, S.
GIS experts' journey from university to working life: the role of university education
1–3
Chapter I
Brendell, C., Vuorinne, I., Mäkelä, S. & Muukkonen, P.
Open source modelling of rock aggregate resources in the Pirkanmaa Region 4–17
Chapter II
Kujala, S., Lämsä, S., Määttänen, A-M. & Muukkonen, P.
Developing a higher education e-learning GIS course for 3D analyses in
geography 18–30
Chapter III
Järvinen, M., Jylhä, M. & Muukkonen, P.
GIS-opetusmateriaalien kehittäminen tiedekasvatuksen käyttöön 31–40
Chapter IV
Ruikkala, T., Aalto, I., Peltoniemi, M. & Salmivaara, A, Tuominen, S. & Muukkonen, P.
Applying open GIS data to study wetland forests and ditches in Finland 41–52
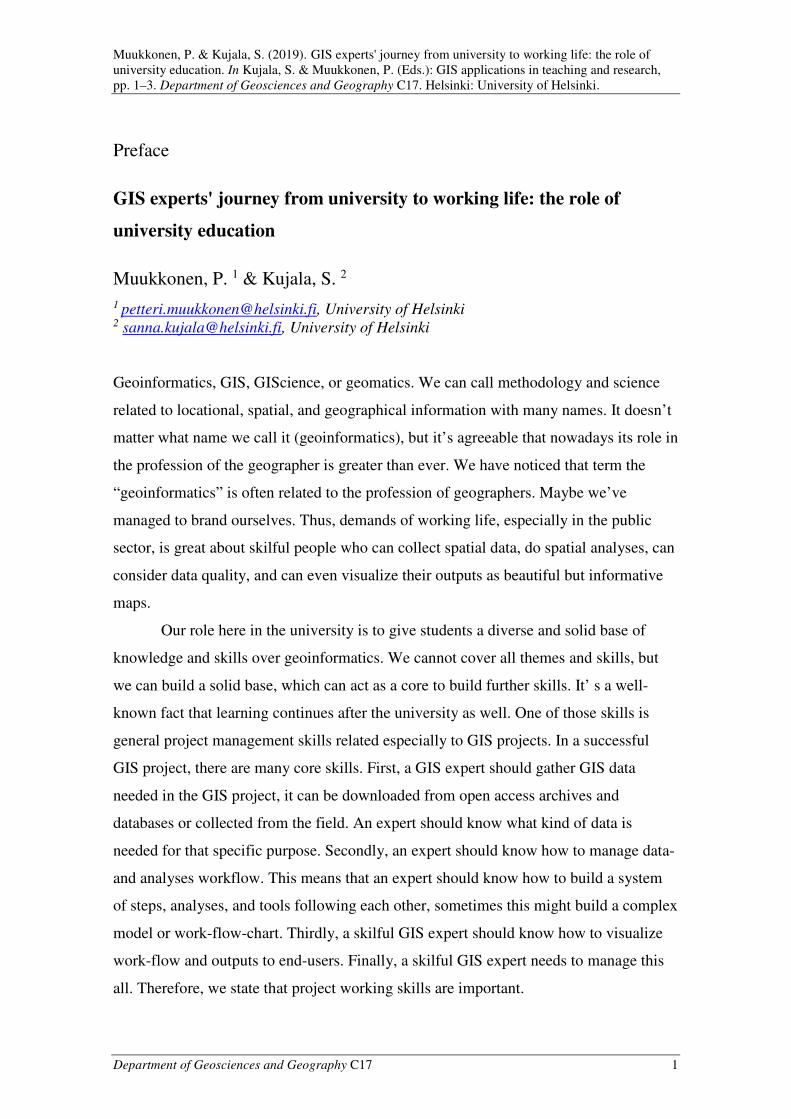
Muukkonen, P. & Kujala, S. (2019). GIS experts' journey from university to working life: the role of
university education. In Kujala, S. & Muukkonen, P. (Eds.): GIS applications in teaching and research,
pp. 1–3. Department of Geosciences and Geography C17. Helsinki: University of Helsinki.
Department of Geosciences and Geography C17 1
Preface
GIS experts' journey from university to working life: the role of
university education
Muukkonen, P. 1 & Kujala, S. 2
1 [email protected], University of Helsinki 2 [email protected], University of Helsinki
Geoinformatics, GIS, GIScience, or geomatics. We can call methodology and science
related to locational, spatial, and geographical information with many names. It doesn’t
matter what name we call it (geoinformatics), but it’s agreeable that nowadays its role in
the profession of the geographer is greater than ever. We have noticed that term the
“geoinformatics” is often related to the profession of geographers. Maybe we’ve
managed to brand ourselves. Thus, demands of working life, especially in the public
sector, is great about skilful people who can collect spatial data, do spatial analyses, can
consider data quality, and can even visualize their outputs as beautiful but informative
maps.
Our role here in the university is to give students a diverse and solid base of
knowledge and skills over geoinformatics. We cannot cover all themes and skills, but
we can build a solid base, which can act as a core to build further skills. It’ s a well-
known fact that learning continues after the university as well. One of those skills is
general project management skills related especially to GIS projects. In a successful
GIS project, there are many core skills. First, a GIS expert should gather GIS data
needed in the GIS project, it can be downloaded from open access archives and
databases or collected from the field. An expert should know what kind of data is
needed for that specific purpose. Secondly, an expert should know how to manage data-
and analyses workflow. This means that an expert should know how to build a system
of steps, analyses, and tools following each other, sometimes this might build a complex
model or work-flow-chart. Thirdly, a skilful GIS expert should know how to visualize
work-flow and outputs to end-users. Finally, a skilful GIS expert needs to manage this
all. Therefore, we state that project working skills are important.

Muukkonen, P. & Kujala, S. (2019). GIS experts' journey from university to working life: the role of
university education. In Kujala, S. & Muukkonen, P. (Eds.): GIS applications in teaching and research,
pp. 1–3. Department of Geosciences and Geography C17. Helsinki: University of Helsinki.
Department of Geosciences and Geography C17 2
To answer this demand, the Department of Geosciences and Geography,
University of Helsinki, has established a specific graduate-level course to teach general
project management skills related to GIS project working. This is now the second time
the course GEOG-G303 GIS Project Work is organized. During the spring term, 2018
was the first time this course was available (Tyystjärvi & Muukkonen 2018). The
current course was held during the spring term of 2019. In this collection of articles, we
are publishing final articles of each project. All projects are jointly executed together
with geography students and senior researchers. Now, we had a diverse collection of a
different kind of project works varying from the higher education and science education
to the GIS analyses studying natural resources in Finland. In Chapter I, Brendell et al.
(2019) write how one can combine various open-access GIS data sources to study and
model rock aggregate resources, which are important bulk building material in the
growing society. They have concentrated on the Pirkanmaa region in south-west
Finland. Chapter II shows a graduate-level e-learning course for 3D analyses (Kujala
et al. 2019). In their chapter, Kujala et al. (2019) provide a pedagogical reasoning and
an overall structure and content of that GIS e-learning course. In Chapter III, Järvinen
et al. (2019) discuss how one can develop GIS learning material for the science
education to be used in the elementary or high school level teaching (prior the
university level). This chapter is mainly in Finnish because the audience of this article is
mainly Finnish geography teachers. Finally, Chapter IV written by Ruikkala et al.
(2019) shows a methodology on how one should calculate derived GIS-based variables
for ditching density in wetland forests. Wetland forests play an important in the boreal
forest ecosystem and have a high economic value in the forestry.
During these GIS project works, done in close co-operation with research
projects, researchers and teachers, graduate-level geography students have learned
important project management skills. They have learned to plan a GIS project, to
schedule project’s tasks and goals, to develop project’s communication within the
project participants and even to end-users and to the audience, and they have also
learned to report the project work-flow and main outcomes (oral presentations, poster,
and written documents. We see that these general skills are beneficial when one is
leaving university and head to work life.

Muukkonen, P. & Kujala, S. (2019). GIS experts' journey from university to working life: the role of
university education. In Kujala, S. & Muukkonen, P. (Eds.): GIS applications in teaching and research,
pp. 1–3. Department of Geosciences and Geography C17. Helsinki: University of Helsinki.
Department of Geosciences and Geography C17 3
References
Brendell, C., Vuorinne, I., Mäkelä, S. & Muukkonen, P. (2019). Open source modelling
of rock aggregate resources in the Pirkanmaa Region. In Kujala, S. &
Muukkonen, P. (Eds.): GIS applications in teaching and research, pp. 4−17.
Department of Geosciences and Geography C17. Helsinki: University of
Helsinki.
Järvinen, M, Jylhä, M. & Muukkonen, P. (2019). GIS-opetusmateriaalien kehittäminen
tiedekasvatuksen käyttöön. In Kujala, S. & Muukkonen, P. (Eds.): GIS
applications in teaching and research, pp. 31−40. Department of Geosciences and
Geography C17. Helsinki: University of Helsinki.
Kujala, S., Lämsä, S., Määttänen, A-M. & Muukkonen, P. (2019). Developing a higher
education e-learning GIS course for 3D analyses in geography. In Kujala, S. &
Muukkonen, P. (Eds.): GIS applications in teaching and research, pp. 18−30.
Department of Geosciences and Geography C17. Helsinki: University of
Helsinki.
Ruikkala, T., Aalto, I., Peltoniemi, M. & Salmivaara, A., Tuominen, S. & Muukkonen,
P. (2019). Applying open GIS data to study wetland forests and ditches in
Finland. In Kujala, S. & Muukkonen, P. (Eds.): GIS applications in teaching and
research, pp. 41−52. Department of Geosciences and Geography C17. Helsinki:
University of Helsinki.
Tyystjärvi, V. & Muukkonen, P. (Eds.) (2018). Creating, managing, and analysing
geospatial data and databases in geographical themes. Department of Geosciences
and Geography C14. Helsinki: University of Helsinki.
https://helda.helsinki.fi/handle/10138/254913

Brendell, C., Vuorinne, I., Mäkelä, S. & Muukkonen, P. (2019). Open source modelling of rock aggregate
resources in the Pirkanmaa Region. In Kujala, S. & Muukkonen, P. (Eds.): GIS applications in teaching
and research, pp. 4−17. Department of Geosciences and Geography C17. Helsinki: University of
Helsinki.
Department of Geosciences and Geography C17 4
Chapter I
Open source modelling of rock aggregate resources in the Pirkanmaa
Region
Brendell, C. 1, Vuorinne, I. 2, Mäkelä, S. 3 & Muukkonen, P. 4
1 [email protected], University of Helsinki 2 [email protected], University of Helsinki 3 [email protected], University of Helsinki 4 [email protected], University of Helsinki
Abstract
Aggregate rock has a constant demand in urban areas as a construction material for
infrastructure. To be economically viable, the extraction sites for this resource should
be located close to the construction sites, which can be complicated due to conflicting
land uses. In this research, rock aggregate resources were modelled for the Pirkanmaa
region in Western Finland with an open source GIS-approach, using free and open
software and data. The resulting model shows the quantities of rock aggregate resources
in Pirkanmaa municipalities, as well as the spatial distribution of the resource in the
area.
Keywords: rock aggregate; GIS; open source; modelling, Pirkanmaa
1. Background
Rocks are a key material when constructing buildings and roads, and particular when
establishing the foundation. This role leads to a high demand in expanding regions
undergoing urbanization. Due to the scale and weight of the material, the extraction
areas of rock aggregate are optimally located near the areas of deployment (Poulin et
al., 1994). This is complicated by the competition of other land uses such as national
parks, housing or other human infrastructure which conflict with the extraction areas
(Mäkelä, 2018). A map depicting the rock resources and their volume helps regional
planners and decision-makers in identifying the optimal location for extraction. The
objective of this work was to create such cartographic visualization by using open
source geographical information systems (GIS).

Brendell, C., Vuorinne, I., Mäkelä, S. & Muukkonen, P. (2019). Open source modelling of rock aggregate
resources in the Pirkanmaa Region. In Kujala, S. & Muukkonen, P. (Eds.): GIS applications in teaching
and research, pp. 4−17. Department of Geosciences and Geography C17. Helsinki: University of
Helsinki.
Department of Geosciences and Geography C17 5
The needed shape of rock for construction is aggregate (Smith & Collis, 1993).
Therefore, loose sand or gravel would be the most profitable source since solid rock
needs to be crushed for the extraction while sands and gravel can just be shovelled.
However, lucrative sand and gravel sources are on their way of depletion. In addition,
these areas serve another important task as they provide fresh groundwater or
recreational areas (Britschgi, 2001; Räisänen, 2004; Lonka et al., 2015). Due to this
reason, solid rock as a source for rock aggregate is rising in significance in areas of high
demand (Rintala, 2003; Räisänen, 2004; Lonka et al., 2015). Furthermore, the costlier
extraction and processing is countered by the decrease of the carriage distance (Brown,
2012; Lonka et al., 2015).
Many factors have to be considered when mapping rock aggregate resources.
They range from social, environmental to economic issues where preservation acts
against profitable growth (Ross & Bobrowsky, 2002; Mäkelä 2018). When you add the
consideration that the sought rock resources have to be located as close as possible to
the deployment site, the extraction site has to compete against other land uses in the
urban region (Bobrowsky & Manson, 1998; Brown, 2012; Dahl et al., 2012). City
planners have to take this into consideration, still, without the knowledge of an
approximate amount of the available amount of rock, it is difficult to create a
futureproof city plan. Our work is addressing this problem by providing insights into the
location and volume of solid rock resources usable for rock aggregate extraction.
The approach used in this research is based on Mäkelä’s (2018) previous study
in the Helsinki metropolitan area. Due to the fact that this model worked for the
Helsinki metropolitan area, we are replicating and applying this method for another
region. The emphasis is on providing a complication-free reproducibility with an open
source approach.
2. Open GIS
Recent decades have witnessed a growing interest in open GIS practices (Steiniger
2012; Sui 2014), reflecting a wider trend of openness in social and technological
environments. According to Sui (2014), open GIS should include open data, open
software, open hardware, open standards, open research collaboration, open publication,

Brendell, C., Vuorinne, I., Mäkelä, S. & Muukkonen, P. (2019). Open source modelling of rock aggregate
resources in the Pirkanmaa Region. In Kujala, S. & Muukkonen, P. (Eds.): GIS applications in teaching
and research, pp. 4−17. Department of Geosciences and Geography C17. Helsinki: University of
Helsinki.
Department of Geosciences and Geography C17 6
open funding, and open education/learning. This approach is seen beneficial as it can
improve GIS products and practices through decentralized development, but also
because it can facilitate new applications and approaches in GIS research. The rock
aggregate resource model (Mäkelä 2018) used in this research project is based on
utilizing both sources of open data and open software environments.
3. Data
Data for the model included topographical features derived from the topographic
database (Maastotietokohteet, 2018) by National Land Survey of Finland (NLS),
elevation model by NLS (Korkeusmalli 10m, 2016) and exposed bedrock derived from
superficial deposits data by Geological Survey of Finland (GSF) (Maaperä 1:20 000,
2015). Description of all the used data is shown in Table 1. All the data are free and
have an open license.
Topographic database by NLS, from which topographical data was derived, is a
dataset of Finland’s topographical features, covering the entire country
(Maastotietokohteet, 2018). The information is thoroughly updated every 3-10 years,
depending on the area. Some of the information, such as transport networks, are updated
more frequently, with the aim to keep them up to date. Another dataset by NLS, 10 m
elevation model, is currently the most accurate digital elevation model for the entire
country, with 1.4 m precision (Korkeusmalli 10m, 2016).
Superficial deposits datasets by GSF, from which the exposed bedrock data was
extracted, was produced during 1972-2007 for land use planning, mapping and
inventory of natural resources as well as for environmental management and scientific
research (Maaperä 1:20 000, 2015). Deposit type is defined from the basal deposit at a
depth of one meter; thus, exposed bedrock class includes all the exposed bedrocks and
areas with less than 1 m of topsoil.
Table 1. Description of all the data used in the rock aggregate model (NLS = National Land Survey of
Finland; GSF = Geological Survey of Finland).
Data Source Name Type Scale License Acquired
Elevation NLS Elevation model 10m
Raster Grid size 10 m
CC/BY4.0 / NLS
28.3.2019

Brendell, C., Vuorinne, I., Mäkelä, S. & Muukkonen, P. (2019). Open source modelling of rock aggregate
resources in the Pirkanmaa Region. In Kujala, S. & Muukkonen, P. (Eds.): GIS applications in teaching
and research, pp. 4−17. Department of Geosciences and Geography C17. Helsinki: University of
Helsinki.
Department of Geosciences and Geography C17 7
Transport network
NLS Topographic database
Vector line / polygon
1:20 000 CC/BY4.0 / NLS
23.3.2019
Pipelines NLS Topographic database
Vector line 1:20 000 CC/BY4.0 / NLS
23.3.2019
Lakes NLS Topographic database
Vector polygon
1:20 000 CC/BY4.0 / NLS
23.3.2019
Warehouse areas
NLS Topographic database
Vector polygon
1:20 000 CC/BY4.0 / NLS
23.3.2019
Buildings NLS Topographic database
Vector polygon
1:20 000 CC/BY4.0 / NLS
23.3.2019
Military areas
NLS Topographic database
Vector polygon
1:20 000 CC/BY4.0 / NLS
23.3.2019
Protected areas
NLS Topographic database
Vector polygon
1:20 000 CC/BY4.0 / NLS
23.3.2019
Protected objects
NLS Topographic database
Vector polygon / point
1:20 000 CC/BY4.0 / NLS
23.3.2019
Exposed bedrock
GSF Superficial deposits
Vector polygon
1:20 000 Modified data, © GTK 2019
29.3.2019
4. Study area
The model used in this research has previously been tested for the metropolitan area of
Helsinki (Mäkelä, 2018) which is the most populated region in Finland. Second, comes
Tampere Central Region, which has been one of the fastest-growing regions in Finland
in the last five years with Oulu and Helsinki and should, therefore, have a high demand
for rock aggregate (Population growth by sub-regional, 2019). Thus, Pirkanmaa sub-
region where Tampere is located was chosen as the target area.
5. Preparing the data
Handling the sorting of the data manually would have been laborious and time-
consuming as the number of files in our dataset exceeded three figures. Thus, we wrote
Python scripts to handle the data. Each individual shapefile had a descriptive code in the
name. First, a script unzipped each individual tile:

Brendell, C., Vuorinne, I., Mäkelä, S. & Muukkonen, P. (2019). Open source modelling of rock aggregate
resources in the Pirkanmaa Region. In Kujala, S. & Muukkonen, P. (Eds.): GIS applications in teaching
and research, pp. 4−17. Department of Geosciences and Geography C17. Helsinki: University of
Helsinki.
Department of Geosciences and Geography C17 8
import zipfile,fnmatch,os
def unzip():
rootPath = r"./data/realsuomi/Varsinais-"
pattern = '*.zip'
for root, dirs, files in os.walk(rootPath):
for filename in fnmatch.filter(files, pattern):
print(os.path.join(root, filename))
zipfile.ZipFile(os.path.join(root, filename)).extractall(os.path.join(root,
filename.split(".")[0]))
unzip()
Next, another script iterated over the folders, subfolders and files and moved the files
according to their descriptive code at the beginning of the filename to their designated
folders:
import os
import shutil
fullpath = os.path.join
buildings = "./data/realsuomi/bufflayers/Buildings"
pipelines = "./data/realsuomi/bufflayers/Pipelines"
protected = "./data/realsuomi/bufflayers/Protected"
...
def sorting():
for dirname, dirnames, filenames in os.walk(rawdata_directory):
for filename in filenames:
source = fullpath(dirname, filename)
if filename.startswith("j_"):
shutil.move(source, fullpath(pipelines, filename))
elif filename.startswith("r_"):
shutil.move(source, fullpath(buildings, filename))
elif filename.startswith("s_"):
shutil.move(source, fullpath(protected, filename))
…
sorting()

Brendell, C., Vuorinne, I., Mäkelä, S. & Muukkonen, P. (2019). Open source modelling of rock aggregate
resources in the Pirkanmaa Region. In Kujala, S. & Muukkonen, P. (Eds.): GIS applications in teaching
and research, pp. 4−17. Department of Geosciences and Geography C17. Helsinki: University of
Helsinki.
Department of Geosciences and Geography C17 9
Then another script merged the files in each individual folder according to their
descriptive code at the end of the file name which indicated the type of shape
(Polygons, vectors, points):
def merge():
folder = path.Path("./data/bufflayers/Water")
destination = path.Path("./data/bufflayers/Merged/Water")
shapefiles = folder.glob("*v.shp")
gdf = pandas.concat([
gpd.read_file(shp)
for shp in shapefiles
]).pipe(gpd.GeoDataFrame)
gdf.to_file(destination / 'river.shp')
merge()
Some files still included attributes that we had to filter. This task was done with GDAL
(Geospatial Data Abstraction Library). This command goes over the attributes of the
shapefile and creates a new shapefile containing only the rows of the needed attribute:
ogr2ogr -where LUOKKA=36100 36100.shp springs.shp
The raster data for the DEM was also provided in tiles which had to be merged. On this
problem we used a Python script containing a GDAL command:
import glob
import os
file_list = glob.glob("*.tif")
files_string = " ".join(file_list)
command = "gdal_merge.py -o output.tif -of gtiff " + files_string
os.system(command)

Brendell, C., Vuorinne, I., Mäkelä, S. & Muukkonen, P. (2019). Open source modelling of rock aggregate
resources in the Pirkanmaa Region. In Kujala, S. & Muukkonen, P. (Eds.): GIS applications in teaching
and research, pp. 4−17. Department of Geosciences and Geography C17. Helsinki: University of
Helsinki.
Department of Geosciences and Geography C17 10
6. Workflow
The workflow for the model is shown in figure 1. The model consists of a limitation
layer, the exposed bedrock and the volume of the extractable rock aggregate. The area
of the limitation layer was defined by creating a buffer zone around areas and objects
from the topographic database that restrict mining activities. Lengths of the buffer zones
are based on legislations and industry standards (Mäkelä 2018). Once the limitation
layer was established, it was used for an overlay analysis (difference) with the exposed
bedrock to define areas suitable for rock extraction.
Figure 1. Workflow for the rock aggregate modelling.

Brendell, C., Vuorinne, I., Mäkelä, S. & Muukkonen, P. (2019). Open source modelling of rock aggregate
resources in the Pirkanmaa Region. In Kujala, S. & Muukkonen, P. (Eds.): GIS applications in teaching
and research, pp. 4−17. Department of Geosciences and Geography C17. Helsinki: University of
Helsinki.
Department of Geosciences and Geography C17 11
To calculate the volume of extractable rock aggregates, upper and lower limit of the
non-restricted bedrocks were estimated. The upper limit was extracted from the
elevation model. The lower limit is based on the estimated level of groundwater. This
level was modelled by first adding an elevation value from the elevation model to the
centroids of all lakes, springs and rivers and then creating a Triangulated Irregular
Network (TIN) layer from these centroids. The resulting lower limit was then subtracted
from the upper limit to get the extractable depth of the exposed bedrocks.
The extractable volumes of the rock aggregates were then estimated by
calculating the mean depth of the aggregate polygons and multiplying it by the area of
the polygon. Furthermore, the total volume of the rock aggregate resources was
calculated for each municipality.
7. Results
Generally, Pirkanmaa has large quantities of rock aggregate resources available. Yet,
the resources and possible extraction sites are unevenly distributed among
municipalities (Figure 2; Figure 3). While Ruovesi and Orivesi have over 5000 M m3 of
rock aggregate resources, Valkeakoski, Pirkkala, and Akaa do not have a utilisable
amount of rock resources available (Figure 2).
Figure 2. Quantities of the rock aggregate resources in the Pirkanmaa municipalities.

Brendell, C., Vuorinne, I., Mäkelä, S. & Muukkonen, P. (2019). Open source modelling of rock aggregate
resources in the Pirkanmaa Region. In Kujala, S. & Muukkonen, P. (Eds.): GIS applications in teaching
and research, pp. 4−17. Department of Geosciences and Geography C17. Helsinki: University of
Helsinki.
Department of Geosciences and Geography C17 12
Figure 3. A map showing the spatial distribution of rock aggregate resources in the Pirkanmaa area.
8. Discussion
The Geological Survey of Finland has its own dataset for the available rock resources in
the whole of Finland. Most of the results here are in line with this data, but our model

Brendell, C., Vuorinne, I., Mäkelä, S. & Muukkonen, P. (2019). Open source modelling of rock aggregate
resources in the Pirkanmaa Region. In Kujala, S. & Muukkonen, P. (Eds.): GIS applications in teaching
and research, pp. 4−17. Department of Geosciences and Geography C17. Helsinki: University of
Helsinki.
Department of Geosciences and Geography C17 13
shows more resource areas. This could be due to filtration of smaller areas by the
Geological Survey for their dataset. In addition to the volumes, the bedrock aggregate
dataset by GSF offers information about the rock type and point data about test results
of the rock in many areas.
For calculating the expected groundwater table, we used a Triangulated Irregular
Network (TIN) with rivers and seas as a source. The result of the TIN only gives us a
rough estimation of the groundwater table, thus, providing an accurate volume of
extractable rock is not possible with our data. Enhancing the quality of the estimation is
possible if a more accurate dataset for the groundwater table is used.
While our model can give an approximate estimate of the number of rock
resources, rock quality has to be determined in field studies at the respective sites.
However, the rock quality is not a big concern in Finland as most of the Finnish bedrock
consists of plutonic or high-grade metamorphic rocks (Mäkelä, 2018; Härme, 1980;
Laitala, 1991; Grönholm, 2000a, 2000b; Vuokko, 2004).
Not included in our model are regional plans as they are not yet implemented
and can, therefore, be changed. For instance, one huge possible extraction site may be
sterilized by a plan for a motocross track. Evaluating the importance of each land use is
an errand city planners and decision-makers have to do. Also not included are regional
plans’ important biodiversity areas which should be preserved. City planners and
decision-makers should avoid these areas as locations for quarries.
9. Web Map
For easy accessibility, we created a web map of our results. It is produced in Python
with the Bokeh library. The code for the web map can be found in appendix 1 while the
web map can be found on this website: https://brenchri.github.io/rockaggregate.html.

Brendell, C., Vuorinne, I., Mäkelä, S. & Muukkonen, P. (2019). Open source modelling of rock aggregate
resources in the Pirkanmaa Region. In Kujala, S. & Muukkonen, P. (Eds.): GIS applications in teaching
and research, pp. 4−17. Department of Geosciences and Geography C17. Helsinki: University of
Helsinki.
Department of Geosciences and Geography C17 14
References
Britschgi, R., 2001. Adjusting of groundwater protection and aggregate production. In:
Kuula-Väisänen P. & Uusinoka, R. (eds.), Proceedings of Aggregate 2001 –
Environment and Economy (Helsinki 2001), Tampere University of Technology,
Laboratory of engineering geology 51, 377–380.
Bobrowsky, P.T. & Manson, G.K., 1998. Modeling sand and gravel deposits and
aggregate resources potential. In: Bobrowsky, P.T. (ed.), Aggregate Resources, A
global perspective. A.A.Balkema, Rotterdam, The Netherlands, pp. 231–254.
Brown, T.J., 2012. Mineral potential mapping: a new spatial decision support tool for
industry and planners. In: Hunger, E. & Walton, G. (eds.), Proceedings of the 16th
Extractive Industry Geology Conference, held at the University of Portsmouth 8th
to 11th September 2010. Extractive Industry Geology Conferences Ltd, pp. 76–
87.
Dahl, R., Wolden K., Erichsen, E., Ulvik A., Neeb P.-R. & Riiber K., 2012. Sustainable
management of aggregate resources in Norway. Bulletin of Engineering Geology
and the Environment 71, 251–255. doi:
https://doi.org/10.1007/s10064-011-0397-0
Geologinen tutkimuskeskus (2015). Maaperä 1:20 000.
<http://tupa.gtk.fi/paikkatieto/meta/maapera_20_50k.html> Accessed 25. 4. 2019
Grönholm, S., 2000a. Kalliokiviainestutkimukset Uudellamaalla 1989–1999, osa I,
hteenveto. Geological Survey of Finland, archived report KA 51/99/2.
Grönholm, S., 2000b. Kalliokiviainestutkimukset Uudellamaalla, osa II, POSKI-
projektin kalliokiviainestutkimukset Uudellamaalla 1989–1999 Geological Survey
of Finland, archived report KA 51/99/1.
Härme, M., 1980. The general geological map of Finland, 1:400 000, Sheet C1–D1.
(English summary). Geological Survey of Finland, Espoo, 96 p.
Laitala, M., 1991. Helsingin kartta-alueen kallioperä. Summary: Pre-Quaternary rocks
of the Helsinki map-sheet area. Geological Map of Finland 1:100 000,
Explanation to the maps of pre-quaternary rocks. Geological Survey of Finland,
Espoo, 49 p.
Lonka, H. (ed.), Loukola-Ruskeeniemi, K. (ed.), Ehrukainen, E., Gustafsson, J.,
Honkanen, M., Härmä, P., Jauhiainen, P., Kuula, P., Nenonen, K. & Pellinen, T.,
2015. Kiviaines ja luonnonkiviteollisuuden kehitysnäkymät. Työ- ja
elinkeinoministeriön julkaisuja 54/2015. 73 p.
Maanmittauslaitos (2016). Korkeusmalli 10m.
<https://etsin.avointiede.fi/storage/f/paituli/mml/dem/mml_korkeusmalli10m_201
6.pdf> Accessed 25. 4. 2019
Maanmittauslaitos (2018). Maastotietokohteet.
<https://www.maanmittauslaitos.fi/sites/maanmittauslaitos.fi/files/old/maastotieto
kohteet.pdf> Accessed 25. 4. 2019
Mäkelä, S. (2018). 2.5D open source modeling of rock aggregate resources in the

Brendell, C., Vuorinne, I., Mäkelä, S. & Muukkonen, P. (2019). Open source modelling of rock aggregate
resources in the Pirkanmaa Region. In Kujala, S. & Muukkonen, P. (Eds.): GIS applications in teaching
and research, pp. 4−17. Department of Geosciences and Geography C17. Helsinki: University of
Helsinki.
Department of Geosciences and Geography C17 15
Helsinki metropolitan area. Bulletin of the Geological Society of Finland 90: 55–
67
Poulin, R. C. Pakalnis, K. Sinding. Aggregate resources: Production and environmental
Constraints. Environmental Geology (1994) 23:221–227.
Ross, I. K. & Bobrowsky P.T., 2002. Aggregate potential mapping. In: Bobrowsky, P.T.
(ed.), Geoenvironmental Mapping: methods, theory and practice, 1st Edition. A.A.
Balkema, Lisse, The Netherlands, pp. 195–222.
Räisänen, M., 2004. From outcrops to dust – mapping, testing and quality assessment of
aggregates. Academic dissertation, University of Helsinki. Publications of the
Department of Geology D1, 14 p.
Smith, M.R. & Collis L., 1993. Aggregates: Sand,Gravel and Crushed Rock Aggregate
for Construction Purposes (2nd edition). Geological Society Engineering Geology
Special Publication 9. Geological Society, London, 330 p.
Statistics Finland (2019). Population growth by sub-regional unit, 1980–2018.
<http://www.stat.fi/tup/seutunet/tampere_vaesto_en.html> Accessed 25.4.2019.
Steiniger, Stefan & Hunter, Andrew. (2013). The 2012 Free and Open Source GIS
Software Map – A Guide to facilitate Research, Development and Adoption.
Computers, Environment and Urban Systems. 39. doi:
https://doi.org/10.1016/j.compenvurbsys.2012.10.003.
Sui, Daniel. (2014). Opportunities and Impediments for Open GIS. Transactions in GIS
18(1). doi: https://doi.org/10.1111/tgis.12075.
Vuokko, J., 2004. Kalliokiviainestutkimukset Itä-Uudellamaalla ja Uudellamaalla 2004
–täydennyskartoitus. Geological Survey of Finland, archived report C/KA

Brendell, C., Vuorinne, I., Mäkelä, S. & Muukkonen, P. (2019). Open source modelling of rock aggregate
resources in the Pirkanmaa Region. In Kujala, S. & Muukkonen, P. (Eds.): GIS applications in teaching
and research, pp. 4−17. Department of Geosciences and Geography C17. Helsinki: University of
Helsinki.
Department of Geosciences and Geography C17 16
Appendix 1
# Necessary libraries
import bokeh.layouts
import geopandas as gpd
import pandas as pd
import pandas_bokeh
pandas_bokeh.output_notebook()
import bokeh
from bokeh.plotting import save, figure
from bokeh.transform import transform
# Importing the data for the creation of the interactive map
rock = "./data/pirkanmaa_rock_aggregate.shp"
mun_source = "./Pirkanmaa/Municipalities/pirkanmaa_muncipalities.shp"
df_mun = gpd.read_file(mun_source)
df_rock = gpd.read_file(rock)
df_rock = df_rock.rename(columns={'rock': 'Aggregate volume in M cubic
metre'})
# Bokeh command for plotting the municipality borders
figure = df_mun.plot_bokeh(title="Resource map",
simplify_shapes=10,fill_alpha=None, fill_color=None,
line_color="black", show_figure=False)
# Bokeh command for plotting the rock resource data

Brendell, C., Vuorinne, I., Mäkelä, S. & Muukkonen, P. (2019). Open source modelling of rock aggregate
resources in the Pirkanmaa Region. In Kujala, S. & Muukkonen, P. (Eds.): GIS applications in teaching
and research, pp. 4−17. Department of Geosciences and Geography C17. Helsinki: University of
Helsinki.
Department of Geosciences and Geography C17 17
df_rock.plot_bokeh(simplify_shapes=500,
figure=figure,
category="Aggregate volume in M cubic metre",
line_color=None,
show_colorbar=True,
colormap="Spectral",
colormap_uselog=True, legend=True)
# Command for scaling the plot according to the website design
figure.sizing_mode = 'scale_width'
# Output filepath
outfp = r"./data/test_map.html"
# Save the map
save(figure, outfp)

Kujala, S., Lämsä, S., Määttänen, A-M. & Muukkonen, P. (2019). Developing a higher education e-
learning GIS course for 3D analyses in geography. In Kujala, S. & Muukkonen, P. (Eds.): GIS
applications in teaching and research, pp. 18−30. Department of Geosciences and Geography C17.
Helsinki: University of Helsinki.
Department of Geosciences and Geography C17 18
Chapter II
Developing a higher education e-learning GIS course for 3D analyses
in geography
Kujala, S. 1, Lämsä, S. 2, Määttänen, A-M. 3 & Muukkonen, P. 4
1 [email protected], University of Helsinki 2 [email protected], University of Helsinki 3 [email protected], University of Helsinki 4 [email protected], University of Helsinki
Abstract
In this paper, we are showing how we designed and implemented a graduate-level GIS
e-learning course for 3D analyses in GIS and geoinformatics. This work was done in
the GIS project work course in the Department of Geosciences and Geography,
University of Helsinki. In the developed e-learning course students can study
independently on the e-learning platform. We based a lot of own prior experience
towards the design of the course, and we justified our decisions with topical pedagogical
scientific knowledge about GIS teaching. The main aim was to make a challenging but
interesting overview of the topic 3D in GIS. The course combines readings, practices,
and final essay on a chosen topic. The course is divided into six different areas under
3D. After these, the final essay measures the learning within a form of deeper thinking
skills. Course’s goal is to teach the student to use their own knowledge and skills on
data processing methods later the future in their working life. In addition, self-motivated
learning is highly encouraged throughout this e-learning course.
Keywords: 3DGIS; distance studies; e-learning; geography teaching; higher education;
online studies
1. Introduction
1.1 Background
We wanted to design a new GIS course for graduate geography students. The aim was
to fulfil a need to introduce geographers into the possibilities of three-dimensional (3D)
GIS and its analyses. The requirement for the project work was to make the course
completely into an online-self-study course that can be completed as distance studies at
any time depending on a student’s own preferences. In this way, they will have a less

Kujala, S., Lämsä, S., Määttänen, A-M. & Muukkonen, P. (2019). Developing a higher education e-
learning GIS course for 3D analyses in geography. In Kujala, S. & Muukkonen, P. (Eds.): GIS
applications in teaching and research, pp. 18−30. Department of Geosciences and Geography C17.
Helsinki: University of Helsinki.
Department of Geosciences and Geography C17 19
formal studying atmosphere with the course, since they can complete it from anywhere
at any time (Harris 2003; Şeremet & Chalkley 2015; Robinson et al. 2015). The course
uses one of the four approaches of the usage of ICT (information and communications
technology) based learning, called fully online learning (Lynch 2008). The course does
not need attendance at the campus, but students will follow an online curriculum. Due
to an increased need for 3D GIS analyses skills in general, we decided to create an
online course about the topic, and we also decided that the course would use an e-
learning platform Moodle and the completion would be up to the students themselves.
We created a course that would be interesting for the present and future graduate-level
geography students. The “non-cookbook” practical style encourages deep learning
within the students (Şeremet & Chalkley 2015; Argles 2017). One of the goals was also
to create a course that can last at least some upcoming years without too drastic changes
or need for updating into the structure of the course. Naturally, this course will be
improved in the future due to the rapid improvements in the field of GIS, 3D GIS, and
computer sciences.
The course is divided into six sections of practical topics and into a final
scientific essay (see Figure 1). The topics of the course will guide the student through
different topics of 3D GIS and the possibilities of 3D visualization in mapping. These
topics were notified to be the core of this theme. The overall goal was to give a good
overview of interesting topics in the field of the 3D GIS analyses and visualisation in
geography.

Kujala, S., Lämsä, S., Määttänen, A-M. & Muukkonen, P. (2019). Developing a higher education e-
learning GIS course for 3D analyses in geography. In Kujala, S. & Muukkonen, P. (Eds.): GIS
applications in teaching and research, pp. 18−30. Department of Geosciences and Geography C17.
Helsinki: University of Helsinki.
Department of Geosciences and Geography C17 20
Figure 1. Workflow and course literature of the 3D course.

Kujala, S., Lämsä, S., Määttänen, A-M. & Muukkonen, P. (2019). Developing a higher education e-
learning GIS course for 3D analyses in geography. In Kujala, S. & Muukkonen, P. (Eds.): GIS
applications in teaching and research, pp. 18−30. Department of Geosciences and Geography C17.
Helsinki: University of Helsinki.
Department of Geosciences and Geography C17 21
This 3D GIS course is a five-credit (5 ECTS) course that requires a good basis of
existing extensive knowledge of geoinformatics, GIS, and its systems. Pre-course
requirements for completion of this course are at least Introduction to Advanced
Geoinformatics at the University of Helsinki, however, any other more advanced GIS
courses give a valid basis for completion of this 3 D course. Students will work
independently a lot, so it’s recommended to have confidence in doing their own
research with materials and methods in the field of GIS. The learning outcomes for the
course are in a way that the students will have a broad overview of varied topics in 3D
GIS. Students will also have increased skills in searching for more information and
using open software in their research. Each study credit is equivalent to approximately
27 hours of work, in total, the course is designed to take approximately 135–140 hours
of working time consisting of readings, practicals (material research, GIS analysis, and
writing), and a final essay. It is intended that each practical would take approximately 8
to 10 hours to complete, and a student can use the remaining time to do the final project
and essay that takes a little bit longer to complete.
1.2 Why do we need a 3D GIS online course?
We perceive our surroundings in three dimensions; the Earth is not flat, and neither are
the events occurring on it. Three-dimensional (3D) data is essential for accurate
descriptions, analysis, and predictions of both natural and man-made phenomena. In a
typical GIS application, it is usual that at least two of these dimensions (x and y) are
spatial extents in a known coordinate system and the third (z) is elevation data. The
third dimension can, however, represent some other attribute as well, e.g. the
concentration of a chemical or the literacy rate of a given area.
3D data can be divided into two main types: surface and objects (Abdul-Rahman
& Pilouk 2007). A surface is a representation of an attribute in three-dimensional space,
and its format is most commonly raster, triangulated mesh or some other continuous
digital surface. An object is discrete and is usually represented in a vector format. These
vectors can be a point, polygons, and polylines in a three-dimensional space.
A need for different 3D applications methods is increasing in the field of GIS.
This course will improve student basic knowledge from 2D to 3D. The study program

Kujala, S., Lämsä, S., Määttänen, A-M. & Muukkonen, P. (2019). Developing a higher education e-
learning GIS course for 3D analyses in geography. In Kujala, S. & Muukkonen, P. (Eds.): GIS
applications in teaching and research, pp. 18−30. Department of Geosciences and Geography C17.
Helsinki: University of Helsinki.
Department of Geosciences and Geography C17 22
of geography, University of Helsinki, is currently lacking a course that will study GIS
purely from the viewpoint of 3D. Now, the array of GIS courses offered by the
department is scattered from the standpoint of 3D. This new online course offers a
clear-cut and more in-depth perspective to 3D data and 3D analysis in GIS.
2. The study material of the course
2.1 Study structure
Each topic is based on different spatial extents or perspectives of 3D data applications,
were learning the objective is to deepen knowledge in separate 3D spatial data areas.
The course includes six topics:
1. What is 3D GIS?
2. Large spatial scale 3D mapping
3. Ultra-high-resolution 3D
4. Natural environment
5. Urban landscape and urban environment
6. Future of 3D
Each topic introduces applications within the main topic where some are scientific
articles, and some are practicals. The course workflow is categorized by accurate spatial
extents: spaceborne for large spatial extents, aerial for landscape, and in-situ and
unmanned aerial vehicles or a low aerial for local spatial extents.
The course uses the Moodle e-learning platform. This platform was chosen
because it is familiar to the students of the University of Helsinki and it is suitable for
varying number of participants.
2.2 Topic 1: What is 3DGIS
The first topic introduces the basic elements of 3D data and its main types: surfaces and
objects. The student is challenged to think outside-the-box by scientific reading. For
example, the article by Schröder and Cabral (2019) introduces 3D visualization of CO2
emissions of transport. The aim of this is to underline that the z-coordinate can represent

Kujala, S., Lämsä, S., Määttänen, A-M. & Muukkonen, P. (2019). Developing a higher education e-
learning GIS course for 3D analyses in geography. In Kujala, S. & Muukkonen, P. (Eds.): GIS
applications in teaching and research, pp. 18−30. Department of Geosciences and Geography C17.
Helsinki: University of Helsinki.
Department of Geosciences and Geography C17 23
other parameters than the only elevation. The main aim is to teach basic knowledge
about 3D GIS and the vast array of different data types, and how they relate to the
spatial extent of coverage. Different platforms are described briefly in Figure 2.
Students will get familiar with several observation platforms that can be used when
producing 3D GIS data (Figure 2).
The first practical will be an easy visualization practical using the 2-meter
resolution Lidar-derived DEM provided by the National Land Survey of Finland. The
data is open access data and it is free to use. The student will also learn basics through
question list. Answers should be included to report.
Figure 2. Different 3D data gathering platforms and their relation to spatial coverage and spatial
resolution. (drawing: A-M. Määttänen)

Kujala, S., Lämsä, S., Määttänen, A-M. & Muukkonen, P. (2019). Developing a higher education e-
learning GIS course for 3D analyses in geography. In Kujala, S. & Muukkonen, P. (Eds.): GIS
applications in teaching and research, pp. 18−30. Department of Geosciences and Geography C17.
Helsinki: University of Helsinki.
Department of Geosciences and Geography C17 24
2.3 Topic 2: Large spatial scale 3D mapping
Here we introduce the main data sources for near-global scale topographic data and
discuss the trade-offs in data quality versus spatial coverage. The main data source
discussed is the near-global coverage Shuttle Radar Topographic Mission (SRTM) by
NASA. Global investigation of topography is crucial because elevation constitutes one
of the most important boundary conditions (Schumann et al. 2007). The global coverage
topography data enables investigation of different fluxes of material and understanding
global patterns of for example species distribution. It is evident, that these large scale
and large extent data sets require a lot of storage space and processing power, the
students will go through a demo of Google’s Earth Engine (GEE) remote sensing data
processing interface. GEE is a geodatabase with an impressive assemblage of different
remote sensing data, i.e. the complete LANDSAT archive (Mutanga & Kumar 2019).
Students will use GEE to run a short script that visualizes SRTM topographic data using
Google’s processing resources. The practical will introduce students to bathymetry and
underwater 3D applications.
2.4 Topic 3: Ultra-high-resolution 3D
UAV (unmanned aerial vehicle) methods have closed the resolution gap between field
observations and remote sensing data (Anderson & Gaston 2013). Together with novel
computer vision algorithms, these methods have democratized the availability of 3D
spatial data. This topic is focused on Structure from Motions (SfM) and its potential in
ecosystem-scale GIS problems. The literature introduces SfM and the practical is a
basic SfM workflow. The practical is carried out with a commercial software
Pix4Dmapper. The rationale behind the decision of using commercial software instead
of an open one is that there are licences available for this software in the department and
the graphical user interface logical.
2.5 Topic 4: Natural environment
We wanted to differentiate the 3D GIS applications for urban areas and the natural
environment because the modelling of the movements of energy and metrical on the
earth is different in natural landscapes compared to environments that have been heavily

Kujala, S., Lämsä, S., Määttänen, A-M. & Muukkonen, P. (2019). Developing a higher education e-
learning GIS course for 3D analyses in geography. In Kujala, S. & Muukkonen, P. (Eds.): GIS
applications in teaching and research, pp. 18−30. Department of Geosciences and Geography C17.
Helsinki: University of Helsinki.
Department of Geosciences and Geography C17 25
shaped by humans. Furthermore, the questions that arise are usually different between
the two environments. We acknowledge, that human activity is a pronounced
geomorphic process and this division simplifies complex systems (Tarolli & Sofia
2016). This division was made on the account of simplicity and because students might
want to treat these environments as separate due to their field of specialization under the
geography discipline.
The natural environment topic introduces some focal applications of 3D GIS like
geomorphometry, 3D change detection (Quin et al. 2016), and risk evaluation,
especially from flood map point of view (Carswell & Lukas 2018). These topics are
approached in the literature via different datasets. Johnson et al. (2015) review how
LiDaR has revolutionized the way Scandinavian geomorphology is studied. The
practical is a sea-level rise risk map using OpenTopography data and raster calculator.
A simple analysis of how the coastline will be submerged in different sea-level rise
scenarios.
2.6 Topic 5: Urban landscape and urban environment
Urban areas are also a big topic in the 3D GIS. Several cities have created detailed 3D
city models which are improving their decision making and urban planning. Through
this section, the student will deepen their knowledge about 3D city models and
cityGMLstandards. Additionally, the students will learn how to gather 3D data from
urban areas, depending is it object-based or more detailed model. Practical includes
basic building exercise, where learning outcome is to create LOD1 (Level-of-detail)
model from the city. Another practical task is to create own urban application analysis,
which depends on the student own interests. The student will have a few tips on how to
do their own analysis.
2.7 Topic 6: Future of 3D
The topic of the future of 3D GIS was chosen on the basis that the rapid technological
evolution will take the field of 3D even further into different fields in science. We
wanted to have the last topic to be a bit different from other practicals so we decided to
make a freeform essay on a chosen field of possibilities of 3D GIS in the future.

Kujala, S., Lämsä, S., Määttänen, A-M. & Muukkonen, P. (2019). Developing a higher education e-
learning GIS course for 3D analyses in geography. In Kujala, S. & Muukkonen, P. (Eds.): GIS
applications in teaching and research, pp. 18−30. Department of Geosciences and Geography C17.
Helsinki: University of Helsinki.
Department of Geosciences and Geography C17 26
Marques et al. (2015) utilized 3D GIS application in AR (augmented reality) for cultural
heritage modelling and Jazbinšek and Hren (2018) also used AR and 3D GIS to create a
new way to visualize GIS data. In the practical, the students will read about three
different uses for future 3D GIS and one ESRI article on the usage of their CityEngine
in research (Fabricius 2018).
2.8 Topic 7 – Final assignment
The main learning objective of having a final assignment is to have students to prove
their knowledge on gathered concepts and realize learning in the form of a written
report. By writing the assignment on free-to-choose topics we can ensure that the
students are motivated and interested in their own topic. Şeremet and Chalkley (2015)
also found out that by using GIS on bigger phenomena the students improve other skills
aside from GIS as well. For example, students showed an increase in spatial learning
and ecology knowledge after producing maps on forestry. Final essays are also a
common way to assess the combined knowledge from learned theory and finished
practicals, although it had also been argued that the students experience the essay-based
assessments to be not as useful as other course practicals (Şeremet & Chalkley 2015).
Despite this, after a small survey and discussions with graduate-level geography
students we decided to apply some essay-based elements to this course.
2.9 Providing course feedback
After the course, students are required to fill out a feedback questionnaire before the
completion of this course. The e-learning nature of the course demands that course
should evolve and grow to fill into the users’ needs. It is obvious that feedback is
required and needed for the future of the course. Sack and Roth (2017) used the term
exit survey to describe their online course feedback survey. According to the survey of
Sack and Roth (2017), students answered several questions on the topics relating to the
content of the course and possible improvements to them.
The first questions ask students how well they felt that the learning objectives
were articulated and how well the provided literature and practicals helped to reach
these targets. The next questions were aimed at finding out if the students liked how the

Kujala, S., Lämsä, S., Määttänen, A-M. & Muukkonen, P. (2019). Developing a higher education e-
learning GIS course for 3D analyses in geography. In Kujala, S. & Muukkonen, P. (Eds.): GIS
applications in teaching and research, pp. 18−30. Department of Geosciences and Geography C17.
Helsinki: University of Helsinki.
Department of Geosciences and Geography C17 27
course was organized and whether the independent form of studying was considered to
be helpful in terms of learning. These questions are essential for course development
and will be used as the initial measure of how well we, as a group, performed in
creating an online 3D GIS course.
The next three questions in the survey are meant for self-reflection. One asks if
the amount of work required for completion of the course corresponding to the five
credit. The other two questions ask if the student felt that the topics were interesting and
if they felt that they gained some useful knowledge and skills during the course.
All the questions described above were scaled from Completely agree to
Completely disagree on a four-point scale. At the end of the survey, there are two open
questions. These are aimed for any feedback or course-development ideas that may have
arisen during competition of the course.
Before launching the course available to all students, we used the initial
feedback from the few students who tested the course. Feedback was a pivotal part of
course development. In addition, it was important because this course was developed as
project work in the graduate-level course. Therefore, the role of feedback in the early
stages of the developing was even more pronounced.
3. Discussion
Lynch (2008) argued over ten years ago that technology will change the future and
work life, which it indeed did. A rise in the popularity of e-learning within and outside
of higher education institutions has been increasingly noticeable in recent years. We
argue that this is since information is more accessible now than ever and, in addition,
learning is becoming more scattered.
One possible threat to e-learning is that students are dropping e-learning courses
more often than traditional lecture-based courses (Robinson et al. 2015). Our goal was
to avoid this by making the topics varied and this way more suitable for students with
varying interests in the field of 3D GIS. Students are also given the freedom to decide
their final report from different topics throughout the course to work on.
The students not having excessively detailed instructions to the practicals might
cause some students to end up having to go through several unproductive searches

Kujala, S., Lämsä, S., Määttänen, A-M. & Muukkonen, P. (2019). Developing a higher education e-
learning GIS course for 3D analyses in geography. In Kujala, S. & Muukkonen, P. (Eds.): GIS
applications in teaching and research, pp. 18−30. Department of Geosciences and Geography C17.
Helsinki: University of Helsinki.
Department of Geosciences and Geography C17 28
online for help and answers to the practicals (Lynch 2008). However, this varies a lot
from student to student, since it’s tied to their prior skill level and knowledge on GIS
programs and open data search. The solution for this could be turning the course into a
larger open MOOC (Massive Open Online Course) course, where students could learn
more from each other as Robinson et al. (2015), found out in their research. One
possible solution would also be to encourage students to create study groups for the
completion of the course.
It was discussed a lot within the team that our project group had almost no prior
knowledge of how to produce a university course other than from the student’s
perspective. We conducted several overlooks to the methodology of GIS teaching on the
university level and found that our own views on a good lecture series matched to
scientific research in several cases (Harris 2003; Lynch 2008; Robinson et al. 2015;
Şeremet & Chalkley 2015; Argles 2017).
It was discussed that there might be problems with some used programs during
the course, for example, our program of choice, QGIS, changes very rapidly (Argles
2017), which could turn out to be problematic for the completion of some of the
practicals. However, this should not be a big problem since the instructions to the
practicals are not too detailed. In case the software will change during the course or
during the next years, we highly encourage students to search additional information
from the user forums of the programs since they have proven to be very reliable in most
of the cases. In the case of bigger problems with completion, the students can always
turn to the help of the course instructor. To preserve the integrity of the learning
materials we created them to be more open and leaning towards self-studying methods.
Our aim was to find as new articles as possible that will stay actual longer. Topic 6 was
left a bit more open since it is almost impossible to predict the future possibilities of 3D
GIS, but the topic was included since we believe that 3D GIS will be more prominent in
the field of GIS.
Acknowledgements
This e-learning course is developed as project work in the graduate-level course GEOG-
G303 GIS project work in the Department of Geosciences and Geography, University of

Kujala, S., Lämsä, S., Määttänen, A-M. & Muukkonen, P. (2019). Developing a higher education e-
learning GIS course for 3D analyses in geography. In Kujala, S. & Muukkonen, P. (Eds.): GIS
applications in teaching and research, pp. 18−30. Department of Geosciences and Geography C17.
Helsinki: University of Helsinki.
Department of Geosciences and Geography C17 29
Helsinki. We would like to thank all those who have helped us during this work.
Hopefully, this course will inspire others as much as it did us.
References
Abdul-Rahman, A., & Pilouk, M. (2007). Spatial data modelling for 3D GIS. Springer
Science & Business Media.
Argles, T. (2017). Teaching practical science online using GIS: a cautionary tale of
coping strategies. Journal of GeoGraphy in higher education, 41(3), 341–352.
Anderson, K., & Gaston, K. J. (2013). Lightweight unmanned aerial vehicles will
revolutionize spatial ecology. Frontiers in Ecology and the Environment, 11(3),
138-146.
Biljecki, F., Stoter, J., Ledoux, H., Zlatanova, S., & Çöltekin, A. (2015). Applications of
3D city models: State of the art review. ISPRS International Journal of
GeoInformation, 4(4), 2842–2889.
Carswell Jr, W. J., & Lukas, V. (2018). The 3D Elevation Program – Flood risk
management (No. 2017-3081). US Geological Survey.
Fabricius, T. (2018). CityEngine and Uber envision a new Future for the curb. ArcGIS
blog. https://www.esri.com/arcgis-blog/products/city-engine/3d-gis/cityengine-
and-uber-envision-a-new-future-for-the-curb/ accessed 2.5.2019.
Harris, R. (2003). Building a GIScience community in cyberspace: Reflections on
GIScOnline. Journal of Geography in Higher Education, 27(3), 279–295.
Jazbinšek, J. & Hren, G. (2018). Visualization of electric energy production in Posavje
in a mixed reality environment. Journal of Energy Technology, 11, 27–35.
Johnson, M. D., Fredin, O., Ojala, A. E., & Peterson, G. (2015). Unraveling
Scandinavian geomorphology: the LiDAR revolution. GFF, 137(4, 245–251.
Lynch, K., Bednarz, B., Boxall, J., Chalmers, L., France, D., & Kesby, J. (2008).
Elearning for geography's teaching and learning spaces. Journal of Geography in
Higher Education, 32(1), 135–149.
Machete, R., Falcão, A. P., Gomes, M. G., & Rodrigues, A. M. (2018). The use of 3D
GIS to analyse the influence of urban context on buildings’ solar energy potential.
Energy and Buildings, 177, 290–302.
Marques, L., Tenedório, J. A., Burns, M., Romão, T., Birra, F., Marques, J., & Pires, A.
(2017). Cultural Heritage 3D Modelling and visualisation within an Augmented
Reality Environment, based on Geographic Information Technologies and mobile
platforms. Architecture, City and Environment, 11(33), 117–136.
Mutanga, O., & Kumar, L. (2019). Google Earth Engine Applications.
Robinson, A. C., Kerski, J., Long, E. C., Luo, H., DiBiase, D., & Lee, A. (2015). Maps
and the geospatial revolution: teaching a massive open online course (MOOC) in
geography. Journal of Geography in Higher Education, 39(1), 65-82.

Kujala, S., Lämsä, S., Määttänen, A-M. & Muukkonen, P. (2019). Developing a higher education e-
learning GIS course for 3D analyses in geography. In Kujala, S. & Muukkonen, P. (Eds.): GIS
applications in teaching and research, pp. 18−30. Department of Geosciences and Geography C17.
Helsinki: University of Helsinki.
Department of Geosciences and Geography C17 30
Sack, C. M., & Roth, R. E. (2017). Design and evaluation of an Open Web Platform
cartography lab curriculum. Journal of Geography in Higher Education, 41(1), 1–
23.
Schumann, G., Matgen, P., Cutler M.E.J, Black, A., Hoffmann, L., Pfister L. (2008)
Comparison of remotely sensed water stages from LiDAR, topographic contours
and SRTM. Photogrammetry and Remote Sensing. 63, 283–296.
Schröder, M., & Cabral, P. (2019). Eco-friendly 3D-Routing: A GIS-based 3D-
RoutingModel to estimate and reduce CO2-emissions of distribution transports.
Computers, Environment and Urban Systems, 73, 40-55.
Scianna, A., & La Guardia, M. (2018). Globe Based 3D GIS solutions for Virtual
Heritage. International Archives of the Photogrammetry, Remote Sensing &
Spatial Information Sciences, 42.
Şeremet, M., & Chalkley, B. (2015). Student perspectives on the teaching of
geographical information systems (GIS) in geography degrees. Journal of
Geography in Higher Education, 39(1), 18–36.
Smith, M.W., Carrivick, J.L., & Quincey, D.J. (2016). Structure from motion
photogrammetry in physical geography. Progress in Physical Geography, 40(2),
247–275.
Szabo, V. (2018). How 3D visualization is reshaping our world.
https://parameters.ssrc.org/2018/07/knowledge-in-3d-how-3d-datavisualization-is-
reshaping-our-world/ accessed 31.3.2019
Tarolli, P., & Sofia, G. (2016). Human topographic signatures and derived geomorphic
processes across landscapes. Geomorphology, 255, 140–161.
Virtanen, J.P., Hyyppä, H., Kurkela, M., Vaaja, M.T., Puustinen, T., Jaalama, K., ... &
Zhu, L. (2018). Browser based 3D for the built environment. Nordic Journal of
Surveying and Real Estate Research, 13(1), 54–76.
Wang, W., Wu, X., Chen, G., & Chen, Z. (2018). Holo3DGIS: Leveraging Microsoft
HoloLens in 3D Geographic Information. ISPRS International Journal of
GeoInformation, 7(2), 60.

Järvinen, M, Jylhä, M. & Muukkonen, P. (2019). GIS-opetusmateriaalien kehittäminen tiedekasvatuksen käyttöön. In Kujala, S. & Muukkonen, P. (Eds.): GIS applications in teaching and research, pp. 31−40. Department of Geosciences and Geography C17. Helsinki: University of Helsinki.
Department of Geosciences and Geography C17 31
Chapter III
GIS-opetusmateriaalien kehittäminen tiedekasvatuksen käyttöön
Järvinen, M. 1, Jylhä, M. 2 & Muukkonen, P. 3 1 [email protected], University of Helsinki 2 [email protected], University of Helsinki 3 [email protected], University of Helsinki
Tiivistelmä
Uudessa opetussuunnitelmassa geomedia, eli maantieteellisen tiedon erilaiset hankinta- ja esitystavat, kasvatti osuuttaan sekä peruskoulun että lukiotason maantieteen opetuksessa. Erityisesti lukion opetussuunnitelmassa tuodaan esille geomedia-käsitteen mukainen paikkatieto-opetus sekä paikkatietomenetelmien soveltaminen maantieteellisessä tutkimuksessa. Helsingin yliopiston Tiedekasvatuskeskuksen alaisuudessa toimiva maantieteen Geopiste tuottaa avoimesti saatavilla olevia maantieteen opetusmateriaaleja ja järjestää esittelyjä ja oppitunteja vieraileville koululaisryhmille. Geopisteen materiaalipankkiin luotiin keväällä 2019 yhteensä kahdeksan uutta paikkatietoaiheista tehtäväpakettia. Materiaalit luotiin tukemaan opetussuunnitelman mukaista opetusta, ja niitä voidaan käyttää joko vierailuilla Geopisteessä tai opettajat voivat käyttää niitä luokkaopetuksessa. Tarjoamalla laadukkaita materiaaleja ja opetusta voidaan tarjota ratkaisua koulujen paikkatieto-opetukseen liittyviin ongelmiin, jotka johtuvat usein materiaalien, teknisten resurssien tai asiantuntevan ohjauksen puutteeseen.
Avainsanat: avoimet oppimateriaalit; GIS; GIS-opetus; paikkatieto; tiedekasvatus
Abstract
The current curriculum of the Finnish senior high school requires skills to use various sources of geomedia. In the Finnish school system, geomedia means all sources of geographical data. Typically this is understood as geoinformatics, GID, and maps, but it includes also photos, news, text sources, diagrams, statistics, videos etc. This is recognised also by the geography science education and learning centre “Geopiste” at the University of Helsinki. In this article, we are showing and reasoning several open-access GIS exercises that geography teachers can use in their own teaching or those can be used when school groups are visiting in the Geopiste learning centre. Here are totally eight new GIS exercises, which were produced according to the newest Finnish curriculum for the level of upper high school. There is an urgent need for this kind of open access exercises due to technical challenges.
Keywords: geoinformatics; GIS; open-access learning material; science education

Järvinen, M, Jylhä, M. & Muukkonen, P. (2019). GIS-opetusmateriaalien kehittäminen tiedekasvatuksen käyttöön. In Kujala, S. & Muukkonen, P. (Eds.): GIS applications in teaching and research, pp. 31−40. Department of Geosciences and Geography C17. Helsinki: University of Helsinki.
Department of Geosciences and Geography C17 32
1. Johdanto
Paikkatietojärjestelmien ja paikkatiedon (GIS, geographic information system) avulla
voidaan säilyttää ja käsitellä tiettyyn kohteeseen sidottua spatiaalista dataa eli
paikkatietoa (Burrough et al. 2015). Yli 40 vuotta kestäneen kehityksen tuloksena
paikkatietojärjestelmiä hyödynnetään maailmanlaajuisesti kaikilla julkisilla ja yksityisillä
sektoreilla, ja 1990-luvulta lähtien sitä on hyödynnetty myös kouluopetuksessa (Kerski
et al. 2013; Burrough et al. 2015). Suomessa paikkatietoa on hyödynnetty perus- ja lukio-
opetuksessa 1990-luvun lopulta lähtien; aluksi pioneereina toimineiden opettajien
ansiosta, mutta nykyään jo selkeänä osana lukion opetussuunnitelmaa (Johansson 2011;
Opetushallitus 2015).
GIS-ohjelmistoja ja -tekniikoita hyödyntävien harjoitusten ja projektien on
havaittu olevan toimiva pohja monialaiselle ja ongelmanratkaisupohjaiselle opetukselle
peruskoulu- ja lukio-opetuksessa (Rød et al. 2010; Demirci et al. 2013; Kerski et al.
2013). GIS-pohjaisen työskentely auttaa kehittämään spatiaalista ajattelutapaa ja
ymmärrystä nostamalla esiin kysymyksiä ilmiöiden sijoittumisesta ja sijoittumisen syystä
(Fitzpatrick 2001; Oldakowski 2001). GIS-harjoitusten avulla voidaan yhdistää
oppiaineiden sisältöä monialaisiksi kokonaisuuksiksi, ja tarkastella todellisen maailman
ilmiöitä oppilaskeskeisen opetuksen avulla (Kerski et al. 2013).
Suomen uusimmassa opetussuunnitelmassa sekä peruskoulun että lukion
maantieteen opetukseen on vahvasti integroitu tuore käsite geomedia, jolla viitataan
erilaisiin maantieteellisiin tiedon hankinta- ja esitystapoihin, kuten karttoihin, tilastoihin,
videoihin, uutisiin ja kuviin, ja niiden käyttöön (Opetushallitus 2015). Paikkatieto
mainitaan terminä ainoastaan lukion opetussuunnitelmassa, mutta myös peruskoulun
opetussuunnitelmaan kuuluvat geomedia-teeman alla karttojen tulkinta- ja laadintataidot.
Opetussuunnitelmissa tuodaan esille, että geomedia tulee opetuksessa yhdistää
maantieteellisen tiedon käsittelyyn, analyysiin ja visualisointiin, eikä paikkatieto-opetus
ole vain GIS:stä oppimista, vaan sen avulla oppimista. Onkin havaittu, että
paikkatietomenetelmien ja -projektien käyttö opetuksessa tukee ymmärrystä
maantieteellisestä ongelmanratkaisusta, kun taas opettajakeskeinen, paikkatiedosta
luennoiva opetus keskittyy lähinnä GIS:n tekniseen puoleen – ja tästä syystä monissa
tutkimuksissa on päädytty yhtenevään tulokseen siitä, että paikkatieto-opetus kannattaa

Järvinen, M, Jylhä, M. & Muukkonen, P. (2019). GIS-opetusmateriaalien kehittäminen tiedekasvatuksen käyttöön. In Kujala, S. & Muukkonen, P. (Eds.): GIS applications in teaching and research, pp. 31−40. Department of Geosciences and Geography C17. Helsinki: University of Helsinki.
Department of Geosciences and Geography C17 33
toteuttaa kouluissa oppilaskeskeisellä tavalla, GIS:n avulla oppien (Baker 2005; Rød et
al. 2010).
Peruskoulu- ja lukioasteen paikkatieto-opetuksen järjestämisen ongelmakohdiksi
osoittautuvat usein samat tekijät, joista eniten nousee esille opettajien puutteelliset GIS-
taidot. Peruskoulu- ja lukioasteen paikkatieto-opetuksen organisointiin liittyvät ongelmat
linkittyvät usein juuri opettajien puutteelliseen paikkatietoalan harjautuneisuuteen, mutta
myös käytettävissä olevan ajan vähäisyyteen sekä opetusresursseihin (Bernardz 2004;
Rød et al. 2010; Milson & Kerski 2012). Tämä voi rajoittaa mahdollisuuksia
monipuolisen opetuksen järjestämiseen, koska se luo ongelmia opetusaineistojen
kehittämisessä ja tarpeeksi asiantuntevan ohjauksen antamisessa. Yhteistyö yliopistojen
kanssa onkin yksi mahdollinen ratkaisu ongelmaan, niin Suomessa kuin muuallakin
maailmassa. Yliopistojen asiantuntijoiden tarjoamat materiaalit, koulutukset ja
oppituntien ohjaus mahdollistavat syvällisemmän GIS-opetuksen, vaikka koulun omat
resurssit eivät riittäisikään syvällisemmän paikkatieto-opetuksen järjestämiseen (Kerski
2003; Bernarz 2004; Rød et al. 2010).
Helsingin yliopiston Tiedekasvatuskeskuksen alainen, Kumpulan kampuksella
toimiva Geopiste on maantieteen alan oppimiskeskus, joka tarjoaa opettajien käyttöön
maantieteen opetusmateriaaleja ja järjestää kampuksella vieraileville ryhmille
paikkatietoaiheisia oppitunteja. Oppitunneilla vierailevat ryhmät saavat käyttöönsä
yliopiston tietokoneet ja kaikki tarpeelliset ohjelmistot, ja harjoitusten ohjaajina toimivat
yliopiston opettajat ja opiskelijat, joten oppilasryhmien omien opettajien paikkatieto-
osaamisen tasolla ei ole oppituntien onnistumisen kannalta väliä.
Maantieteen maisteriohjelman kurssilla GEOG-G303 GIS Project Work
kehitettiin kevään 2019 aikana uusia paikkatietoharjoituksia Geopisteen
materiaalipankkiin. Tämä artikkeli käsittelee näiden uusia harjoituksien luomista sekä
niitä opetuksellisia ja oppimisen perusteita ja tietämystä, joita alan tutkijat ovat
tutkimuksissaan havainneet. Lisäksi artikkelissa esitetään nyt luotujen uusien
harjoitustehtävien yhteyttä uusimpiin peruskoulun ja lukion maantieteen
opetusohjelmiin.

Järvinen, M, Jylhä, M. & Muukkonen, P. (2019). GIS-opetusmateriaalien kehittäminen tiedekasvatuksen käyttöön. In Kujala, S. & Muukkonen, P. (Eds.): GIS applications in teaching and research, pp. 31−40. Department of Geosciences and Geography C17. Helsinki: University of Helsinki.
Department of Geosciences and Geography C17 34
2. Paikkatietoharjoitukset
2.1 Tausta
Uusia GIS-harjoituksia kehitettiin kurssin aikana yhteensä kahdeksan kappaletta.
Kuhunkin harjoituspakettiin kuuluu pdf-muotoinen harjoitusohje sekä kaikki
harjoituksessa tarvittavat aineistot GIS-aineistojen käsittelyyn tarvittavia ohjelmia
lukuun ottamatta. Harjoituspaketit kehitettiin Geopisteen nettisivuilla avoimesti
jaettaviksi, ja niitä suunniteltaessa noudatettiin seuraavia ohjesääntöjä:
(1) Yhteys opetussuunnitelmaan:
GIS-ohjelmia käyttävät harjoitukset linkittyvät luonnollisesti
opetussuunnitelmien geomedia- ja paikkatieto-osuuksiin. Jokaisella harjoituksella
on myös oma teemansa, maantieteen osa-alue, joka voi tukea harjoituksen tekevän
opiskelijan maantieteellisen ymmärryksen jäsentymistä aiheesta.
(2) Selkeys:
Monet Geopiste-vierailijat ovat kokemattomia paikkatieto-ohjelmien
käyttämisessä. Jokainen harjoitus alkaa perusasioista ja soveltuu kaiken tasoisille
oppijoille. Vaikka erityisesti QGIS-paikkatieto-ohjelmalla suoritettavat
harjoitukset on kehitetty Geopiste-vierailuja varten, niiden ohjeista on pyritty
tekemään mahdollisimman selkeät, jotta niitä voitaisiin käyttää myös tavallisessa
luokkaopetuksessa kouluissa.
(3) Avoimuus:
Kaikki harjoituksissa käytetyt tietoaineistot ovat avoimia, ja aineistojen
alkuperäiset lataussivustot on linkitetty harjoitusohjeisiin. Varsinaisilla GIS-
ohjelmilla suoritettavat harjoitukset on kehitetty QGIS-paikkatieto-ohjelmalle,
joka on ilmainen avoimen lähdekoodin paikkatieto-ohjelma ja kaikkien vapaasti
ladattavissa. Selaimella tehtävät harjoitukset suoritetaan Paikkatietoikkuna-
palvelussa, joka on Maanmittauslaitoksen vapaasti käytettävissä oleva internetin
karttapalvelu.

Järvinen, M, Jylhä, M. & Muukkonen, P. (2019). GIS-opetusmateriaalien kehittäminen tiedekasvatuksen käyttöön. In Kujala, S. & Muukkonen, P. (Eds.): GIS applications in teaching and research, pp. 31−40. Department of Geosciences and Geography C17. Helsinki: University of Helsinki.
Department of Geosciences and Geography C17 35
2.2 Harjoitusten aineistot
Harjoituksia varten on koottu aineistoa monesta eri lähteestä, ja jokainen harjoitusohje
sisältää linkit aineistojen lataussivustoihin. Kaikki harjoituksissa käytettävä data on
avointa, mikä mahdollistaa alkuperäisten aineistojen helpon hankinnan ja tarkastelun.
Tämä voi myös auttaa opiskelijoita ymmärtämään avoimen datan potentiaalin ja sen, ettei
paikkatiedon käsittelyyn missään tapauksessa tarvitse aina käyttää kalliita ohjelmia ja
maksullisia aineistoja. Käytettävät aineistot on hankittu monista eri lähteistä, ja tuottajia
ovat muun muassa Tilastokeskus ja Maanmittauslaitos, mutta monissa tapauksissa myös
jokin vapaaehtoisjärjestö tai muu epävirallisempi taho. Epävirallisten tahojen tuottamat
aineistot saattavat olla joskus puutteellisia tai epätarkkoja, eivätkä niistä saadut tulokset
ole vertailukelpoisia. Esimerkiksi uudessa harjoituksessa Konflikteja Afrikassa käytetty
pisteaineisto sisältää duplikaatteja, ja aineiston luokittelu on tehty paikoittain
epäjohdonmukaisesti. Kehitettyjen harjoitusten idea on kuitenkin toimia
opetusmateriaaleina eikä korkealaatuisen tutkimuksen pohjana, joten tarkoilla
lopputuloksilla ei ole tässä tapauksessa merkitystä. Jokainen aineisto on käyty läpi ja
arvioitu, ja sen takia ne soveltuvat epätarkkuuksista huolimatta erinomaisesti eri
ilmiöiden havainnollistamiseen.

Järvinen, M, Jylhä, M. & Muukkonen, P. (2019). GIS-opetusmateriaalien kehittäminen tiedekasvatuksen käyttöön. In Kujala, S. & Muukkonen, P. (Eds.): GIS applications in teaching and research, pp. 31−40. Department of Geosciences and Geography C17. Helsinki: University of Helsinki.
Department of Geosciences and Geography C17 36
Kuva 1. Sivuja harjoituksen Joukkoliikenteen nousijat pääkaupunkiseudulla ohjeista. Ohjeet sisältävät työntekoa helpottavia selitteitä ja ohjeita muokkausten tekoon, sekä pohdiskelua helpottavia kysymyksiä.
2.3 Harjoitusten sisältö ja rakenne
Jokainen uusi harjoitus on suunniteltu toimimaan mahdollisena ensikosketuksena
paikkatietoon, muttei toimia teoriaoppituntina. Harjoitusohjeessa aloitetaan
käytännöllisistä perusasioista, ja siirrytään sen jälkeen käyttämään paikkatieto-ohjelmien
toimintoja selkeiden ja visuaalisten ohjeiden avulla (Kuva 1). Visuaalisten ohjeiden on
havaittu toimivan hyvin GIS-harjoituksissa, sillä niiden avulla tutkittavan ongelman voi

Järvinen, M, Jylhä, M. & Muukkonen, P. (2019). GIS-opetusmateriaalien kehittäminen tiedekasvatuksen käyttöön. In Kujala, S. & Muukkonen, P. (Eds.): GIS applications in teaching and research, pp. 31−40. Department of Geosciences and Geography C17. Helsinki: University of Helsinki.
Department of Geosciences and Geography C17 37
ymmärtää helposti, ja tekniset ohjeet ovat helpommin lähestyttäviä (Hall-Wallace &
McAuliffe 2002). GIS:n tekniseen puoleen saadaan harjoituksissa pintaraapaisu, mutta
tämä osa-alue toimii lähinnä aiemman tai tulevan teoriaopetuksen tukena, ja harjoitusten
varsinainen tehtävä on tutustuttaa opiskelijoita paikkatieto-ohjelmien käyttöön aitojen
tutkimusaiheiden tarkastelussa.
Harjoitukset on suunniteltu suoritettaviksi yhden oppitunnin aikana, ja niiden
suorittamisen kesto vaihtelee 45 ja 90 minuutin välillä. Suoritusaikaan vaikuttavat myös
muun muassa opetusryhmän koko ja luokka-aste. Uusista harjoituksista kuusi on
suunniteltu QGIS-paikkatieto-ohjelmalle ja kaksi internetselaimessa toimivaan
Maanmittaus-laitoksen Paikkatietoikkunaan.
2.4 Harjoitukset suhteessa opetussuunnitelmaan
Lukion opetussuunnitelmassa paikkatieto on yksi kokonaisuuksista, ja siihen
paneudutaan neljännessä maantieteen kurssissa, jonka aihe on geomedia (Opetushallitus
2015). Peruskoulun opetussuunnitelmassa sanaa paikkatieto ei mainita, mutta kartanlu-
ku-, kartantuottamis- ja geomediataidot kuuluvat myös yläkoulun opetukseen
(Opetushallitus 2014).
Kehitetyt GIS-harjoitukset luonnollisesti tukevat opetusta ja oppilaiden
ymmärrystä paikkatiedosta. Paikkatiedon lisäksi jokainen uusi harjoitus on suunniteltu
tukemaan muutakin maantieteen opetusta – uusia harjoituksia tehtiin muun muassa
riskeihin, luonnonmaantieteeseen ja ihmismaantieteeseen liittyen. Aineistoja käsitellään
harjoituksissa siihen muotoon, että niiden pohjalta voi tehdä johtopäätöksiä.
Harjoituksissa päästään yhdessä harjoituksessa muun muassa visualisoimaan
biodiversiteetin Hot Spot -alueita ja toisessa harjoituksessa tekemään reittilaskelmia
oppilaalle tutuilla alueilla. Harjoitukset ja niiden yhteys opetussuunnitelmaan esitellään
tarkemmin taulukossa 1. Koska lukion opetussuunnitelmassa aiheet käsitellään ja
eritellään yksityiskohtaisemmin, harjoitusten aiheet on merkitty Taulukkoon 1 vähintään
kurssin tarkkuudella. Peruskoulun opetussuunnitelma ei syvenny maantieteellisiin
aiheisiin samalla tavalla kuin lukion opetussuunnitelma, vaan se auttaa oppilaita luomaan
maailmankuvaansa, ja samoja teemoja käsitellään useiden usealla kurssilla. Tästä syystä
peruskoulun opetuksen ja uusien Geopiste-harjoitusten välinen yhteys määritellään vain
yleisemmällä tasolla.

Järvinen, M, Jylhä, M. & Muukkonen, P. (2019). GIS-opetusmateriaalien kehittäminen tiedekasvatuksen käyttöön. In Kujala, S. & Muukkonen, P. (Eds.): GIS applications in teaching and research, pp. 31−40. Department of Geosciences and Geography C17. Helsinki: University of Helsinki.
Department of Geosciences and Geography C17 38
Taulukko 1. Uusien GIS-harjoitusten teemat ja niiden yhteys opetussuunnitelmiin (L = lukion opetussuunnitelma, Y = peruskoulun yläluokkien 7–9 opetussuunnitelma).
3. Keskustelu
Tämän projektin aikana luotiin Geopisteelle uusia harjoituksia vanhojen, osittain
materiaaleiltaan vanhentuneiden harjoitusten tilalle ja rinnalle. Kaikki uudet
harjoitusohjeet noudattavat samaa muotoilua ja etenemisrakennetta. Koska kaikki
harjoitukset ovat uusia, niitä kaikkia ei ole ehditty vielä testaamaan vierailevien
koululaisten kanssa. Harjoitus Joukkoliikenteen nousijamäärät pääkaupunkiseudulla on
jo kokeiltu keväällä 2019 kahden luokan kanssa. Harjoitus sai hyvää palautetta, ja sen
ohjeisiin tehtiin pieniä korjauksia tulevan opetuksen avuksi. Kun harjoituksia aloitetaan
käyttää enemmän, niiden sisältöä ja ohjeita voidaan muokata entisestään ohjaajilta ja
oppilailta kerätyn palautteen perusteella. Yleisimpiä ongelmakohtia GIS-opetuksessa on
useimmiten varsinkin ohjauksessa (joka tässä tapauksessa linkittyy voimakkaasti
ohjeiden selkeyteen) ja aineistojen ja ohjelmien käsittelyssä (Demirci et al. 2013; Kerski
2003).

Järvinen, M, Jylhä, M. & Muukkonen, P. (2019). GIS-opetusmateriaalien kehittäminen tiedekasvatuksen käyttöön. In Kujala, S. & Muukkonen, P. (Eds.): GIS applications in teaching and research, pp. 31−40. Department of Geosciences and Geography C17. Helsinki: University of Helsinki.
Department of Geosciences and Geography C17 39
Yksi tärkeä tekijä, joka tuli ottaa huomioon uusia harjoituksia luodessa oli niiden
yhteys opetussuunnitelmaan. Koska resurssien puutteellisuuden tai muiden tekijöiden
takia kaikissa oppilaitoksissa ei ole realistisia mahdollisuuksia järjestää käytännön
paikkatieto-opetusta, nyt luodut uudet harjoitukset haluttiin liittää opetussuunnitelmien
teemoihin mahdollisimman toimivasti. Tämä edesauttaa mahdollisuuksia
paikkatietoaiheiden syvempään ymmärtämiseen, kun luodaan yhteyksiä ja näkökulmia
tuttuihin aiheisiin liittyvien ongelmien ratkaisemiseen, ja tällöin GIS-opetus voi tuntua
asiaan perehtymättömällekin luontevalta eikä suinkaan aiemmin opittuun verrattuna
erilliseltä (Rød et al. 2010). Tämäkin on aihe, josta voisi olla aiheellista kerätä palautetta
ja mielipiteitä oppilailta, koska oppimateriaaleja kehittämällä voidaan näin pyrkiä
luomaan mahdollisimman hyvin oppimista tukeva kokonaisuus. Tarjoamalla
akateemisten maantieteen asiantuntijoiden ohjaamaa ja hyvin muuhun opetukseen
linkitettyä opetusta voidaan erityisesti tukea niitä opettajia, joiden tekninen osaaminen
paikkatiedossa rajoittaa aiheen laadukasta opetusta (Bernarz 2004; Kerski 2003; Rød et
al. 2010).
Tämän projektin myötä Geopisteen GIS-harjoitusten materiaalipankki
moninkertaistui. Tulevaisuudessa nyt luotuja materiaaleja voidaan kehittää entisestään,
ja uusia harjoituksia voidaan luoda lisää, esimerkiksi muidenkin maantieteen
yliopistokurssien lopputyönä. Luomalla aineistoja ja tarjoamalla opetusta ja koulutusta
voidaan syventää yliopistojen ja muiden oppilaitosten välistä yhteistyötä, mikä
mahdollistaa useammassa oppilaitoksessa laadukkaan ja heidän omista resursseistaan
riippumattoman GIS-opetuksen.
Lähteet
Artvinli, E. (2010). The contribution of geographic information systems (GIS) to geography education and secondary school students' attitudes related to GIS. Kuram Ve Uygulamada Egitim Bilimleri 10(3), 1277–1292.
Baker, T. R. (2005). Internet-based GIS mapping in support of K-12 education. Professional Geographer 57(1), 44–50.
Bednarz, S. W. (2004). Geographic information systems: A tool to support geography and environmental education? GeoJournal 60(2), 191–199.
Burrough, P. A., McDonnell, R., McDonnell, R. A., & Lloyd, C. D. (2015). Principles
of geographical information systems. Oxford university press.
Demirci, A., Karaburun, A., & Ünlü, M. (2013). Implementation and effectiveness of

Järvinen, M, Jylhä, M. & Muukkonen, P. (2019). GIS-opetusmateriaalien kehittäminen tiedekasvatuksen käyttöön. In Kujala, S. & Muukkonen, P. (Eds.): GIS applications in teaching and research, pp. 31−40. Department of Geosciences and Geography C17. Helsinki: University of Helsinki.
Department of Geosciences and Geography C17 40
GIS-based projects in secondary schools. Journal of Geography 112(5), 214 http://www.doi.org/10.1080/00221341.2013.770545
Fitzpatrick, C. (2001). A trainer's view of GIS in schools. International Research in
Geographical and Environmental Education 10(1), 85–87.
Hall-Wallace, M. K., & McAuliffe, C. M. (2002). Design, implementation, and evaluation of GIS-based learning materials in an introductory geoscience course. Journal of Geoscience Education 50(1), 5–14.
Johansson, T. (2011). Finland: Diffusion of GIS in schools from local innovations to the implementation of a national curriculum. In Milson, A.J., Demirci, A. & Kerski, J.J. (Eds.) International perspectives on teaching and learning with GIS in
secondary schools, 89–96. Springer.
Kerski, J. J. (2003). The implementation and effectiveness of geographic information systems technology and methods in secondary education. Journal of Geography 102(3), 128–137. http://www.doi.org/10.1080/00221340308978534
Kerski, J. J., Demirci, A., & Milson, A. J. (2013). The global landscape of GIS in secondary education. Journal of Geography 112(6), 232–247. http://www.doi.org/10.1080/00221341.2013.801506
Marsh, M., Golledge, R., & Battersby, S. E. (2007). Geospatial concept understanding and recognition in G6-college students: A preliminary argument for minimal GIS. Annals of the Association of American Geographers 97(4), 696–712. http://www.doi.org/10.1111/j.1467-8306.2007.00578.x
Oldakowski, R. K. (2001). Activities to develop a spatial perspective among students in introductory geography courses. Journal of Geography 100(6), 243 http://www.doi.org/10.1080/00221340108978451
Rød, J., Larsen, W., & Nilsen, E. (2010). Learning geography with GIS: Integrating GIS into upper secondary school geography curricula. Norwegian Journal of
Geography 64(1), 21–35. http://www.doi.org/10.1080/00291950903561250
Stonier, F., & Hong, J. E. (2016). Bridging GIS success. The Geography Teacher 13(2), 52–60. http://www.doi.org/10.1080/19338341.2015.1102157

Ruikkala, T., Aalto, I., Peltoniemi, M. & Salmivaara, A., Tuominen, S. & Muukkonen, P. (2019). Applying open GIS data to study wetland forests and ditches in Finland. In Kujala, S. & Muukkonen, P. (Eds.): GIS applications in teaching and research, pp. 41−52. Department of Geosciences and
Geography C17. Helsinki: University of Helsinki.
Department of Geosciences and Geography C17 41
Chapter IV
Applying open GIS data to study wetland forests and ditches in Finland
Ruikkala, T. 1, Aalto, I. 2, Peltoniemi, M. 3 & Salmivaara, A. 4, Tuominen, S. 5 & Muukkonen, P. 6
1 [email protected], University of Helsinki 2 [email protected], University of Helsinki 3 [email protected], Natural Resources Institute Finland (Luke) 4 [email protected], Natural Resources Institute Finland (Luke) 5 [email protected], Natural Resources Institute Finland (Luke) 6 [email protected], University of Helsinki
Abstract
Open GIS data enables calculations and analysation of ditch related variables in drained forest areas. Gathering and combining all this information can be a laborious but it helps and improves modelling related to ditching and carbon fluxes. Finnish Natural Resource Institute’s SOMPA-project tries to find more ecologically sustainable methods for forestry and a major part of carbon fluxes are contributed by peatlands, ditched or not. This study demonstrates and highlights that it is possible to calculate ditch densities and gather ditch-related data from the national open GIS data. This study also provides a work-flow on how to calculate these variables.
Keywords: ditch; ditch density; forestry; geoinformatics; GIS; natural resources; MS-
NFI
1. Introduction
More than half of Finnish peatlands have been drained for forestry use since the 1960s
(Laiho et al, 2016). Today the total wetland area in Finland is 8.7 million hectares of
which around 4.6 million hectares are drained for forestry and agricultural use
(Korhonen et al., 2017). Of the total forest area in Finland, drained wetland forests
make up one third. In addition, it has been showed that all ditches do not necessarily
support flow (Hasselquist et al., 2018). This means that ditch networks do not work with
full effort. Yet, the former mires have become well-producing and fertile grounds for
both forestry and agricultural use. Still, the impacts on climate are not as convenient.

Ruikkala, T., Aalto, I., Peltoniemi, M. & Salmivaara, A., Tuominen, S. & Muukkonen, P. (2019). Applying open GIS data to study wetland forests and ditches in Finland. In Kujala, S. & Muukkonen, P. (Eds.): GIS applications in teaching and research, pp. 41−52. Department of Geosciences and
Geography C17. Helsinki: University of Helsinki.
Department of Geosciences and Geography C17 42
The lowering groundwater level creates aerobic conditions in the soil surface layer
which causes the aerobic decomposition of plant material. This, in turn, increases
carbon dioxide emissions. The carbon balance of drained wetlands is negative, however,
forests growing on these sites compensate the emissions by sequestering carbon.
(Ministry of Agriculture and Forestry of Finland, 2007; Vanhatalo et al., 2015; Penttilä
et al., 2018) The Natural Resources Institute Finland (Luke) is carrying out a six-year
project (SOMPA, 2018–2023) with an aim to develop methods for improving
management strategies for drained peatlands to mitigate climate change.
To survey national forest resources and forest land in Finland the first National
Forest Inventory (NFI) was carried out in Finland with the aim to systematically
monitor forest resources regionally and in the whole country since 1921. Ever since the
inventories have been carried out with 5–10-year rotations. The national forest
inventory produces information about volume and growth of growing stock,
silvicultural quality of forests, land use and ownership, forest health, biodiversity, and
carbon reserves. The results are based on versatile field measurements on field plots.
(Mäkisara et al., 2019). The Multi-Source National Forest Inventory (MS-NFI)
combines the measurements of NFI sample plots to additional information (Tomppo et
al. 2008). This additional information is topographical maps and remote sensing data
such as satellite images. With these data, the inventory can be interpolated for smaller
areas than what was possible with only field-based measurements. The first MS-NFI
results were published in 1990, and in 1994 there were results covering the whole
country. The latest published MS-NFI is from 2017 (see https://www.luke.fi/tietoa-
luonnonvaroista/metsa/metsavarat-ja-metsasuunnittelu/metsavarakartat-ja-
kuntatilastot/).
In this project, our aim was to derive new variables from open GIS sources to be
used with the newest MS-NFI data by Luke. These new variables can be used in
modelling and research purposes for wetland forests in Finland.

Ruikkala, T., Aalto, I., Peltoniemi, M. & Salmivaara, A., Tuominen, S. & Muukkonen, P. (2019). Applying open GIS data to study wetland forests and ditches in Finland. In Kujala, S. & Muukkonen, P. (Eds.): GIS applications in teaching and research, pp. 41−52. Department of Geosciences and
Geography C17. Helsinki: University of Helsinki.
Department of Geosciences and Geography C17 43
Figure 1. The study area is in Ostrobothnia, where drained wetlands are a common landscape.
2. Data
2.1 Study area and data sources
The study area covers a 12.0 km ×12.0 km rectangle corresponding to map sheet
P4212R located near the municipality of Lappajärvi in Ostrobothnia (Figure 1). The
selection of the study area was based on a high proportion of drained forest in the area.
In addition, we limited our calculations to the smaller study area due the need for
processing speed and power to carry all our calculations. That is why selected this small
test area for our calculations.

Ruikkala, T., Aalto, I., Peltoniemi, M. & Salmivaara, A., Tuominen, S. & Muukkonen, P. (2019). Applying open GIS data to study wetland forests and ditches in Finland. In Kujala, S. & Muukkonen, P. (Eds.): GIS applications in teaching and research, pp. 41−52. Department of Geosciences and
Geography C17. Helsinki: University of Helsinki.
Department of Geosciences and Geography C17 44
The basis for the study is the Multi-Source National Forest Inventory (MS-NFI)
data provided by the Natural Resources Institute, Finland (Luke). The open MS-NFI
data consist of thematic forest maps in the form of raster layers. On the basis of the
raster format MS-NFI maps, automatic delineation of forest stands has been carried out
by automatic image segmentation. In addition to MS-NFI map data, peatland drainage
maps and forest estate borders have been used in the delineation of the segments. These
forest segments are based on the inventory and real estate borders, but because it is
based on raster format the data does not fully follow real vector format borders of real
estate objects but depends about the spatial resolution of the raster data. In the whole of
Finland, there are a total of approximately 20 million identified forest segments and
each segment is identified with an individual ID. In the inventory, the country is divided
into five parts: eastern, western and southern Finland, Lapland, and Åland Islands.
The variables combined and developed were ditch density, ditch length, surface
soil type, peat depth, drainage state, fertility class, and topographic wetness index
(TWI). More info about the variables can be found later in the chapter. The main
priority was to calculate the new ditch related variables. Luke is also calculating Depth-
to-Water (DTW), but this was not available for the whole of Finland at the time of the
study.
We also added some other variables from Open data that we thought could be of
usage. All the variables that were joined to the attribute table of MS-NFI forest
segments are presented in table 2. All the data were vector files except the MS-NFI files
which were in raster format. From the Topographical database, we only needed the
vector layer that contained ditches. From the forest resource data by the Finnish Forest
Centre (Metsäkeskus, metsään.fi), we downloaded four smaller UTM10 map sheets that
together covered the map sheet P4212R. TWI could not be downloaded for separate
areas, therefore we downloaded it for the whole of Finland and clipped it for the area of
interest.
During this study, an updated 2019 version of the Topographical database was
published. We decided to continue using the one we already had downloaded from the
year 2016 since there appeared to be no major changes at least in our study area. When
applying the methods developed in this study for the whole of Finland, we suggest that

Ruikkala, T., Aalto, I., Peltoniemi, M. & Salmivaara, A., Tuominen, S. & Muukkonen, P. (2019). Applying open GIS data to study wetland forests and ditches in Finland. In Kujala, S. & Muukkonen, P. (Eds.): GIS applications in teaching and research, pp. 41−52. Department of Geosciences and
Geography C17. Helsinki: University of Helsinki.
Department of Geosciences and Geography C17 45
the latest 2019 version of the Topographical database should be used. After the data was
gathered, a transformation of segmented MS-NFI data to vector polygon format was
needed. The conversion was made in order to be able to join new data and modify the
existing data in the raster layer. Tree volume and height was from the previous MS-NFI
that was available for download.
Table 2. The GIS data used in this study (for more information, see attachment 1).
Variable / data Source Producer Year of production
Date of download
Ditches as polylines
Estate borders
Topographical database
National Land Survey of Finland
2016 7.3.2019
Soil type
Peat depth
Hakku.fi Geological Survey of Finland
2002–2009
25.3.2019
Fertility class
Drainage state
Tree species
Ditching year
Metsään.fi Finnish Forest Centre
2018 27.3.2019
Topographic
Wetness Index
Paituli.fi Natural Resources Institute Finland
2016 4.4.2019
Tree height
Tree volume
Natural Resources Institute Finland
Natural Resources Institute Finland
2015 5.4.2019
Topographic
Wetness Index (TWI)
Natural Resources Institute Finland
Laura Salmivaara, Pers. comm.
2.2 Description of variables and their relevance in the study
The soil type -variable shows us the mode soil type per polygon. Soil type affects the
soil’s ability to retain water which in turn has an impact on forest growth. Drainage of
wetlands aims to optimize the soil’s water availability for trees. Mineral soils in general

Ruikkala, T., Aalto, I., Peltoniemi, M. & Salmivaara, A., Tuominen, S. & Muukkonen, P. (2019). Applying open GIS data to study wetland forests and ditches in Finland. In Kujala, S. & Muukkonen, P. (Eds.): GIS applications in teaching and research, pp. 41−52. Department of Geosciences and
Geography C17. Helsinki: University of Helsinki.
Department of Geosciences and Geography C17 46
have lower water retention capacity compared to organic soils. Organic soils, such as
peat and mould, are dominant soil types in drained wetlands. In our study area, the most
dominant soil type was peat of different thickness. Peat depth and drainage affect also
the release or sequestration of carbon.
Peat depth indicates the thickness of the peat layer on a polygon. The thicker the
peat layer is, the more carbon is captured in the soil. Peat is a soil type that is formed in
wetlands under anaerobic conditions. Drainage decreases peat depth layer and allows
quick aerobic decomposition of the peat. In this process, carbon dioxide is released to
the atmosphere. Thick peat layers in natural wetlands release methane, but this is a
slower process than the sequestration of carbon through decomposition. In drained
wetlands, the goal is to protect thick peat soils. (Penttilä et al., 2018).
Tree species -variable shows the most common tree species on a polygon. This
is specified by determining if the forest is deciduous or coniferous and then defining the
most dominant species in terms of tree volume (Hökkä et al., 2002). Different tree
species have different requirements of water and nutrients and the availability of these
depend mostly on the habitat and soil type. Optimal growing circumstances enable
maximum growth of a tree, which correlates with economic profitability (Vanhatalo et
al., 2015). Fertility class describes the forest habitat type. The habitat types have
different fertility levels which has a direct effect on tree growth and production (Hökkä
et al., 2002).
Drainage year -variable shows the year a specific polygon was drained. In the
1960’s, the use of machinery to drain wetlands for agricultural and forestry purposes
started. To keep the wetland forests productive, ditches need to be retrieved every 20–
40 years (Sarkkola et al., 2013; Vanhatalo et al., 2015). Forestry drainage has not in all
cases had the desired effect on tree productivity and thus not all ditches should be kept
open. This is because ditching also has an enormous effect on the ecosystem (Aapala et
al., 2013). Drainage state classifies forest segments into ditched and non-ditched, and
the former further to different drainage states that describe the vegetation and tree
growth in the area (Hökkä et al., 2002).
Topographic wetness index (TWI) is typically used to quantify the effect of
topography to hydrological phenomena (Sørensen et al. 2005). Topography affects the

Ruikkala, T., Aalto, I., Peltoniemi, M. & Salmivaara, A., Tuominen, S. & Muukkonen, P. (2019). Applying open GIS data to study wetland forests and ditches in Finland. In Kujala, S. & Muukkonen, P. (Eds.): GIS applications in teaching and research, pp. 41−52. Department of Geosciences and
Geography C17. Helsinki: University of Helsinki.
Department of Geosciences and Geography C17 47
spatial water distribution of an area, soil moisture and groundwater flow (Beven and
Kirkby, 1979).
Tree height is a growth indicator and relates to the age and productivity of a tree.
Tree volume is reported in m3/ha. It is an important factor in determining the
management practices to be done in the forest. Tree volume can be later converted to
tree biomass (Somogyi et al., 2007).
Depth to water (DTW), which was not yet available in our study area, is a
central attribute when it comes to the climate impact of drained wetlands, since the top
layer above the water table determines much of the greenhouse gas emissions from the
soil (Vanhatalo et al., 2015; Penttilä et al., 2018). Yet, this variable is important in forest
drainage studies and it should be considered when forest drainage and its effects are
under consideration. The optimum depth to water in a drained wetland forest is 30–40
cm (Aukia, 2019) which allows enough air for tree roots but does not cause massive
carbon emissions (Vanhatalo et al., 2015; Penttilä et al., 2018).
3. Methods
In this study, we derived new ditch related variables to describe amount and density of
ditches in the drained wetlands in the boreal forests in Finland. Firstly, we made the
ditch-layer from NLS’s topographic database (for calculation workflow see Figure 2).
We used only features with codes 36311 (ditches less than 2 meters wide) and 36312
(ditches 2–5 meters wide). Secondly, the newly made ditch layer was then combined
with the polygons of the MS-NFI layer with ArcGIS software's Intersect-tool. Thirdly,
each forest segment’s ditches were combined using Summary Statistics -tool into a total
ditch length for a specific polygon.

Ruikkala, T., Aalto, I., Peltoniemi, M. & Salmivaara, A., Tuominen, S. & Muukkonen, P. (2019). Applying open GIS data to study wetland forests and ditches in Finland. In Kujala, S. & Muukkonen, P. (Eds.): GIS applications in teaching and research, pp. 41−52. Department of Geosciences and
Geography C17. Helsinki: University of Helsinki.
Department of Geosciences and Geography C17 48
Figure 2. Workflow chart of GIS analyses.
Ditch density was calculated using the drainage density formula D = L/A by
Dingman (1978), where D is a ditch density, L is a total length of ditches, and A is an
area. Using drainage density formula for calculating ditch density has some limitations
but despite these limitations, it worked well when calculating ditch density in the area.
Ditch density was calculated in meters per hectare. Final classification for ditching
density was made by calculating the average distance between ditches in a hectare.
These density class values were “no ditches”, “less than 100 m/ha”, “100–199 m/ha”,
“200–299 m/ha”, and “more than 300 m/ha” (for ditch density map see Figure 3). In
calculations, this makes it so that if a polygon had totally more than 300 meters of
ditches per hectare, the distance between ditches were less than 30 meters. For the 200–
299 m/ha class, distance between ditches were 30–50 m, for 100–199 m/ha distance was
more than 50 meters. This calculation does not take the possibility of intersecting
ditches into account. Nevertheless, it still gives a good estimate of the ditching state of
the segments.

Ruikkala, T., Aalto, I., Peltoniemi, M. & Salmivaara, A., Tuominen, S. & Muukkonen, P. (2019). Applying open GIS data to study wetland forests and ditches in Finland. In Kujala, S. & Muukkonen, P. (Eds.): GIS applications in teaching and research, pp. 41−52. Department of Geosciences and
Geography C17. Helsinki: University of Helsinki.
Department of Geosciences and Geography C17 49
Figure 3. Ditch density (m/ha) describes the ditching state of forest segments.
For other forest variables, we calculated with intersect tool descriptive statistics
within each segment polygons (see Figure 4 for example of another forest variable, tree
volume). This was done with the Zonal statistics -tool. For zonal statistics, the polygon
layers had to be converted to raster format. After the conversion, Zonal statistics was
made with the Majority -setting in order to get the mode value for each forest segment
polygon. Raster layers were then converted back to polygon. We had to classify peat
depth map layer for easier interpretation, and we changed the codes to correspond depth
values. We chose the minimum values of each class to represent the different depths
(0.6 meters and 1 meter). This is a notable simplification, but we also didn’t have
precise peat depth-data at our disposal. The process for other variables was
straightforward since it did not require much extra work.

Ruikkala, T., Aalto, I., Peltoniemi, M. & Salmivaara, A., Tuominen, S. & Muukkonen, P. (2019). Applying open GIS data to study wetland forests and ditches in Finland. In Kujala, S. & Muukkonen, P. (Eds.): GIS applications in teaching and research, pp. 41−52. Department of Geosciences and
Geography C17. Helsinki: University of Helsinki.
Department of Geosciences and Geography C17 50
Figure 4. Tree volume (m3/ha) per forest segment.
4. Conclusions
The main aim of this study was to derive new variables and search and collect open GIS
data for Luke to use in modelling and research. This study demonstrates and
highlights that it is possible to calculate ditch densities and gather ditch-related
data from the national open GIS data. New variables include ditching density and
ditching density class. Our test study area was Southern Ostrobothnia and the area is
heavily ditched and modified by humans (Figure 3). In our study area the average size
of an MS-NFI polygon was 0.88 hectares and contained 108 meters of ditches. Average
ditching density in the area was 114.66 meters of ditches per hectare. The total length of
ditches in the study area was 1461 kilometres.

Ruikkala, T., Aalto, I., Peltoniemi, M. & Salmivaara, A., Tuominen, S. & Muukkonen, P. (2019). Applying open GIS data to study wetland forests and ditches in Finland. In Kujala, S. & Muukkonen, P. (Eds.): GIS applications in teaching and research, pp. 41−52. Department of Geosciences and
Geography C17. Helsinki: University of Helsinki.
Department of Geosciences and Geography C17 51
We calculated the ditch density with the drainage density formula by Dingman
(1978). The formula is meant for calculating drainage density in large basins, but we
found it suitable for ditch density as well. However, considering the small size of
majority of the forest segments, drainage density might be a slightly misleading
concept. For instance, the smallest segments were only a few square meters in area and
could have a ditch density of several hundred meters per hectare, which gives an
impression of very dense ditching in the area. This is however not necessarily the case
since in the neighbouring segments there might not be any ditches at all.
Ditching forested areas and wetlands might improve growing and soil conditions
but it also may have environmental impacts. Especially water quality and quantity might
get affected (Prevost et al., 1999). Areas with higher drainage density experiences
increased summer flows and greater pH. Ditching also stops the production of peat and
peatland flora will eventually vanish when more generic forest vegetation becomes
dominant. In future studies it would be necessary to calculate ditch density variables for
whole Finland. Then one should compare ditch variables against other forest variables
to detect possible correlations and relationships between variables.
Acknowledgements
This work has been done in the University of Helsinki’s course (GEOG-G303 GIS
Project work). In addition, this study is framed and supported by the project “Novel soil
management practices - key for sustainable bioeconomy and climate change mitigation
–SOMPA”, which was funded by the Strategic Research Council at the Academy of
Finland (decision no. 312912).
References
Aapala, K., Rehell, S., Similä, M., Haapalehto, T. 2013. Ennallistamisen tarve ja tavoitteet. In: Aapala, K., Similä, M., Penttinen, J. (Eds), Ojitettujen soiden
ennallistamisopas. Metsähallituksen luonnonsuojelujulkaisuja, Sarja B188, 301 p.
Aukia, J-P. 2019. Suo, kuokka ja ilmasto. Luonnon-, ympäristö- ja metsätieteilijöiden liitto Loimu ry. Loimu 2/2019, pp. 20–25.
Hasselquist, E.M., Lidberg, W., Sponseller, R.A., Ågren, A. & Laudon, H. 2018. Identifying and assessing the potential hydrological function of past artificial forest drainage. Ambio 47: 5, 546–556.

Ruikkala, T., Aalto, I., Peltoniemi, M. & Salmivaara, A., Tuominen, S. & Muukkonen, P. (2019). Applying open GIS data to study wetland forests and ditches in Finland. In Kujala, S. & Muukkonen, P. (Eds.): GIS applications in teaching and research, pp. 41−52. Department of Geosciences and
Geography C17. Helsinki: University of Helsinki.
Department of Geosciences and Geography C17 52
Hökkä, H., Kaunisto, S., Korhonen, K. T., Päivänen, J., Reinikainen, A., Tomppo, E. 2002. Suomen suometsät 1951–1994. Metsätieteen aikakauskirja 2A, 201–357.
Korhonen, K. T., Ihalainen, A., Ahola, A., Heikkinen, J., Henttonen, H. M., Hotanen, J-P., Nevalainen, S., Pitkänen, J., Strandström, M., Viiri, H. 2017. Suomen metsät 2009–2013 ja niiden kehitys 1921–2013. Natural resources and bioeconomy
studies 59/2017 Natural Resources Institute Finland (Luke). 86 p. Laiho, R., Tuominen, S., Kojola, S., Penttilä, T., Saarinen, M., Ihalainen, A. 2016.
Heikkotuottoiset ojitetut suometsät - missä ja paljonko niitä on? Metsätieteen
aikakauskirja 2/2016, 73–94. Ministry of Agriculture and Forestry of Finland. 2007. Turpeen ja turvemaiden käytön
kasvihuonevaikutukset Suomessa. Tutkimusohjelman loppuraportti. Maa- ja
metsätalousministeriön julkaisuja 1. Mäkisara, K., Katila, M., Peräsaari, J. 2019. The Multi-Source National Forest
Inventory of Finland – methods and results 2015. Natural resources and
bioeconomy studies 8/2019. Natural Resources Institute Finland (Luke). 57 p. Penttilä, T., Laiho, R., Mäkipää, R. 2018. Suometsien ilmastoviisas metsänhoito.
Natural Resources Institute Finland (Luke). Available at: <https://www.ilmase.fi/site/wp-content/uploads/2018/06/valmis_suometsatietokortti_nettiin.pdf> [13.11.2019]
Prevost, M., Plamondon, A. P., Belleau, P. 1999. Effects of drainage of a forested peatland. Journal of Hydrology 214:1–2, 130–143.
Sarkkola, S., Hökkä, H., Jalkanen, R., Koivusalo, H., Nieminen, M. 2013. Kunnostusojitustarpeen arviointi tarkentuu – puuston määrä tärkeä ojituskriteeri. Metsätieteen aikakauskirja 2/2013, 159–166.
Somogyi, Z., Cienciala, E., Mäkipää, R., Lehtonen, A., Muukkonen, P. & Weiss, P. 2007. Indirect methods of large-scale forest biomass estimation. European
Journal of Forest Research 126: 2, 197–207. Sørensen, R., Zinko, U., Seibert, J. 2006. On the calculation of the topographic wetness
index: evaluation of different methods based on field observations. Hydrology and
Earth System Sciences Discussions, European Geosciences Union, 2006, 10: 1, 101-112.
Tomppo, E., Haakana, M., Katila, M & Peräsaari, J. 2008. Multi-Source National Forest Inventory. Springer. https://doi.org/10.1007/978-1-4020-8713-4
Vanhatalo, K., Väisänen, P., Joensuu, S., Sved, J., Koistinen, A. & Äijälä, O. (Eds.) 2015. Metsänhoidon suositukset suometsien hoitoon, työopas. Tapion julkaisuja.

Department of Geosciences and Geography C17
ISSN-L 1798-7938
ISBN 978-951-51-4923-7 (PDF)
http://helda.helsinki.fi/
Helsinki 2019
GIS applications in teaching and research
presents the outcomes of a graduate level
course GEOG-G303 GIS project work. The
course was conducted in small working
groups, each of which was assigned a
separate project topic. The topics came
from different research groups or teachers
in the Department of Geosciences and
Geography and vary from research tasks to
building a teaching content. These articles
are written in close co-operation with
researchers and teachers.