GIS and Landscapes Lisa A. Schulte Forest Ecology and Management Topography Soils Climate Vegetation...
37
GIS and Landscapes Lisa A. Schulte Forest Ecology and Management Topography Soils Climate Vegetation Distribution y x 1 x 2 x 3 = f(c, s, t) Model Probability of
-
Upload
eustace-parks -
Category
Documents
-
view
216 -
download
0
Transcript of GIS and Landscapes Lisa A. Schulte Forest Ecology and Management Topography Soils Climate Vegetation...

GIS and Landscapes
Lisa A. SchulteForest Ecology and Management
Topography
Soils
Climate
VegetationDistribution
y
x1
x2
x3
= f(c, s, t)
ModelProbability of

What are geographical/spatial data?

What are geographical/spatial data?
Any data that can be mapped
Have x- and y-coordinate

Types of spatial data?

Types of spatial data?
Topographic maps
Hydrographic maps
Political/Administrative/Property boundaries
Road networks
Remote Sensing (aerial photography, satellite)
Data on people: census data, land use, marketing
surveys
Data on natural resources: climate, geology,
hydrology, soil, natural hazards, biological activity
Data on utilities

Why use GIS?

Limitations of a map:
2-D representation of 3-D
Limited to a single scale
Snapshot in time
Difficult to manipulate data
GIS OvercomesThese!!!

What is a GIS?
A set of computer tools for collecting, storing,
retrieving, transforming, and displaying spatial data
from the real world (Burrough and McDonnell 1998).
Many functions = may parts.
Computer
Screen
Printer
Scanner
DigitizingTable CD
FTP
CD
Network

Core parts of a GIS:
1) User interface/GIS tools• Responsible for capturing, storing, retrieving,
displaying, customizing, and sharing data
2) Spatial Database• Responsible for storing and querying data
Computer
Screen
Printer
Scanner
DigitizingTable CD
FTP
CD
Network
SpatialDatabase

How do we represent the real world digitally?
Physicalreality
Real worldmodel
Datamodel
Database
Maps/reports
From: Bernhardsen 1999
Actual phenomena:-Properties-Connections
Entity:-Type-Attributes-Relationships
Object:-Type-Attributes-Relationships-Geometry-Quality
Object:-Type-Attributes-Relationships-Geometry-Quality

Spatial Data Components
Spatial Data
AttributeComponent
Geometric Component
Categorical
PointLine
Area (polygon/cell)
Qualitative Quantitative
OrdinalIntervalRatio

Spatial Data Components
Spatial Data
AttributeComponent
Geometric Component
Categorical
PointLine
Area (polygon/cell)
Qualitative Quantitative
OrdinalIntervalRatio

Geometric Representation
Point: 0-D object that specifies geometric location specified through a set of coordinates.
Line segment (vector): 1-D object that is a direct line between 2 endpoints.
String: a sequence of line segments.
Polygon: 2-D object bounded by at least 3 1-D line segments.
Raster cell/pixel: 2-D that represents an element of regular tesselation of a surface.

Vector Data Model
Raster Data Model

Raster Data Model

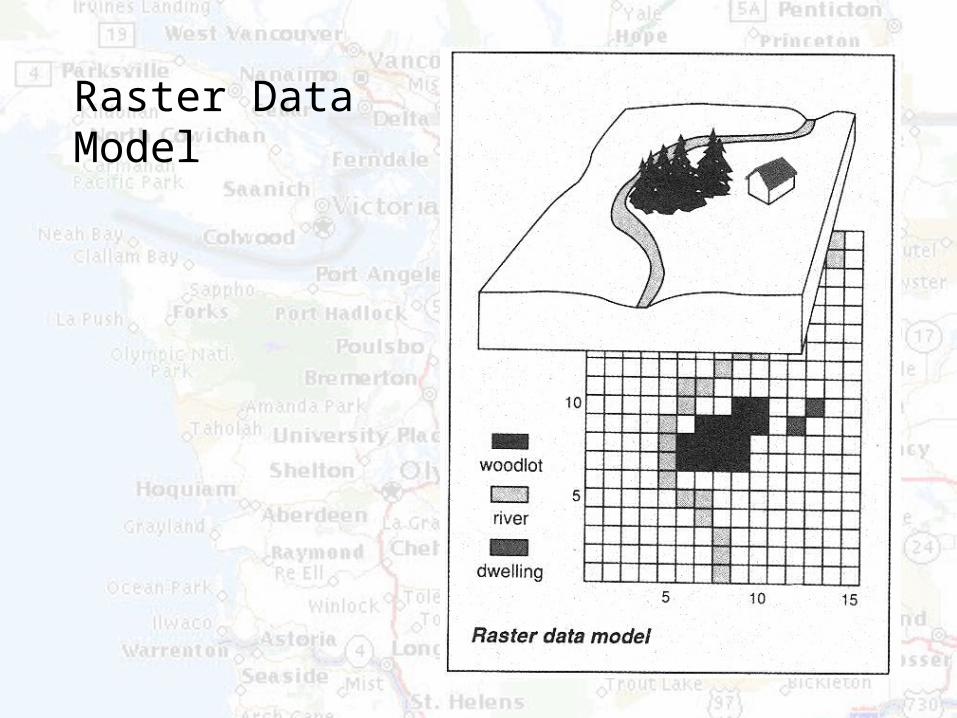
TIN Data Model
TIN Raster Data Model

Vector vs. Raster Very important choice!
Advantages of vector:
• Good representation of entity data models
• Space efficient storage of data
• Topology can be described explicitly and be
easily manipulated
• Efficient query operation
Advantages of raster:
• Simple data structure
• Efficient representation of highly variable data
• Mathematical modeling easier because all
entities have simple, regular shape

Georeferencing:
Matching up spatial database with earth coordinate
system
Coordinate systems
• Latitude/Longitude – distortion near poles
• Universal Transverse Mercator
– divide globe up into strips
– good for large datasets
• State Plane
– each state has own
– most accurate for at this scale

How do we represent the real world digitally?
Selecting applicable scale
Through simplification!
Two basic components associated with spatial data:
1. Geometric component Data Model
2. Attribute component Classification

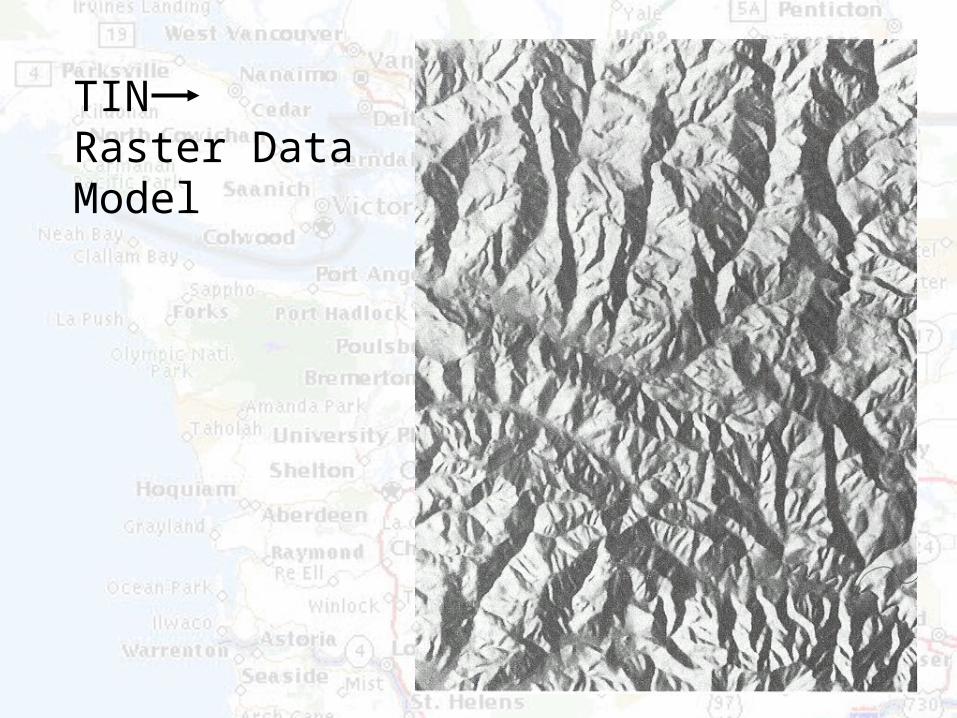
Who produces spatial data?
Who produces spatial data?
National agencies (USGS, USFS, NOAA, DNR)
Military organizations
Remote sensing companies (aerial photography, satellite)
Utility companies
Climatologists, geologists, hydrologists, ecologists,
geographers, oceanographers, etc.
Grad students!
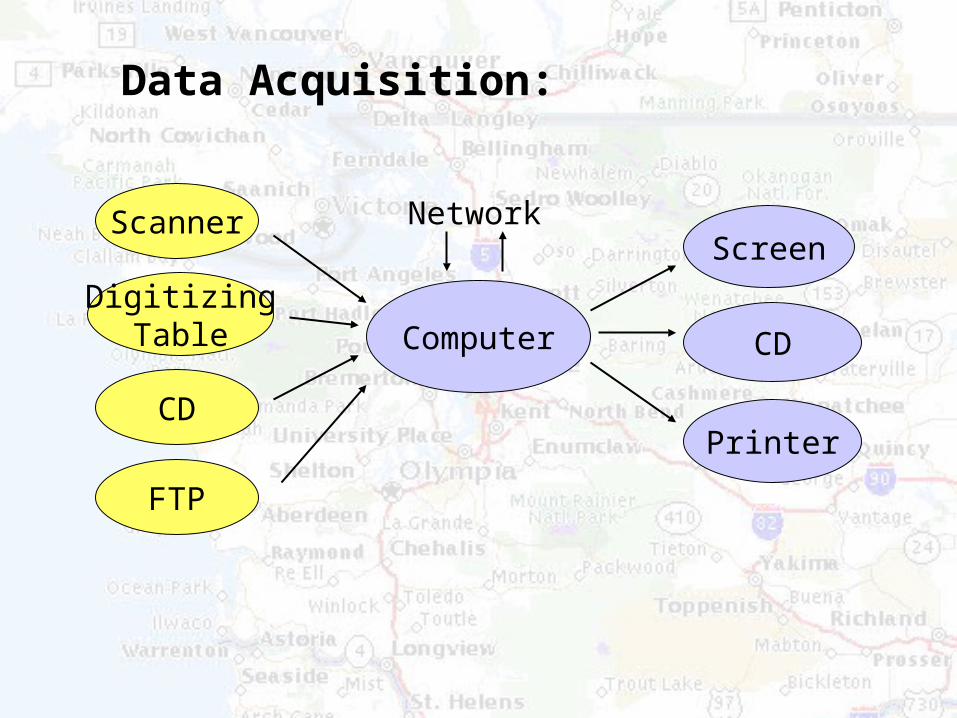
Data Acquisition:
Computer
Screen
Printer
Scanner
DigitizingTable CD
FTP
CD
Network

Data Acquisition:
Field surveys
Digitizing
• Trace lines on map
• Labor intensive
Scanning
• Scan map
• Edit data
Remote sensing
Deriving from existing GIS data layers
Downloading

Web Sources of GIS Data:
USGS
• Remotely sensed, DEMs, Soils, Hydrographies
• http://www.usgs.gov
NOAA - National Climatic Data Center
• Climate
• http://www.ncdc.noaa.gov/ol/about/ncdcnoaa.html
US Census Bureau
• Demographic
• http://www.census.gov/geo/tigerline/tl_1998.html
Wisconsin State Cartographer’s Office – Wisconsin Land
Information Clearinghouse
• Various
• http://wisclinc.state.wi.us/

GIS software:
Computer
Screen
Printer
Scanner
DigitizingTable CD
FTP
CD
Network

GIS software:
Arc/Info
• ESRI (http://www.esri.com/)
ArcView
• ESRI (http://www.esri.com/)
IDRISI
• Clark Labs (http://www.clarklabs.org/)
GRASS
• Baylor University (http://www.baylor.edu/~grass/)
Imagine
• ERDAS (http://www.erdas.com/products/product.html)

GIS functionality
Spatial queries
• Site analysis
• Trend analysis
• Pattern analysis
Spatial overlay
Spatial modeling
Network operations
Interpolation
Digital terrain analysis
Statistical analysis


Who uses spatial data?

Who uses spatial data?
Agriculture
Archaeology
Demographers
Environmental scientists and managers
Epidemiology and health scientists
Emergency services
Land planners
Marketing agencies
Naviation
Real estate
Tourism
Utilities

Uncertainty…
From: Lunetta et al. 1991

Spatial data in landscape ecology…
From: Bernhardsen 1999
Resolution?Data model?Attribute representation?Trustworthiness?

Nine factors to consider when embarking on spatial analysis with GIS:
1. Real world phenomena simple/complex?
2. Data used to describe real world phenomena detailed/generalized?
3. What data types are used to describe the phenomena?
4. Can phenomena be represented in a database exactly/vaguely?
5. Do database entities represent discrete/continuous real world entities?
6. Were the attributes of database entities obtained by complete
enumeration or by sampling?
7. Will the database be used for descriptive/administrative/analytical
purposes?
8. Will the database be used to make inferences about the real world?
9. Is the process under consideration static/dynamic?
(Burroughs and MacDonnell 1998)

References
Bernhardtsen, T. 1999. Geographic information systems: an introduction, 2nd edition. John Wiley and Sons, New York, New York, USA.
Burrough, P. A., and R. A. McDonnell. 1998. Principles of geographic information systems. Oxford University Press, Inc., New York, New York, USA.
Johnston, C.A. 1998. Geographic information systems in ecology. Blackwell Science, Oxford, UK.
Lunetta, R.S., R.G. Congalton, L.K. Fenstermaker, J.R. Jensen, K.C. McGwire, and L.R. Tinney. 1991. Remote sensing and geographic information system data integration: error sources and research issues. Photogrammetric Engineering and Remote Sensing 57:677-687.