GIS and correlation analysis of geo-environmental ...
20
112 GIS and correlation analysis of geo-environmental variables influencing malaria prevalence in the Saboba district of Northern Ghana Matthew Biniyam Kursah Abstract Analysing the significance of geo-environmental variables influencing malaria incidence will help decision makers design area-specific interventions for tackling the menace, particularly in high- risk areas. This study applied geocoding and raster extraction functionalities in GIS (ArcMap) and Pearson correlation in SPSS to identify the relationship between five geo-environmental variables and malaria incidence. It first geocoded malaria incidence data and extracted the corresponding values for five geo-environmental variables in ArcMap 10.1. The five geo-environmental variables are: distance to marshy areas, distance to watercourses (rivers and streams), soil water retention capacity, elevation and population. Pearson correlation was then used to find the relationship between the variables and malaria incidence. The study also applied spline interpolation technique to map malaria prevalence in the district using standardised malaria incidence. The result indicates that distance to marshy areas is inversely and significantly (at 1% level) related to malaria incidence. This means that malaria incidence decreases as distance to marshy areas increases. The distance to watercourses and elevation are also inversely related to malaria incidence in the study area. This means that as distance to watercourses increases and elevation rises, malaria incidence decreases. However, these relationships are not statistically significant at any of the conventional levels of significance (p<0.01 and p<0.05). The result also indicates that water retention capacity of different soils and population are positively related to malaria incidence. This means that malaria incidence rises with increases in the two variables, but the relationships are not statistically significant at any of the conventional levels. The study concluded that the null hypothesis (H0) that there is no significant relationship between distance to marshy areas and malaria incidence may be rejected at 1% (P<0.01) level of significance. However, there is not enough evidence to reject the null hypothesis (H0) that there is no significant relationship between distance to watercourses, different soil retention capacity, elevation and population, on the one hand, and malaria incidence on the other. It is, therefore, recommended that much broader settlement planning policies be adopted to curb building in those areas that are malaria prone. Key words: Correlation, GIS, malaria geography, malaria incidence Department of Geography Education, University of Education, Winneba (UEW), Box 25, North Campus, Winneba, Ghana, E-mail: [email protected] Ghana Journal of Geography Vol. 9(3), 2017 pages 112–131
Transcript of GIS and correlation analysis of geo-environmental ...

112
GIS and correlation analysis of geo-environmental variables
influencing malaria prevalence in the Saboba district of
Northern Ghana
Matthew Biniyam Kursah
Abstract
Analysing the significance of geo-environmental variables influencing malaria incidence will help
decision makers design area-specific interventions for tackling the menace, particularly in high-
risk areas. This study applied geocoding and raster extraction functionalities in GIS (ArcMap) and
Pearson correlation in SPSS to identify the relationship between five geo-environmental variables
and malaria incidence. It first geocoded malaria incidence data and extracted the corresponding
values for five geo-environmental variables in ArcMap 10.1. The five geo-environmental variables
are: distance to marshy areas, distance to watercourses (rivers and streams), soil water retention
capacity, elevation and population. Pearson correlation was then used to find the relationship
between the variables and malaria incidence. The study also applied spline interpolation technique
to map malaria prevalence in the district using standardised malaria incidence. The result indicates
that distance to marshy areas is inversely and significantly (at 1% level) related to malaria
incidence. This means that malaria incidence decreases as distance to marshy areas increases. The
distance to watercourses and elevation are also inversely related to malaria incidence in the study
area. This means that as distance to watercourses increases and elevation rises, malaria incidence
decreases. However, these relationships are not statistically significant at any of the conventional
levels of significance (p<0.01 and p<0.05). The result also indicates that water retention capacity
of different soils and population are positively related to malaria incidence. This means that malaria
incidence rises with increases in the two variables, but the relationships are not statistically
significant at any of the conventional levels. The study concluded that the null hypothesis (H0) that
there is no significant relationship between distance to marshy areas and malaria incidence may be
rejected at 1% (P<0.01) level of significance. However, there is not enough evidence to reject the
null hypothesis (H0) that there is no significant relationship between distance to watercourses,
different soil retention capacity, elevation and population, on the one hand, and malaria incidence
on the other. It is, therefore, recommended that much broader settlement planning policies be
adopted to curb building in those areas that are malaria prone.
Key words: Correlation, GIS, malaria geography, malaria incidence
Department of Geography Education, University of Education, Winneba (UEW), Box 25, North Campus, Winneba, Ghana,
E-mail: [email protected]
Ghana Journal of Geography Vol. 9(3), 2017 pages 112–131
Ghana Journal of Geography Vol. 9(3), 2017 pages 112–131
113
Introduction
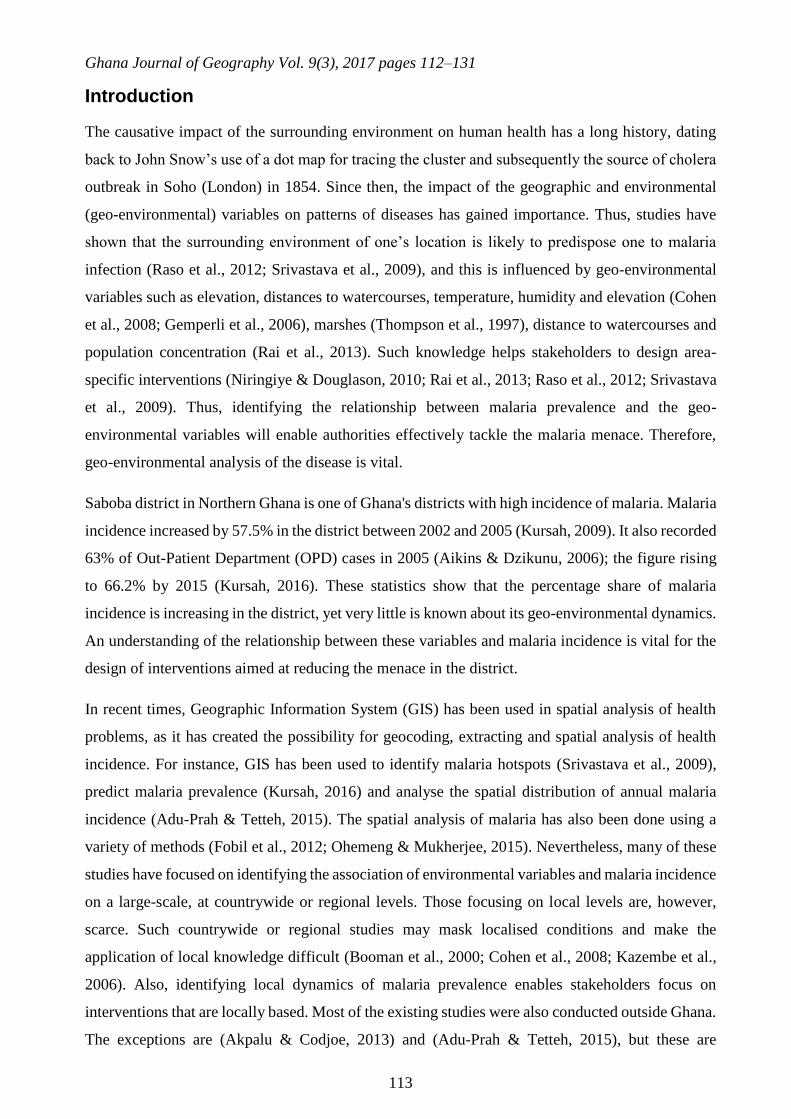
The causative impact of the surrounding environment on human health has a long history, dating
back to John Snow’s use of a dot map for tracing the cluster and subsequently the source of cholera
outbreak in Soho (London) in 1854. Since then, the impact of the geographic and environmental
(geo-environmental) variables on patterns of diseases has gained importance. Thus, studies have
shown that the surrounding environment of one’s location is likely to predispose one to malaria
infection (Raso et al., 2012; Srivastava et al., 2009), and this is influenced by geo-environmental
variables such as elevation, distances to watercourses, temperature, humidity and elevation (Cohen
et al., 2008; Gemperli et al., 2006), marshes (Thompson et al., 1997), distance to watercourses and
population concentration (Rai et al., 2013). Such knowledge helps stakeholders to design area-
specific interventions (Niringiye & Douglason, 2010; Rai et al., 2013; Raso et al., 2012; Srivastava
et al., 2009). Thus, identifying the relationship between malaria prevalence and the geo-
environmental variables will enable authorities effectively tackle the malaria menace. Therefore,
geo-environmental analysis of the disease is vital.
Saboba district in Northern Ghana is one of Ghana's districts with high incidence of malaria. Malaria
incidence increased by 57.5% in the district between 2002 and 2005 (Kursah, 2009). It also recorded
63% of Out-Patient Department (OPD) cases in 2005 (Aikins & Dzikunu, 2006); the figure rising
to 66.2% by 2015 (Kursah, 2016). These statistics show that the percentage share of malaria
incidence is increasing in the district, yet very little is known about its geo-environmental dynamics.
An understanding of the relationship between these variables and malaria incidence is vital for the
design of interventions aimed at reducing the menace in the district.
In recent times, Geographic Information System (GIS) has been used in spatial analysis of health
problems, as it has created the possibility for geocoding, extracting and spatial analysis of health
incidence. For instance, GIS has been used to identify malaria hotspots (Srivastava et al., 2009),
predict malaria prevalence (Kursah, 2016) and analyse the spatial distribution of annual malaria
incidence (Adu-Prah & Tetteh, 2015). The spatial analysis of malaria has also been done using a
variety of methods (Fobil et al., 2012; Ohemeng & Mukherjee, 2015). Nevertheless, many of these
studies have focused on identifying the association of environmental variables and malaria incidence
on a large-scale, at countrywide or regional levels. Those focusing on local levels are, however,
scarce. Such countrywide or regional studies may mask localised conditions and make the
application of local knowledge difficult (Booman et al., 2000; Cohen et al., 2008; Kazembe et al.,
2006). Also, identifying local dynamics of malaria prevalence enables stakeholders focus on
interventions that are locally based. Most of the existing studies were also conducted outside Ghana.
The exceptions are (Akpalu & Codjoe, 2013) and (Adu-Prah & Tetteh, 2015), but these are

GIS and correlation analysis of geo-environmental variables influencing malaria prevalence in the
Saboba district of Northern Ghana
114
countrywide studies. A Ghanaian study that dealt with the local level is (Fobil et al., 2012).
However, the focus of that study was on mapping urban malaria and diarrhoea mortality, and not on
analysing the relationship between the geo-environmental variables and malaria incidence. The
present study fills this void in the literature and serves as a planning tool for malaria control and for
future researches.
The study combined geocoding and raster extraction functionalities in GIS and Pearson correlation
in Statistical Package for Social Sciences (SPSS) software to identify the relationship between five
geo-environmental variables, on the one hand, and malaria incidence, on the other, in the Saboba
district of Northern Ghana. The output is intended to help stakeholders in the district to understand
which variables are significantly influencing malaria prevalence to plan appropriate interventions.
The hypothesis of the study is based on the conflicting findings on the relationship between the geo-
environmental variables and malaria incidence. For example, studies have found a significant
relationship between malaria prevalence and geo-environmental variables such as elevation (Cohen
et al., 2008; Gemperli et al., 2006; Raso et al., 2012), distance to marshes (Thompson et al., 1997),
distance to watercourses (Rai et al., 2013) and temperature and humidity (Adu-Prah & Tetteh, 2015).
Other studies have found no such significant relationship between malaria incidence and geo-
environmental variables such as elevation (Raso et al., 2012), distance to watercourses (Kursah,
2009; Niringiye & Douglason, 2010), rainfall (Adu-Prah & Tetteh, 2015) and temperature
(Niringiye & Douglason, 2010) at different geographic areas. Thus, the null hypothesis (H0) of the
study states that there is no statistically significant relationship between distance to marshy areas,
distance to watercourses (rivers and streams), soil water retention capacity, elevation and
population, on the one hand, and malaria incidence, on the other, in Saboba district. The alternative
hypothesis (H1), therefore, states that there is a statistically significant relationship between these
geo-environmental variables and malaria incidence in the district.
Literature review
This section reviews literature on the geo-environmental variables influencing malaria incidence
and the use of GIS for spatial analysis of malaria. The section helped determine which geographical
and environmental variables to use in the correlation analysis.
Malaria transmission has been found to be strongly associated with location, as it is prevalent around
specific mosquito breeding sites and can normally be transmitted only within a few hundred metres;
the distance rarely exceeds 2–3 km in Africa (Carter et al., 2000). Another study found that malaria
incidence dominates in marshes and other areas of poor drainage (Thompson et al., 1997). Thus,

Ghana Journal of Geography Vol. 9(3), 2017 pages 112–131
115
geographical variation plays an active role in the malaria prevalence (Raso et al., 2012; Srivastava
et al., 2009), and this is influenced by geo-environmental variables such as elevation, rainfall,
temperature and humidity (Cohen et al., 2008; Gemperli et al., 2006). Also, closeness to
watercourses is generally perceived as one of the most important drivers of malaria infection, as it
serves as vector breeding source. Accordingly, (Rai et al., 2013) found that malaria incidence
decreases with an increase in distance to water bodies. They also found that 50.5% of the malaria
cases occurred within a distance of less than 500m from watercourses in Varanasi district in India.
Rai and colleagues also found that variables such as population density, distance to ponds and
landuse influence malaria incidence (Rai et al., 2013). This is because these variables affect the lives
and development of Anopheles mosquitoes. Therefore, to achieve effective malaria control, an
analysis of the significance of the geo-environmental variables influencing malaria prevalence in
any specific area is paramount (Carter et al., 2000; Niringiye & Douglason, 2010; Singh et al., 2009).
This is because a clear understanding of the role of these variables is vital for the design of policies
targeted at reducing malaria prevalence. The relationship with elevation is a significant inverse one
(Cohen et al., 2008; Kazembe et al., 2006). This is because lower elevation facilitates malaria vector
breeding due to its association with water stagnation, thus increasing the risk of malaria prevalence.
This means that elevation is a vital variable to consider in this study even though the district is not
high enough to affect, for example, temperature, and subsequently the biology of the malaria vector.
In Africa, studies have shown the relationship between geo-environmental variables and malaria
incidence. For example, in a study in Côte d’Ivoire, rainfall and temperature were found to be
significant drivers of malaria prevalence while elevation was insignificant (Raso et al., 2012).
Similarly, a study in Malawi found that there was a significant relationship between elevation and
malaria risk. The study found that higher malaria risk areas were in low lying lake shore areas and
low risk areas were found along the highlands (Kazembe et al., 2006). Also, it has been found that
a 10m rise in elevation led to a 12% reduction of malaria incidence in Kenya (Cohen et al., 2008).
This is because higher elevation lowers temperature, which slows the development of both parasites
and mosquitoes. The explanation for the contrary findings may be the scale and the spatial variations
of the study areas.
In Ghana, temperature and humidity have been found to have a significant association with malaria
prevalence (Adu-Prah & Tetteh, 2015), as they have a major influence on the biology of mosquitoes
and may provide suitable conditions for the breeding of the vector. The author also found that
rainfall is a less significant predictor of malaria incidence in the country. This may be because
rainfall distribution in Ghana is generally high enough to facilitate malaria vector breeding.
GIS and correlation analysis of geo-environmental variables influencing malaria prevalence in the
Saboba district of Northern Ghana
116
However, another study in Ghana found that rainfall amount and humidity predicted malaria
prevalence (Akpalu & Codjoe, 2013).
Outbreaks of malaria are common in many areas in Ghana and Saboba district is no exception. The
reasons for this may include insufficient surveillance, poor reporting and a lack of geo-referenced
malaria data for timely interventions (Srivastava et al., 2009). This is why this study geocoded
malaria incidence to its location for analysis. Another reason may be because we are not always
aware of how significant a specific geo-environmental variable relates to malaria prevalence at any
given place. Thus, identifying geographical and environmental variables influencing malaria
prevalence will allow for the application of local knowledge. It will also assist authorities to design
interventions according to local needs. This is because intervention strategies targeting areas at the
local level have been found to be more effective in South Africa (Booman et al., 2000). The
application of GIS and correlation can help analyse the relationship between geo-environmental
variables and malaria incidence. This will enable health interventions to be appropriately targeted
(Rai et al, 2013).
GIS has been used for spatial analysis of malaria in recent times because it allows quick retrieval of
data and dynamic generation of outputs. Also, GIS allows for update of data for spatial risk analysis
and predictive forecasting. These generated maps are relatively easier to interprete for application.
For example, (Srivastava et al., 2009) used GIS for identifying malaria hotspots in Madhya Pradesh,
India. They concluded that GIS allowed quick retrieval of data and dynamic generation of the
hotspots maps for area-specific malaria control measures. Also, Rai et al (2013) used GIS to produce
a malaria susceptibility map. Similarly, Raso and colleagues predicted the geographical distribution
of malaria infection risk in Côte d’Ivoire to guide control interventions using geospatial models in
GIS (Raso et al., 2012). These studies revealed the power of GIS for spatial analysis of malaria
prevalence. Also, spatial analysis has also been conducted on environmental variables which
contribute to the spread of the malaria vector to develop a geospatial model for predicting malaria
susceptibility (Kursah, 2016). Clinical malaria cases were then geocoded and tested to determine
the accuracy of the prediction. However, (Kursah, 2016) did not test the relationship between these
geo-environmental variables and malaria prevalence. Also Ohemeng & Mukherjee (2015) identified
specific environmental variables suitable for the malaria vector in the Zambezi basin and predicted
the suitability of the area for the Anopheles mosquito. However, like Kursah (2016), Ohemeng and
Mukherjee's (2015) work did not statistically test the significance of these environmental variables
on malaria incidence.

Ghana Journal of Geography Vol. 9(3), 2017 pages 112–131
117
The major problem with these studies with the exception of (Fobil et al., 2012; Kursah, 2016;
Niringiye & Douglason, 2010) is their concentration on large-scale study areas. However,
intervention strategies are more effective if they target areas at the lower level (Booman et al., 2000;
Niringiye & Douglason, 2010; Rai et al., 2013; Srivastava et al., 2009). Another defect revealed in
the literature is the omission of soil characteristics (Kazembe et al., 2006; Niringiye & Douglason,
2010; Rai et al., 2013; Raso et al., 2012). The link between malaria prevalence and soil permeability
is in the water retention capacity of the soil and its role in producing stagnant water, and in sanitation
conditions in general. For example, an impermeable underlying soil such as fluvisols could easily
cause soil saturation and water stagnation, which will serve as vital breeding ground for malaria
larvae. It has been found that the water retention capacity of soils varies in Saboba district (Kursah,
2013), hence its inclusion in terms of permeability in the study.
Study area
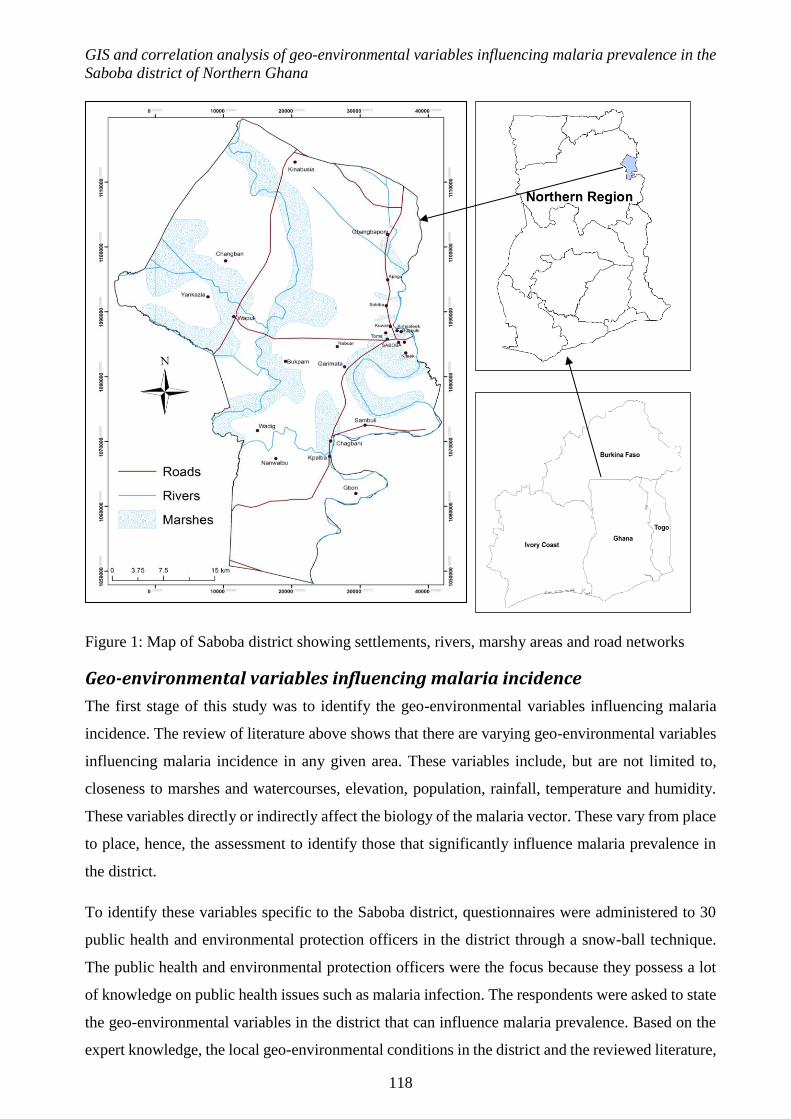
Saboba district lies in the north-eastern part of the Northern Region of Ghana (Figure 1). The district
is bordered in the north by Chereponi district, Zabzugu district (south), Yendi district (southwest)
and Gushiegu district (west), and in the east by the Republic of Togo. The district is located between
latitude 9° 20"N and 9° 70"N and longitude 0° 00" and 0° 30"E. The district has a population of
65,706 and an area of about 1,775km2, giving a population density of about 37 per/km2. Saboba is
the district’s administrative capital.
Topographically, the district has a number of rock outcrops underlain by Voltain rocks. Elevation
ranges between 50m at valley bottoms and below 300m at ridges and hill surfaces. The eastern
border along the River Oti valley has the lowest heights. A classification of soils by the (IUSS
Working Group, 2007) of the Food and Agricultural Organisation (FAO) shows that leptosol,
lixisol, acrisol and planosol are the soil classes found in the district. In terms of climate, the district
experiences warm and dry savannah conditions with average monthly temperatures ranging from
25°C to 35°C. The district experiences low and erratic rainfall and a long dry season (October to
April). The rainfall is a single-maxima type, with annual totals ranging between 750 mm and 1050
mm. The rains are torrential in nature and often cause flooding and erosion, leading to the formation
of gullies which facilitate the breeding of the malaria vector. The flood situation is worsened by the
spill-over water from River Oti and its drainage system (Kursah, 2013). There are several marshy
areas in the district (Figure 1).
GIS and correlation analysis of geo-environmental variables influencing malaria prevalence in the
Saboba district of Northern Ghana
118
Figure 1: Map of Saboba district showing settlements, rivers, marshy areas and road networks
Geo-environmental variables influencing malaria incidence
The first stage of this study was to identify the geo-environmental variables influencing malaria
incidence. The review of literature above shows that there are varying geo-environmental variables
influencing malaria incidence in any given area. These variables include, but are not limited to,
closeness to marshes and watercourses, elevation, population, rainfall, temperature and humidity.
These variables directly or indirectly affect the biology of the malaria vector. These vary from place
to place, hence, the assessment to identify those that significantly influence malaria prevalence in
the district.
To identify these variables specific to the Saboba district, questionnaires were administered to 30
public health and environmental protection officers in the district through a snow-ball technique.
The public health and environmental protection officers were the focus because they possess a lot
of knowledge on public health issues such as malaria infection. The respondents were asked to state
the geo-environmental variables in the district that can influence malaria prevalence. Based on the
expert knowledge, the local geo-environmental conditions in the district and the reviewed literature,

Ghana Journal of Geography Vol. 9(3), 2017 pages 112–131
119
the following geo-environmental variables were used in the analysis: distance to marshy areas,
distance to watercourses (rivers and streams), soil type (measured by the surface water retention
capacity), elevation and population. The reason for including the soil factor has been advanced
above. Though elevation is below 300m in the district and thus may not directly affect the biology
of the malaria vector, such as through lowered temperature, its association with water stagnation
which facilitates the breeding of the malaria vector is the reason for its inclusion in this study. The
temperature, rainfall and humidity were not cited by any of the experts sampled. This is because
these variables do not vary within the district (due to its small size). These variables were, thus, not
included in this study. Other factors reviewed above may be important in other geographic areas. A
researcher must, therefore, identify these factors in the locality concerned based on its unique
geography.
Methodology
Data sources
After identifying the geo-environmental variables influencing malaria prevalence (Figure 2)
pertaining to the Saboba district, the following GIS datasets were acquired: vector layers showing
settlements, watercourses (rivers and streams), soil type and road networks. These were acquired
from the Centre for Remote Sensing and Geographic Information Service (CERSGIS) of the
University of Ghana, Legon. A 90m raster elevation data was downloaded from CGIAR-CSI.
Ground truthing was undertaken in the district to take 15 control points such as road junctions and
river/stream confluences with Garmin Oregon 450 GPS (3m accuracy). These ground truths were
used to make sure the layers were aligned and overlapped perfectly. The missing settlements in the
GIS data were added using GPS and a few extracted from Google Earth satellite view – by taking
the x and y locations of these settlements and placing them on the settlement layer. The last census
(2010 population and housing census) figures showing population of the localities in the district
were obtained from the Ghana Statistical Service. These figures were geocoded to the respective
localities in ArcMap 10.1. Figure 2 shows the workflow of the study.
Sampling and collection of malaria incidence data
For malaria data, records of patients from the hospital in Saboba and four clinics in Wapuli, Kpalba,
Sambuli and Gbangbaponi were scanned from the hand-written record books in the OPDs showing
clinically diagnosed diseases. The hand-written books were used because the residence/place of the
patient is usually omitted at the data collation stage. The data (the scanned pages) included the type
of disease the person was treated for (later the malaria cases would be extracted) and the place of
residence of the person. To eliminate or at least reduce double counting due to the fact that some
patients may be transferred from one health facility to the other, the days in which the OPD records

GIS and correlation analysis of geo-environmental variables influencing malaria prevalence in the
Saboba district of Northern Ghana
120
were scanned were fixed for all health facilities through systematic sampling technique starting with
the 1st of every month and using an interval of five days. Thus, the first page on the 1st, 6th, 11th,
16th, 21st and 26th day of every month (due to the volume of work involved) between January 2015
and December 2015 were scanned. If any of the above dates fell on a weekend or a public holiday,
the preceding date was selected. This was to avoid using malaria incidence data from days that
generally have unusually lower or higher hospital turn-out, which could cause imbalances. The
following entries were rejected: 1) non-malaria entries, 2) illegible entries, 3) those that do not have
information on diseases treated and the residence or place of the patient, and 4) cases in which the
residence of the patient could not be matched to any locality in the district. SPSS was used for
coding and aggregating the malaria cases for each locality. A total of 2417 out of the 3349 entries
(over 95% of the rejected entries were non-malaria cases) were clinically diagnosed malaria cases
in 67 localities and satisfied the requirements for use. According to the (Ghana Statistical Service,
2014), over 90% of the population in the district live in these 67 localities.
Spatial randomness of the malaria incidence data
One major issue was to avoid malaria data which is not representative of the entire district. Nearness
to the health facilities was correlated with malaria data to determine whether the latter was randomly
representative of the district or was concentrated around the health facilities. Thus, those closer to
the health facilities may be most likely to seek medical treatment there than those far away. A
distance raster to the health facilities in the district was generated (Figure 3) and the values extracted
for correlation with the malaria incidence data. The Pearson correlation co-efficient (-0.197) and the
p-value (0.110) in Table 1 show that there is no significant relationship between malaria incidence
and distance to health facilities in the district. This means that the collected malaria data is not
skewed in favour of localities closer to the health facilities. Thus, this data can be used to find the
relationships between malaria incidence and the geo-environmental variables in the district.
Figure 2: The model showing the workflows of the study
Identify geo-
environmental
variables
influencing
malaria
incidence
GIS analysis
Processing datasets
for the geo-
environmental
variables
Geocoding
malaria incidence
& population data
Extracting values
of the geo-
environmental
variables
Correlation
analysis in
SPSS
GIS
datasets

Ghana Journal of Geography Vol. 9(3), 2017 pages 112–131
121
Figure 3: Distance to health facilities (metres)
Table 1: Correlation output of malaria incidence and the distance to health facilities
Variable Malaria incidence
P-value Correlation co-efficient
Distance to health facilities -.0.197 0.110
Observations 67
GIS spatial analysis
The malaria cases and the population figures of the respective localities were geocoded in ArcMap
10.1. ArcMap’s distance tool was used to create a distance raster layer showing distance to marshy
areas and distance to watercourses using a cell size of 90m, the same cell size as the elevation layer
(raster). The water retention capacity of the different soils was determined using 15 experts
(purposively sampled) with civil engineering, pedology, construction and planning backgrounds, to
assign weights to the soil categories on a scale from 0 to 10, where 0 means water drains easily and
10 means the soil retains most water or is highly waterlogged. The average score of the experts’
weights forms the water retention index of the soils in the district (Table 2). The soil layer was
converted to raster dataset using the water retention index as the input field and a cell size of 90m.
Table 2. Surface water retention index of the different soil types
Soil Types Characteristics (based on FAO IUSS Working Group, 2007) Water retention index*
Leptosols It is developed over hard rock or highly calcareous material and
shallow in nature, and thus extremely gravely and/or stony. 2
Lixisols It has a subsurface of low clays and high base saturation and
develops under intensive tropical weathering conditions. 4
Acrisols
It is clay-rich soil with toxic amounts of aluminium and experiences
extensive leaching. It also has excess aluminium and high
susceptibility to erosion. 7
Planosols
It has a coarse texture and experiences periodic water stagnation
because of its slowly permeable subsoil. It develops in clayey
colluvial deposits with oxygen deficiency in wet seasons. 9
* Average weight rounded to the nearest whole number
Distance to Health Facilities
0 - 1839.8
1839.8 - 3138.4
3138.4 - 4328.8
4328.8 - 5627.5
5627.5 - 6926.2
6926.2 - 8116.6
8116.6 - 9415.2
9415.2 - 10713.9
10713.9 - 12012.5
12012.5 - 13419.4
13419.4 - 14826.3
14826.3 - 16233.2
16233.2 - 17531.8
17531.8 - 18830.5
18830.5 - 20129.1
20129.1 - 21427.8
21427.8 - 22834.7
22834.7 - 24241.5
24241.5 - 25648.4
25648.4 - 27596.4

GIS and correlation analysis of geo-environmental variables influencing malaria prevalence in the
Saboba district of Northern Ghana
122
Extracting values of the geo-environmental variables
The distance to marshy areas and watercourses, soil water retention index and elevation (all in raster)
values were extracted using extract values to points tool under spatial analyst. These values were
appended to the settlements layer with geocoded malaria and population data. The attribute table of
this layer, containing the names of 67 localities with x and y coordinates and their recorded incidence
of malaria, distance to marshy areas and watercourses, soil water retention index, elevation values
and the population figures were then exported and accessed in SPSS for correlation (Figure 3). The
malaria incidence was standardised to per capita (malaria incidence divided by population) to run
the Pearson’s correlation. This was done to avoid an erroneous conclusion that an area has higher
malaria incidence merely because it has a higher population and hence a substantially higher record
of malaria cases.
Interpolation of malaria incidence
The standardised malaria incidence was interpolated in ArcMap 10.1 using spline interpolation
technique. This shows the spatial distribution of malaria incidence in the district, which was
reclassified (using equal interval) into very high, high, medium, low and very low malaria prevalence
areas.
Results
Figure 4 shows the localities with malaria incidence (a), distance to watercourse layer (b), distance
to marshy areas layer (c), soil water retention index layer (d), and elevation layer (e).
a) Settlements with malaria incidence b) Distance (metres) to watercourses
(rivers and streams)
waterdist
<VALUE>
0 - 403.1128845
403.1128846 - 813.94104
813.9410401 - 1,220.655518
1,220.655519 - 1,622.498047
1,622.498048 - 2,026.079956
2,026.079957 - 2,442.334961
2,442.334962 - 2,865.746094
2,865.746095 - 3,290.136719
3,290.13672 - 3,721.558838
3,721.558839 - 4,164.73291
4,164.732911 - 4,617.899902
4,617.899903 - 5,085.518555
5,085.518556 - 5,574.271484
5,574.271485 - 6,087.897949
6,087.89795 - 6,625.895996
6,625.895997 - 7,205.033203
7,205.033204 - 7,866.702148
7,866.702149 - 8,724.248047
8,724.248048 - 9,903.15625
9,903.156251 - 11,810.58887
0.000000
0.000000
10000.000000
10000.000000
20000.000000
20000.000000
30000.000000
30000.000000
40000.000000
40000.000000
10
50
00
0
.00
00
00
10
50
00
0.0
00
00
0
10
60
00
0
.00
00
00
10
60
00
0.0
00
00
0
10
70
00
0
.00
00
00
10
70
00
0.0
00
00
0
10
80
00
0
.00
00
00
10
80
00
0.0
00
00
0
10
90
00
0
.00
00
00
10
90
00
0.0
00
00
0
11
00
00
0
.00
00
00
11
00
00
0.0
00
00
0
111
00
00
.00
00
00
111
00
00
.00
00
00

Ghana Journal of Geography Vol. 9(3), 2017 pages 112–131
123
c) Distance to marshy areas (in metres) d) Soil water retention index
e) Elevation (in metres)
Figure 4: Maps of the geo-environmental variables used for the study
Malaria prevalence in the district
Table 3 shows the 10 localities with the highest malaria incidence. In decreasing order, these are
Kimoateek, Buakuln, Kpegu, Nabuar, Kiteek, Kuwani, Tilangbeni, Toma, Saboba and Sobiba. On
the other hand, the 10 localities with the lowest malaria incidence are Gbon, Wadig, Bukpam,
Kinabusia, Sambuli, Chagbani, Chagban, Nanwalbu, Yankazia and Umoadanbordo. Though
Nabuar, Kpegu and Sobiba are much farther from the health facilities, they recorded a higher malaria
incidence than localities closer to the facilities (Umoadanbordo and Yankazia) or with a health
facility (Sambuli). This debunks the view that higher malaria cases will most likely occur in the
localities with these facilities in or near them. No wonder there was no significant correlation
between malaria cases and distance to the health facilities in the district.
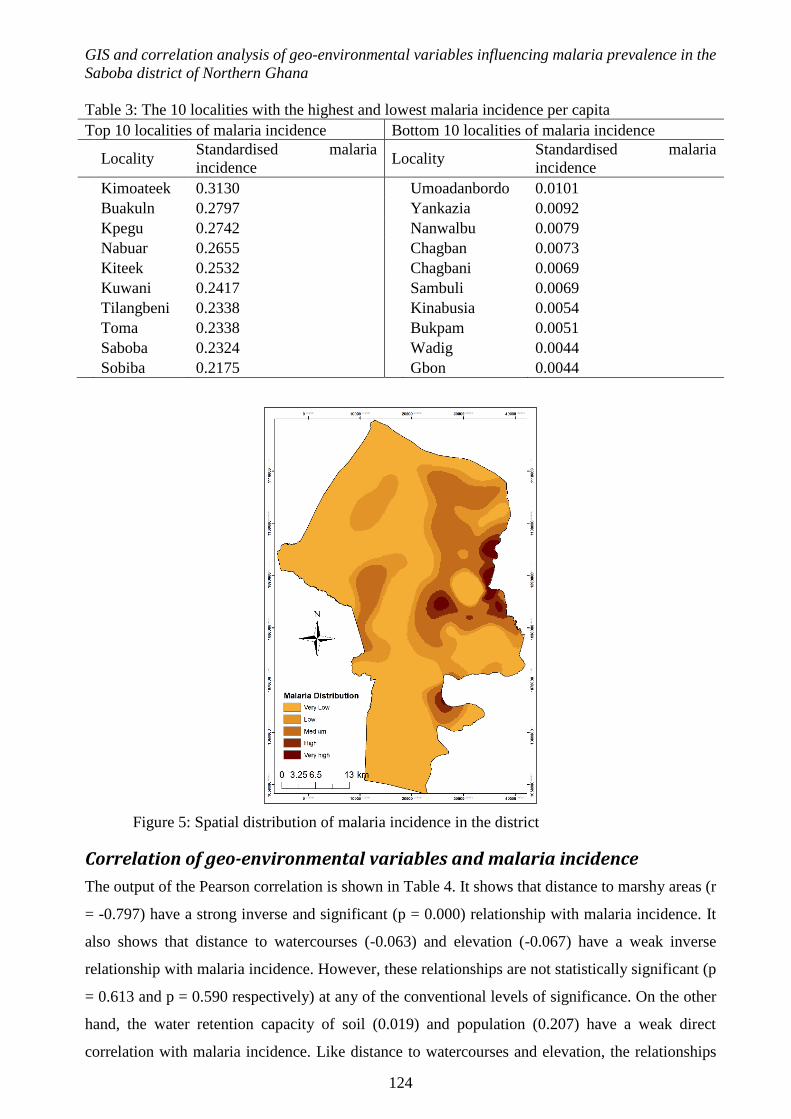
Figure 5 shows the spatial distribution of malaria incidence in the district. Generally, the eastern
and the central parts of the district have the highest malaria incidence.
Elevation268
50
SoilIndex
Water Retention Index
2
4
7
9
10
Distance to marshes
0.0 - 545.1
545.1 - 1557.4
1557.4 - 2491.9
2491.9 - 3504.2
3504.2 - 4516.5
4516.5 - 5606.7
5606.7 - 6696.9
6696.9 - 7709.2
7709.2 - 8799.4
8799.4 - 9889.6
9889.6 - 10979.8
10979.8 - 11914.2
11914.2 - 12926.5
12926.5 - 13938.8
13938.8 - 14951.2
14951.2 - 15885.6
15885.6 - 16820.1
16820.1 - 17754.5
17754.5 - 18688.9
18688.9 - 19857.0
GIS and correlation analysis of geo-environmental variables influencing malaria prevalence in the
Saboba district of Northern Ghana
124
Table 3: The 10 localities with the highest and lowest malaria incidence per capita
Top 10 localities of malaria incidence Bottom 10 localities of malaria incidence
Locality
Standardised malaria
incidence Locality
Standardised malaria
incidence
Kimoateek 0.3130 Umoadanbordo 0.0101
Buakuln 0.2797 Yankazia 0.0092
Kpegu 0.2742 Nanwalbu 0.0079
Nabuar 0.2655 Chagban 0.0073
Kiteek 0.2532 Chagbani 0.0069
Kuwani 0.2417 Sambuli 0.0069
Tilangbeni 0.2338 Kinabusia 0.0054
Toma 0.2338 Bukpam 0.0051
Saboba 0.2324 Wadig 0.0044
Sobiba 0.2175 Gbon 0.0044
Figure 5: Spatial distribution of malaria incidence in the district
Correlation of geo-environmental variables and malaria incidence
The output of the Pearson correlation is shown in Table 4. It shows that distance to marshy areas (r
= -0.797) have a strong inverse and significant (p = 0.000) relationship with malaria incidence. It
also shows that distance to watercourses (-0.063) and elevation (-0.067) have a weak inverse
relationship with malaria incidence. However, these relationships are not statistically significant (p
= 0.613 and p = 0.590 respectively) at any of the conventional levels of significance. On the other
hand, the water retention capacity of soil (0.019) and population (0.207) have a weak direct
correlation with malaria incidence. Like distance to watercourses and elevation, the relationships
Ghana Journal of Geography Vol. 9(3), 2017 pages 112–131
125
are not statistically significant (p = 0.877 and p = 0.093 respectively) at any of the conventional
levels of significance.
Table 4: Correlation output of malaria incidence and the geo-environmental variables
Geo-environmental variable Malaria incidence
P-value Correlation co-efficient (r)
Distance to marshy areas -0.797 0.000**
Distance to watercourses (rivers & Streams) -0.063 0.613
Soil water retention index 0.019 0.877
Elevation -0.067 0.590
Population 0.207 0.093
Observations 67
**P<0.01, *P<0.05
Distance to marshy areas and its share of malaria incidence
The only geo-environmental variable which is a statistically significant correlator with malaria
incidence in the district is distance to marshy areas. This was further analysed based on the distance
to marshy areas and its share of malaria incidence. Table 5 shows that 46.4% of the malaria
incidence occurred within a distance of 500m (0.5km) from marshy areas. Also, 40.7% of the
malaria cases were recorded within a distance of between 500m and 1000m. At a distance of 1000m
to 2000m, 9.9% of the malaria incidence were recorded. However, 2.6% of the recorded malaria
incidence occurred within a distance of between 2000m and 3000m to marshy areas. Beyond 3000m,
only 0.4% of the malaria cases were recorded.
Table 5: The range of distance to marshy areas and its share of malaria incidence
Distance to marshy areas (metres) Share of malaria incidence Percent (%)
500 1121 46.4
1000 984 40.7
2000 240 9.9
3000 62 2.6
Beyond 3000 10 0.4
Total 2417 100.0
Discussion
GIS application was enormously valuable in the geocoding, processing and extraction of values for
the geo-environmental variables and for interpolating malaria incidence data. SPSS was used to
estimate the correlation co-efficient between the malaria incidence and the geo-environmental
variables. The correlation co-efficient shows that distance to marshy areas is a statistically
significant correlator of malaria incidence in the district. However, the other four geo-environmental
variables, that is, distance to watercourses (rivers and streams), soil retention capacity, elevation
and population are not statistically significant correlators of malaria incidence in the district. Thus,

GIS and correlation analysis of geo-environmental variables influencing malaria prevalence in the
Saboba district of Northern Ghana
126
the null hypothesis (H0) that there is no significant relationship between distance to marshy areas
and malaria incidence may be rejected at a 1% (P<0.01) level of significance. On the other hand,
there is not enough evidence to reject the null hypothesis (H0) that there is no significant relationship
between distance to watercourses, soil retention capacity, elevation and population, on the one hand,
and malaria incidence on the other. This is because the p-values for those variables are greater than
any of the conventional levels of significance (P>0.01 and P>0.05).
Nearness to marshy areas increases malaria prevalence as drainage features are important sources
for malaria vector breeding. The result of the correlation showed that distance to marshy areas is
inversely and significantly (1% level of significance) related to malaria incidence in the district,
indicating that as distance to marshy areas increases, malaria incidence decreases. This finding
supports existing literature that found that malaria incidence decreases with an increase in distance
to pool of water and that 50.5% of the malaria cases occurred within a distance of less than 500m
to pool of water in Varanasi district in India. Also, it has been found that malaria incidence is
significantly correlated with distance to marshy areas and other areas of poor drainage (Thompson
et al., 1997).
Like the marshy areas, the correlation co-efficient showed that distance to watercourses (rivers and
streams) is also inversely related to malaria incidence in the district, indicating that as distance to
watercourses increases, malaria incidence decreases. However, unlike the marshy areas, this
relationship is not statistically significant at any of the conventional significance levels. This finding
supports existing literature that found no significant relationship between malaria incidence and the
distance to watercourses such as rivers/streams in Uganda (Niringiye & Douglason, 2010) and in
Northern Ghana (Kursah, 2009). The reason is that the rivers and streams are fast flowing water or
lotic freshwater bodies that do not facilitate easy breeding of mosquito larvae. Therefore, the malaria
interventions, such as those proposed in the past that sought to spray along these types of
watercourses, may not yield the expected outcome. However, the finding is contrary to some
previous studies that found a significant relation between malaria prevalence and distance to
watercourses (Carter et al., 2000; Rai et al., 2013; Watson, 1949). The explanation for the contrary
finding is the nature of the water bodies – that is, those that are stagnant facilitate the breeding of
mosquito larvae more than the swift-flowing ones. It has been found, for example, in Ethiopia, that
higher water current led to a reduced presence of the malaria vector (Kenea et al., 2011).
The water retention capacity of soil is positively related to malaria incidence in the district. The
positive relation means that malaria incidence increases with increase in the water retention capacity
of soil. Hence, a soil type which retains surface water and is more susceptible to waterlogging has

Ghana Journal of Geography Vol. 9(3), 2017 pages 112–131
127
a higher malaria incidence. This is because this soil type easily creates stagnant pools which may
provide conducive grounds for breeding the malaria vector. However, this relationship is not
statistically significant under any of the conventional levels of significance. Since stagnant water is
ideally required for the growth of the malaria vector, this result implies that water retention of soil
is not necessarily a proxy for presence of stagnant water. Other sources of stagnant water such as
dug-out pits, gutters and even open tin cans exist in the district and provide suitable sources for
breeding the malaria vector.
Elevation generally affects malaria vector development as temperature reduces with higher
elevation. However, its effects on waterlogging and surface drains as indicated above made it an
important factor for this study. The correlation co-efficient shows that elevation is inversely related
to malaria incidence, implying that as elevation in the district rises, malaria incidence decreases.
This supports earlier research that found an inverse relation between elevation and malaria
incidence (Cohen et al., 2008; Ernst et al., 2006; Kazembe et al., 2006). However, while the current
study found that the relationship is not statistically significant, these earlier studies found a
statistically significant relationship. The explanation is that these studies were conducted in highland
areas in Kenya and Malawi where elevations are high enough to influence the development of the
malaria vector. However, Saboba district is not a highland area – all the 67 localities are below
300m. This height is not sufficient to affect the temperature and hence the biology of the malaria
vector.
Population is positively related to malaria incidence, implying that areas of higher population
concentration tend to have higher malaria incidence. This implies that malaria is highly prevalent in
urbanised areas in the district. It is, therefore, not surprising that the majority of the top 10 localities
with the highest malaria incidence per capita are the relatively more populated areas in the district
(Table 2). This could be explained by the presence of uncontrolled dug-out pits from which mortar
(mud and sand) had been scooped for building houses, KVIP (semi-closed toilet facilities), open
gutters, empty cans and plastic materials in the district which collect water during rains and serve
as reservoirs for breeding mosquito larvae. It was observed that all these variables are predominantly
an urbanised problem in the district. It was also observed that higher populated areas in the district
are mostly associated with poor sanitation and the presence of breeding grounds for the mosquito
larvae. Another reason may be that higher population provides more human hosts for the vector to
dwell in. This is because the parasite, which causes malaria (Plasmodium), requires two different
hosts – a vertebrate intermediate host, such as a human, and an insect definitive host, or the vector.
Therefore, higher population means more vertebrate intermediate hosts (humans) to help in the
transmission of the malaria parasite. This supports the finding by (Rai et al., 2013) that most of the

GIS and correlation analysis of geo-environmental variables influencing malaria prevalence in the
Saboba district of Northern Ghana
128
very high malaria zones are in the Varanasi city area where the population density is very high.
However, it contradicts the finding of (Niringiye & Douglason, 2010) which found no association
between population concentration and malaria prevalence at district level in Uganda. The
explanation for this discrepancy could be that higher population concentration by itself does not
trigger higher malaria incidence, but that the actions or inactions of the population, such as poor
sanitation, creation of open drains and construction projects, predispose them to higher malaria
vectors.
Generally, the eastern and the central parts of the district have the highest malaria incidence. This
means that malaria incidence is not evenly distributed. Some areas generally have a
disproportionately high incidence than others. A further analysis of the only significant correlator
with malaria incidence, distance to marshy areas, showed that 46.4% of the malaria incidence
occurred within a distance of 500m (0.5km). This is reduced to 40% at a distance of between 500m
and 1000m, drastically reducing to 9.9% (1000m to 2000m), 2.6% (2000m and 3000m) and only
0.4% at a distance beyond 3000m (3km). This shows that a higher malaria incidence (86.4%) is
concentrated within a distance of 1000m (1km) from marshy areas. This is similar to an earlier study
that found that 50.5% of the malaria cases occurred within a distance of less than 500m from
watercourses in Varanasi district, India (Rai et al., 2013). It has also been argued that malaria is
strongly associated with location, can normally be transmitted only within a few hundred metres,
and rarely exceeds 2000m to 3000m in Africa (Carter et al., 2000). Thus, among the variables
considered in this study, intervention strategies should be focused on managing human closeness to
or interactions with the marshy areas for an effective malaria control programme. Any interventions
aimed at tackling malaria through altering any of these variables to the exclusion of marshy areas
may not yield the expected outcome. However, using only one-year malaria data may not be
sufficient to make a firm conclusion on the findings; thus, future research is needed in the area. This
will help build a comprehensive model to be used to identify the influence of specific geo-
environmental variables on malaria incidence in the district.
Conclusion
The study applied geocoding and raster extraction functionalities in GIS (ArcMap) and Pearson
correlation in SPSS for examining the relationships between five geo-environmental variables, that
is, distance to marshy areas, distance to watercourses (rivers and streams), soil water retention
capacity, elevation and population, on the one hand, and malaria incidence, on the other. The result
of the Pearson correlation indicates that distance to marshy areas is inversely and significantly
related to malaria incidence in the district. This means that malaria incidence decreases with an

Ghana Journal of Geography Vol. 9(3), 2017 pages 112–131
129
increase in distance from marshy areas, indicating that people living closer to this feature are at least
five times more likely to be infected with malaria than pertains with the other four variables.
Distance to watercourses and elevation are also inversely related to malaria incidence in the district.
This indicates that malaria incidence decreases as distance to these watercourses increases and at
higher elevation. These relationships are, however, not statistically significant at any of the
conventional levels of significance, indicating that the two geo-environmental variables are not
statistically significant correlators of malaria incidence in the district. The correlation co-efficient
also indicates that malaria incidence rises with increase in water retention capacity of the soil and
population concentration. However, like distance to watercourses and elevation, these relationships
are not statistically significant at any of the conventional levels of significance. The correlation co-
efficient also shows that the relationships, with the exception of marshy areas, are very weak.
Therefore, it is concluded that the null hypothesis (H0) that there is no significant relationship
between distance to marshy areas and malaria incidence may be rejected at a 1% (P<0.01) level of
significance. On the other hand, there is not enough evidence to reject the null hypothesis (H0) that
there is no significant relationship between distance to watercourses, different soil retention
capacity, elevation and population, on the one hand, and malaria incidence, on the other (that is,
P>0.05). Also, close to half of the recorded malaria incidence occurred within a distance of 500m
from the marshy areas in the district. As most of the variables used in the study, especially marshy
areas, are natural variables and cannot be easily altered, it is recommended that much broader
settlement planning policies be adopted to curb building in those areas that are malaria prone.
Policies should also be implemented by the district assembly to guide the uncontrolled digging of
pits, open gutters, the artificial stagnant water reservoirs and the general sanitation conditions of the
district, especially the relatively populated centres.
References
Adu-Prah, S., & Tetteh, E. K. (2015). Spatiotemporal analysis of climate variability impacts on
malaria prevalence in Ghana. Applied Geography, 60, 266–273.
Akpalu, W., & Codjoe, S. N. A. (2013). Economic analysis of climate variability impact on malaria
prevalence: The case of Ghana. Sustainability, 5(10), 4362–4378.
Booman, M., Durrheim, D. N., La Grange, K., Martin, C., Mabuza, A. M., Zitha, A., … Sharp, B.
L. (2000). Using a geographical information system to plan a malaria control programme in
South Africa. Bulletin of the World Health Organization, 78(12), 1438–1444.
Carter, R., Mendis, K. N., & Roberts, D. (2000). Spatial targeting of interventions against malaria.
Bulletin of the World Health Organization, 78(12), 1401–1411.

GIS and correlation analysis of geo-environmental variables influencing malaria prevalence in the
Saboba district of Northern Ghana
130
Cohen, J. M., Ernst, K. C., Lindblade, K. A., Vulule, J. M., John, C. C., & Wilson, M. L. (2008).
Topography-derived wetness indices are associated with household-level malaria risk in two
communities in the western Kenyan highlands. Malaria Journal, 7(40), 40–51.
Ernst, K. C., Adoka, S. O., Kowuor, D. O., Wilson, M. L., & Chandy, J. C. (2006). Malaria hotspot
areas in a highland Kenya site are consistent in epidemic and non-epidemic years and are
associated with ecological factors. Malaria Journal, 5, 78–87.
Fobil, J. N., Levers, C., Lakes, T., Loag, W., Kramer, A., & May, J. (2012). Mapping urban malaria
and diarrhea mortality in Accra, Ghana: Evidence of vulnerabilities and implications for urban
health policy. Journal of Urban Health, 89(6), 977–991.
Gemperli, A., Sogoba, N., Fondjo, E., Mabaso, M., Bagayoko, M., Briët, O. J. T., … Vounatsou, P.
(2006). Mapping malaria transmission in West and Central Africa. Tropical Medicine and
International Health, 11(7), 1032–1046.
Ghana Statistical Service. (2014). 2010 Population and Housing Census: District Analytical Report
– Saboba District. Accra: Ghana Statistical Service.
IUSS Working Group. (2007). World reference base for soil resources, First update 2007 (World
Soil Resources No. 103). Rome: FAO.
Kazembe, L. N., Kleinschmidt, I., Holtz, T. H., & Sharp, B. L. (2006). Spatial analysis and mapping
of malaria risk in Malawi using point-referenced prevalence of infection data. International
Journal of Health Geographics, 5(1), 41–49.
Kenea, O., Balkew, M., & Gebre-Michael, T. (2011). Environmental factors associated with larval
habitats of anopheline mosquitoes in irrigation and major drainage areas in the middle course
of the Rift Valley, Central Ethiopia. Journal of Vector Borne Diseases, 48(2), 85–92.
Kursah, M. B. (2009). Water sources, infrastructure, space and the dynamics of environmental
diseases in Saboba district, Northern Ghana: Using GIS. Kungliga Tekniska Högskolan,
Stockholm.
Kursah, M. B. (2013). Application of GIS in flood detection for road infrastructure planning in
north-eastern corridor of Northern Ghana. International Journal of Applied Science and
Technology, 5(3), 94–106.
Kursah, M. B. (2016). Modelling malaria susceptibility using Geographic Information System.
GeoJournal, 82(6), Forthcoming. https://doi.org/10.1007/s10708-016-9732-0
Niringiye, A., & Douglason, O. G. (2010). Environmental and socio-economic determinants of
malaria prevalence in Uganda. Research Journal of Environmental and Earth Sciences, 2(4),
194–198.
Ohemeng, F. D., & Mukherjee, F. (2015). Modelling the spatial distribution of the anopheles
mosquito for malaria risk zoning using remote sensing and GIS: A case study in the Zambezi

Ghana Journal of Geography Vol. 9(3), 2017 pages 112–131
131
Basin, Zimbabwe. International Journal of Applied Geospatial Research, 6(3), 7–20.
Rai, P. K., Nathawat, M. S., & Rai, S. (2013). Using the information value method in a geographic
information system and remote sensing for malaria mapping: A case study from India.
Informatics in Primary Care, 21(1), 43–52.
Raso, G., Schur, N., Utzinger, J., Koudou, B. G., Tchicaya, E. S., Rohner, F., … Vounatsou, P.
(2012). Mapping malaria risk among children in Côte d’Ivoire using Bayesian geo-statistical
models. Malaria Journal, 11(1), 160–171.
Singh, N., Shukla, M. M., & Dash, A. P. (2009). Control of malaria in Central India, Madhya.
Transactions of the Royal Society of Tropical Medicine and Hygiene, 103(2), 209–210.
Srivastava, A., Nagpal, B. N., Joshi, P. L., Paliwal, J. C., & Dash, A. P. (2009). Identification of
malaria hotspots for focused intervention in tribal state of India: A GIS based approach.
International Journal of Health Geographics, 8(1), 30–38.
Thompson, R., Begtrup, K., Cuamba, N., Dgedge, M., Mendis, C., Gamage-Mendis, A., … Hogh,
B. (1997). The Matola project: A temporal and spatial study of malaria transmission and
disease in a suburban area of Maputo, Mozambique. American Journal of Tropical Medicine
and Hygiene, 57(5), 550–559.
Watson, R. B. (1949). Location and mosquito proofing of dwellings. In Malariology (Boyd, M. F.
(ed), pp. 1184–1202). Philadelphia: WB Saunders Co.