Gippsland Lakes Natural Assets ReportCard · · 2015-05-14Gippsland Lakes Natural Assets Report...
42
2011 Natural Assets Report Card Gippsland Lakes
Transcript of Gippsland Lakes Natural Assets ReportCard · · 2015-05-14Gippsland Lakes Natural Assets Report...

2011Natural Assets
ReportCard
Gippsland Lakes


Gippsland Lakes and Catchments Task Force
Gippsland Lakes Natural Assets Report Card Dr Anthony Ladson Moroka Pty Ltd PO Box 1245 Fitzroy North Vic 3070
Dr John Tilleard Moroka Pty Ltd PO Box 67C Somers Vic 3927
30 August 2011


Gippsland Lakes Report Card Gippsland Lakes and Catchments Task Force
Page | i
Summary This report documents the development and application of a set of ratings for selected environmental indicators to form a “report card” on the condition of the Gippsland Lakes. Six aspects of lake conditions have been assessed:
• Water quality • Algal blooms • Wetlands • Birds • Seagrass • Fish
Each indicator has been assigned a rating from A to E to represent an assessment of its current condition (see Table 1). These ratings are summarised in the report card published separately by the Gippsland Lakes and Catchments Taskforce. Table 1: Summary of results
Generic descriptor
Indicator
Water Quality Algal Blooms Wetlands Birds Seagrass Fish
Excellent A
>80% of water quality
parameters meet guidelines
No bloom and low risk of a
bloom
Average Index of Wetland
Condition score 9-10
Abundance and diversity
constant or increasing
Increase in density and
extent of seagrass cover
Increase in fish diversity
and abundance
Good B
60%-80% of water quality parameters
meet guidelines
Risk of a bloom but a
bloom did not occur
Average Index of Wetland
Condition score 7-8
Ramsar listing criteria and total species
diversity maintained
Increase in density or extent of
seagrass cover
Increase in diversity or abundance
Moderate C
40%-60% of water quality parameters
meet guidelines
Minor bloom, little
economic impact
Average Index of Wetland
Condition score 5-6
Ramsar listing criteria met.
Some decrease in abundance and diversity
No change in density or extent of seagrass
cover
No change in diversity or abundance
Poor D
20%-40% of water quality parameters
meet guidelines
Short duration bloom, minor
economic impacts
Average Index of Wetland
Condition score 3-4
Declining abundance and
diversity. Ramsar listing
threatened
Decrease in density or extent of
seagrass cover
Decrease in diversity or abundance
Very poor E
<20% of water quality
parameters meet guidelines
Large, persistent
bloom with high economic
impacts
Average Index of Wetland
Condition score 0-2
Loss of Ramsar attributes
Decrease in density and
extent of seagrass cover
Decrease in diversity and abundance
2011 Rating B C B C C D


Gippsland Lakes Report Card Gippsland Lakes and Catchments Task Force
Page | iii
Table of Contents Summary ................................................................................. i Table of Contents .................................................................. iii 1. Introduction .............................................................. 1
1.1 Indicators.............................................................................................1 1.2 Ratings ................................................................................................1 1.3 Scope ...................................................................................................2
2. Water Quality ............................................................ 3 2.1 Importance ..........................................................................................3 2.2 Rating scheme .....................................................................................3 2.3 Evidence to support rating ..................................................................3
2.3.1 Analysis of water quality data .................................................5 2.4 Reliability ..........................................................................................12 2.5 References .........................................................................................13
3. Algal Blooms ........................................................... 14 3.1 Importance ........................................................................................14 3.2 Rating scheme ...................................................................................14 3.3 Evidence to support rating ................................................................14
3.3.1 Conditions in 2010 ................................................................15 3.4 Reliability ..........................................................................................16 3.5 References .........................................................................................16
4. Wetlands ................................................................. 17 4.1 Importance ........................................................................................17 4.2 Rating Scheme ..................................................................................17 4.3 Evidence to support rating ................................................................17 4.4 Reliability ..........................................................................................17 4.5 References .........................................................................................19
5. Birds ........................................................................ 20 5.1 Importance ........................................................................................20 5.2 Rating scheme ...................................................................................20 5.3 Evidence to support rating ................................................................21 5.4 Reliability ..........................................................................................21 5.5 References .........................................................................................22
6. Seagrass ................................................................. 23 6.1 Importance ........................................................................................23 6.2 Rating Scheme ..................................................................................23 6.3 Evidence to support rating ................................................................23 6.4 Reliability ..........................................................................................24 6.5 References .........................................................................................25
7. Fish ......................................................................... 26 7.1 Importance ........................................................................................26
7.1.1 Ecological importance ...........................................................26 7.1.2 Economic importance ...........................................................26
7.2 Rating Scheme ..................................................................................26

Gippsland Lakes Report Card Gippsland Lakes and Catchments Task Force
Page | iv
7.3 Evidence to support rating ................................................................27 7.3.1 Diversity ................................................................................27 7.3.2 Abundance .............................................................................27
7.4 Reliability ..........................................................................................27 7.5 References .........................................................................................32
8. Improving the report card ....................................... 33 8.1 Water quality .....................................................................................33 8.2 Algal blooms .....................................................................................33 8.3 Wetlands ...........................................................................................33 8.4 Birds ..................................................................................................33 8.5 Seagrass.............................................................................................34 8.6 Fish ....................................................................................................34 8.7 References .........................................................................................34

Gippsland Lakes Report Card Gippsland Lakes and Catchments Task Force
Page | 1
1. Introduction The purpose of this report is to document the development and application of a set of ratings for selected environmental indicators, to form a “report card” on the condition of the Gippsland Lakes. This report card will be used as a summary of the overall health of the Lakes and to compliment reporting of the health of the Gippsland Lakes catchment undertaken by the Gippsland Integrated Natural Resources Forum.
1.1 Indicators The Gippsland Lakes and Catchments Task Force selected the following environmental indicators for the report card:
• Water quality • Algal blooms • Wetlands • Birds • Seagrass • Fish
These indicators have been selected to each represent an important aspect of ecological health. Further details, for each individual indicator, are provided later in this report.
1.2 Ratings Each indicator has been assigned a rating from A to E to represent an assessment of its current condition. The ratings A to E have a generic descriptor that applies to all indicators (see Table 1) and a specific descriptor that applies to each individual indicator. The basis of the individual ratings has been developed specifically for the report card. For each indicator, a review of available data has guided the development of a rating scheme (Table 2). Ratings are generally based on data for the period 2009-2010, although older data have been used where there was a lack of more recent information. See sections following for more detail.

Gippsland Lakes Report Card Gippsland Lakes and Catchments Task Force
Page | 2
Table 2: Basis of ratings and primary references used Indicator Basis of rating Primary references1
Water quality
The ratings used for water quality are based on the exceedance of guideline levels for a range of water quality parameters. Guidelines are taken from the SEPP and ANZECC water quality guidelines.
Data from EPA fixed sites (Stephens and Biggins, 2004)
Schedule F3 of the State Environmental Protection Policy (SEPP)
ANZECC guidelines
Algal blooms
Certain water quality conditions in the Gippsland Lakes signal an increased threat of blooms. There is also regular monitoring of the abundance of cyanobacteria (blue-green algae). Ratings are based on both the threat of a bloom and whether monitoring showed a bloom occurred.
Cook, P. L. M. and D. P. Holland (in press) Biogeochemistry
EPA Gippsland Lakes Blue-Green Algae monitoring program
NHMRC (2008) Guidelines for managing risks in recreational water
Wetlands
An existing scoring system, the Index of Wetland Condition (IWC), has been used. The IWC accumulates a numerical score across a range of wetland attributes, relative to a reference condition based on undisturbed wetlands. For this report, ratings were ascribed based on the IWC score.
Statewide Assessment of Wetland Condition http://www.dse.vic.gov.au/conservation-and-environment/index-of-wetland-condition
Birds
The Gippsland Lakes are a Ramsar wetland because of their importance to a range of water birds. Ratings are based on trends in abundance and diversity of birds, along with Ramsar listing criteria.
BMT WBM (2009) Ecological character description for the Gippsland Lakes Ramsar Site, Draft
Seagrass
No absolute reference condition is available to describe seagrass condition. Instead a rating system has been developed based qualitatively on the observed change in seagrass density and/or extent from a time series of measurements.
Hindell and Warry, 2010
Warry and Hindell, 2011
Fish
Ratings are based on change in abundance and diversity of fish as based on commercial catch data, recreational catch data and other information gleaned from DPI reports.
Kemp et al., (2011) Warry and Hindell, (2011)
1.3 Scope These report card ratings are based on existing published data and some unpublished data that was made available on enquiry. We have not endeavoured to validate the data or justify the rating scales in any statistical manner. The ratings do not take the place of rigorous scientific assessment. Principle assumptions and weaknesses in the approach are used to assess, and comment on, the reliability of each indicator. Recommendations for further work and analysis are listed at the end of this report.
1 A full list of references is provided for each indicator.
Gippsland Lakes Report Card Gippsland Lakes and Catchments Task Force
Page | 3
2. Water Quality
Good (B): 62% of water quality parameters meet guidelines
2.1 Importance The water quality of the Gippsland Lakes is a critical determinant of other aspects of ecological health including: seagrass, fish, wetlands, birds and algae. It is also vitally important for recreation, tourism and other commercial uses of the Lakes and is a major factor in making the lakes environs such a pleasant place to live.
2.2 Rating scheme
Water quality in the Gippsland Lakes is monitored by the EPA at 5 fixed sites and there is an additional site in Lake Wellington (at Bull Bay) where salinity is monitored. Guidelines for various water quality parameters are available from the State Environmental Protection Policy (SEPP) and the ANZECC Water Quality Guidelines. Sixty two per cent of water quality guidelines were met across Lake Wellington, Lake Victoria and Lake King, therefore, water quality is rated as good (B).
2.3 Evidence to support rating Water quality parameters monitored in the Gippsland Lakes include:
• Chlorophyll a • Dissolved Oxygen • pH • Salinity • Total Nitrogen • Total Phosphorus
Some, or all, of these parameters are measured at sites in each of the main lakes (Table 3) and there is a historical record of data dating back to 1986. Site locations are shown on Figure 1.
A B C D E Excellent Good Moderate Poor Very poor
>80% of water quality parameters
meet guidelines
60%-80% of water quality
parameters meet guidelines
40%-60% of water quality parameters
meet guidelines
20%-40% of water quality parameters
meet guidelines
<20% of water quality parameters
meet guidelines
Gippsland Lakes Report Card Gippsland Lakes and Catchments Task Force
Page | 4
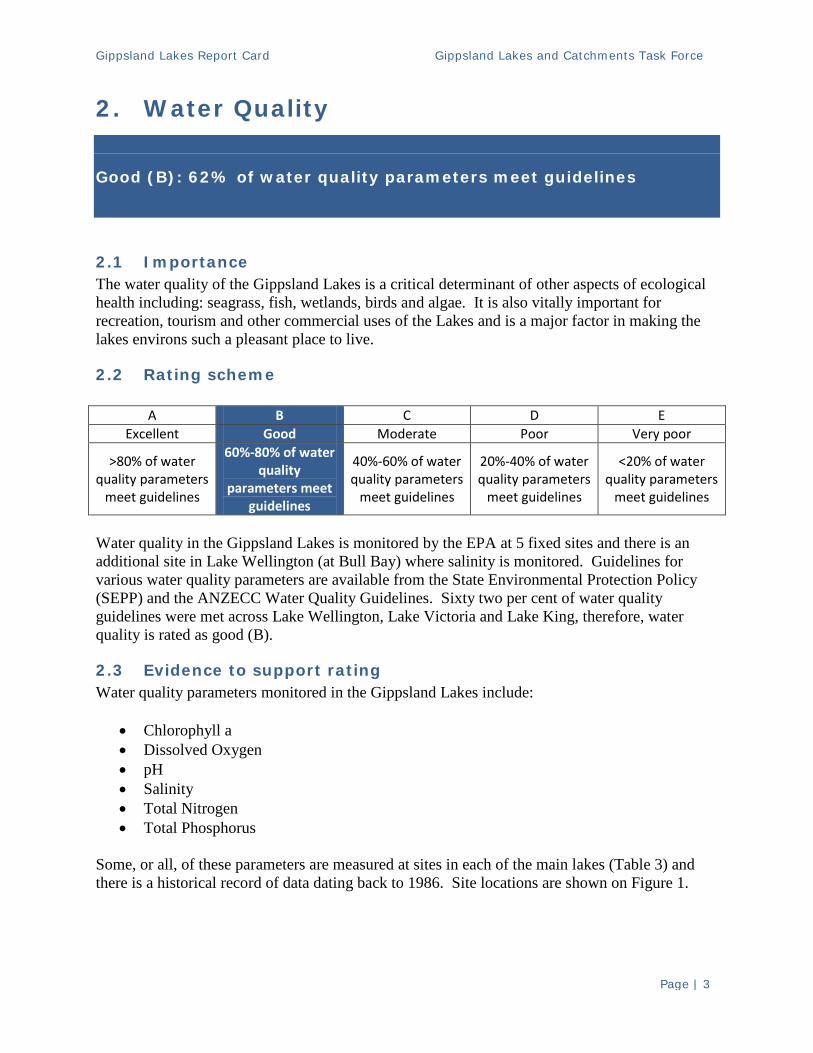
Table 3: Location of water quality monitoring sites
Site Code Site Name Lake
226041 Lake Wellington at Bull Bay1 Wellington
002306 Lake Wellington at Wooden Pile off Tucker Point2 Wellington
002311 Lake Victoria in deep water channel off Loch Sport Victoria
002314 Lake King in Channel off Point Scott Victoria
002316 Lake King Midway between Pt Dawson and Pt King King
002322 Lake King in channel off shaving point King 1 – The Bull Bay site (No. 226041) records a more limited range of data compared to the other sites with only salinity measurements used for this assessment. 2 – For details of the EPA sites see Stephens and Biggins (2004).
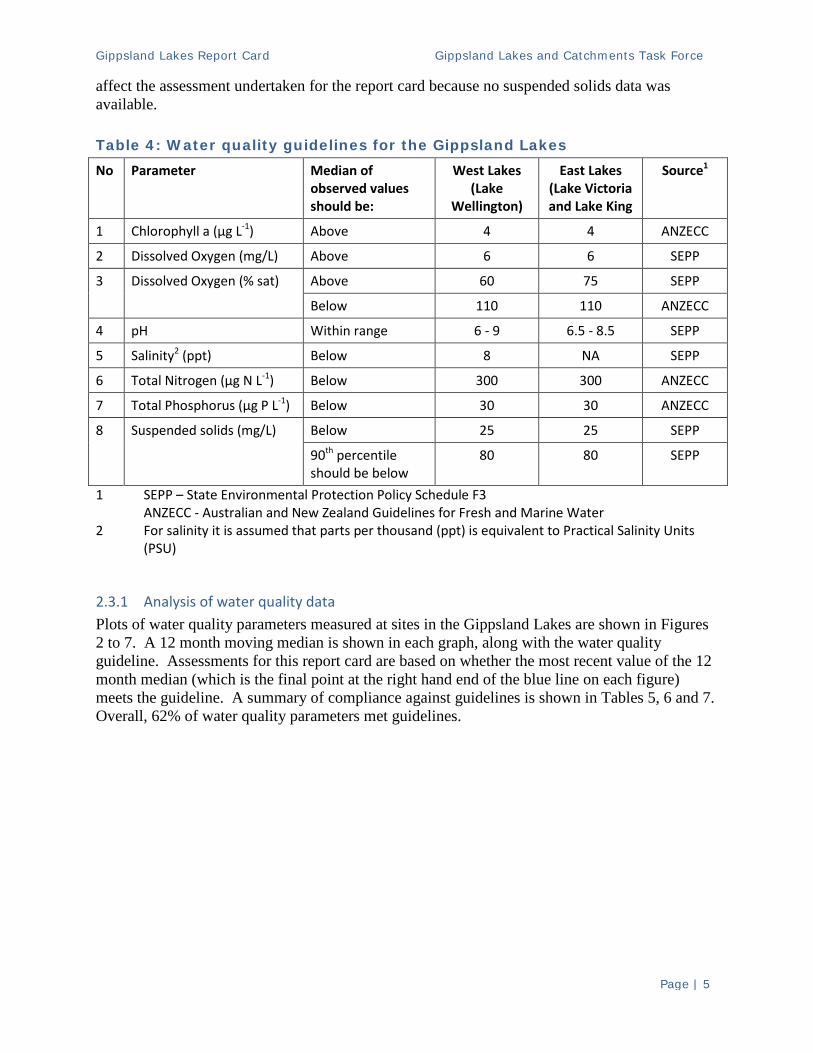
Figure 1: Location of water quality monitoring sites Guidelines for these water quality parameters have been obtained from Schedule F3 of the State Environment Protection Policy (SEPP) along with trigger levels from ANZECC guidelines as listed in Table 4. These guidelines identify a level of risk that warrants investigation; they do not necessarily imply that there is a severe water quality problem. Note that the ANZECC trigger levels are taken from the generic guidelines for estuaries in SE Australia; they have not been developed specifically for the Gippsland lakes. For all but one water quality parameter, compliance with guidelines is based on comparison with the median of water quality observations. The exception is Suspended Solids where a comparison is also made with the 90th percentile of the observed data. In practice this does not
Gippsland Lakes Report Card Gippsland Lakes and Catchments Task Force
Page | 5
affect the assessment undertaken for the report card because no suspended solids data was available. Table 4: Water quality guidelines for the Gippsland Lakes No Parameter Median of
observed values should be:
West Lakes (Lake
Wellington)
East Lakes (Lake Victoria and Lake King
Source1
1 Chlorophyll a (µg L-1) Above 4 4 ANZECC
2 Dissolved Oxygen (mg/L) Above 6 6 SEPP
3 Dissolved Oxygen (% sat) Above 60 75 SEPP
Below 110 110 ANZECC
4 pH Within range 6 - 9 6.5 - 8.5 SEPP
5 Salinity2 (ppt) Below 8 NA SEPP
6 Total Nitrogen (µg N L-1) Below 300 300 ANZECC
7 Total Phosphorus (µg P L-1) Below 30 30 ANZECC
8 Suspended solids (mg/L) Below 25 25 SEPP
90th percentile should be below
80 80 SEPP
1 SEPP – State Environmental Protection Policy Schedule F3 ANZECC - Australian and New Zealand Guidelines for Fresh and Marine Water 2 For salinity it is assumed that parts per thousand (ppt) is equivalent to Practical Salinity Units
(PSU)
2.3.1 Analysis of water quality data Plots of water quality parameters measured at sites in the Gippsland Lakes are shown in Figures 2 to 7. A 12 month moving median is shown in each graph, along with the water quality guideline. Assessments for this report card are based on whether the most recent value of the 12 month median (which is the final point at the right hand end of the blue line on each figure) meets the guideline. A summary of compliance against guidelines is shown in Tables 5, 6 and 7. Overall, 62% of water quality parameters met guidelines.

Gippsland Lakes Report Card Gippsland Lakes and Catchments Task Force
Page | 6
Figure 2: Water quality data for ‘Lake Wellington at Wooden Pile off Tucker Point’ (No. 002306), Mar 1986 – Nov 2010. (1) Chlorophyll a, (2) Dissolved Oxygen (mg/L), (3) Dissolved Oxygen (% saturation), (4) pH, (5) Salinity (PSU), (6) Total Nitrogen (µg/L), (7) Total Phosphorus (µg/L). Water quality guidelines are shown as dashed lines.

Gippsland Lakes Report Card Gippsland Lakes and Catchments Task Force
Page | 7
Figure 3: Salinity in Lake Wellington (Lake Wellington at Bull Bay, Site No. 226041) showing observations, running 12 month median and water quality guideline from SEPP schedule F3.
Gippsland Lakes Report Card Gippsland Lakes and Catchments Task Force
Page | 8
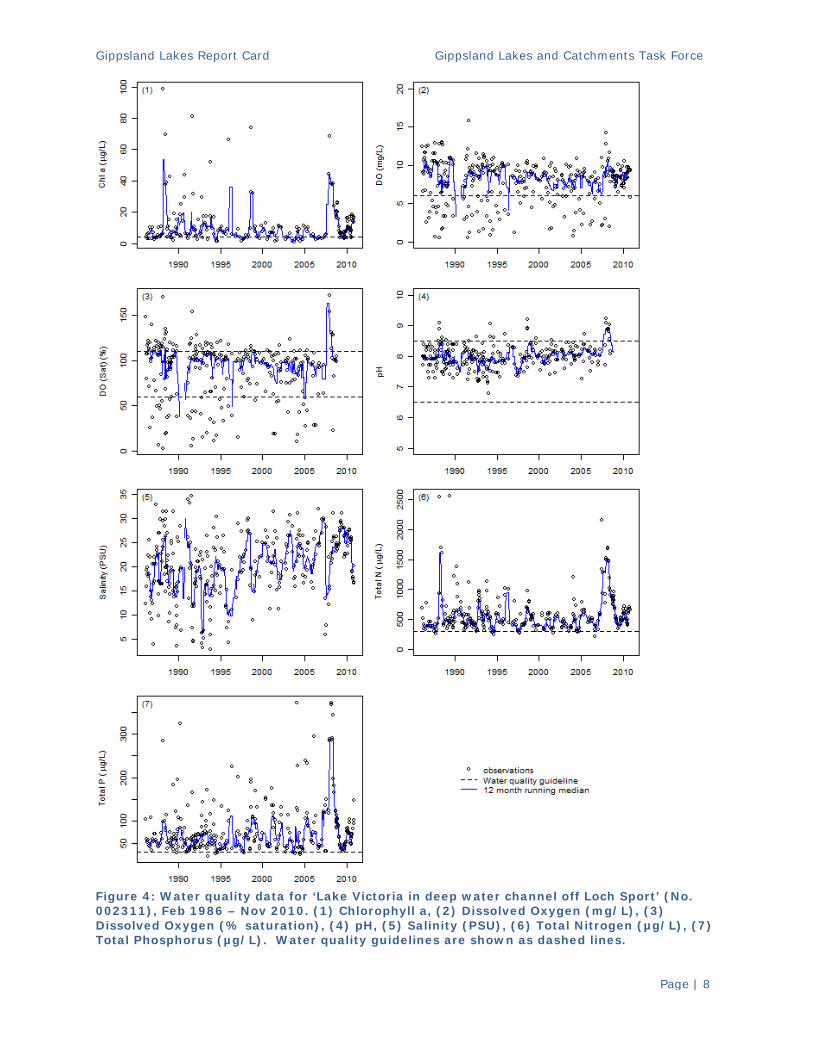
Figure 4: Water quality data for ‘Lake Victoria in deep water channel off Loch Sport’ (No. 002311), Feb 1986 – Nov 2010. (1) Chlorophyll a, (2) Dissolved Oxygen (mg/L), (3) Dissolved Oxygen (% saturation), (4) pH, (5) Salinity (PSU), (6) Total Nitrogen (µg/L), (7) Total Phosphorus (µg/L). Water quality guidelines are shown as dashed lines.

Gippsland Lakes Report Card Gippsland Lakes and Catchments Task Force
Page | 9
Figure 5: Water quality data for ‘Lake King in channel off Shaving Point’ (No. 002322), Feb 1986 – Nov 2010. (1) Chlorophyll a, (2) Dissolved Oxygen (mg/L), (3) Dissolved Oxygen (% saturation), (4) pH, (5) Salinity (PSU), (6) Total Nitrogen (µg/L), (7) Total Phosphorus (µg/L). Water quality guidelines are shown as dashed lines.
Gippsland Lakes Report Card Gippsland Lakes and Catchments Task Force
Page | 10
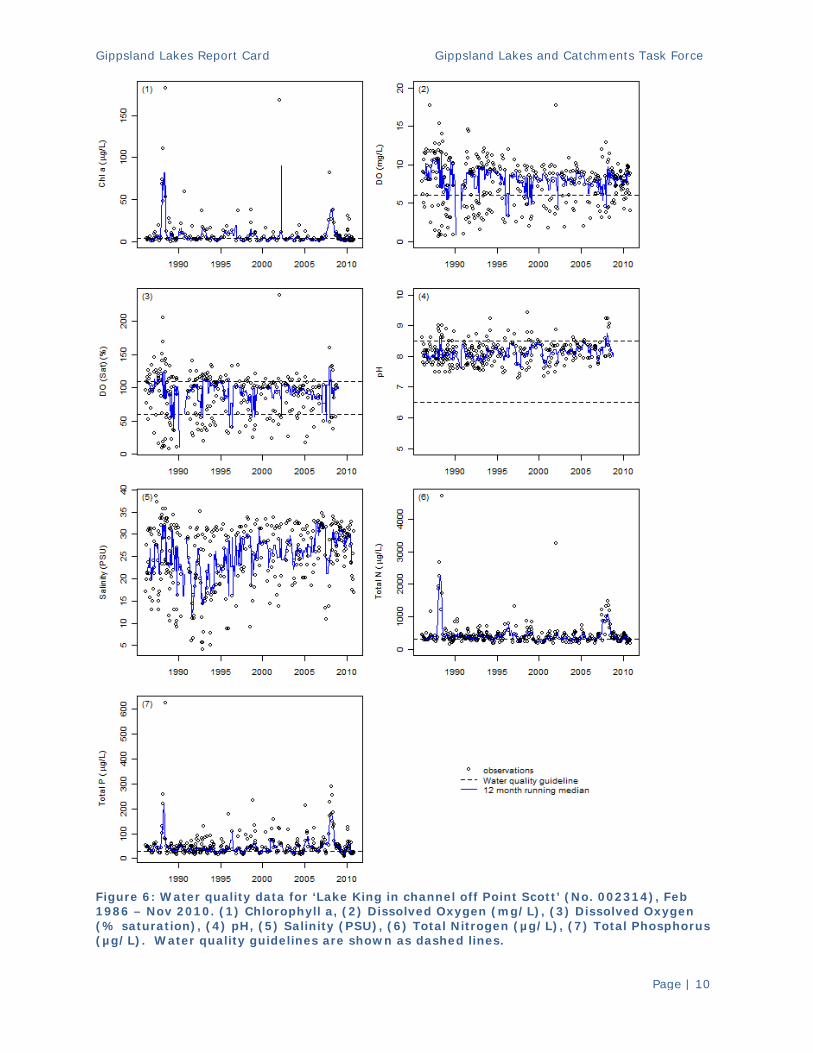
Figure 6: Water quality data for ‘Lake King in channel off Point Scott’ (No. 002314), Feb 1986 – Nov 2010. (1) Chlorophyll a, (2) Dissolved Oxygen (mg/L), (3) Dissolved Oxygen (% saturation), (4) pH, (5) Salinity (PSU), (6) Total Nitrogen (µg/L), (7) Total Phosphorus (µg/L). Water quality guidelines are shown as dashed lines.

Gippsland Lakes Report Card Gippsland Lakes and Catchments Task Force
Page | 11
Figure 7: Water quality data for ‘Lake King midway between Point Dawson and Point King’ (No. 002316), Feb 1986 – Nov 2010. (1) Chlorophyll a, (2) Dissolved Oxygen (mg/L), (3) Dissolved Oxygen (% saturation), (4) pH, (5) Salinity (PSU), (6) Total Nitrogen (µg/L), (7) Total Phosphorus (µg/L). Water quality guidelines are shown as dashed lines.
Gippsland Lakes Report Card Gippsland Lakes and Catchments Task Force
Page | 12
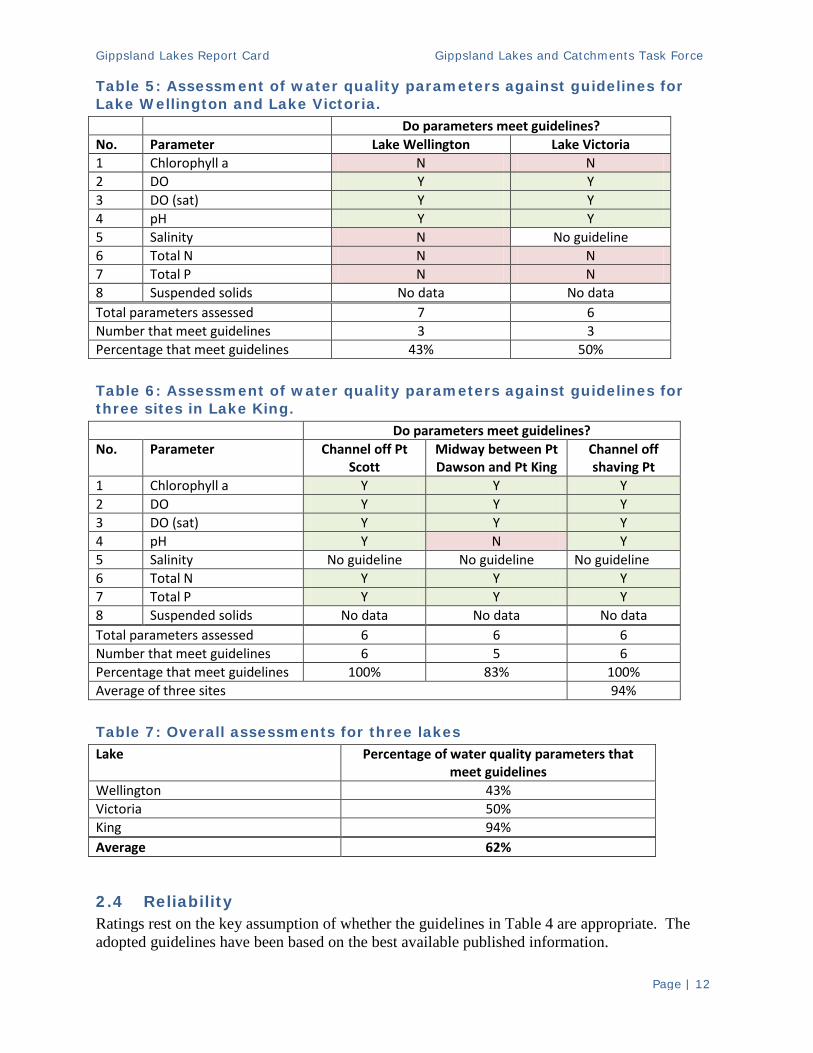
Table 5: Assessment of water quality parameters against guidelines for Lake Wellington and Lake Victoria. Do parameters meet guidelines? No. Parameter Lake Wellington Lake Victoria 1 Chlorophyll a N N 2 DO Y Y 3 DO (sat) Y Y 4 pH Y Y 5 Salinity N No guideline 6 Total N N N 7 Total P N N 8 Suspended solids No data No data Total parameters assessed 7 6 Number that meet guidelines 3 3 Percentage that meet guidelines 43% 50% Table 6: Assessment of water quality parameters against guidelines for three sites in Lake King. Do parameters meet guidelines? No. Parameter Channel off Pt
Scott Midway between Pt Dawson and Pt King
Channel off shaving Pt
1 Chlorophyll a Y Y Y 2 DO Y Y Y 3 DO (sat) Y Y Y 4 pH Y N Y 5 Salinity No guideline No guideline No guideline 6 Total N Y Y Y 7 Total P Y Y Y 8 Suspended solids No data No data No data Total parameters assessed 6 6 6 Number that meet guidelines 6 5 6 Percentage that meet guidelines 100% 83% 100% Average of three sites 94% Table 7: Overall assessments for three lakes Lake Percentage of water quality parameters that
meet guidelines Wellington 43% Victoria 50% King 94% Average 62%
2.4 Reliability Ratings rest on the key assumption of whether the guidelines in Table 4 are appropriate. The adopted guidelines have been based on the best available published information.

Gippsland Lakes Report Card Gippsland Lakes and Catchments Task Force
Page | 13
2.5 References ANZECC (2000) Australian and New Zealand Guidelines for Fresh and Marine Water Quality. Australian and New Zealand Environment and Conservation Council. Agriculture and Resource Management Council of Australia and New Zealand. Schedule F3 of the State Environment Protection Policy Waters of Victoria. http://www.epa.vic.gov.au/about_us/legislation/docs/gazzette-s13.pdf Stephens, A. and Biggins, N. (2004) Algal bloom dynamics in the estuarine Gippsland Lakes. Publication SR4. EPA Marine Sciences Unit.

Gippsland Lakes Report Card Gippsland Lakes and Catchments Task Force
Page | 14
3. Algal Blooms
Moderate (C): Minor algal bloom, little economic impact
3.1 Importance Average annual costs of algal blooms in the Gippsland Lakes have been estimated as at least $9 million (2011 dollars) (URS, 2004)2. In addition to this, there are impacts of algal blooms that include:
• Decreased image of the area as a tourist destination or place to live • Increased risk to human health • Decreased commercial fish and seafood production
Issues associated with algal blooms have been the major justification for funding of nutrient reduction activities in the Gippsland Lakes Catchment over the past decade.
3.2 Rating scheme
3.3 Evidence to support rating Algal blooms are likely under certain physical and chemical conditions3:
1. Water is not too saline (the most common blue-green alga is Nodularia spumigena which is not tolerant of high salinities).
2. Low levels of dissolved inorganic nitrogen in the water column (some cyanobacteria can fix their own nitrogen, so are advantaged by low levels of nitrogen in water).
3. High concentrations of reactive phosphorus in surface waters (phosphorus, combined with N fixed by the cyanobacteria, provide potential for growth).
2 Impacts have been converted from 2004 dollars to 2011 dollars using Consumer Price Index (CPI) rates. http://www.ato.gov.au/v/content/1566.htm 3 This section is a summary based on work by Cook et al. (2010).
A B C D E Excellent Good Moderate Poor Very poor
No bloom and low risk of a bloom
Risk of a bloom but a bloom did
not occur
Minor bloom, little economic impact
Short duration bloom, minor
economic impacts
Large, persistent bloom with high
economic impacts

Gippsland Lakes Report Card Gippsland Lakes and Catchments Task Force
Page | 15
Specific physicochemical criteria suggest that a Nodularia bloom is likely where:
1. Salinity < 20 (PSU) 2. DIN < 0.5 µM 3. DIN/SRP < 5
Where: PSU – Practical Salinity Unit (approximately equal to parts per thousand, ppt) DIN – Dissolved inorganic nitrogen concentration SRP – Soluble reactive phosphorus concentration
In addition, they are favoured by warm water (>17oC) (which occurs every summer in the Gippsland Lakes) and stratified conditions. Surface salinity in the Gippsland Lakes is often higher than 20 PSU and there is an important relationship between freshwater inflows and bloom occurrence. High freshwater inflows reduce surface salinity providing one of the conditions required for a bloom. Blooms have not been observed where annual inflows are < 1600 GL. Where there are higher concentrations of inorganic nitrogen, other taxa of cyanobacteria may be favoured over Nodularia. For lower salinity conditions, S ~ 5 PSU, Microcystis blooms may occur, while under higher salinity S > 17, (and high N concentrations) Synechococcus may bloom. These taxa have smaller cell sizes and can grow at twice the rate of Nodularia. There was a Synechococcus bloom that followed the high N loads that were contributed to the lakes by the 2007 floods. The amount of phosphorus in lake water provides an important control over the magnitude of blooms but this is only indirectly related to loads of phosphorus from the catchment. Phosphorus can be released from sediments which have been enriched by high P loads over several years. This explains the occurrence of blooms in some years when there have been only moderate catchment inputs (e.g. 1987-1988). There were extremely large P inputs following fires and flooding in the Gippsland Lakes Catchment in 2007. It is likely that much of this P remains in lake sediments. Various alert levels for algal blooms are specified in the Guidelines for managing risks in recreational water NHMRC (2008) but if monitoring shows >2,000 cells/mL or biovolumes > 0.2 mm3L-1 this is of concern in the Gippsland Lakes. There is regular monitoring of lake conditions including salinity, phosphorus, nitrogen, chlorophyll and algal cell counts. The key monitoring site is Lake King South, which is near the SE tip of Raymond Island where monitoring is undertaken by the Water Studies Centre, Monash University. In addition, there is monitoring by the EPA (EPA, 2009).
3.3.1 Conditions in 2010 In late summer 2010, the physicochemical conditions for an algal bloom occurred as measured in Lake King South. Algal biovolumes above 0.2 mm3L-1 were measured at 3 locations to the southeast, northwest and north of Raymond Island. The highest recorded biovolume was 0.79
Gippsland Lakes Report Card Gippsland Lakes and Catchments Task Force
Page | 16
mm3L-1 between the Mitchell River Silt Jetties and Raymond Island. This is in the range of an Amber Level Alert as specified by Guidelines for managing risks in recreational water. Fortunately, temperatures during February and March were cooler than normal with no days above 35oC and only a few days above 30oC. These temperatures, and the prevailing wind conditions, meant stratification of the Lakes was less strong and persistent than usual so there was not an economically significant bloom (Holland et al., 2011).
3.4 Reliability Recent research in the Lakes by Cook and others, which has been subject to peer review (see reference list), and monitoring by the Water Studies Centre and the EPA, suggest that conditions that lead to algal blooms are now becoming understood. Outstanding research questions are discussed by Holland et al., (2011). It is likely there are high phosphorus loads available in lake sediments following the very large inputs from 2007. This means that if the right physical conditions occur, then a bloom is likely. As noted above, the initial predisposition for a bloom occurs with high freshwater inflows during winter to reduce surface salinity and import additional nutrients. A bloom also depends on specific temperature and wind conditions occurring, but in most summers these conditions will occur. The nutrient reduction works being undertaken in the Gippsland Lakes catchments have the potential to decrease bloom frequency in the long term.
3.5 References Cook, P. (2010) Analysis of flows and nutrient loads to the Gippsland Lakes June 2008-May 2009. A report prepared for the Gippsland Lakes Taskforce March 2010.
Cook, P. L. M. and D. P. Holland (in press) Long term nutrient loads and chlorophyll dynamics in a large temperate Australian lagoon system affected by recurring blooms of cyanobacteria. Biogeochemistry.
Cook, P. L. M., D. P. Holland and A. R. Longmore (2010). Effect of a flood event on the dynamics of phytoplankton and biogeochemistry in a large temperature Australian lagoon. Limnol. Oceanogr. 55(3): 1123-1133.
EPA (2009) Gippsland Lakes Blue-Green Algae monitoring program July-December 2008. Environment Report. Environment Protection Authority, Victoria.
Holland, D. Cook, P., Beardall, J. and Longmore, A. (2010) Nutrient cycling and phytoplankton population dynamics in the Gippsland Lakes. Gippsland Lakes and Catchments Taskforce.
Holland, D., Cook, P. and Beardall, J. (2011) Targeted monitoring of algal bloom potential in the Gippsland Lakes. Monash University Water Studies Centre for Gippsland Lakes and Catchments Task Force.
National Health and Medical Research Council (2008) Guidelines for managing risks in recreational water. http://www.nhmrc.gov.au/_files_nhmrc/file/publications/synopses/eh38.pdf
Gippsland Lakes Report Card Gippsland Lakes and Catchments Task Force
Page | 17
4. Wetlands
Good (B): Average Index of Wetland Condition rating of 7-8
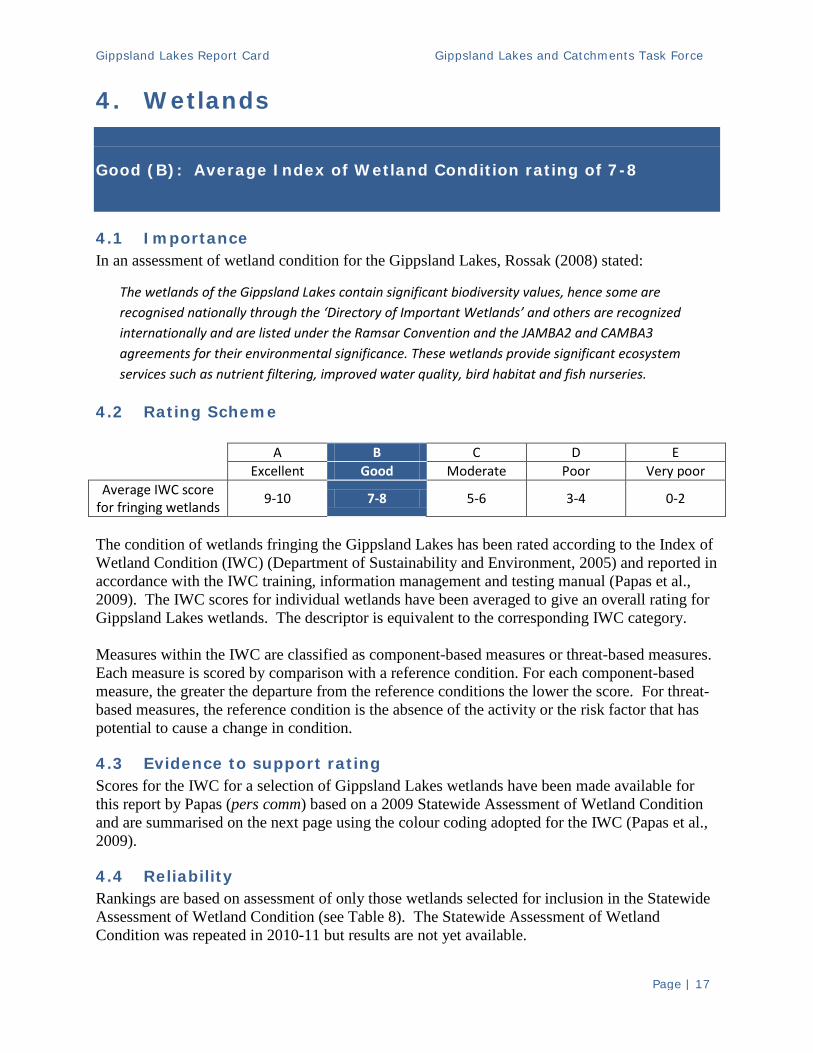
4.1 Importance In an assessment of wetland condition for the Gippsland Lakes, Rossak (2008) stated:
The wetlands of the Gippsland Lakes contain significant biodiversity values, hence some are recognised nationally through the ‘Directory of Important Wetlands’ and others are recognized internationally and are listed under the Ramsar Convention and the JAMBA2 and CAMBA3 agreements for their environmental significance. These wetlands provide significant ecosystem services such as nutrient filtering, improved water quality, bird habitat and fish nurseries.
4.2 Rating Scheme
The condition of wetlands fringing the Gippsland Lakes has been rated according to the Index of Wetland Condition (IWC) (Department of Sustainability and Environment, 2005) and reported in accordance with the IWC training, information management and testing manual (Papas et al., 2009). The IWC scores for individual wetlands have been averaged to give an overall rating for Gippsland Lakes wetlands. The descriptor is equivalent to the corresponding IWC category. Measures within the IWC are classified as component-based measures or threat-based measures. Each measure is scored by comparison with a reference condition. For each component-based measure, the greater the departure from the reference conditions the lower the score. For threat-based measures, the reference condition is the absence of the activity or the risk factor that has potential to cause a change in condition.
4.3 Evidence to support rating Scores for the IWC for a selection of Gippsland Lakes wetlands have been made available for this report by Papas (pers comm) based on a 2009 Statewide Assessment of Wetland Condition and are summarised on the next page using the colour coding adopted for the IWC (Papas et al., 2009).
4.4 Reliability Rankings are based on assessment of only those wetlands selected for inclusion in the Statewide Assessment of Wetland Condition (see Table 8). The Statewide Assessment of Wetland Condition was repeated in 2010-11 but results are not yet available.
A B C D E Excellent Good Moderate Poor Very poor
Average IWC score for fringing wetlands 9-10 7-8 5-6 3-4 0-2

Gippsland Lakes Report Card Gippsland Lakes and Catchments Task Force
DRAFT Page | 18
Table 8: Index of Wetland Condition Scores for a selection of Gippsland Lakes wetlands based on a 2009 statewide assessment of wetland condition using the colour coding adopted for the IWC (Papas et al., 2009)
Wetland name Sub-indices Index of
Wetland Condition1
Wetland catchment Physical Form Hydrology Water
Properties Soils Biota
McLeod Morass Moderate Excellent Excellent Good Excellent Poor Good
Deep Water Morass Poor Poor Moderate Excellent Poor Moderate Moderate
Lindenow Wildlife Sanctuary Poor Good Moderate Excellent Moderate Very Poor Moderate
Sale Common Moderate Excellent Very Poor Excellent Moderate Moderate Moderate
Clydebank Morass (South) Poor Excellent Excellent Excellent Excellent Good Good
Red Morass Very Poor Excellent Excellent Very Poor Very Poor Poor Moderate
Heart Morass/'The Heart Area' Good Excellent Very Poor Excellent Excellent Excellent Good
Billabong Reserve Excellent Excellent Excellent Excellent Excellent Good Excellent
Dowd Morass Moderate Excellent Very Poor Excellent Excellent Poor Moderate
Lake Morley/'Morley Swamp' Excellent Excellent Excellent Good Excellent Moderate Good
Victoria Lagoon Good Excellent Excellent Moderate Excellent Excellent Good 1 IWC scores: Very Poor (0-2), Poor (3-4), Moderate (5-6), Good (7-8), Excellent (9-10)

Gippsland Lakes Report Card Gippsland Lakes and Catchments Task Force
Page | 19
4.5 References Department of Sustainability and Environment, Victoria (2005) Index of Wetland Condition. Conceptual framework and selection of measures. Papas, P, S. Lyon, J. Holmes and D. Ramsey (2009) Index of Wetland Condition training, information management and testing. Department of Sustainability and Environment, Victoria. Rossack, B (2008) Gippsland Lakes Index of Wetland Condition. Department of Sustainability and Environment, Victoria. http://www.dse.vic.gov.au/conservation-and-environment/index-of-wetland-condition Accessed May 30, 2010.

Gippsland Lakes Report Card Gippsland Lakes and Catchments Task Force
Page | 20
5. Birds
Moderate (C): Some decreases in abundance and diversity but Ramsar criteria continue to be met
5.1 Importance The Gippsland Lakes is a wetland of international importance, particularly as water bird habitat. Forty eight species of notable or important waterbirds have been identified in the Gippsland Lakes and it has been listed under the Ramsar Convention since 1982. The Gippsland Lakes supports 1% or more of global populations of 7 bird species: Black Swan, Chestnut Teal, Eurasian Coot, Fairy Tern, Little Tern, Musk Duck and Pacific Gull (BMT WBM, 2009). The Gippsland Lakes regularly support 20,000 or more water birds and there are substantial numbers of waterbirds from particular groups. Abundant water birds (and numbers recorded seasonally) include, or have included: Grey Teal (7,270); Chestnut Teal (6,300); Black Swans (>20,000); Australasian Coot (13,000); Eurasian Coot (13,000) and Great Cormorants (7400) (Ecos, 2008). The Gippsland Lakes is noted as an important drought refuge for birds and supports important life cycle stages by providing breeding, roosting and feeding sites. The Gippsland Lakes supports species of conservation significance including the Australian Bittern and Painted Snipe, which are listed as threatened. It is also important for migratory water birds, many of which are declining world-wide.
5.2 Rating scheme
Ratings are based on whether the Gippsland Lakes continue to meet Ramsar criteria, whether populations of rare and threatened birds are maintained and whether overall abundance and diversity of bird species are declining, stable or increasing.
A B C D E Excellent Good Moderate Poor Very poor
Abundance and diversity
constant or increasing
Ramsar listing criteria met and species diversity
maintained
Ramsar listing criteria met.
Some decrease in abundance and diversity
Declining abundance and
diversity. Ramsar listing
threatened
Loss or Ramsar attributes
Gippsland Lakes Report Card Gippsland Lakes and Catchments Task Force
Page | 21
5.3 Evidence to support rating Evidence for this rating is as follows.
1. Ramsar criteria continue to be met
Recent assessments of the ecological character of the Gippsland Lakes Ramsar site suggest that the Ramsar criteria continue to be met (BMT WBM, 2009; Ecos, 2008). There is however a paucity of data which makes the assessment uncertain. 2. Total bird abundance seems to have declined
The Gippsland Lakes Ramsar site was reported to regularly support 40,000 to 50,000 water birds at the time of listing in 1982. Counts are now much lower and have been lower since the early 1990s (WBM BMT, 2009). 3. There has been substantial decline in some bird taxa
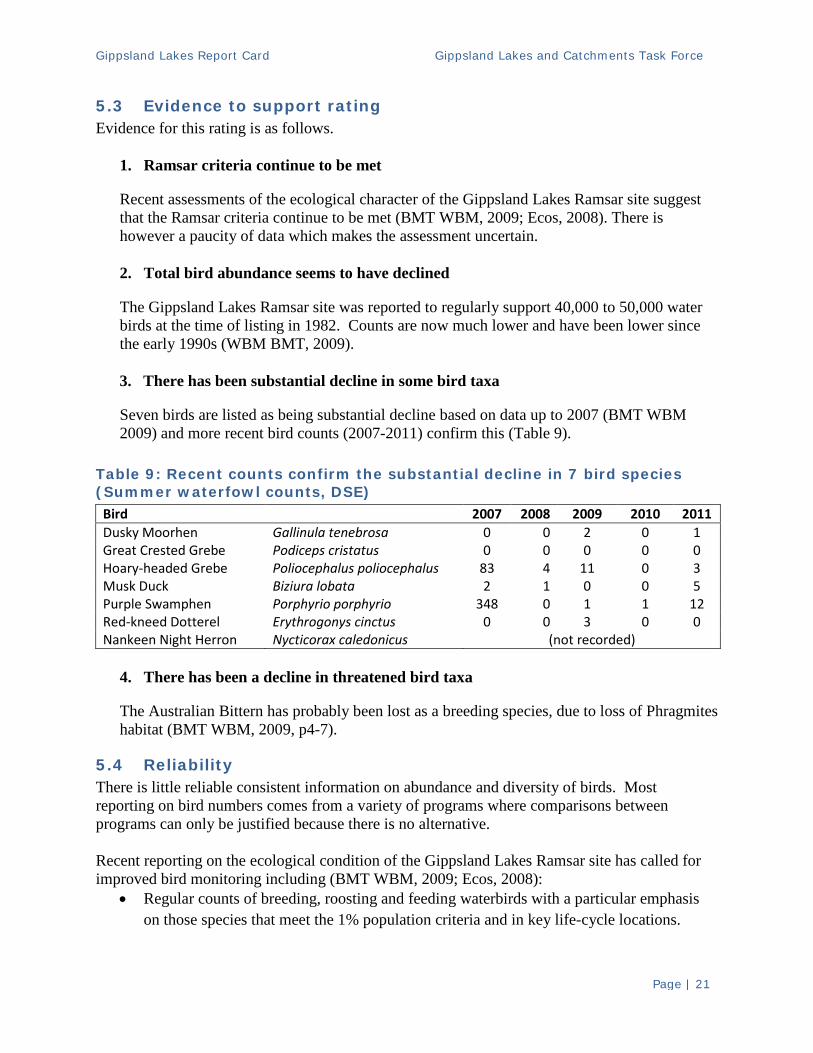
Seven birds are listed as being substantial decline based on data up to 2007 (BMT WBM 2009) and more recent bird counts (2007-2011) confirm this (Table 9).
Table 9: Recent counts confirm the substantial decline in 7 bird species (Summer waterfowl counts, DSE)
Bird 2007 2008 2009 2010 2011 Dusky Moorhen Gallinula tenebrosa 0 0 2 0 1 Great Crested Grebe Podiceps cristatus 0 0 0 0 0 Hoary-headed Grebe Poliocephalus poliocephalus 83 4 11 0 3 Musk Duck Biziura lobata 2 1 0 0 5 Purple Swamphen Porphyrio porphyrio 348 0 1 1 12 Red-kneed Dotterel Erythrogonys cinctus 0 0 3 0 0 Nankeen Night Herron Nycticorax caledonicus (not recorded)
4. There has been a decline in threatened bird taxa
The Australian Bittern has probably been lost as a breeding species, due to loss of Phragmites habitat (BMT WBM, 2009, p4-7).
5.4 Reliability There is little reliable consistent information on abundance and diversity of birds. Most reporting on bird numbers comes from a variety of programs where comparisons between programs can only be justified because there is no alternative. Recent reporting on the ecological condition of the Gippsland Lakes Ramsar site has called for improved bird monitoring including (BMT WBM, 2009; Ecos, 2008):
• Regular counts of breeding, roosting and feeding waterbirds with a particular emphasis on those species that meet the 1% population criteria and in key life-cycle locations.
Gippsland Lakes Report Card Gippsland Lakes and Catchments Task Force
Page | 22
• Detailed and frequent surveys of threatened species including Australian Bittern and Painted Snipe, to assess changes to populations and loss of key habitat areas.
• Regular surveys of waterbird usage during key visitation periods. In particular, monitoring abundance of the ‘1% species’ that are important for the Ramsar ecological character.
5.5 References BMT WBM (2009) Ecological character description for the Gippsland Lakes Ramsar Site Final Draft. Department of Sustainability and Environment. Department of the Environment Water, Heritage and the Arts.
Ecos (2008) Gippsland Lakes Ecological Character Description Vol 1. West Gippsland Catchment Management Authority

Gippsland Lakes Report Card Gippsland Lakes and Catchments Task Force
Page | 23
6. Seagrass
Moderate (C): No change in density or extent of seagrass cover
6.1 Importance In their mapping of seagrass in the Gippsland Lakes for the Victorian Marine Habitat Database, Roob and Ball (1997, p i) stated:
The Lakes feature extensive seagrass meadows which are an ecologically significant marine habitat, serving as a nursery area for juvenile marine fauna as well as providing food and shelter.
6.2 Rating Scheme
We have represented overall seagrass condition in the Lakes by a combination of seagrass density and extent where density refers to the amount of healthy seagrass per unit area of lake bed and extent refers to the occurrence of seagrass throughout the Lakes system. In the current Lakes environment, there is no absolute measure of seagrass density and extent to use as a reference template. Rather, the rating that we have used here is based on a qualitative measure of the change in seagrass density and extent through time. This interim approach implies that ‘more seagrass is better, the denser the seagrass cover the better’. This is an approximation that is reasonable to apply to the Gippsland Lakes in the current state but cannot be taken as a general rule and does not apply in highly eutrophic estuaries where high levels of seagrass density and extent can be undesirable. This indictor would be improved by the development of a clearer reference state for seagrass density and extent, as discussed at the end of this report.
6.3 Evidence to support rating Evidence is available to support assessments of changes in the density of seagrass but a lack of large scale repeat surveys makes assessment of changes in seagrass extent uncertain. Boob and Ball (1997) assessed the spatial distribution of seagrass and used historical aerial photographs to assess changes. Warry and Hindell (2011) surveyed seagrass in Sep 2008, Apr 2009, Apr 2010 and Apr 2011. The latter three surveys repeated video transects at 50 sites. Hindell and Warry report seagrass ‘condition’ based mainly on density of seagrass observed in the video transects.
A B C D E Excellent Good Moderate Poor Very poor
Increase in density and extent
Increase in density or extent
No change in density or extent of seagrass cover
Decrease in density or extent
Decrease in density and extent
Gippsland Lakes Report Card Gippsland Lakes and Catchments Task Force
Page | 24
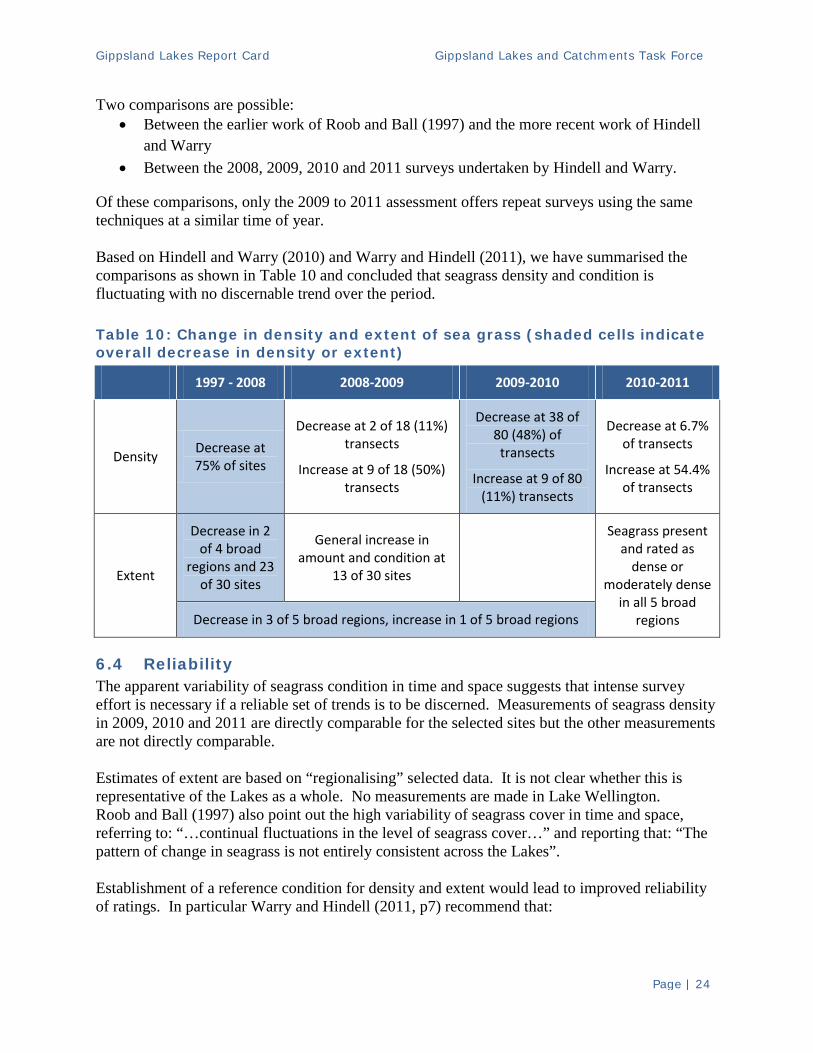
Two comparisons are possible: • Between the earlier work of Roob and Ball (1997) and the more recent work of Hindell
and Warry • Between the 2008, 2009, 2010 and 2011 surveys undertaken by Hindell and Warry.
Of these comparisons, only the 2009 to 2011 assessment offers repeat surveys using the same techniques at a similar time of year. Based on Hindell and Warry (2010) and Warry and Hindell (2011), we have summarised the comparisons as shown in Table 10 and concluded that seagrass density and condition is fluctuating with no discernable trend over the period. Table 10: Change in density and extent of sea grass (shaded cells indicate overall decrease in density or extent)
1997 - 2008 2008-2009 2009-2010 2010-2011
Density Decrease at 75% of sites
Decrease at 2 of 18 (11%) transects
Increase at 9 of 18 (50%) transects
Decrease at 38 of 80 (48%) of transects
Increase at 9 of 80 (11%) transects
Decrease at 6.7% of transects
Increase at 54.4% of transects
Extent
Decrease in 2 of 4 broad
regions and 23 of 30 sites
General increase in amount and condition at
13 of 30 sites
Seagrass present and rated as
dense or moderately dense
in all 5 broad regions Decrease in 3 of 5 broad regions, increase in 1 of 5 broad regions
6.4 Reliability The apparent variability of seagrass condition in time and space suggests that intense survey effort is necessary if a reliable set of trends is to be discerned. Measurements of seagrass density in 2009, 2010 and 2011 are directly comparable for the selected sites but the other measurements are not directly comparable. Estimates of extent are based on “regionalising” selected data. It is not clear whether this is representative of the Lakes as a whole. No measurements are made in Lake Wellington. Roob and Ball (1997) also point out the high variability of seagrass cover in time and space, referring to: “…continual fluctuations in the level of seagrass cover…” and reporting that: “The pattern of change in seagrass is not entirely consistent across the Lakes”. Establishment of a reference condition for density and extent would lead to improved reliability of ratings. In particular Warry and Hindell (2011, p7) recommend that:
Gippsland Lakes Report Card Gippsland Lakes and Catchments Task Force
Page | 25
…quantification of areal extent and physical structure would facilitate direct comparison of seagrass condition in 2011 with that recorded in 1997, when extensive quantitative mapping was last conducted (see Roob and Ball 1997).
6.5 References Hindell, J.S. and Warry F.Y. (2010) Fish assemblages and seagrass condition of the Gippsland Lakes: 2008 to 2010. Arthur Rylah Institute for Environmental Research. Department of Sustainability and Environment, Heidelberg, Victoria.
Roob, R. and Ball, D. (1997) Victorian Marine Habitat Database: Gippsland Lakes Seagrass Mapping. Marine and Freshwater Resources Institute. (Marine and Freshwater Resources Institute: Queenscliff), November 1997.
Warry F.Y. and Hindell, J.S. (2011) Fish assemblages and seagrass condition of the Gippsland Lakes: 2008 to 2010. Arthur Rylah Institute for Environmental Research. Department of Sustainability and Environment, Heidelberg, Victoria.

Gippsland Lakes Report Card Gippsland Lakes and Catchments Task Force
Page | 26
7. Fish
Poor (D): Substantial decrease in abundance since 1990
7.1 Importance
7.1.1 Ecological importance The state of the fish populations is important for the health of the Gippsland Lakes because of their role in nutrient cycling and in the overall food web.
7.1.2 Economic importance In addition, the Gippsland Lakes is one of the most important bay and inlet fisheries in Victoria and contributes significantly to commercial and recreational fishing activities in the State (Ecos Consortium, 2009; DPI 2010). Based on data from DPI (2011), the average annual commercial value of the fishery over the last 5 years is $1.3 million. The consumer and producer surplus on black bream, an important commercial species, has been estimated at $25.05/kg or $10.20 per fish (Marsden Jacob Associates, 2007). Recreational fishing is also of major economic value. Recreational catches are similar in quantity to commercial catches (Ecos, 2009), supporting broad tourism and specific fishing-based tourism.
7.2 Rating Scheme
The condition of fish in the Gippsland Lakes is based on an assessment of abundance and diversity using the 1990s as a baseline. Our assessment of abundance is largely based on commercial catch data, while diversity is based on assessments undertaken by Hindell and Warry (2010) and Warry and Hindell (2011).
A B C D E Excellent Good Moderate Poor Very poor
Increase in abundance and diversity of fish
populations
Increase in abundance or
diversity of fish populations
No change in abundance or
diversity of fish populations
Decrease in abundance or
diversity of fish populations
Decrease in abundance and diversity of fish
populations
Gippsland Lakes Report Card Gippsland Lakes and Catchments Task Force
Page | 27
7.3 Evidence to support rating
7.3.1 Diversity Hindell and Warry (2011) report that the species diversity and fish densities sampled from Gippsland Lakes seagrass habitats are comparable to those sampled from seagrass in other parts of Victoria in recent years, including Port Phillip Bay and Corner Inlet. Overall, thirty species of fish were sampled in their 2011 assessment. This suggests that the fish diversity in the Gippsland Lakes remains high. However this is an interim assessment since pre-European reference conditions for fish are yet to be developed for Victoria’s estuaries. An Index of Estuarine Condition is currently under development and is likely to be useful for future assessments of fish condition (Warry and Hindell, 2011).
7.3.2 Abundance Commercial catch data (DPI, 2010) shows an ongoing decline in total catch since around 1993 from above 600 to below 200 tonnes per year (Figure 8). Commercial fishing effort has also been declining through retirements and license buy-backs but the catch rate remains at historically low levels (DPI, 2008). In addition, the commercial catch of individual species shows declines in most cases (Figure 9 A-Q). In particular there have been long terms declines in the catch of black bream, whitebait, silver trevally, luderick, yelloweye mullet and river garfish. Black bream are an important commercial species and have been assessed by DPI based on data from 3 sources: 1) commercial fisheries data, 2) recreational fisheries data and 3) fishery-independent data (Kemp et al., 2011). These data indicate that since 2002/03 the abundance of black bream in the Gippsland Lakes has been lower than in the 1990s and substantially lower than in the 1970s and 1980s. Catch per unit effort has also declined during this period (Jenkins et al., 2011). There was a temporary increase in commercial catches in 2007/08 but this is likely due to fish movement triggered by floods rather than an increase in abundance. Catch rates by recreational anglers have been low since 2002/03. Angler opinion suggests that the size of black bream has decreased with time and many believe there are now fewer fish (Conron et al., 2010).
7.4 Reliability The ranking relies on the following assumptions:
• That the diversity data from Warry and Hindell (2011) can be used to compare the Gippsland Lakes with other estuaries. Note that this assumption is an interim measure since reference conditions for fish diversity are yet to be developed.
• That the condition of fish stocks in the Lakes can be related to commercial catch data as representative of overall abundance of fish in the Lakes. In the case of black bream, a range of data support the conclusion that abundance has declined but similar data are not yet available for other species. DPI is reviewing the stock of other fish and additional information is likely to be available by the end of 2011.

Gippsland Lakes Report Card Gippsland Lakes and Catchments Task Force
Page | 28
Figure 8: Commercial catch for each major species caught in the Gippsland Lakes and Lake Tyers 1978/79-2009/2010 (excludes European Carp) (DPI, 2010)

Gippsland Lakes Report Card Gippsland Lakes and Catchments Task Force
Page | 29
A B
C D
E F

Gippsland Lakes Report Card Gippsland Lakes and Catchments Task Force
Page | 30
G H
I J
K L

Gippsland Lakes Report Card Gippsland Lakes and Catchments Task Force
Page | 31
Figure 9: Commercial catch time series for individual species (trend is based on locally weighted regression, shading shows standard error). Note that the y-axis scale varies.
M N
O P
Q

Gippsland Lakes Report Card Gippsland Lakes and Catchments Task Force
Page | 32
7.5 References Blair, S. L. (2009). Of droughts and flooding rains: local and institutional perceptions of environmental change in an Australian estuary. Human Organization 68: 18-26. BMT WBM (2009) Ecological Character Description for the Gippsland Lakes Ramsar Site. Report for Department of Sustainability and Environment, Victoria. Conron, S., Bridge, N. F., Stokie, T. K. (2010) Detecting the impacts of recent changes in fishing pressure of key recreational stocks in Mallacoota Inlet and Lake Tyers. Recreational Fishing Grant Program – Research report. Department of Primary Industries. http://www.new.dpi.vic.gov.au/fisheries/about-fisheries/publications-and-resources/fisheries-reports/your-licence-fees-at-work-reports/2010/detecting-the-impacts-of-recent-changes-in-fishing-pressure DPI (2008) Fisheries Status Report – 2008. Department of Primary Industries. http://new.dpi.vic.gov.au/fisheries/about-fisheries/publications-and-resources/fisheries-reports/fisheries-report-series/fisheries-status-report-2009 DPI (2010) Commercial fish production. Information bulletin, Oct 2010. http://new.dpi.vic.gov.au/fisheries/commercial-fishing/commercial-fish-production-2010 DPI (2011) http://new.dpi.vic.gov.au/fisheries/commercial-fishing/commercial-fish-production-2010/gippsland-lakes-lake-tyers-catch. Accessed 16/06/2011. Ecos Consortium (2009) Understanding the Environmental Water Requirements of the Gippsland Lakes System: Technical Report. Prepared for the West Gippsland Catchment Management Authority, Traralgon, Victoria. Hindell, J. S. and Warry, F. Y. (2010) Fish assemblages and seagrass condition of the Gippsland Lakes: 2008 to 2010. Arthur Rylah Institute for Environmental Research, Heidelberg, Victoria. Jenkins, G. P., S. D. Conron and A. K. Morison (2010). Highly variables recruitment in an estuarine fish is determined by salinity stratification and freshwater flow: implications of a changing climate. Marine Ecology Process Series 417: 249-261. Kemp, J. Ryan, K. L., Brown, L., Conron, S. Bruce, T. K., MacDonald, M. (2011) Gippsland Lakes Black Bream Stock Assessment 2009. Department of Primary Industries. Marsden Jacob Associates (2007) Victorian Bay and Inlet Fisheries Resource Allocation Valuation Study. Morison, A. K., P. C. Coutin and S. G. Roberts (1998). Age determination of black bream, Acanthopagrus butcheri (Sparidae), from the Gippsland Lakes of south-eastern Australia indicates slow growth and episodic recruitment. Marine and Freshwater Research 49: 491-498. Warry F.Y. and Hindell, J.S. (2011) Fish assemblages and seagrass condition of the Gippsland Lakes: 2008 to 2010. Arthur Rylah Institute for Environmental Research. Department of Sustainability and Environment, Heidelberg, Victoria.
Gippsland Lakes Report Card Gippsland Lakes and Catchments Task Force
Page | 33
8. Improving the report card The information collected as part of the development of this report card has been collected from all the existing research and monitoring programs that the Taskforce and other agencies currently undertake in, and around, the Gippsland Lakes. Further work is needed to refine and support reporting as summarised below.
8.1 Water quality • Develop specific trigger levels for water quality parameters for the Gippsland
Lakes in line with the procedures recommended in the ANZECC guidelines. • Update the State Environment Protection Policy schedule for the Gippsland
Lakes to incorporate these trigger levels. • Provide publicly available data on key water quality variables. • Provide separate ratings for 1) Lake Wellington and 2) Lakes Victoria and
King. This will better highlight the main water quality issues in the Lakes. • Continue collection of base data and implement the finding of the Fox review
for water quality sampling that agencies conduct in the Gippsland Lakes and catchment (Fox et al., 2005).
8.2 Algal blooms Continue building on existing research to further increase understanding about algal blooms and so improve the ability of agencies to more accurately predict when these events will occur. Specific research needs are discussed by Holland et al., 2011 and include:
• Further work on which nutrient (N versus P) is limiting and how this changes seasonally.
• Research on grazing as a control of cyanobacterial growth.
8.3 Wetlands Expand the application of the Index of Wetland Condition to additional key wetlands in the Gippsland Lakes system
8.4 Birds Improve bird monitoring that focuses on Ramsar values particularly:
• Regular counts of breeding, roosting and feeding waterbirds with a particular emphasis on those species that meet the 1% population criteria.
• Detailed and frequent surveys of threatened species, including Australian Bittern and Painted Snipe, to assess changes to populations and loss of key habitat areas.
• Regular surveys of waterbird usage during key visitation periods. In particular, monitoring abundance of the ‘1% species’ that are important for Ramsar ecological character.
• Establish an ecological monitoring program for the Lakes that takes into account the on-going monitoring programs that the DSE Biodiversity team conduct around key species (e.g. Sea Eagles and Little Terns).
Gippsland Lakes Report Card Gippsland Lakes and Catchments Task Force
Page | 34
8.5 Seagrass • Establish a reference condition for density and extent of seagrass to improve
reliability of ratings. • Quantify the areal extent and physical structure of seagrass to facilitate direct
comparison of current condition, with that recorded in 1997, when extensive quantitative mapping was last conducted.
8.6 Fish • Improve fish assessment through multiple lines of evidence including - fishery
independent surveys, recreational catches, and other indirect measures to complement commercial catch data. A broad range of data is available for black bream but is limited for other species.
• Use the Index of Estuarine Condition (IEC) and the pre-European reference conditions for fish (PERCH), when these become available, to improve the reliability of fish assessment.
8.7 References Holland, D., Cook, P. and Beardall, J. (2011) Targeted monitoring of algal bloom potential in the Gippsland Lakes. Monash University Water Studies Centre for Gippsland Lakes and Catchments Task Force.
Fox, D. R., T. Etchells and K. S. Tan (2005) Protocols for the optimal measurement of nutrient loads: A report to West Gippsland Catchment Management Authority.