GIORDANO INTERNATIONAL LIMITEDcorp.giordano.com.hk/files/results_material/5247454892367155039... ·...
49
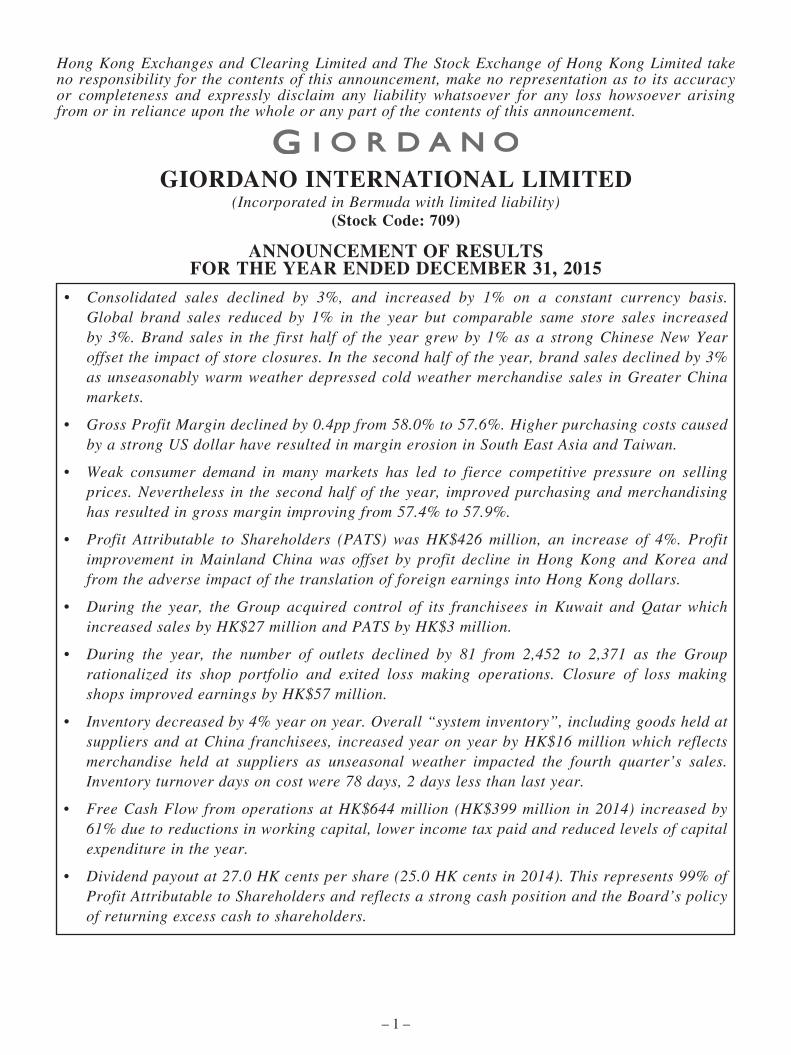
– 1 – Hong Kong Exchanges and Clearing Limited and The Stock Exchange of Hong Kong Limited take no responsibility for the contents of this announcement, make no representation as to its accuracy or completeness and expressly disclaim any liability whatsoever for any loss howsoever arising from or in reliance upon the whole or any part of the contents of this announcement. GIORDANO INTERNATIONAL LIMITED (Incorporated in Bermuda with limited liability) (Stock Code: 709) ANNOUNCEMENT OF RESULTS FOR THE YEAR ENDED DECEMBER 31, 2015 • Consolidated sales declined by 3%, and increased by 1% on a constant currency basis. Global brand sales reduced by 1% in the year but comparable same store sales increased by 3%. Brand sales in the first half of the year grew by 1% as a strong Chinese New Year offset the impact of store closures. In the second half of the year, brand sales declined by 3% as unseasonably warm weather depressed cold weather merchandise sales in Greater China markets. • Gross Profit Margin declined by 0.4pp from 58.0% to 57.6%. Higher purchasing costs caused by a strong US dollar have resulted in margin erosion in South East Asia and Taiwan. • Weak consumer demand in many markets has led to fierce competitive pressure on selling prices. Nevertheless in the second half of the year, improved purchasing and merchandising has resulted in gross margin improving from 57.4% to 57.9%. • Profit Attributable to Shareholders (PATS) was HK$426 million, an increase of 4%. Profit improvement in Mainland China was offset by profit decline in Hong Kong and Korea and from the adverse impact of the translation of foreign earnings into Hong Kong dollars. • During the year, the Group acquired control of its franchisees in Kuwait and Qatar which increased sales by HK$27 million and PATS by HK$3 million. • During the year, the number of outlets declined by 81 from 2,452 to 2,371 as the Group rationalized its shop portfolio and exited loss making operations. Closure of loss making shops improved earnings by HK$57 million. • Inventory decreased by 4% year on year. Overall “system inventory”, including goods held at suppliers and at China franchisees, increased year on year by HK$16 million which reflects merchandise held at suppliers as unseasonal weather impacted the fourth quarter’s sales. Inventory turnover days on cost were 78 days, 2 days less than last year. • Free Cash Flow from operations at HK$644 million (HK$399 million in 2014) increased by 61% due to reductions in working capital, lower income tax paid and reduced levels of capital expenditure in the year. • Dividend payout at 27.0 HK cents per share (25.0 HK cents in 2014). This represents 99% of Profit Attributable to Shareholders and reflects a strong cash position and the Board’s policy of returning excess cash to shareholders.
Transcript of GIORDANO INTERNATIONAL LIMITEDcorp.giordano.com.hk/files/results_material/5247454892367155039... ·...
– 1 –
Hong Kong Exchanges and Clearing Limited and The Stock Exchange of Hong Kong Limited take no responsibility for the contents of this announcement, make no representation as to its accuracy or completeness and expressly disclaim any liability whatsoever for any loss howsoever arising from or in reliance upon the whole or any part of the contents of this announcement.
GIORDANO INTERNATIONAL LIMITED(Incorporated in Bermuda with limited liability)
(Stock Code: 709)
ANNOUNCEMENT OF RESULTSFOR THE YEAR ENDED DECEMBER 31, 2015
• Consolidated sales declined by 3%, and increased by 1% on a constant currency basis.Global brand sales reduced by 1% in the year but comparable same store sales increasedby 3%.Brand sales in the first half of the year grew by 1%as a strongChineseNewYearoffsettheimpactofstoreclosures.Inthesecondhalfoftheyear,brandsalesdeclinedby3%as unseasonably warm weather depressed cold weather merchandise sales in Greater China markets.
• GrossProfitMargindeclinedby0.4ppfrom58.0%to57.6%.Higherpurchasingcostscausedby a strong US dollar have resulted in margin erosion in South East Asia and Taiwan.
• Weak consumer demand in many markets has led to fierce competitive pressure on sellingprices.Nevertheless in the secondhalfof theyear, improvedpurchasingandmerchandisinghasresultedingrossmarginimprovingfrom57.4%to57.9%.
• Profit Attributable to Shareholders (PATS) was HK$426million, an increase of 4%. Profitimprovement inMainlandChinawas offset by profit decline inHongKong andKorea andfrom the adverse impact of the translation of foreign earnings into Hong Kong dollars.
• During the year, theGroup acquired control of its franchisees in Kuwait andQatar whichincreasedsalesbyHK$27millionandPATSbyHK$3million.
• During the year, the number of outlets declined by 81 from 2,452 to 2,371 as the Grouprationalized its shop portfolio and exited loss making operations. Closure of loss making shopsimprovedearningsbyHK$57million.
• Inventorydecreasedby4%yearonyear.Overall“systeminventory”,includinggoodsheldatsuppliersandatChina franchisees, increasedyearonyearbyHK$16millionwhichreflectsmerchandise held at suppliers as unseasonal weather impacted the fourth quarter’s sales.Inventoryturnoverdaysoncostwere78days,2dayslessthanlastyear.
• FreeCashFlow fromoperationsatHK$644million (HK$399million in2014) increasedby61%duetoreductionsinworkingcapital,lowerincometaxpaidandreducedlevelsofcapitalexpenditure in the year.
• Dividendpayoutat27.0HKcentspershare(25.0HKcentsin2014).Thisrepresents99%ofProfitAttributabletoShareholdersandreflectsastrongcashpositionandtheBoard’spolicyof returning excess cash to shareholders.

– 2 –
RESULTS
The board of directors (the “Board”) of Giordano International Limited (the “Company”) is pleased to announce the audited consolidated results of the Company and its subsidiaries (the “Group”) for the year ended December 31, 2015, together with comparative figures for the previous year, as follows:
Consolidated Income Statement
(InHK$millions,exceptearningspershare) Note 2015 2014
Sales 2 5,381 5,545Cost of sales (2,284) (2,331)
Gross profit 3,097 3,214
Other income and other gains, net 89 77Distribution expense (2,242) (2,360)Administrative expenses (388) (389)
Operating profit 3 556 542
Finance expense – (1)Share of profit of joint ventures 42 54Share of profit of associates – 1
Profit before taxation 2 598 596Taxation 4 (118) (130)
Profit for the year 480 466
Profit attributable to: Shareholders of the Company 426 408 Non-controlling interests 54 58
480 466
Earnings per share for profit attributable to shareholders of the Company 5
Basic (HK cents) 27.1 26.0
Diluted (HK cents) 27.1 25.9

– 3 –
Consolidated Statement of Comprehensive Income
(InHK$millions) 2015 2014
Profit for the year 480 466Other comprehensive income:Items that may be reclassified to profit or loss Fair value change on available-for-sale financial assets – 1 Impairment loss on available-for-sale financial assets – 4 Share of other comprehensive income of joint ventures – (2) Fair value loss on cash flow hedge – (3) Exchange adjustment on translation of overseas subsidiaries, associates, joint ventures and branches (121) (67)
Total comprehensive income for the year 359 399
Total comprehensive income attributable to: Shareholders of the Company 319 343 Non-controlling interests 40 56
359 399

– 4 –
Consolidated Balance Sheet
(InHK$millions) Note 2015 2014
ASSETS
Non-current assetsProperty, plant and equipment 239 281Goodwill 546 535Interest in joint ventures 503 532Interest in associates – 4Available-for-sale financial assets 13 15Financial assets at fair value through profit or loss 28 28Leasehold land and rental prepayments 205 228Rental deposits 109 136Deferred tax assets 48 45
1,691 1,804
Current assetsInventories 491 514Leasehold land and rental prepayments 47 45Trade and other receivables 7 542 579Cash and bank balances 1,076 915
2,156 2,053
Total assets 3,847 3,857
EQUITY AND LIABILITIES
Capital and reservesShare capital 79 78Reserves 2,483 2,604Proposed dividends 228 228
Equity attributable to shareholders of the Company 2,790 2,910Non-controlling interests 176 174
Total equity 2,966 3,084
Non-current liabilitiesPut option liabilities 19 –Deferred tax liabilities 111 121
130 121
Current liabilitiesTrade and other payables 8 559 460Put option liabilities 102 102Taxation 90 90
751 652
Total liabilities 881 773
Total equity and liabilities 3,847 3,857
Net current assets 1,405 1,401
Total assets less current liabilities 3,096 3,205

– 5 –
Notes:
1. Principal Accounting Policies
(a) Basis of preparation
The consolidated financial statements have been prepared in accordance with Hong Kong Financial Reporting Standards (“HKFRS”) issued by the Hong Kong Institute of Certified Public Accountants (“HKICPA”). The consolidated financial statements are prepared under the historical cost convention, as modified by the revaluation of available-for-sale financial asset, financial asset at fair value through profit or loss and derivative financial instruments, which are carried at fair value.
(b) Impact of new and amended standards and interpretations
The Group has adopted the following amended standards which are effective for the Group’s financial year beginning on or after January 1, 2015:
Amendment to HKAS 19 on contributions from employees or third parties to defined benefit plans. The amendment distinguishes between contributions that are linked to service only in the period in which they arise and those linked to service in more than one period. The amendment allows contributions that are linked to service, and do not vary with the length of employee service, to be deducted from the cost of benefits earned in the period that the service is provided. Contributions that are linked to service, and vary according to the length of employee service, must be spread over the service period using the same attribution method that is applied to the benefits.
Amendments from annual improvements to HKFRSs – 2010 – 2012 Cycle, on HKFRS 8, “Operating segments”, HKAS 16, “Property, plant and equipment” and HKAS 38, “Intangible assets” and HKAS 24, “Related party disclosures”.
Amendments from annual improvements to HKFRSs – 2011 – 2013 Cycle, on HKFRS 3, “Business combinations”, HKFRS 13, “Fair value measurement” and HKAS 40, “Investment property”.
The adoption of the improvements made in the 2010-2012 Cycle has required additional disclosures in the segment note. Other than that, the remaining amendments are not material to the Group.
New Hong Kong Companies Ordinance (Cap.622)
In addition, the requirements of Part 9 “Accounts and Audit” of the new Hong Kong Companies Ordinance (Cap. 622) come into operation during the financial year, as a result, there are changes to presentation and disclosures of certain information in the consolidated financial statements.

– 6 –
2. Operating Segments
The Group determines its operating segments based on the reports reviewed by the chief operating decision-makers who make strategic decisions.
There are two major business segments, namely Retail and Distribution and Wholesale sales to overseas franchisees. The chief operating decision-makers assess the business of the Retail and Distribution segment from both a geographic location and a brand perspective. From geographic perspective, the Retail and Distribution segment comprises retail and franchise sales in Mainland China and Middle East, retail sales in Hong Kong and Taiwan and Rest of Asia Pacific. Certain countries are aggregated and reported in one segment as they are under similar economic condition or managed by the same team. From a brand perspective, the Retail and Distribution segment is sub-divided into Giordano & Giordano Junior, Giordano Ladies, BSX, and Others.
Segment profit represents the profit earned by each segment before finance cost, tax and share of profit of joint ventures and associate. This is the measurement basis reported to the chief operating decision-makers for the purpose of resource allocation and assessment of segment performance.
An analysis of the Group's reportable segment sales and operating profit is as follows:
2015 2014 Operating Operating(InHK$millions) Sales profit Sales profit
Mainland China 1,451 90 1,580 59Hong Kong and Taiwan 1,610 119 1,640 130Rest of Asia Pacific 1,317 151 1,362 169Middle East 639 112 617 107
Total Retail and Distribution 5,017 472 5,199 465Wholesales sales to overseas franchisees 364 52 346 51
Segment sales/operating profit 5,381 524 5,545 516
Corporate function 32 26Finance expense – (1)Share of profit of joint ventures 42 54Share of profit of associates – 1
Profit before taxation 598 596
Further analysis of the Retail and Distribution business by brand is as follows:
2015 2014 Operating Operating(InHK$millions) Sales profit Sales profit
By brand:Giordano & Giordano Junior 4,302 414 4,491 396Giordano Ladies 393 43 391 40BSX 167 1 207 14Others 155 14 110 15
Total Retail and Distribution 5,017 472 5,199 465
– 7 –
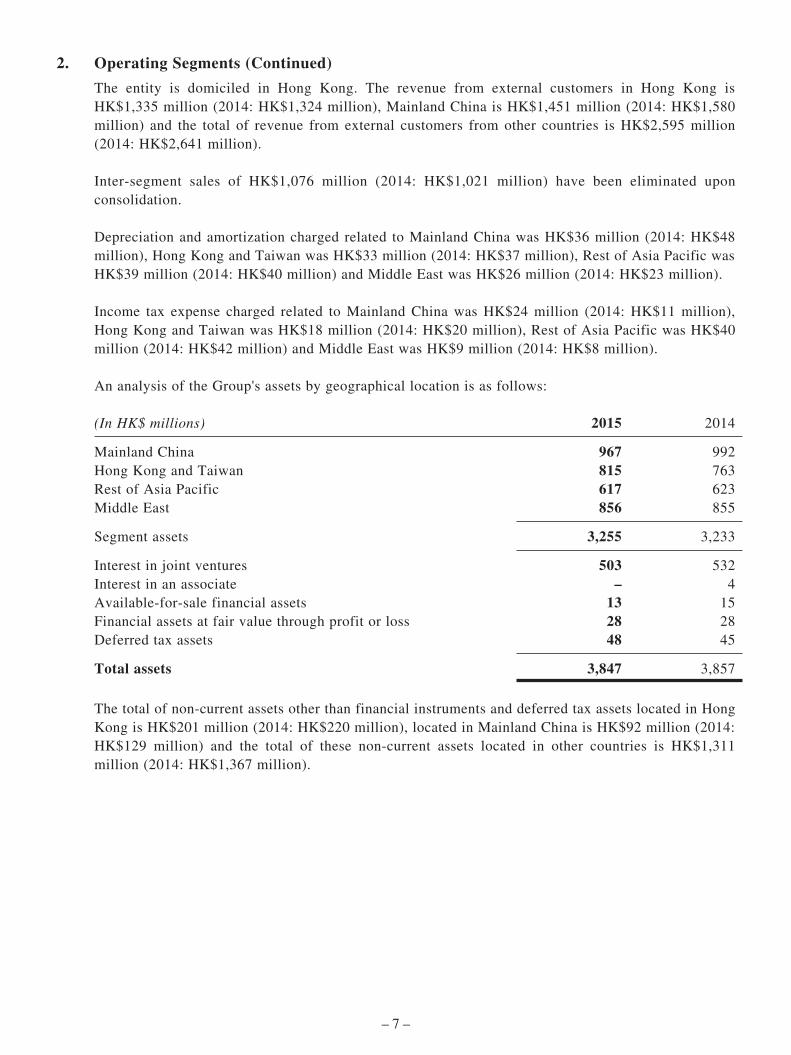
2. Operating Segments (Continued)
The entity is domiciled in Hong Kong. The revenue from external customers in Hong Kong is HK$1,335 million (2014: HK$1,324 million), Mainland China is HK$1,451 million (2014: HK$1,580 million) and the total of revenue from external customers from other countries is HK$2,595 million (2014: HK$2,641 million).
Inter-segment sales of HK$1,076 million (2014: HK$1,021 million) have been eliminated upon consolidation.
Depreciation and amortization charged related to Mainland China was HK$36 million (2014: HK$48 million), Hong Kong and Taiwan was HK$33 million (2014: HK$37 million), Rest of Asia Pacific was HK$39 million (2014: HK$40 million) and Middle East was HK$26 million (2014: HK$23 million).
Income tax expense charged related to Mainland China was HK$24 million (2014: HK$11 million), Hong Kong and Taiwan was HK$18 million (2014: HK$20 million), Rest of Asia Pacific was HK$40 million (2014: HK$42 million) and Middle East was HK$9 million (2014: HK$8 million).
An analysis of the Group's assets by geographical location is as follows:
(InHK$millions) 2015 2014
Mainland China 967 992Hong Kong and Taiwan 815 763Rest of Asia Pacific 617 623Middle East 856 855
Segment assets 3,255 3,233
Interest in joint ventures 503 532Interest in an associate – 4Available-for-sale financial assets 13 15Financial assets at fair value through profit or loss 28 28Deferred tax assets 48 45
Total assets 3,847 3,857
The total of non-current assets other than financial instruments and deferred tax assets located in Hong Kong is HK$201 million (2014: HK$220 million), located in Mainland China is HK$92 million (2014: HK$129 million) and the total of these non-current assets located in other countries is HK$1,311 million (2014: HK$1,367 million).
– 8 –
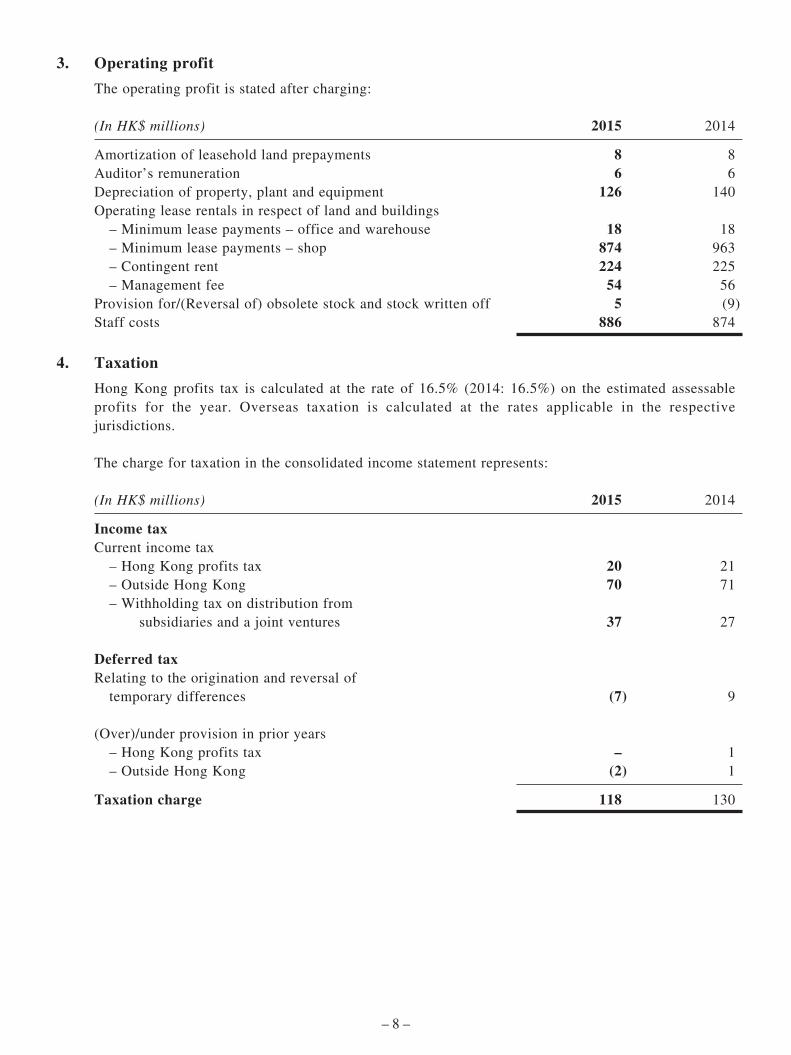
3. Operating profit
The operating profit is stated after charging:
(InHK$millions) 2015 2014
Amortization of leasehold land prepayments 8 8Auditor’s remuneration 6 6Depreciation of property, plant and equipment 126 140Operating lease rentals in respect of land and buildings – Minimum lease payments – office and warehouse 18 18 – Minimum lease payments – shop 874 963 – Contingent rent 224 225 – Management fee 54 56Provision for/(Reversal of) obsolete stock and stock written off 5 (9)Staff costs 886 874
4. Taxation
Hong Kong profits tax is calculated at the rate of 16.5% (2014: 16.5%) on the estimated assessable profits for the year. Overseas taxation is calculated at the rates applicable in the respective jurisdictions.
The charge for taxation in the consolidated income statement represents:
(InHK$millions) 2015 2014
Income taxCurrent income tax – Hong Kong profits tax 20 21 – Outside Hong Kong 70 71 – Withholding tax on distribution from subsidiaries and a joint ventures 37 27
Deferred taxRelating to the origination and reversal of temporary differences (7) 9
(Over)/under provision in prior years – Hong Kong profits tax – 1 – Outside Hong Kong (2) 1
Taxation charge 118 130

– 9 –
5. Earnings per share
The calculations of basic and diluted earnings per share are based on the consolidated profit attributable to shareholders for the year of HK$426 million (2014: HK$408 million).
The basic earnings per share is based on the weighted average of 1,570,283,230 shares (2014: 1,569,176,929 shares) in issue during the year.
The diluted earnings per share is based on 1,570,283,230 shares (2014: 1,569,176,929 shares) which is the weighted average number of shares in issue during the year plus the weighted average of 1,383,913 shares (2014: 2,121,728 shares) deemed to be issued if all dilutive outstanding share options granted under the share option scheme of the Company had been exercised.
6. Dividends
(a) Dividends attributable to the year:
(InHK$millions) 2015 2014
Interim dividend declared and paid of 12.5 HK cents (2014: 10.5 HK cents) per share 196 165
Final dividend proposed after the balance sheet date of 14.5 HK cents (2014: 14.5 HK cents) per share 228 228
424 393
At the board meeting held on March 3, 2016, the directors proposed final dividend of 14.5 HK cents per share. The proposed dividend has not been recognized as a liability at the balance sheet date. The amount of proposed dividend was based on the shares in issue as at the proposed date.
(b) Dividends attributable to the previous year, approved and paid during the year:
(InHK$millions) 2015 2014
2014 final dividend approved and paid of 14.5 HK cents (2013: 24.0 HK cents) per share 228 377
The amount of dividends paid was based on the number of shares outstanding as at the dividend payment date.
– 10 –
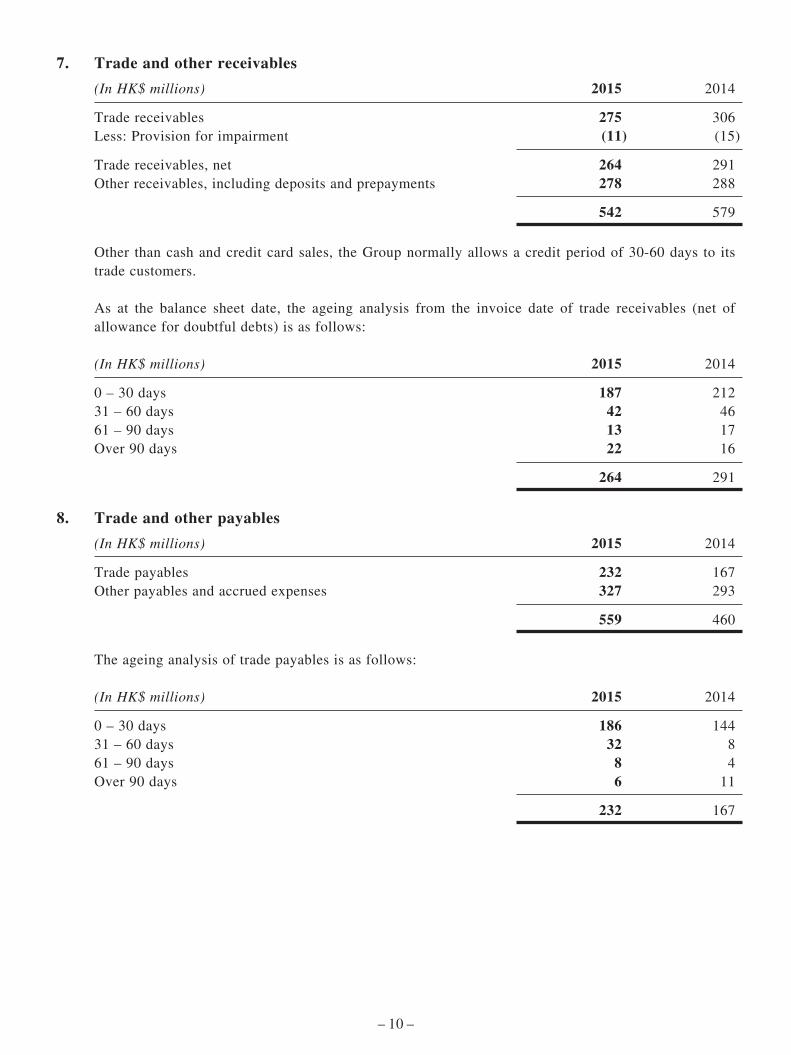
7. Trade and other receivables
(InHK$millions) 2015 2014
Trade receivables 275 306Less: Provision for impairment (11) (15)
Trade receivables, net 264 291Other receivables, including deposits and prepayments 278 288
542 579
Other than cash and credit card sales, the Group normally allows a credit period of 30-60 days to its trade customers.
As at the balance sheet date, the ageing analysis from the invoice date of trade receivables (net of allowance for doubtful debts) is as follows:
(InHK$millions) 2015 2014
0 – 30 days 187 21231 – 60 days 42 4661 – 90 days 13 17Over 90 days 22 16
264 291
8. Trade and other payables
(InHK$millions) 2015 2014
Trade payables 232 167Other payables and accrued expenses 327 293
559 460
The ageing analysis of trade payables is as follows:
(InHK$millions) 2015 2014
0 – 30 days 186 14431 – 60 days 32 861 – 90 days 8 4Over 90 days 6 11
232 167

– 11 –
MANAGEMENT DISCUSSION AND ANALYSIS
Overview of 2015 Performance
Full Year Second Half First Half
(InHK$millions) 2015 2014 Variance 2015 2014 Variance 2015 2014 Variance
Sales 5,381 5,545 (3%) 2,645 2,873 (8%) 2,736 2,672 2%Gross profit 3,097 3,214 (4%) 1,531 1,649 (7%) 1,566 1,565 FlatGross margin 57.6% 58.0% (0.4pp) 57.9% 57.4% 0.5pp 57.2% 58.6% (1.4pp)
Operating expenses (2,630) (2,749) (4%) (1,291) (1,384) (7%) (1,339) (1,365) (2%)Operating profit 556 542 3% 281 309 (9%) 275 233 18%Operating margin 10.3% 9.8% 0.5pp 10.6% 10.8% (0.2pp) 10.1% 8.7% 1.4ppEBITDA 743 760 (2%) 373 418 (11%) 370 342 8%
Net profit 426 408 4% 218 234 (7%) 208 174 20%Net profit margin 7.9% 7.4% 0.5pp 8.2% 8.1% 0.1pp 7.6% 6.5% 1.1pp
Free cash flow from operations 644 399 61% 287 145 98% 357 254 41%Net cash and bank balances 1,076 915 18% 1,076 915 18% 1,029 940 9%
Inventory balances 491 514 (4%) 491 514 (4%) 453 445 2%Inventory days on costs (days)1 78 80 (2) 78 80 (2) 70 73 (3)
Number of outlets 2,371 2,452 (81) 2,371 2,452 (81) 2,378 2,553 (175)Net change in outlets during the period (81) (190) (7) (101) (74) (89)
1 Inventoryheldatyearenddividedbycostofsalesandmultipliedby365days.

– 12 –
Profit Attributable to Shareholders (“PATS”)
During the year, PATS increased by 4% to HK$426 million from HK$408 million last year. Excluding currency impact, profit attributable to shareholders increased by 27%.
(HK$ millions)
2014 PATS
Decrease in profit from Mainland
China
Decrease in profits from Hong Kong
& Macau
Increaes in profits from
Taiwan
Increase in profits from
Rest of Asia Pacific
Increase in profits from Middle East
Increase inwholesale
pro�t
Decrease inshare of pro�t
of jointventures
Taxation,non-controlling
interests andother segments
PATS(ExcludeCurrencyImpact)
Currencyimpact on
IncomeStatement
2015 PATS
0
100
200
300
400
500
600
408
(7)
51927% 426
4%
33 7
73 5 1 9
(10)
(93)
Currency impacts to Income Statement
The impact of foreign currency exchange rates changes had the following impact on the Income Statement:
Currency Depreciation Translation Transaction loss on(InHK$millions) Reported difference difference purchase Adjusted
Sales 5,381 219 − − 5,600Gross profit 3,097 126 − 76 3,299Other income 89 1 2 − 92Operating expense (2,630) (104) − − (2,734)PATS 426 15 2 76 519

– 13 –
The Group operates in foreign jurisdictions which do business in foreign currencies.
• The impact onPATSof translating the results of these entities intoHongKongdollarswasa loss of HK$15 million. This was due to the adverse impact from translation of trading currencies such as the Indonesian Rupiah, Malaysian Ringgit, Thai Bhatt, New Taiwan Dollar, Singapore Dollar and the Chinese Yuan which depreciated against the US dollar by 12%, 16%, 6%, 4%, 8% and 2% respectively over the year.
• Inmarketswherewe operate in foreign currencies that in the year depreciated significantlyagainst the US dollar and the Chinese Yuan, costs of purchasing products sourced in China increased by HK$76 million due to such currency weakness.
• Overall,theimpactofforeigncurrencychangesontheGroup’sresultswasanadverseimpactof HK$93 million.
• Excludingthesecurrencyimpacts,2015PATSwouldbeHK$519million,22%morethanthePATS reported in the year and 27% more than the PATS in 2014.
Sales and Gross Profit
Sales growth and contribution
* Sales growth excludes exchange
effects
% ofgroupsalesinbrackets
2014 2015
Middle East
Overall +1%*/-3%
(HK$ millions)
5,8485,545
0
1,000
2,000
3,000
4,000
5,000
6,000
364 (7%)346 (6%)
639 (12%)617 (11%)
1,317 (24%)1,362 (25%)
1,610 (30%)1,640 (30%)
1,451 (27%)1,580 (28%)
5%
4%*/ 4%
5,545
5,381
8%*/ 3%
Rest of Asia Paci�c
Hong Kong & Taiwan
Mainland China 6%*/ 8%
Flat*/ 2%
Wholesale to overseas

– 14 –
Brand sales growth for the last eight quarters
-8%
-6%
-4%
-2%
0%
2%
4%
6%
8%
First Quarter
2014
SecondQuarter
2014
ThirdQuarter
2014
FourthQuarter
2014
First Quarter
2015
SecondQuarter
2015
ThirdQuarter
2015
FourthQuarter
2015
-5%
-6%
-6%
-6%
-6%
-2%
-4%
7%6%
4%
1%
0%
2%-1%
-2% -2%
Total Brand Sales Growth Comparable Store Sales Growth
Sales for the last twelve quarters
First Quarter
2013
First Quarter
2014
First Quarter
2015
SecondQuarter
2013
SecondQuarter
2014
SecondQuarter
2015
ThirdQuarter
2013
ThirdQuarter
2014
ThirdQuarter
2015
FourthQuarter
2013
FourthQuarter
2014
FourthQuarter
2015
(HK$ millions)
Mainland China Hong Kong & Taiwan Middle East Wholesale to overseasRest of Asia Paci�c
0200400600800
1,0001,2001,4001,6001,800
69 75
332
392
381
153144
377
448
473
72
1,514
155
320
402
420 419
83
1,380 1,4451,327
95 100
309 301
384 382
353 343
151 165
1,292 1,291 1,333
164
397
512
513
88
1,674
153
398
490
466
83
1,5901,405
171
354
373
360
85
1,283 1,240
158
335
364
341
92175
313
361
299
75144
366
430
390
437
337
15597
– 15 –
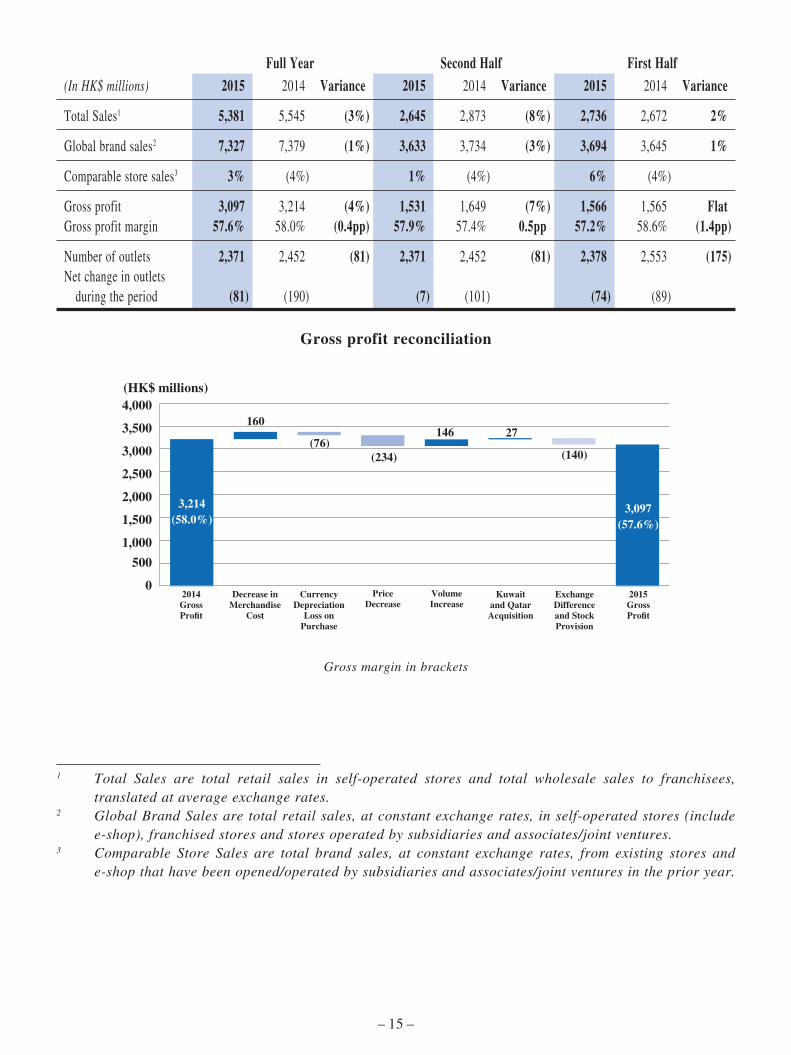
Full Year Second Half First Half
(InHK$millions) 2015 2014 Variance 2015 2014 Variance 2015 2014 Variance
Total Sales1 5,381 5,545 (3%) 2,645 2,873 (8%) 2,736 2,672 2%
Global brand sales2 7,327 7,379 (1%) 3,633 3,734 (3%) 3,694 3,645 1%
Comparable store sales3 3% (4%) 1% (4%) 6% (4%)
Gross profit 3,097 3,214 (4%) 1,531 1,649 (7%) 1,566 1,565 FlatGross profit margin 57.6% 58.0% (0.4pp) 57.9% 57.4% 0.5pp 57.2% 58.6% (1.4pp)
Number of outlets 2,371 2,452 (81) 2,371 2,452 (81) 2,378 2,553 (175)Net change in outlets during the period (81) (190) (7) (101) (74) (89)
Gross profit reconciliation
0
500
1,000
1,500
2,000
2,500
3,000
3,500
4,000
3,097(57.6%)
3,214(58.0%)
2014Gross Pro�t
Decrease inMerchandise
Cost
CurrencyDepreciation
Loss onPurchase
VolumeIncrease
PriceDecrease
Kuwaitand QatarAcquisition
ExchangeDifferenceand StockProvision
2015Gross Pro�t
160
(76)(140)
146
(234)
27
(HK$ millions)
Gross margin in brackets
1 Total Sales are total retail sales in self-operated stores and total wholesale sales to franchisees, translated at average exchange rates.
2 Global Brand Sales are total retail sales, at constant exchange rates, in self-operated stores (include e-shop), franchised stores and stores operated by subsidiaries and associates/joint ventures.
3 Comparable Store Sales are total brand sales, at constant exchange rates, from existing stores and e-shop that have been opened/operated by subsidiaries and associates/joint ventures in the prior year.

– 16 –
Gross margin changes over the last 8 quarters
-5%
-4%
-3%
-2%
-1%
0%
1%
2%
First Quarter
2014
SecondQuarter
2014
ThirdQuarter
2014
FourthQuarter
2014
First Quarter
2015
SecondQuarter
2015
ThirdQuarter
2015
FourthQuarter
2015
-2.9%
-4.4%
-2.3%-1.8% -1.7%
-0.9%
0.1%
0.8%
• GroupSalesdecreasedby3%toHK$5,381millionin2015fromHK$5,545millionin2014.On a constant currency basis, sales increased by 1%.
• TheGroup’sgrossprofitdecreasedbyHK$117million,or3.6%, toHK$3,097million fromHK$3,214 million in 2014. Gross margin decreased by 0.4 percentage points to 57.6%.
− Sales volume increased as a result of focusing on core items but this also resulted in some reduction in average selling prices. In the first half of the year, sales prices were also reduced as a result of inventory clearance initiatives.
− Costs increased due to the relative weakness of many trading currencies against the US dollar, which reduced gross margin by 1.4 percentage points, but this was offset by some improvements in product costs reflecting the core product mix and purchasing savings from lower raw material costs.
− The weakness of foreign currencies against the Hong Kong dollar also reduced gross profit by HK$126 million when these results were translated into Hong Kong dollars. Excluding this translation effect, gross profit would have been flat compared to 2014.
− Overall gross margin improved as the year progressed and in the fourth quarter was 0.8 percentage points favourable to that in the prior year. This reflects tighter buying budgets, healthier inventory levels and strong sales price discipline and a continuous improvement in gross margin management over the past six quarters.
− Due to unseasonably warm weather in the fourth quarter across many markets, sales volume declined reduced by 4% compared to prior year.
Markets – Mainland China
• Mainland China sales decreased by 8% in 2015, or HK$129 million, to HK$1,451 millionfrom HK$1,580 million in 2014. Excluding the effect of translating Chinese yuan into Hong Kong dollars, sales decreased by 6% in the year.
– 17 –
• The key underlying measure of sales growth is brand sales which represents the end salesof merchandise through Giordano stores, both self-managed and franchised. This measure excludes the effects of both currency exchange fluctuations and the impact of inventory changes undertaken by franchisees. Brand sales in Mainland China decreased by 6% in 2015 but comparable same store sales increased by 6% reflecting the closure of loss-making stores and improvements in our core store portfolio.
• KeyfactorsdeterminingsalesinChinaareasfollows:
− Same store sales in the first quarter were strong, against a weak 2014 base, with a 14% increase in same store sales. The second half of the year was weaker with same store sales flat against 12% growth in the first half. Unseasonably warm weather negatively impacted cold weather merchandise sales in the fourth quarter resulting in a 2% decline in same store sales against the same quarter of 2014.
− During the year, we eliminated unprofitable shops as we rightsized our portfolio closing 70 more stores in Mainland China than we opened. This resulted in brand sales decreasing by 6% in the year but contributed significantly to improved profitability in this market.
− We closed a net of 98 self-managed shops, opening a net of 28 franchised shops by comparison. We now have 80 loss making shops (compared to 145 in 2014) which represents 21% of all self-managed stores (compared to 31% in 2014). Of these loss-makers, we have 18 that are “significant” (compared to 33 in 2014) which has contributed significantly to profitability in 2015.
− We closed 40 shops in the year that we believe were detrimental to the brand image. We now have 130 shops which we see as weakening the brand image, representing 15% of all shops in Mainland China (compared to 18% in 2014 and 31% in 2013). We have downsized the proportion of street stores, which we see as a less profitable sales channel, to 15% of all stores compared with 17% in 2014. Conversely we have increased the proportion of department store counters to 56% compared to 53% in 2014 reflecting our strategy to focus on this channel.
− Women-only counters in department stores reduced from 36 to 24 during the year. Overall these counters are profit making.
− We have reduced inventory held at our franchisees by HK$5 million from the levels held at the end of 2014 which did not significantly impact sales in this channel. We are well positioned to launch new product ranges in 2016 unencumbered by significant amounts of excess stock.
− We have upgraded/opened 132 self-managed stores (2014: 208) and 162 (2014: 131) franchised stores during the year. This reflects a change of shop mix towards franchisee stores which we are developing. Investment per store was at a similar level to that in 2014 reflecting our strategy to improve shop ambience and customer experience.
− 91% of our e-sales in Mainland China are through online third party platforms and revenues through these channels increased by 23% from HK$162 million in 2014 to HK$199 million in 2015. Sales growth was supported by a significant new platform.
− In addition to our in-store terminals, we are now enabling purchasing through social media platforms and are introducing technology tools such as iBeacon which enables store location guidance and mobile marketing to our customers.

– 18 –
• Gross profit in Mainland China decreased by 8% with gross margin decreasing by 0.1percentage points. Excluding the effect of translating foreign currencies into Hong Kong dollars, gross profit decreased by 6%.
• Overallwesawachangeofproductmixtowardsmorecoremerchandisewithloweraverageselling prices and costs. Discounting in the first quarter, particularly in the e-channel where we acted to clear excess winter stocks from 2014, gave way to stronger price discipline as the year progressed reflecting more accurate merchandise decisions and healthier stock profiles.
• Thegrossmarginofourfranchiseesthemselves(whichwemeasurethroughourpointofsalessystem) increased by 1.1 percentage points as we improve the profitability of our franchisees through more effective merchandising and product mix. This helps to drive same store sales growth in this channel.
Markets – Hong Kong & Taiwan
• Sales in Hong Kong decreased by 1% during the year from HK$978 million to HK$971million. Comparative same store sales increased by 7%.
• Duringtheyear,HongKongapparelsalesinthemarketasawholedeclinedby7%,comparedto 4% growth in 2014. This market is slowing down as the nature of visitors from Mainland China changes. In response the Company, closed 8 more stores in the year than it opened, exiting 6 loss making stores.
• Gross profit in Hong Kong declined by HK$12 million from HK$658 million to HK$646million. Gross margin declined by 0.8 percentage points, from 67.3% to 66.5%.
• Merchandise costs decreased by 8% reflecting more functional merchandise mix. This hadsome impact on average selling prices which declined by 10%. Less themed marketing products and more core items were sold with volume increasing by 10%.
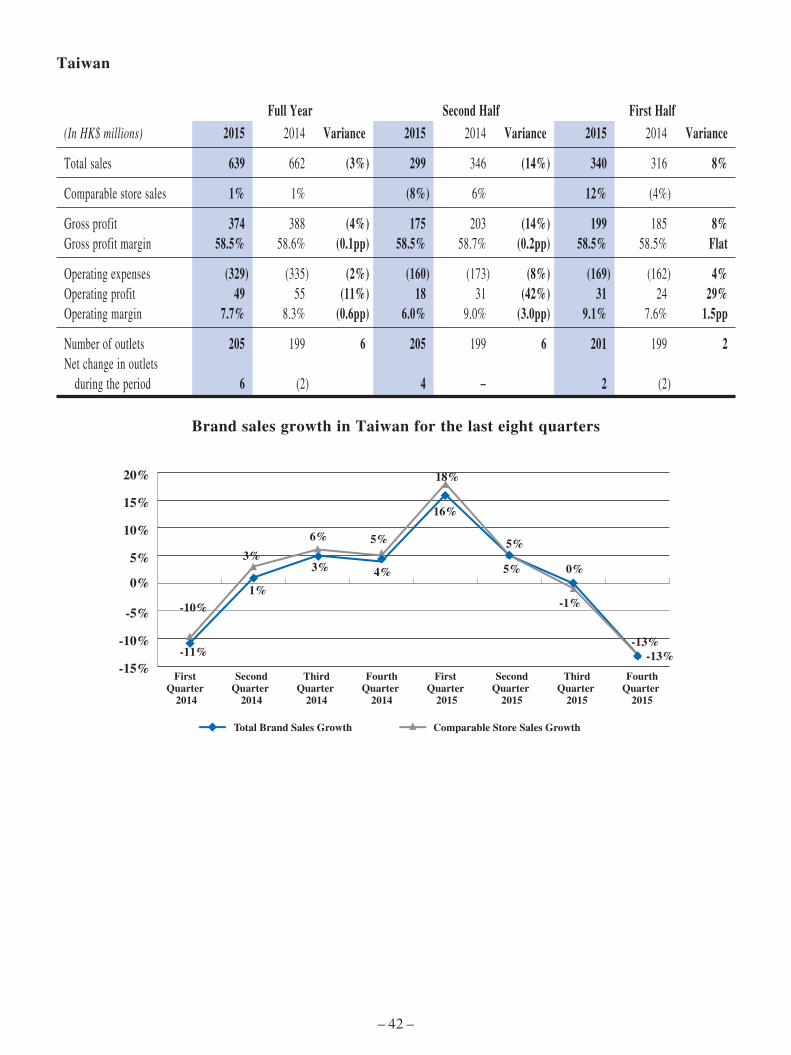
• SalesinTaiwandeclinedby3%duringtheyearfromHK$662milliontoHK$639million.Ona constant currency basis, sales and gross profit increased by 1%.
• After a relatively strong Chinese New Year, albeit against a weak base, sales growth hasgradually declined during the year with fourth quarter sales reducing by 13%. This reflects weak consumer demand and unseasonably warm weather in the fourth quarter which delayed the sale of winter merchandise until 2016.
• Grossprofit inTaiwandeclinedby4%orHK$14million fromHK$388million toHK$374million. Gross margin declined by 0.1 percentage points, from 58.6% to 58.5%. Average costs increased by 1% due to weak local currency against the Hong Kong dollar which increased costs by 5% but this was offset by a 4% reduction in underlying product costs and selling price discipline which increased average selling prices by 1%.

– 19 –
Markets – South East Asia
• Sales in other markets in Asia, notably in Singapore, Malaysia, Thailand and Indonesia,declined by 3% or HK$45 million to HK$1,317 million from HK$1,362 million in 2014. On a constant currency basis, sales increased by 8%. Comparable same store sales increased by 6%.
− Sales in Singapore decreased by 2% but on a constant currency basis grew by 6% due to improved merchandising. Trading conditions continue to be challenging as economic growth weakens external demand in this market, particularly in tourist areas where growth was significantly lower than in residential areas.
− Sales in Malaysia decreased by 19% but in local currency, decreased by 3%. The introduction of sales taxes and cost increases due to a weaker Ringgit resulted in negative sales growth in the second half of the year.
− Sales in Indonesia increased by 2% and on a constant currency basis by 15% reflecting continuing weakness in the Rupiah which has been in decline against the US dollar since August 2013. Demand in this market has been depressed by a general economic malaise and growth has mainly been in non-Giordano international brands where we act as a franchisee. We added 21 new stores including 16 stores from other brands. Same store sales for other brands increased by 18% and for Giordano by 1%.
− Sales in Thailand increased by 12% and on a constant currency basis by 19%. A clear focus on core products in this market has resulted in strong sales momentum. We added 11 new stores in this market which continues to show potential for profitable store development.
− In Australia, sales declined by 26% in the year and on a constant currency basis by 11%. Sales were impacted in this market by closures of loss making shops. Same store sales increased by 8%.
• Grossprofitdecreasedby6%withgrossmargindownby1.6percentagepoints.Onaconstantcurrency basis, gross profit increased by 5%. Currency depreciation in all markets increased costs by 12% which impacted gross margin by 4.5 percentage points. Average underlying costs fell 3% and selling price increases compensated for both these cost increases on a dollar basis but not sufficiently to prevent margin erosion.
Markets – Middle East
• Sales for Middle East markets increased by 4% or HK$22 million from HK$617 millionto HK$639 million. Excluding the acquisition of the businesses in Kuwait and Qatar sales decreased by 1%. Comparative same store sales declined by 3%.
− Sales in the United Arab Emirates decreased by 2% in the year due to changes in visitor patterns and weak consumer sentiment on the back of falling oil prices.
− In Saudi Arabia, sales stayed flat in the year as economic growth slowed on the back of falling oil prices.
− In Kuwait and Qatar sales increased by 9% due to strong performance in Qatar. These sales are now consolidated by the Group following acquisition of a controlling interest in the year.
− Sales to regional franchisees increased by 3% from HK$30.8 million to HK$31.7 million in the year. Some markets were negatively impacted by political instability in the region but this decline was offset by modest growth in markets such as Pakistan and Sri Lanka.

– 20 –
• Gross profit increased by 7% with gross margin increasing by 2.1 percentage points.Excluding the impact of consolidating the Kuwait and Qatari acquisitions, gross profit was flat and gross margin increased by 0.5 percentage points.
• Duetochangesinmerchandisingmix,costsdecreasedby3%andsellingpricesincreased4%.Volume decreased by 6% as a result of improved merchandising discipline and focus on more relevant, core products.
Markets – Wholesale East Asia
• Wholesale sales in EastAsia increased byHK$18million, or 5%, fromHK$346million in2014 to HK$364 million in 2015 and gross profit increased by 5% in 2015.
• SalestotheKoreanjointventureincreasedby5%orHK$10millionsupplementedbystronggrowth in Vietnam (up 65%) and Japan (up 15%).
• Grossprofitfromintercompanysalesstayedflat.Theneteffectofexternalandintercompanysales was a 1% increase in gross profit.
Brand Development
• Giordano Men: Under the Giordano brand, 72% of sales were from Men. Brand sales for Men is flat but gross profit increased by 1%.
− Volume increased by 5% in the year with stronger performance from spring summer items; cold weather merchndise sales were impacted by unseasonably warm weather in the fourth quarter.
− Overall costs decreased by 5% representing savings from purchasing and a more functional product mix. Average selling prices decreased by 4% and although gross margin did increase, gross profit contribution per piece declined. A high level of stock clearance in the first half of the year together with price discounting in the fourth quarter, led to margin pressure on most product categories.
• Giordano Women contributed 24% of sales of the Giordano brand and sales decreased by 1%.
− Volume increased by 4% with strong performance across categories that have been re-designed. Product development is ongoing to improve other categories where demand was weak.
− Although product costs and average selling prices decreased by 5%, gross margin was flat but gross profit contribution per piece declined. This brand was subject to the continuous stock clearance of excess inventories from prior year and margin is expected to improve going forward as new designs are introduced.
− We have a total of 46 standalone counters in China and Thailand after net closure of 11 unprofitable stores. These stores are profitable overall.

– 21 –
• Giordano Ladies increased sales by 1% in the year from HK$391 million to HK$393 million and operating profit increased from HK$40 million to HK$43 million. The brand performed well in Hong Kong and Taiwan in particular. During the year, excess inventory was cleared across all markets, in particular in South East Asia and Mainland China and preparations have been made for improved sales and margins in 2016. This brand is now managed on a global basis with centralized merchandising and extensive training of staff across all markets in the customer service elements of this unique brand.
• BSX sales declined by 15% as loss-making stores were closed. Operating profit declined from HK$14 million to HK$1 million as a result of operating losses in Mainland China and the Middle East. In order to increase the competitiveness and profitability of the brand, shop numbers will continue to be rationalized in 2016 as we will exit the Middle East and focus on Greater China. Additionally, we will leverage supply chain synergies with Giordano brands, through fabric consolidation and vendor rationalization.
• Beau Monde has now established 28 shops in Greater China as we develop this new brand. Although these stores have made modest losses in 2015, in 2016 we expect to establish a profitable merchandise mix for these stores and grow this new business.
• Eula: This brand was developed as a women’s fashion brand for Mainland China department stores. Nine stores were operated in the past two years but due to unprofitable performance this brand was terminated in the year and operations have been closed.
Operating Expenses
Total operating expenses reconciliation
0
500
1,000
1,500
2,000
2,500
3,000
(HK$ millions)
2,749
50%of sales
2,630
49%of sales
(104)
20 3
(13)( 12%)
(52)( 4%)
(12)( 3%)
39( 4%)
2014 Total operating expenses
Shop rental Other shop overhead
Advertising & promotion
Exchange difference
2015 Total operating expenses
Staff costs (shop and
of�ce)
Kuwait &Qatar
Acqusitions
Others
• Overall, the Group’s operating expenses decreased by 4% to HK$2,630 million fromHK$2,749 million in last year. Acquisition of Kuwait and Qatar incurred additional HK$20 million operating expenses to the Group during the year. Excluding the acquisition and currency impacts, total operating expenses declined by 1%.

– 22 –
• Totalrentcostsdecreasedby4%.RenttosalesfortheGroupdecreasedfrom22.4%to21.4%.Average shop area decreased by 3% while rent per square foot decreased by 2%. E-shop rental however contributed 1% increase in Group's rental. The decline in average shop area was mainly due to the closure of loss making shops in Mainland China, with the total average area down by 15%; this was partially offset by the opening of new shops in developing markets such as Indonesia and Thailand. The 1% decrease in rent per square foot was mainly attributable to the increase in the proportion of rental in lower cost markets.
• Shopoverheadcostscompriseshopdepreciation,warehouse,utilitiesandcreditcardcharges.Overhead costs decreased by 3% due to the decrease in shop depreciation expense by HK$11 million, mainly in Mainland China, following a net decrease in the number of stores and decreasing expenditure as shop mix moves towards department stores away from street stores.
• Total staff costs increased byHK$39million or 4%.Average staff headcount decreased by4%. Additional headcount in South East Asian markets following store expansion was offset by a reduction in Mainland China following closure of shops. Average staff costs per head count increased by 9%. This reflected the increase in minimum wages and the increase of year-end bonuses by HK$15 million due to improvement of underlying earnings.
• Advertising and marketing expenses decreased by HK$13 million or 12% due to fewercrossover collaborations with celebrities and third party organizations this year as our product development moves in a more functional, less thematic direction.
• Total operating expenses as a proportion of sales decreased from 50% to 49%. Costs havebeen generally well controlled but have been impacted by inflationary pressure on staff costs in some developing markets.
• InMainlandChina,onaconstantcurrencybasis, totaloperatingexpensesdecreasedby11%or HK$93 million. The reduction is mainly from reduced rental of HK$54 million (down 16%) and shop overhead costs of HK$21 million (down 14%). Our network of self-managed stores reduced by a net of 98 stores, from 472 to 374 as we exited 84 loss making stores in the year. Such closures contributed to the reduction of shop expenses. Staff costs reduced by HK$6 million or 2% as average headcount decreased by 13% but average salaries increased by 12% due to increases in minimum wage levels and increases in staff bonus.
• In Hong Kong, total operating expenses decreased slightly by 1% or HK$3 million. Rentdecreased by 3% and rent to sales decreased by 1 percentage point to 34.4% as we closed 6 inefficient loss making stores. Total average saleable area decreased by 2% and rent per square foot by 2%. Rent of comparable stores increased by 5%, (compared to 18% last year). We started to see easing of rent pressure in Hong Kong and will cautiously select profitable locations to extend our network in Hong Kong. Overall staff costs in Hong Kong increased by 6% with average staff costs increasing by 12% due to higher bonuses, offset by a decrease in headcount of 5% upon closures of stores.
– 23 –
• InTaiwan,operatingexpenses increasedby3%.Totaloperatingexpenses to sales increasedby 0.9 percentage points to 51.4% as sales only increased by 1% in local currency. Rentals were up by 2%, in line with sales due to the high proportion of concessionary rent in department stores. Staff costs increased by 7% due to average salaries up 4% and headcount up 2%. Despite tough trading conditions, Taiwan has continuously invested in the brand by upgrading shop ambiance and thus depreciation and other shop overhead expense increased by 2%.
• Operating expenses in South East Asia decreased by 5% compared to a decrease in grossprofit of 6%. In local currency, total operating expenses increase by 6%, reflecting high inflationary pressure in developing markets such as Indonesia, Malaysia and Thailand. During the year, shop rental increased by 4%, and shop area by 5% reflecting growth in emerging markets. Store numbers in the Rest of Asia Pacific increased by 18 mainly in Indonesia and Thailand where we are expanding our reach into regional shopping centres and department stores. Staff costs increased by 8%, of which 3% represented an increase in headcount and 5% represented increases in average salaries.
• Operating expenses in the Middle East stayed flat and gross profit also stayed flat. Shoprental was flat with shop numbers also flat compared to last year. Staff costs increased by 5% with average headcount down by 7% and staff cost per head up by 13%, mainly due to employment of more Saudi nationals in accordance with local labour laws. Staff productivity also improved as shop headcount per square foot decreased by 3%
Operating Profit before Other Income
• Overall,salesdecreasedby3%intheyearandgrossmarginby0.4percentagepointsresultingin a reduction of gross profit by 4%. Operating expenses decreased by 4%, resulting in an Operating Profit before Other Income of HK$467 million, up by HK$2 million from last year.
Other Income
• OtherincomeincreasedbyHK$12millionfromHK$77milliontoHK$89million.Themajorchanges are due to the following:
− Exchange losses decreased by HK$15 million (2015: HK$2 million; 2014: HK$17 million). We minimize non-functional currencies kept in local markets to control exchange risks.
− Interest income declined by HK$5 million as a result of decrease in bank deposits effective interest rate from 2.8% to 2.1% and the depreciation of local currencies in Mainland China and South East Asia.
− A gain on disposal of staff quarters in Mainland China of HK$11 million was recognized during the year (2014: HK$14 million).
Operating Profit
• As a result of the above, theGroup’s 2015operatingprofit increasedbyHK$14million, or3% to HK$556 million from HK$542 million in 2014.
– 24 –
• Operating profit in Mainland China increased by HK$31 million from HK$59 million toHK$90 million, up 53% compared to 2014. Operating margin increased from 3.7% to 6.2%. This was due to:
− Reduction in losses from closure of poorly performing shops− Reduction in back office costs− Sales growth in the core portfolio of self-managed and franchisee stores and online
platforms
• Operating profit inHongKong decreased byHK$5million fromHK$75million toHK$70million, down 7% compared to last year. Operating margin decreased from 7.7% to 7.2%. Operating expenses decreased by 1% compared to a decrease in gross profit of 2%. Going forward, as we focus on core functional merchandise, price discipline will be imposed to optimize gross margin.
• Operating profit in Taiwan decreased by HK$6 million from HK$55 million to HK$49million, down 11% compared to last year. Operating margin decreased from 8.3% to 7.7%. Currency depreciation resulted in higher purchasing costs and continuous brand investment with shop ambiance upgrade caused decline in profit margin.
• Operating profit in the Rest of Asia Pacific decreased by HK$18 million from HK$169million to HK$151 million, down 11% compared to last year. Operating margin decreased from 12.4% to 11.5%. Profitability declined by HK$9 million due to the translation of profits in foreign currency into Hong Kong dollars. Additionally costs increased by HK$64 million due to weak foreign currencies. Against this background price increases, improved merchandising, selective portfolio growth and cost controls improved profitability by HK$56 million.
• OperatingprofitinMiddleEastincreasedbyHK$5millionfromHK$107milliontoHK$112million, up 5% compared with last year. Operating margin increased from 17.3% to 17.5%. Excluding the acquisition of Kuwait and Qatari operations, operating profit increased by HK$1 million.

– 25 –
Joint Ventures – South Korea
Full Year Second Half First Half
(InHK$millions) 2015 2014 Variance 2015 2014 Variance 2015 2014 Variance
Total sales1 1,545 1,743 (11%) 800 884 (10%) 745 859 (13%)Comparable store sales2 (3%) (5%) 1% (10%) (6%) 1%
Gross profit 840 969 (13%) 429 487 (12%) 411 482 (15%)Gross profit margin 54.4% 55.6% (1.2pp) 53.6% 55.1% (1.5pp) 55.2% 56.1% (0.9pp)
Net Profit 84 110 (24%) 46 55 (16%) 38 55 (31%)Share of JV profit (% of equity holding: 48.5%) 41 53 (23%) 22 26 (15%) 19 27 (30%)
Number of outlets 198 219 (21) 198 219 (21) 200 232 (32)Net change in outlets during the period (21) (25) (2) (13) (19) (12)
1 Total Sales are total retail sales translated at average exchange rates.2 Comparable Store Sales are total brand sales, at constant exchange rates, from existing stores that
have been opened/operated in the prior year.
Brand sales growth in South Korea for the last eight quarters
-15%
-10%
-5%
0%
5%
10%
Comparable Store Sales GrowthTotal Brand Sales Growth
FirstQuarter
2014
SecondQuarter
2014
ThirdQuarter
2014
FourthQuarter
2014
FirstQuarter
2015
SecondQuarter
2015
ThirdQuarter
2015
FourthQuarter
2015
1%
-5%-5%-11%
-8%
-13%
-1%
4%
3%
-3%
0%
-12%
-8%-11%
0%
5%
• Sales in Korea declined by 11%. Excluding the effect of translating the KoreanWon intoHong Kong dollars, sales in Korea declined by 5%. Gross profit declined by 13% (or by 7% in local currency) and gross margin by 1.2pp. Total operating expenses declined by 11% or 5% in local currency through closing unprofitable stores and controlling marketing expenses. Net profit declined by 24% and operating margin declined from 6.3% to 5.4%.
• TradingconditionsinSouthKoreahavebeenchallengingin2015.Consumersentimentinthefirst quarter was weak and an initial recovery in demand was deflated by a scare over Middle East Respiratory Syndrome which reduced tourism in the second quarter. In the second half there has been modest recovery in sales volumes.
– 26 –
Income Tax
• The Group’s 2015 income taxation expense was HK$118 million (2014: HK$130 million),resulting in an effective tax rate1 of 19.7% (2014: 21.8%). The decrease in our effective tax rate reflects a change in profit mix and an increase in profit proportion generated from low tax markets such as Hong Kong, Singapore and Middle East.
Profit Attributable to Shareholders
• 2015profitattributabletoshareholdersincreasedby4%orHK$18milliontoHK$426millionfrom HK$408 million last year. Net profit margin increased by 0.5 percentage points from 7.4% to 7.9%.
• Basic anddiluted earnings per share increased to 27.1HKcents (2014: 26.0HKcents) and27.1 HK cents (2014: 25.9 HK cents), respectively.
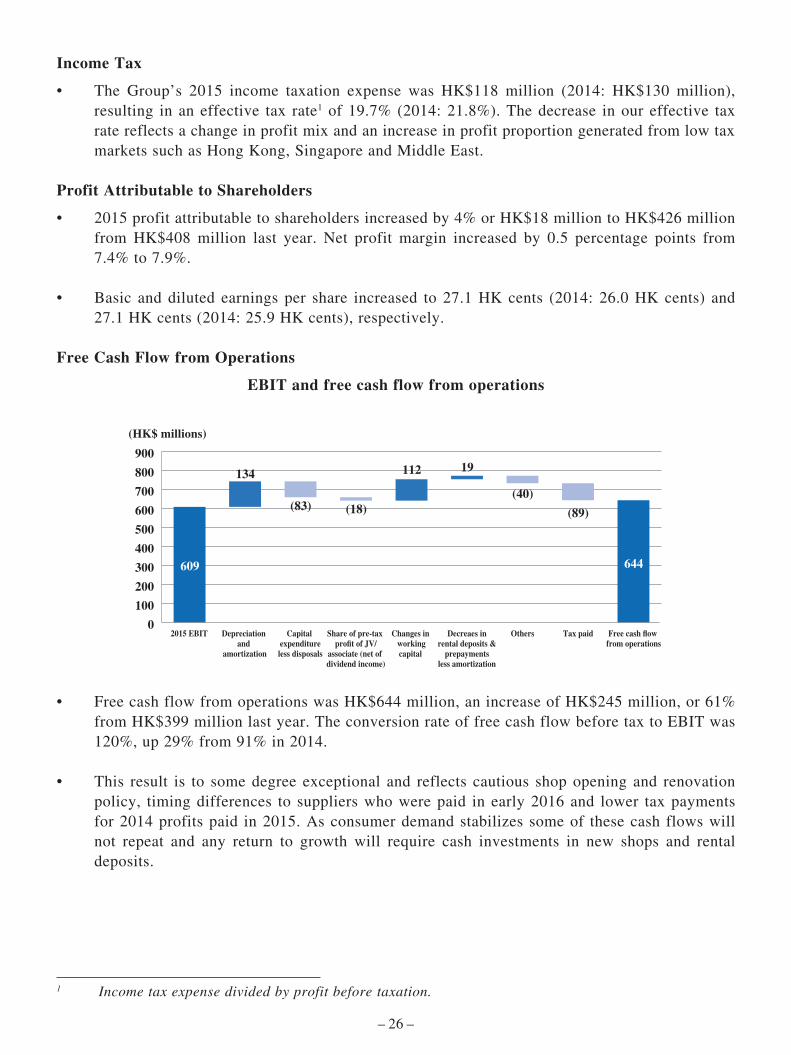
Free Cash Flow from Operations
EBIT and free cash flow from operations
(HK$ millions)
Depreciation and
amortization
Capital expenditureless disposals
2015 EBIT Changes in workingcapital
Decreaes inrental deposits &
prepaymentsless amortization
Others Tax paid Free cash flow from operations
Share of pre-tax profit of JV/
associate (net of dividend income)
0
100
200
300
400
500
600
700
800
900
609 644
134 112
(83) (18)
19
(40)
(89)
• FreecashflowfromoperationswasHK$644million,anincreaseofHK$245million,or61%from HK$399 million last year. The conversion rate of free cash flow before tax to EBIT was 120%, up 29% from 91% in 2014.
• This result is to somedegree exceptional and reflects cautious shopopening and renovationpolicy, timing differences to suppliers who were paid in early 2016 and lower tax payments for 2014 profits paid in 2015. As consumer demand stabilizes some of these cash flows will not repeat and any return to growth will require cash investments in new shops and rental deposits.
1 Income tax expense divided by profit before taxation.

– 27 –
Simplified free cash flow analysis
(InHK$millions) 2015 2014 Variance
Profit before income tax 598 596 Flat
Add: Share of tax of JV/associate 11 15 (27%)Add: Interest expense – 1 n/aAdd: Depreciation and amortization 134 148 (9%)
EBITDA 743 760 (2%)
Impairment loss on available-for-sale financial asset & leasehold improvement 3 4 (25%)Impairment loss on associates – 2 n/aAccounting gain on deemed disposal of associate (2) – n/aShare of pre-tax profit of JV/associate (53) (70) (24%)Net gain on disposal of building & leasehold land (11) (14) (21%)Amortization of rental prepayments 50 49 2%Changes in working capital 112 (11) (1,118%)Interest paid – (1) n/aIncome tax paid (89) (160) (44%)Interest income, Exchange and others (41) (41) Flat
Net cash inflow from operating activities 712 518 37%
Dividend income from JV/associate 35 37 (5%)Capital expenditure less proceeds from disposals (83) (131) (37%)Increase in rental deposits and rental prepayments (31) (41) (24%)Interest received 11 16 (31%)
Free cash flow from operations 644 399 61%

– 28 –
Capital expenditure
• Capital expenditure decreased byHK$46millionin 2015 compared to 2014. The decrease in capital expenditure was mainly due to the slow down of store expansion and tight control over shop portfolio development.
• Depreciation decreased by HK$14 million,reflecting the reduction in renovations in the year.
Changes in working capital
Working Capital in the year decreased by HK$112 million as follows:
Change in Kuwait & Completion Working Qatar dividend
(InHK$millions) Dec 2014 Capital Acquisition payable Others Dec 2015
Inventory 514 (27) 4 – – 491Trade receivables 291 (27) – – – 264Other receivables 180 (14) 4 – – 170Trade payables (167) (64) (1) – – (232)Other payables (293) 20 (5) (20) (27) (325)
525 (112) 2 (20) (27) 368
Inventory
• Group inventory in 2014 decreased by HK$23million from HK$514 million to HK$491 million.
• Inventory turnover on costs was 78 days, 2days less than last year. Inventory levels are seasonally impacted by an early Chinese New Year in 2016. Additionally, due to unseasonally warm weather, sales in the fourth quarter were depressed which adversely impacted inventory. Against this background, we exercised strict control over deliveries, pushing inventory back in the supply chain.
0
20
40
60
80
100
120
140
160
180
2013 2014 2015
(HK$ millions)
Capital expenditure Depreciation
137 148
156144
98
134
Capital expenditure
0
100
200
300
400
500
600
700
(Days)(HK$ millions)
Inventory Turnover days
Dec 2013 Dec 2014 Dec 2015
82 80 78
518 514 491
0102030405060708090100
Inventory

– 29 –
Total inventory including finished goods at suppliers
(InHK$millions) Dec 2015 Dec 2014
Inventory balance held by the Group 491 514Inventory balance held by franchisees in Mainland China 75 80Finished goods at suppliers (not yet shipped) 67 23
Total system inventory 633 617
• The Group manages inventory levels on an integrated basis. We monitor our suppliers’inventory and that of our franchisees in Mainland China, which we do not own. This ensures that we do not build up inventory commitments to our suppliers “off balance sheet”. Due to weak demand in the fourth quarter in cold weather markets, this “system inventory” increased by 3%. The merchandise held at suppliers is however generally “fresh” and improvements in supply chain flexibility mean that we can have reduced buying commitments over the first quarter of 2016 and expect to have healthy inventory levels at the end of this period.
Trade receivables
• Tradereceivablesdecreasedin2015byHK$27million to HK$264 million and days sales outstsanding remained the same at 48 days1.
• AsatDecember31,2015,totaloverdueaccountswere 22% of gross receivables, compared to 25% in 2014. The Group exercises careful monitoring of outstanding credit balances, particularly overdue amounts, restricting and stopping shipments where appropriate.
Trade payables
• Trade payables increased by HK$65 millionto HK$232 million. This was due to longer payment days wi th days of purchases outstanding at 42 days compared to 32 days at the end of 2014. This represents a timing difference as our normal credit terms of 30 days have not changed and some reversal of this position can be expected in 2016.
0
50
100
150
200
250
300
350
(Days)(HK$ millions)
Trade receivables Days sales outstanding
Dec 2013 Dec 2014 Dec 2015
4848
48
316291 264
0
10
20
30
40
50
60
Trade receivables
1 Prioryears'DSOdaysamendedtocatercreditsalesnetofconcessionrentindepartmentstores.
0
50
100
150
200
250
(Days)(HK$ millions)
Trade payables Days purchases outstanding
Dec 2013 Dec 2014 Dec 2015
34 32
42
160 167
232
051015202530354045
Trade payables
– 30 –
Share of Profit of Joint Ventures and Associated Companies and Dividend income received
South Korea Middle East Total
(InHK$millions) 2015 2014 Variance 2015 2014 Variance 2015 2014 Variance
Share of pre-tax profit 53 69 (23%) – 1 (100%) 53 70 (24%)Dividend received (35) (37) (5%) – − n/a (35) (37) (5%)
18 32 (44%) – 1 (100%) 18 33 (45%)
• This represents the difference between the portion of profit due to the Group from JointVentures and Associated Companies and the dividends paid to the Group in the year. The reduction is due to the decrease in profit from the Korean joint venture.
• AtDecember31,2015,theKoreanjointventureheldcashbalancesofHK$467million(2014:HK$547 million). Giordano’s (48.5%) share of HK$226 million is not consolidated in our balance sheet.
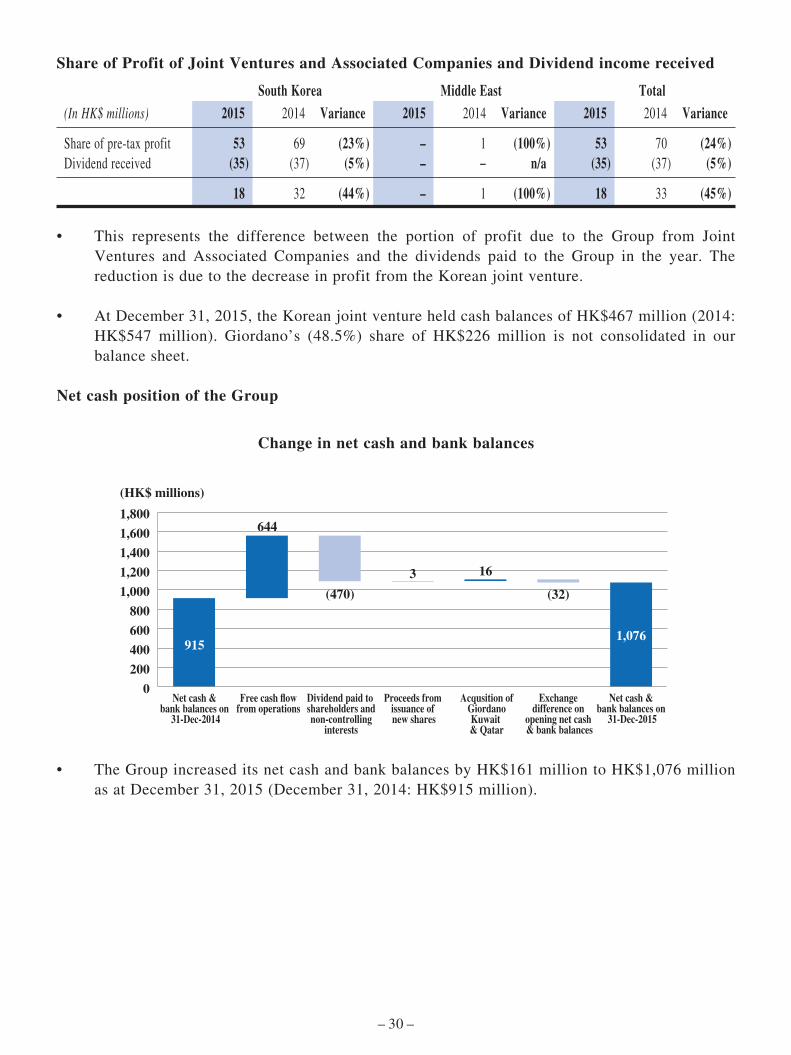
Net cash position of the Group
Change in net cash and bank balances
(HK$ millions)
Free cash �owfrom operations
Net cash & bank balances on
31-Dec-2014
Proceeds from issuance of new shares
Acqusition ofGiordanoKuwait & Qatar
Dividend paid to shareholders andnon-controlling
interests
Exchange difference on
opening net cash & bank balances
Net cash & bank balances on
31-Dec-2015
0
200
400
600
800
1,000
1,200
1,400
1,600
1,800
9151,076
644
(470)
163
(32)
• TheGroupincreaseditsnetcashandbankbalancesbyHK$161milliontoHK$1,076millionas at December 31, 2015 (December 31, 2014: HK$915 million).
– 31 –
• Dividendspaidduringtheyearcomprisedthefollowing:
(InHK$millions) 2015 2014
2014 Final dividend (which brought the full year dividend to 95% of the Group’s full year profit) 228 3772015 Interim dividend (94% of 2015 Group’s interim profit) 196 165Dividend paid to non-controlling interests of subsidiary in Indonesia 46 37
Dividend paid to shareholders and non-controlling interests 470 579
• HK$3millionwasraisedfromtheexerciseofemployeeshareoptionsduringtheyear.
Treasury, Foreign Currency Risk and Cash Management
• As at December 31, 2015 the Group holds the following foreign currency cash balancesoutside Hong Kong:
(HK$million) (HK$million)
US dollar pegged currency 143AED in United Arab Emirates 68SAR in Saudi Arabia 55QAR in Qatar 12MOP in Macau 8Non US dollar pegged currency 604RMB in Mainland China 470IDR in Indonesia 50SGD in Singapore 31MYR in Malaysia 15AUD in Australia 10THB in Thailand 8KWD in Kuwait 11TWD in Taiwan 6INR in India 3
Total Foreign Currency Held Outside HK 747
• The Group’s policy is to hold cash in its subsidiaries sufficient to cover the foreseeablecash requirements of the business, remitting surplus funds to the Group where they will be converted to Hong Kong/US dollars.
• In Mainland China HK$178 million was remitted to Hong Kong in early 2016, HK$188million is non distributable and HK$104 million will be remitted to Hong Kong later in 2016.

– 32 –
Dividends
• The Group has decided to pay a final dividend of 14.5 HK cents per share (2014: 14.5HK cents) which will result in a full year dividend of 27.0 HK cents per share (2014: 25.0 HK cents). This represents HK$424 million which is 99% of the Profit Attributable to Shareholders in the year.
• This reflects a strong cash position and a decision by the Board to return surplus cash toshareholders in the light of a stable performance in the first two months of 2016.
– 33 –
OUTLOOK AND STRATEGY
• Consumer demand during 2015 has been weak across nearly all the markets in whichGiordano does business. A slowdown in economic growth in Mainland China and Asian currencies weakening against a strong dollar, have resulted in difficult trading conditions in our core markets. Falling oil prices and political instability have also impacted markets in the Middle East where we do business. We do not foresee any changes in these external conditions in 2016.
• During2015,wemadeprogress inMainlandChina in a numberof areas.Closureof poorlyperforming shops significantly increased our profitability in this market. As more contract renewals in 2016 will lead to more opportunities to complete this process, we are starting to see our core portfolio return to growth and profitability. Positive same store sales will be enhanced by growth in the number of outlets, particularly in third and fourth tier cities where we see a lot of opportunity for our franchisees. Progress in this area is evident through the growth in the number of franchisee outlets during 2015 which we expect to continue in 2016.
• Growth in Mainland China and improved profitability has been supported by significantimprovement in our supply chain processes across the Group. Tight control of merchandise ordering and delivery has resulted in strong inventory control in the year and we will further extend this through a combination of prudent buying and supply chain flexibility.
• Throughout the Group, our front line teams have been developing processes and expertisewhich is significantly enhancing the effectiveness of merchandise selection and allocation. This will enable a focus in 2016 on increasing average selling prices as a result of decreased clearance pricing and a renewed emphasis on selling and marketing our differentiated products. The improvements in gross margin throughout 2015 are expected to continue into 2016.
• Currency depreciation in many markets has placed upwards pressure on the cost ofmerchandise sourced in Mainland China. The Group does not speculate on currency changes going forward and adopts the policy that any increases in costs locally should be recovered by selling price increases. Recent depreciation of the Chinese yuan may provide more favourable currency conditions in 2016 but the Group will continue to develop sourcing opportunities outside China, particularly in Bangladesh and Vietnam, to realize opportunities from lower cost sources. At the same time, supply chain development will also focus on flexibility and service which remain important aspects of aligning supply and demand, avoiding wrong buys and minimizing inventory.
• Controlofrentalcostshasimprovedin2015aseconomicconditionsinmanyofourmarketshave eased. We will remain vigilant in this area in 2016 and continue to look for business development initiatives which minimize rentals.
• During 2015, amatrix style brandmanagement processwas introducedwherebywe look atproduct development, merchandise mix, allocation of products to shops and pricing strategies as a partnership between global brands and local markets. During 2016, we will enhance this initiative by extending this to product categories to further align product development with local market needs.
– 34 –
• During2015,wedevelopedanumberofbrandstobettersuittheneedsofdifferentgroupsofcustomers.
– The core functional brands of Giordano Men and Giordano Women are developing well in line with our core brand values of simplicity, style and function.
– The Giordano Junior brand will also be developed in a similar way with more emphasis on value and universality and less emphasis on fashion elements in the design.
– Giordano Ladies has developed from a Hong Kong focused brand to a global brand, although Hong Kong remains a key profitable market. Much work has been done to clear obsolete inventory and train personnel in international markets and this should bear fruit in 2016.
– Beau Monde, our budget brand in Greater China, has undergone a lot of development activity in 2015 and we are now confident that we can establish this as a profitable, growing brand in 2016.
– Eula, our premium women’s brand developed for Mainland China, has not proved to be successful and we have discontinued this brand.
• Market conditions in South East Asia have been challenging in the past two years. During2015, we significantly improved merchandising, and therefore profitability, in Singapore but this will be a tough market going forward. Developing markets such as Malaysia, Indonesia and Thailand are now maturing and opportunities to grow, although still available, are decreasing. We will look to establish a legal entity in Vietnam in 2016 and this will support a steady growth strategy in this emerging market.
• In theMiddleEast, political stability and falling oil prices are still restricting our ability toachieve significant growth. In the long term, there is a lot of potential in this region. During 2016, in markets such as the UAE and Saudi Arabia, we will continue to rigorously implement merchandising disciplines to drive operational excellence. Additionally, we will look to expand our reach into new franchisee markets.
• During2015,wefurtherdevelopedonlinesalesinMainlandChinathroughanewplatform.In2016, we will look to establish growth through our existing third party platform partnerships and will look to invest further in digital marketing to do this. Additionally in 2016, we will start to establish digital sales channels outside Mainland China, initially through the development of our own e-shops.

– 35 –
HUMAN RESOURCES
On December 31, 2015, the Group had approximately 8,100 employees (2014: 8,200). The Group offers competitive remuneration packages and generous, goal-oriented bonuses targeted to different levels of staff. Senior managers are also offered generous performance-based bonus schemes and share options as a means for the Group to reward and retain a high calibre leadership team. We also invest heavily in training in sales and customer service, management, planning and leadership development to retain a skilled and motivated workforce.
Fast Track Management Trainee Scheme
In 2014 we established a Fast Track Management Trainee scheme in Hong Kong, designed to develop managers who can take up responsibility across our global operations. This scheme takes high quality graduates from a wide variety of backgrounds and equips them quickly with a range of skills and experience that enables them to contribute significantly to the future of the Group. These trainees will graduate from the scheme in 2016 and we are in the process of launching the second cohort of this scheme in 2016.
– 36 –
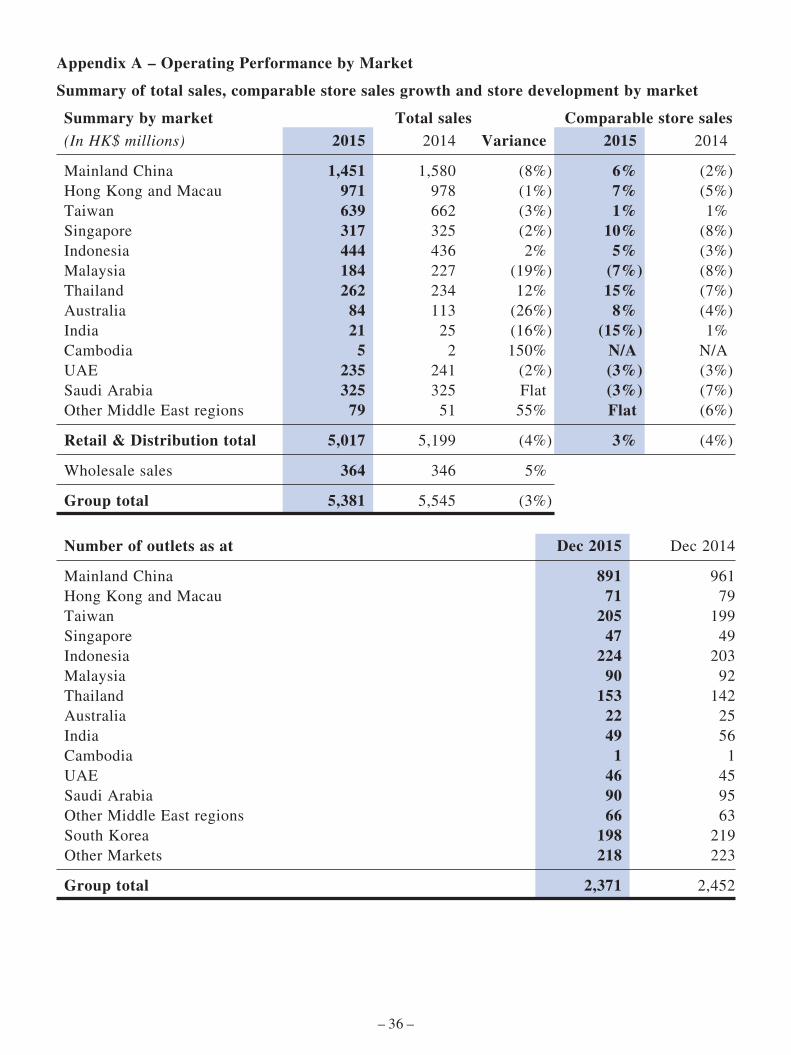
Appendix A – Operating Performance by Market
Summary of total sales, comparable store sales growth and store development by market
Summary by market Total sales Comparable store sales
(InHK$millions) 2015 2014 Variance 2015 2014
Mainland China 1,451 1,580 (8%) 6% (2%)Hong Kong and Macau 971 978 (1%) 7% (5%)Taiwan 639 662 (3%) 1% 1%Singapore 317 325 (2%) 10% (8%)Indonesia 444 436 2% 5% (3%)Malaysia 184 227 (19%) (7%) (8%)Thailand 262 234 12% 15% (7%)Australia 84 113 (26%) 8% (4%)India 21 25 (16%) (15%) 1%Cambodia 5 2 150% N/A N/AUAE 235 241 (2%) (3%) (3%)Saudi Arabia 325 325 Flat (3%) (7%)Other Middle East regions 79 51 55% Flat (6%)
Retail & Distribution total 5,017 5,199 (4%) 3% (4%)
Wholesale sales 364 346 5%
Group total 5,381 5,545 (3%)
Number of outlets as at Dec 2015 Dec 2014
Mainland China 891 961Hong Kong and Macau 71 79Taiwan 205 199Singapore 47 49Indonesia 224 203Malaysia 90 92Thailand 153 142Australia 22 25India 49 56Cambodia 1 1UAE 46 45Saudi Arabia 90 95Other Middle East regions 66 63South Korea 198 219Other Markets 218 223
Group total 2,371 2,452
– 37 –
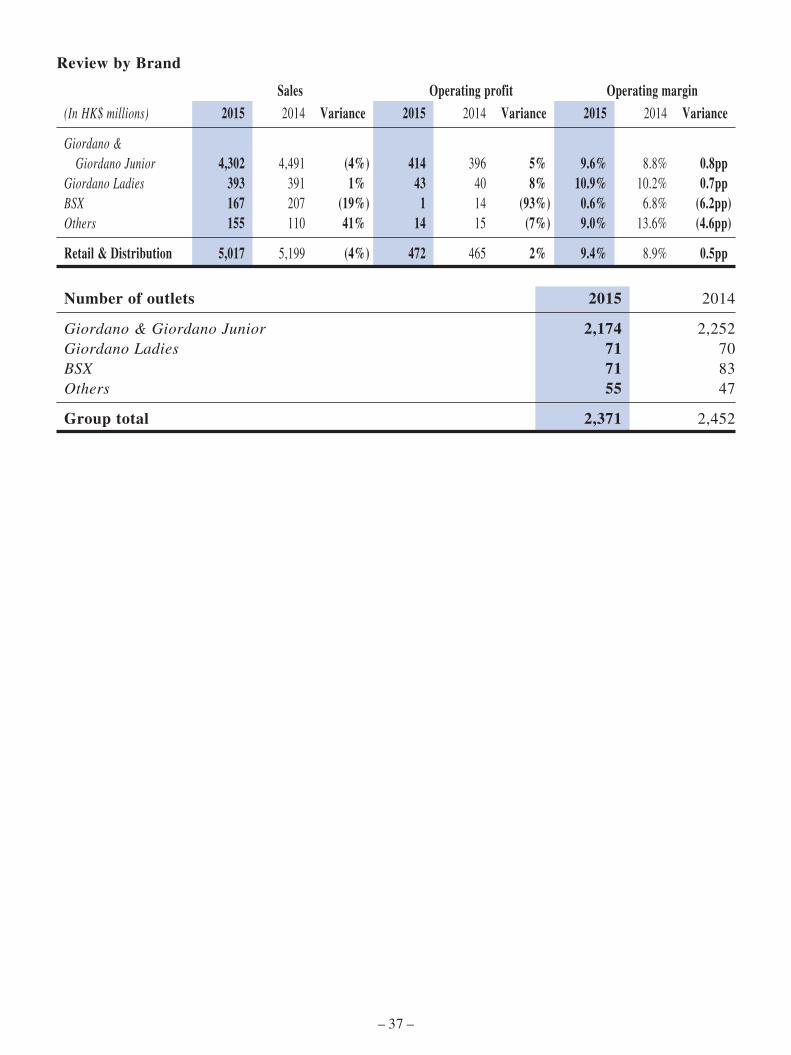
Review by Brand
Sales Operating profit Operating margin
(InHK$millions) 2015 2014 Variance 2015 2014 Variance 2015 2014 Variance
Giordano & Giordano Junior 4,302 4,491 (4%) 414 396 5% 9.6% 8.8% 0.8ppGiordano Ladies 393 391 1% 43 40 8% 10.9% 10.2% 0.7ppBSX 167 207 (19%) 1 14 (93%) 0.6% 6.8% (6.2pp)Others 155 110 41% 14 15 (7%) 9.0% 13.6% (4.6pp)
Retail & Distribution 5,017 5,199 (4%) 472 465 2% 9.4% 8.9% 0.5pp
Number of outlets 2015 2014
Giordano & Giordano Junior 2,174 2,252Giordano Ladies 71 70BSX 71 83Others 55 47
Group total 2,371 2,452

– 38 –
Mainland China
Full Year Second Half First Half
(InHK$millions) 2015 2014 Variance 2015 2014 Variance 2015 2014 Variance
Total sales 1,451 1,580 (8%) 689 807 (15%) 762 773 (1%) Retail self-operated stores 1,060 1,163 (9%) 497 589 (16%) 563 574 (2%) Wholesale to franchisees 391 417 (6%) 192 218 (12%) 199 199 Flat
Total brand sales 1,737 1,846 (6%) 818 918 (11%) 919 928 (1%) Self-operated stores 1,060 1,142 (7%) 504 577 (13%) 556 565 (2%) Franchised stores 677 704 (4%) 314 341 (8%) 363 363 Flat
Comparable store sales 6% (2%) Flat 1% 12% (5%)
Gross profit 776 847 (8%) 375 420 (11%) 401 427 (6%)Gross profit margin 53.5% 53.6% (0.1pp) 54.4% 52.0% 2.4pp 52.6% 55.2% (2.6pp)
Operating expenses (714) (823) (13%) (338) (412) (18%) (376) (411) (9%)Operating profit 90 59 53% 49 29 69% 41 30 37%Operating margin 6.2% 3.7% 2.5pp 7.1% 3.6% 3.5pp 5.4% 3.9% 1.5pp
Number of outlets 891 961 (70) 891 961 (70) 928 1,066 (138) Self-operated stores 374 472 (98) 374 472 (98) 435 503 (68) Franchised stores 517 489 28 517 489 28 493 563 (70)
Net change in outlets during the period (70) (200) (37) (105) (33) (95) Self-operated stores (98) (60) (61) (31) (37) (29) Franchised stores 28 (140) 24 (74) 4 (66)
Brand sales growth in Mainland China for the last eight quarters
-20%
-15%
-10%
-5%
0%
5%
10%
15%
20%
First Quarter
2014
SecondQuarter
2014
ThirdQuarter
2014
FourthQuarter
2014
First Quarter
2015
SecondQuarter
2015
ThirdQuarter
2015
FourthQuarter
2015
-11%
-15%
-10% -7%-6%
-10%
14%
10%
4%
-3%
-10%
1%
1% 1% 1%-2%
Total Brand Sales Growth Comparable Store Sales Growth
– 39 –
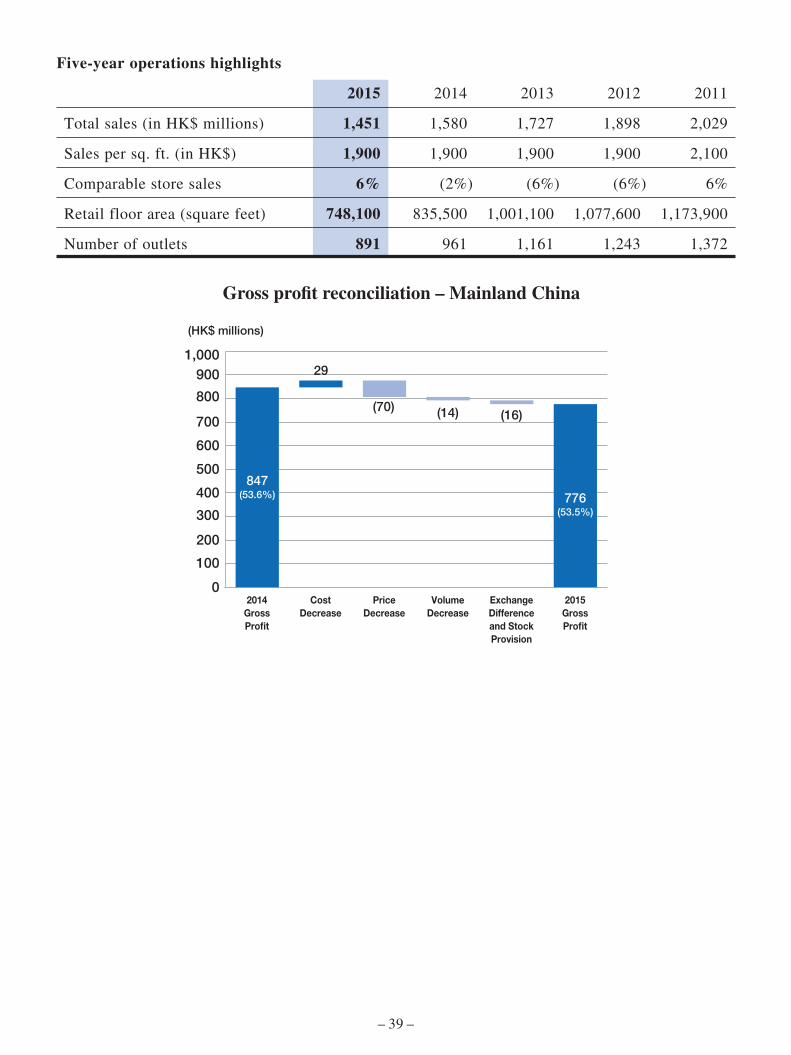
Five-year operations highlights
2015 2014 2013 2012 2011
Total sales (in HK$ millions) 1,451 1,580 1,727 1,898 2,029
Sales per sq. ft. (in HK$) 1,900 1,900 1,900 1,900 2,100
Comparable store sales 6% (2%) (6%) (6%) 6%
Retail floor area (square feet) 748,100 835,500 1,001,100 1,077,600 1,173,900
Number of outlets 891 961 1,161 1,243 1,372
0
100
200
300
400
500
600
700
800
9001,000
776(53.5%)
847(53.6%)
2014GrossPro�t
CostDecrease
PriceDecrease
VolumeDecrease
ExchangeDifferenceand Stock Provision
2015GrossPro�t
29
(70)(16)(14)
(HK$ millions)
Gross pro�t reconciliation – Mainland China

– 40 –
Hong Kong and Macau
Full Year Second Half First Half
(InHK$millions) 2015 2014 Variance 2015 2014 Variance 2015 2014 Variance
Total sales 971 978 (1%) 492 508 (3%) 479 470 2%
Comparable store sales 7% (5%) 4% (5%) 8% (6%)
Gross profit 646 658 (2%) 325 338 (4%) 321 320 FlatGross profit margin 66.5% 67.3% (0.8pp) 66.1% 66.5% (0.4pp) 67.0% 68.1% (1.1pp)
Operating expenses (579) (583) (1%) (288) (292) (1%) (291) (291) FlatOperating profit 70 75 (7%) 38 45 (16%) 32 30 7%Operating margin 7.2% 7.7% (0.5pp) 7.7% 8.9% (1.2pp) 6.7% 6.4% 0.3pp
Number of outlets 71 79 (8) 71 79 (8) 74 83 (9)Net change in outlets during the period (8) (9) (3) (4) (5) (5)
Brand sales growth in Hong Kong and Macau for the last eight quarters
-10%
-5%
0%
5%
10%
15%
First Quarter
2014
SecondQuarter
2014
ThirdQuarter
2014
FourthQuarter
2014
First Quarter
2015
SecondQuarter
2015
ThirdQuarter
2015
FourthQuarter
2015
-1%
-8%
-7%-6%
-4%
-3%
12%
4%
12%
-2%
4%6%
-4% -5%
-7% -8%
Total Brand Sales Growth Comparable Store Sales Growth

– 41 –
Five-year operations highlights
2015 2014 2013 2012 2011
Total sales (in HK$ millions) 971 978 1,042 1,024 997
Sales per sq. ft. (in HK$) 10,700 10,700 12,400 13,400 12,500
Comparable store sales 7% (5%) 2% 11% 23%
Retail floor area (square feet) 90,100 92,200 90,800 84,200 77,500
Number of outlets 71 79 88 84 73
Gross profit reconciliation – Hong Kong & Macau
0
100
200
300
400
500
600
700
800
646(66.5%)
658(67.3%)
2014GrossPro�t
CostDecrease
PriceDecrease
VolumeIncrease
Stock Provision
2015GrossPro�t
29
(2)
(106)
67
(HK$ millions)
– 42 –
Taiwan
Full Year Second Half First Half
(InHK$millions) 2015 2014 Variance 2015 2014 Variance 2015 2014 Variance
Total sales 639 662 (3%) 299 346 (14%) 340 316 8%
Comparable store sales 1% 1% (8%) 6% 12% (4%)
Gross profit 374 388 (4%) 175 203 (14%) 199 185 8%Gross profit margin 58.5% 58.6% (0.1pp) 58.5% 58.7% (0.2pp) 58.5% 58.5% Flat
Operating expenses (329) (335) (2%) (160) (173) (8%) (169) (162) 4%Operating profit 49 55 (11%) 18 31 (42%) 31 24 29%Operating margin 7.7% 8.3% (0.6pp) 6.0% 9.0% (3.0pp) 9.1% 7.6% 1.5pp
Number of outlets 205 199 6 205 199 6 201 199 2Net change in outlets during the period 6 (2) 4 − 2 (2)
Brand sales growth in Taiwan for the last eight quarters
-15%
-10%
-5%
0%
5%
10%
15%
20%
First Quarter
2014
SecondQuarter
2014
ThirdQuarter
2014
FourthQuarter
2014
First Quarter
2015
SecondQuarter
2015
ThirdQuarter
2015
FourthQuarter
2015
-13%-11%
-10%
3%
1%
5%
18%
5%
0%5%
-1%
16%
3%
6%
4%
-13%
Total Brand Sales Growth Comparable Store Sales Growth
– 43 –
Five-year operations highlights
2015 2014 2013 2012 2011
Total sales (in HK$ millions) 639 662 683 732 762
Sales per sq. ft. (in HK$) 3,200 3,300 3,200 3,300 3,800
Comparable store sales 1% 1% (4%) (9%) 12%
Retail floor area (square feet) 202,000 200,600 205,500 220,900 219,500
Number of outlets 205 199 201 214 208
0
50
100
150
200
250
300
350
400
450
374(58.5%)
388(58.6%)
2014GrossPro�t
Decrease inmerchandise
cost
PriceIncrease
Currencydepreciation
loss onpurchase
VolumeIncrease
ExchangeDifferenceand Stock Provision
2015GrossPro�t
10
(12) (18)
5 1
(HK$ millions)
Gross pro�t reconciliation – Taiwan

– 44 –
Rest of Asia Pacific
Full Year Second Half First Half
(InHK$millions) 2015 2014 Variance 2015 2014 Variance 2015 2014 Variance
Total sales 1,317 1,362 (3%) 679 733 (7%) 638 629 1%
Comparable store sales 6% (6%) 3% (4%) 9% (9%)
Gross profit 773 821 (6%) 391 433 (10%) 382 388 (2%)Gross profit margin 58.7% 60.3% (1.6pp) 57.6% 59.1% (1.5pp) 59.9% 61.7% (1.8pp)
Operating expenses (622) (655) (5%) (309) (332) (7%) (313) (323) (3%)Operating profit 151 169 (11%) 83 100 (17%) 68 69 (1%)Operating margin 11.5% 12.4% (0.9pp) 12.2% 13.6% (1.4pp) 10.7% 11.0% (0.3pp)
Number of outlets 586 568 18 586 568 18 559 555 4Net change in outlets during the period 18 20 27 13 (9) 7
Brand sales growth in Rest of Asia Pacific for the last eight quarters
-15%
-10%
-5%
0%
5%
10%
15%
First Quarter
2014
SecondQuarter
2014
ThirdQuarter
2014
FourthQuarter
2014
First Quarter
2015
SecondQuarter
2015
ThirdQuarter
2015
FourthQuarter
2015
0%
-11%
-6%
-9%
-8%
2%
13%
8% 8%
7% 8%
12%
0%
-4%
3% 3%
Total Brand Sales Growth Comparable Store Sales Growth

– 45 –
Five-year operations highlights
2015 2014 2013 2012 2011
Total sales (in HK$ millions) 1,317 1,362 1,460 1,427 1,328
Sales per sq. ft. (in HK$) 2,600 2,800 3,300 3,500 3,700
Comparable store sales 6% (6%) 2% 3% 8%
Retail floor area (square feet) 558,784 518,900 489,800 428,900 380,200
Number of outlets 586 568 548 482 417
0
100
200
300
400
500
600
700
800
9001,000
773(58.7%)
821(60.3%)
2014Gross Pro�t
Currencydepreciation
loss onpurchase
PriceIncrease
VolumeIncrease
ExchangeDifferenceand StockProvision
2015GrossPro�t
15
(64)
3257
(88)
(HK$ millions)
Decrease inmerchandise
cost
Gross pro�t reconciliation – Rest of Asia Paci�c
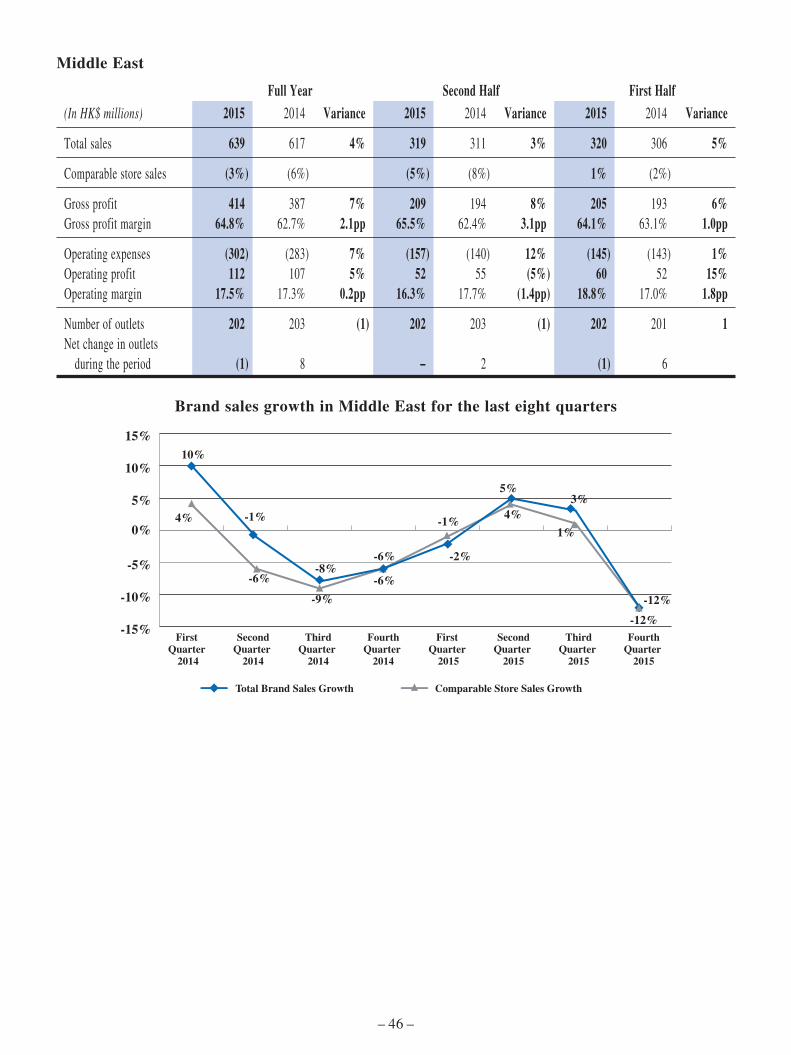
– 46 –
Middle East
Full Year Second Half First Half
(InHK$millions) 2015 2014 Variance 2015 2014 Variance 2015 2014 Variance
Total sales 639 617 4% 319 311 3% 320 306 5%
Comparable store sales (3%) (6%) (5%) (8%) 1% (2%)
Gross profit 414 387 7% 209 194 8% 205 193 6%Gross profit margin 64.8% 62.7% 2.1pp 65.5% 62.4% 3.1pp 64.1% 63.1% 1.0pp
Operating expenses (302) (283) 7% (157) (140) 12% (145) (143) 1%Operating profit 112 107 5% 52 55 (5%) 60 52 15%Operating margin 17.5% 17.3% 0.2pp 16.3% 17.7% (1.4pp) 18.8% 17.0% 1.8pp
Number of outlets 202 203 (1) 202 203 (1) 202 201 1Net change in outlets during the period (1) 8 − 2 (1) 6
Brand sales growth in Middle East for the last eight quarters
-15%
-10%
-5%
0%
5%
10%
15%
First Quarter
2014
SecondQuarter
2014
ThirdQuarter
2014
FourthQuarter
2014
First Quarter
2015
SecondQuarter
2015
ThirdQuarter
2015
FourthQuarter
2015
-12%
4%
10%
-9%
-6% -6%
-1%
5%3%
4%
1%
-2%
-1%
-8%-6%
-12%
Total Brand Sales Growth Comparable Store Sales Growth

– 47 –
0
50
100
150
200
250
300
350
400
450
414(64.8%)387
(62.7%)
2014GrossPro�t
CostDecrease
PriceIncrease
VolumeDecrease
Kuwaitand Qataracquisition
Exchangedifference and StockProvision
2015GrossPro�t
7(21)
2722
(8)
(HK$ millions)
Gross pro�t reconciliation – Middle East
Wholesale Sales to Overseas Franchisees and Joint Ventures
Full Year Second Half First Half
(InHK$millions) 2015 2014 Variance 2015 2014 Variance 2015 2014 Variance
Total sales 364 346 5% 167 168 (1%) 197 178 11%
Number of outlets 416 442 (26) 416 442 (26) 414 449 (35)Net change in outlets during the period (26) (7) 2 (7) (28) −
Intercompany margin Wholesale sales to overseas
0
20
40
60
80
100
120
83
114
31(8.5%)
84
113
29(8.4%)
(HK$ millions)
2014 2015
Gross pro�t – Wholesale sales and intra Group

– 48 –
DIVIDENDS
It is the Company’s intention to return surplus cash to its shareholders through the payment of dividends. In line with its dividend policy, the Company has been paying a substantial portion of its earnings as an ordinary dividend, the amount of which may vary depending on cash on hand, future investment requirements and working capital considerations.
After due consideration of the economic outlook, the Group’s financial position, its future expansion plans and other factors, the Board has resolved to recommend to shareholders the payment of a final dividend of 14.5 HK cents per share (2014: 14.5 HK cents per share) for the year ending December 31, 2015. Together with the interim dividend of 12.5 HK cents per share (2014: 10.5 HK cents per share) paid on September 25, 2015, total 2015 dividend would amount to 27.0 HK cents per share (2014: 25.0 HK cents per share), representing a payout of 99% of 2015 per share earnings (2014: 96%). Subject to the approval of shareholders at the forthcoming Annual General Meeting, the final dividend will be payable on or about Friday, June 24, 2016 to shareholders whose names appear on the register of members of the Company on Wednesday, June 8, 2016.
ANNUAL GENERAL MEETING
It is proposed that the Annual General Meeting of the Company will be held on Friday, May 27, 2016. For details of the Annual General Meeting, please refer to the Notice of Annual General Meeting, which is expected to be published in due course.
CLOSURE OF REGISTER OF MEMBERS
The Register of Members of the Company will be closed for the following periods:
(a) For the purpose of determining shareholders who are entitled to attend and vote at the 2016 Annual General Meeting to be held on Friday May 27 2016 (“2016 AGM”), the Register of Members of the Company will be closed from Tuesday, May 24, 2016 to Friday, May 27, 2016, both days inclusive, during which period no transfer of shares will be registered. In order to qualify for attending and voting at the 2016 AGM, all transfer documents accompanied by the relevant share certificates must be lodged with the Company’s branch share registrars in Hong Kong, Tricor Abacus Limited, at Level 22, Hopewell Centre, 183 Queen’s Road East, Hong Kong for registration no later than 4:30 p.m. on Monday,May 23, 2016.
(b) For the purpose of determining shareholders who qualify for the proposed final dividend, the Register of Members of the Company will be closed from Monday, June 6, 2016 to Wednesday, June 8, 2016, both days inclusive, during which period no transfer of shares will be registered. In order to qualify for the proposed final dividend, all transfer documents accompanied by the relevant share certificates must be lodged with the Company’s branch share registrars in Hong Kong, Tricor Abacus Limited, Level 22, Hopewell Centre, 183 Queen’s Road East, Hong Kong for registration no later than 4:30 p.m. on Friday,June 3, 2016.

– 49 –
CORPORATE GOVERNANCE
The Company has complied with all the applicable code provisions in the Corporate Governance Code (“the CG Code”) as set out in Appendix 14 of the Rules Governing the Listing of Securities on The Stock Exchange of Hong Kong Limited throughout the year ended December 31, 2015, except that Code Provision A.2.1 – the roles of the Chairman and Chief Executive are vested in the same person and Code Provision A.4.2 of the CG Code – the Chairman and the Chief Executive are not subject to retirement by rotation. Currently, Dr. LAU Kwok Kuen, Peter (“Dr. Lau”) holds the positions of Chairman and Chief Executive. In view of Dr. Lau’s extensive experience in the industry and deep understanding of the Group’s businesses, the Board believes that vesting the roles of both Chairman and Chief Executive in Dr. Lau provides the Group with strong and consistent leadership, allows for more effective planning and execution of long term business strategies and enhances efficiency in decision-making. The Board also believes that the Company already has a strong corporate governance structure appropriate for its circumstances in place to ensure effective oversight of Management.
REVIEW OF FINANCIAL STATEMENTS AND PRELIMINARY RESULTS ANNOUNCEMENT
The Group’s audited consolidated financial statements for the year ended December 31, 2015 including the accounting principles and practices adopted have been reviewed by the Audit Committee in conjunction with the Company’s external auditor.
The figures in respect of the preliminary announcement of the Group’s results for the year ended December 31, 2015 have been agreed by the Group’s auditor, PricewaterhouseCoopers (“PwC”), to the amounts set out in the Group’s audited consolidated financial statements for the year. The work performed by PwC Hong Kong did not constitute an assurance engagement and consequently no assurance has been expressed by PwC Hong Kong on the preliminary announcement.
PURCHASE, SALE OR REDEMPTION OF THE COMPANY’S LISTED SECURITIES
Neither the Company nor any of its subsidiaries purchased, sold or redeemed any of the Company’s listed securities during the year.
By Order of the BoardLAU Kwok Kuen, Peter
Chairman
Hong Kong, March 3, 2016
As at the date of this announcement, the directors of the Company are:Executive Directors: Dr. LAU Kwok Kuen, Peter, Mr. Ishwar Bhagwandas CHUGANI;Mr. Dominic Leo Richard IRWIN and Dr. CHAN Ka Wai;Non-executive Directors: Dr. CHENG Chi Kong, Adrian and Mr. CHAN Sai Cheong; andIndependent Non-executive Directors: Dr. Barry John BUTTIFANT, Mr. KWONG Ki Chi,Professor WONG Yuk (alias HUANG Xu) and Mr. Simon Devilliers RUDOLPH.