Gigawatt Scale Storage for Gigawatt Scale Renewables
13
Journal of Energy and Power Engineering 12 (2018) 105-117 doi: 10.17265/1934-8975/2018.02.006 Gigawatt Scale Storage for Gigawatt Scale Renewables Mark Howitt Storelectric Ltd., 15 Weaver Close, Alsager, Stoke-on-Trent ST7 2NZ, England Abstract: Multi-GW renewables need multi-GW storage, or fossil fuelled power stations will be needed to balance for intermittency. For the same reason, such balancing must be able to last for an entire evening peak if renewables are not generating at the same time. Batteries and DSR (demand side response) make very useful contributions and there is a large market for both, but without large scale and long duration storage, they cannot do the job. Interconnectors also contribute to the solution, and storage will make them more profitable, but (taking a UK perspective) Ofgem identified that all our neighbours have similar generation capacity crunches and similar demand patters, so if we need the electricity when they do, we’ll have to pay through the nose for it. Last winter’s £ 1,500/MWh prices proved that―even with only 4 GW interconnection. Following exit from the single market, our neighbours will be able to say “our consumers are more important than yours at any price”. We need UK-based storage at the right scale, to store UK-generated electricity for UK use and for export―otherwise we lose security of supply. CAES (compressed air energy storage) and pumped hydro are the only technologies currently able to deliver this scale and duration of storage. Pumped hydro is cost-effective in the long term but there are few sites, and it is (location dependent) over 3x the cost of CAES. Storelectric has 2 versions of CAES: one is a comparable price to existing CAES, but much more efficient (~70% v 50%) and zero emissions (existing CAES emits 50%-60% of the gas of an equivalent sized power station). The other is retro-fittable to suitable gas power stations, is more efficient (~60% v 50%), almost halves their emissions, adds storage-related revenue streams and is much cheaper. Both are new configurations of existing and well proven technologies, supported by engineering majors. Key words: Electricity storage, CAES, compressed air energy storage, adiabatic, grid balancing, renewable. 1. Introduction Many people have suggested that batteries, demand side response and interconnectors are a viable way forward for balancing a future renewable grid in general, and for grid-scale electricity storage in particular, and some have cast doubt on whether there is a role for CAES (compressed air energy storage) or increased amounts of PHES (pumped hydro energy storage). However CAES, batteries and the other storage technologies are very different technologies, for different scales, durations and duty cycles. There is a role for all of them, with each having its optimal niches. Therefore we consider them under the following headings, which are the headings of this report: (1) The challenge; (2) Power; Corresponding author: Mark Howitt, BSc (Hons) Physics with Electronics, entrepreneur. (3) Capacity; (4) Response time, duty cycles, ancillary services. There are also additional considerations, such as: (1) Cost, lifetime and efficiency; (2) Environmental considerations; (3) Cost and performance summary; (4) Global potential; (5) Other analysts’ views. The final section looks at the quantity of storage required, and how the different technologies fit together. This paper analyses the issues from a UK perspective, but the lessons apply equally to grids globally as they de-carbonise. 2. The Challenge While many countries are targeting 80% reductions in greenhouse gas emissions by 2050 as compared with 2010 levels [1] (the EU is targeting 80-95% reduction [2]), different sectors of the economy face different D DAVID PUBLISHING
Transcript of Gigawatt Scale Storage for Gigawatt Scale Renewables

Journal of Energy and Power Engineering 12 (2018) 105-117 doi: 10.17265/1934-8975/2018.02.006
Gigawatt Scale Storage for Gigawatt Scale Renewables
Mark Howitt
Storelectric Ltd., 15 Weaver Close, Alsager, Stoke-on-Trent ST7 2NZ, England
Abstract: Multi-GW renewables need multi-GW storage, or fossil fuelled power stations will be needed to balance for intermittency. For the same reason, such balancing must be able to last for an entire evening peak if renewables are not generating at the same time. Batteries and DSR (demand side response) make very useful contributions and there is a large market for both, but without large scale and long duration storage, they cannot do the job. Interconnectors also contribute to the solution, and storage will make them more profitable, but (taking a UK perspective) Ofgem identified that all our neighbours have similar generation capacity crunches and similar demand patters, so if we need the electricity when they do, we’ll have to pay through the nose for it. Last winter’s £ 1,500/MWh prices proved that―even with only 4 GW interconnection. Following exit from the single market, our neighbours will be able to say “our consumers are more important than yours at any price”. We need UK-based storage at the right scale, to store UK-generated electricity for UK use and for export―otherwise we lose security of supply. CAES (compressed air energy storage) and pumped hydro are the only technologies currently able to deliver this scale and duration of storage. Pumped hydro is cost-effective in the long term but there are few sites, and it is (location dependent) over 3x the cost of CAES. Storelectric has 2 versions of CAES: one is a comparable price to existing CAES, but much more efficient (~70% v 50%) and zero emissions (existing CAES emits 50%-60% of the gas of an equivalent sized power station). The other is retro-fittable to suitable gas power stations, is more efficient (~60% v 50%), almost halves their emissions, adds storage-related revenue streams and is much cheaper. Both are new configurations of existing and well proven technologies, supported by engineering majors. Key words: Electricity storage, CAES, compressed air energy storage, adiabatic, grid balancing, renewable.
1. Introduction
Many people have suggested that batteries, demand
side response and interconnectors are a viable way
forward for balancing a future renewable grid in
general, and for grid-scale electricity storage in
particular, and some have cast doubt on whether there
is a role for CAES (compressed air energy storage) or
increased amounts of PHES (pumped hydro energy
storage).
However CAES, batteries and the other storage
technologies are very different technologies, for
different scales, durations and duty cycles. There is a
role for all of them, with each having its optimal niches.
Therefore we consider them under the following
headings, which are the headings of this report:
(1) The challenge;
(2) Power;
Corresponding author: Mark Howitt, BSc (Hons) Physics
with Electronics, entrepreneur.
(3) Capacity;
(4) Response time, duty cycles, ancillary services.
There are also additional considerations, such as:
(1) Cost, lifetime and efficiency;
(2) Environmental considerations;
(3) Cost and performance summary;
(4) Global potential;
(5) Other analysts’ views.
The final section looks at the quantity of storage
required, and how the different technologies fit
together.
This paper analyses the issues from a UK
perspective, but the lessons apply equally to grids
globally as they de-carbonise.
2. The Challenge
While many countries are targeting 80% reductions
in greenhouse gas emissions by 2050 as compared with
2010 levels [1] (the EU is targeting 80-95% reduction
[2]), different sectors of the economy face different
D DAVID PUBLISHING

Gigawatt Scale Storage for Gigawatt Scale Renewables
106
levels of difficulty in de-carbonising. Because
ground-based power sector will find it easier to
de-carbonise than (for example) aviation and shipping,
the EU has identified that in order to achieve those
targets across the entire economy, the power sector
needs to de-carbonise completely [2]. Grids will
simultaneously have to expand to support the
de-carbonisation of other sectors, for example heating,
transportation and manufacturing.
The challenge is to enable renewables to power an
entire and growing grid, with or without nuclear. The
difference that nuclear makes is how much baseload
power renewables would supply—it is therefore a
matter of quantity, not quality, so the following covers
either case. The role of the balancing technologies is to
enable intermittent generation to supply both variable
and baseload demand.
The scenario on which most grid players (operators,
regulators, generators, storage providers etc.) focus is
to address the rapid ramp rates of renewables in (for
example) gusty or intermittently cloudy weather (one
aspect of the intermittency challenge), and also the
similarly rapid ramp rates, both upwards and
downwards, in demand (dispatchability). Batteries and
DSR (demand side response) are well suited to this,
over limited power ranges.
For longer term fluctuations the grid players rely on
interconnectors. However this does not consider a
number of factors, including:
(1) Energy flows through interconnectors are often
contracted well in advance and to that extent cannot be
varied according to shorter term conditions;
(2) Demand and supply are often highly correlated at
both ends of an interconnector, so a shortfall at one end
is matched with a shortfall at the other;
(3) Weather patterns can cover both ends of
interconnectors, and wider regions, for up to a fortnight
at a time;
(4) Where legally permissible (e.g. between nation
states outside free trade pacts, such as post-Brexit
Britain), each country would favour their own
consumers’ needs.
This leaves three scenarios that are not catered for by
grid players’ current plans: winter evening peaks,
widespread shortfalls and widespread weather patterns.
2.1 Winter Evening Peaks Scenario
When the sun goes down on a windless winter
afternoon, a long period of peak demand is in prospect
with negligible renewable generation. The duration of
this peak vastly exceeds the power and duration
capabilities of batteries and DSR, and are likely to
exceed the available (un-contracted) capacity of
interconnectors.
2.2 Widespread Shortfalls Scenario
In May 2017, two-thirds of French nuclear power
generation was down for a mix of planned and
unplanned outages [3]. This caused knock-on effects
throughout Western Europe despite the currently
restricted sizes of the interconnectors with France.
Imbalance prices shot up in the UK to over £ 1,500/
MWh, against typical normal prices of £ 40-50/MWh.
2.3 Widespread Weather Patterns Scenario
Weather patterns often do not just cover one country,
they can cover large proportions of a continent, and can
do so for many days at a time—as they did at the end of
February and early March this year [4]. Over such
extended periods and geographies, most countries
within a network of interconnectors are affected
similarly, so the interconnectors do not help. And they
are affected for a long time, so batteries and DSR do
not stand a chance.
3. Power
Energy storage is required at a number of different
scales. We divide them into five bands, as Table 1.
The largest battery currently installed anywhere is
100 MW, with 1 hour duration [5]. These are used to
alleviate local and domestic line capacity constraints,
and to provide a small amount of time-shifting of

Gigawatt Scale Storage for Gigawatt Scale Renewables
107
Table 1 Scales of storage: size.
Scale Power Technologies best suited
Domestic < 100 kW Batteries, supercapacitors, flywheels
Local < 1 MW Batteries, supercapacitors, flywheels, cryogenic
Area < 10 MW Cryogenic, heat, poss. large batteries, poss. CAES
Regional < 100 MW CAES, pumped hydro, poss. heat
Grid > 100 MW CAES, pumped hydro
energy, i.e. making it available at a time other than
when it was generated.
It is possible to increase batteries’ rated power
cheaply, though this would entail reducing their
capacity (duration of output at full power)
proportionately. Thus a 20 MWh battery could produce
10 MW for 2 hours or 40 MW for 30 minutes,
assuming that the electrical circuits and signal
conditioning can take it.
Although there have been start-ups offering
small-scale CAES, Storelectric and most other CAES
companies believe that it is best suited to large-scale
applications, of 100 MW or more. Storelectric offers
efficient solutions rated from 40 MW to GW, with the
potential for smaller ratings either in the future or with
decreasing efficiency and cost-effectiveness. Power is
determined by the design, specification and cost of all
the surface systems, and is therefore the main driver
behind the cost of a CAES plant—though the cost per
MW of power decreases rapidly as size increases. A
good rule of thumb is that whereas batteries increase in
cost by ~85% when doubling either their power rating
(at constant duration) or their duration (at constant
rating), Storelectric’s CAES increases by ~1/3.
4. Capacity
Energy storage is required at a number of different
scales, which we define thus as Table 2.
All grid-connected batteries to date have had a
storage capacity of between 0.25 and 2 hours’ output at
full rated power. Therefore they are best suited to
applications that require such durations of output, or
(better) less: if less, then they can produce output on
multiple occasions between charges.
Table 2 Scales of storage: capacity.
Scale Capacity Technologies best suited
Domestic < 250 kWh Batteries, supercapacitors, flywheels
Local < 5 MWh Batteries, supercapacitors, cryogenic
Area < 50 MWhCryogenic, heat, poss. large batteries, poss. CAES
Regional < 500 MWh CAES, pumped hydro, poss. heat
Grid > 500 MWh CAES, pumped hydro
Doubling the capacity of a grid-connected battery
costs at least 80% of the original cost, as twice the
number of batteries are needed, and other system
elements (such as air conditioning) need to be
(approximately) doubled. Capacity is the main cost
driver for batteries.
The total output of Tesla’s Gigafactory (under
construction) is 35 GWh p.a. by 2020. A single CAES
plant could have this capacity.
Although there have been start-ups offering CAES
storing energy in cylinders, Storelectric believes that
such technologies are unlikely to be cost-effective in
the near future. Geological storage is much larger scale
and cheaper.
Storelectric can store its air in salt caverns now. Salt
caverns are solution mined, a slow but relatively cheap
process, depending on geology and geography: the
geology must offer salt and mudstone strata
sufficiently deep, and the geography must offer a
source of water, and a destination (either industry or the
sea) for brine. With these caveats, the cost of capacity
is ~$6/kWh, or $6 m/GWh, to use the same surface
equipment.
Notably, there are salt basins across the world; in
Europe there are sufficient to store a week’s worth of
the continent’s total energy demand; similar amounts
could also be stored in North America, North Africa,
the Middle East and elsewhere.
In future it will be able to store air in six other
geologies, which would open up virtually the
entire planet to CAES. Most of these are in porous rock
(e.g. aquifers, depleted hydrocarbon wells) and
therefore offer much larger scale storage, much more
cheaply.

Gigawatt Scale Storage for Gigawatt Scale Renewables
108
5. Response Time, Duty Cycles, Ancillary Services
5.1 Response Time
Batteries have a very rapid response time: they can
usually be operational and synchronised with the grid
within a second. They can also remain on standby with
low energy consumption. Only supercapacitors and
flywheels are faster, and these have much lower
capacity (duration). The “virtual storage” derived from
Demand Side Response can also match it, provided
permission is not required before use.
CAES and Pumped Hydro are rather slower. They
can respond with 30 seconds, though a smaller plant (of
either type) optimised for speed of response could
respond within 10 seconds if kept spinning and
synchronised: CAES would do this using the generator
(without load) as a motor, and therefore consuming
little power.
5.2 Duty Cycles
Batteries are best suited to duty cycles that last from
minutes to half an hour or more, repeating in order to
provide levelling for intermittent generation, and to
satisfy demand spikes without burdening the remainder
of the grid.
CAES and pumped hydro are best suited to duty
cycles from minutes to entire peak periods or even days,
though can be optimised for quicker response times.
This provides (with zero or very low emissions) the
system back-up and resilience that are currently being
provided by gas-fired peaking plants at great cost and
with substantial emissions.
5.3 Other Ancillary Services
CAES, pumped hydro and flywheels offer another
valuable service that batteries and supercapacitors
cannot: inertia to increase loss-of-infeed tolerance and
short circuit level, and stabilise the grid in other ways.
This is the immediate inertial response of a system to
rapid faults, which grid operators value very highly.
Indeed, if they deem there to be insufficient inertia on
the system (for example, excessive proportions of
power coming from non-synchronous sources such as
wind turbines, solar panels and interconnectors), they
will invest millions to build plants solely to provide
inertia. They also offer reactive load, and can help
suppress voltage dips and harmonics.
6. Cost, Lifetime and Efficiency
6.1 Cost
According to Lazards’ analysis
(www.lazard.com/insights), comparing the costs of
various power sources in America (where planning,
construction, gas and coal prices are all cheap), CAES
is much cheaper per MWh of power than batteries.
Indeed, Storelectric’s CAES is cheaper than an
equivalent sized gas-fired peaking plant (OCGT),
based on a plant generating 500 MW and a capacity of
6-21 GWh.
Note that there is no comparison of storage capacity.
For batteries, a storage capacity of 1-2 hours’ duration
at peak load is assumed. The figures for CAES are for
between 12 and 42 hours’ duration.
6.2 Lifetime
Depending on the temperatures and duty (load)
cycles to which a battery is subjected, the average
lifetime of a grid-connected battery is usually quoted as
5-8 years, Lithium chemistries being 5 years and
lead-acid 8 years.
In contrast, the lifetime of a CAES or pumped hydro
installation is expected to be 40 years for the top-side
equipment (with a mid-life overhaul) and over 100
years for the caverns. Huntorf received a mid-life
upgrade in 2006, aged 28 years, and is still
operating—at a higher capacity (321 MW vs. 290 MW
as first built) than originally.
6.3 Efficiency
CAES has various quoted levels of efficiency.
Storelectric’s is much better:

Gigawatt Scale Storage for Gigawatt Scale Renewables
109
Huntorf (traditional OCGT-based CAES): 42%;
McIntosh (traditional CCGT-based CAES): 50%;
Dresser Rand’s Smart CAES (an evolution of
McIntosh): up to 54%;
Storelectric, with thermal energy storage:
68-70%.
Battery advocates often quote efficiencies of
85%-97%, but these are battery-only performances
with small-scale installations. Large installations
require huge parasitic/ancillary loads, especially air
conditioning. Northern Power Grid’s Customer-Led
Network Revolution, which concluded in December
2014, measured the actual round trip efficiency of
battery systems at the beginning of their life [6], shown
in Table 3.
In a recent public presentation, a senior manager of
Belectric stated “it is well known that” a 5-year-old
grid connected battery requires three times as much air
conditioning load as an otherwise identical new
installation, due to the rate of deterioration of the
battery. However there is little literature on this
because the rate of deterioration depends on the
temperatures and duty (load) cycles to which a battery
is subjected.
Table 3 Quoted and actual battery efficiencies, actual costs.
2.5 kVA, 5 MWh
100 kVA, 200 kWh
50 kVA, 100 kWh
Costexcl. installation
£ 3.76 m £ 406 k £ 331 k
£/MWh £ 752 k £ 2,030 k £ 3,310 k
Costinc. installation
£ 4.62 m £ 490 k £ 422 k
£/MWh £ 924 k £ 2,450 k £ 4,110 k
Nominal efficiency 83.2% 83.2% 83.2%
Measured efficiency
69.0% 56.3% 41.2%
Average parasiticload
29.5 kW 29.5 kW 29.5 kW
7. Cost and Performance Summary
The various technologies can be summarised
(excluding durations) in Table 4:
Table 4 Comparing electricity storage technologies.
Notes: (1) Dresser rand has 50%-60% of the natural gas burn (and emissions) of an equivalent sized CCGT; (2) Vanadium redox flow battery; (3) Flywheels’ normal duration is 5-15 minutes.
Key: Grid support FFR: Fast frequency response; FR: Frequency response; SU: Start-up (e.g. back-up to wind); LT: Long term (weekly or more).
Data sources for costs: Storelectric Ltd., based on a 500 MW, 6 GWh plant after the first 3-5 plants when CAPEX costs will have stabilised.
Size (up to) Grid Support Efficiency LCOE Capex
Technology Type 10 MW
100 MW
1 GW
>1 GW
FFR FR SU LT %$
/MWh$k
/kW$
/kWh
Storelectric CAES 68-70 100 1 116
Dresser Rand1 CAES 54 1 125 4.7 586
Pumped Hydro PHES 75-82 185 5.8 725
Highview Cryogenic 65? 210 1.36 340
Li-ion Battery 41-75 125 6 5454
Va Redox2 Flow Batt. 60-70 460 6.5 1300
Flywheels Flywheels 3 85-95 380 4.2 1700
Gigawatt Scale Storage for Gigawatt Scale Renewables
110
Dresser Rand: DoE (American Department of Energy) http://www.sandia.gov/ess/publications/SAND2015-1002.pdf. Brayton installations;
Highview: Highview Power Cost Estimator, http://www.highview-power.com/market/#calc-jumper using their default values (100 MW, 4 hours, standalone system). Levelised cost from http://cleanhorizon.com/images/slides/20140916_CleanHorizon_white_paper_3.pdf;
Pumped Hydro: DoE (American Department of Energy) http://www.sandia.gov/ess/publications/SAND2015-1002.pdf; Lithium Ion: Costs: DoE (American Department of Energy) http://www.sandia.gov/ess/publications/SAND2015-1002.pdf, taking
the three batteries with duration >1 hour (the remainder had durations of 0.25 hours), averaging them at $6,000/kWh for a 1.1 hr battery;
Lithium Ion: Efficiencies: http://www.networkrevolution.co.uk/project-library/electrical-energy-storage-cost-analysis/. Best efficiency is 69% including parasitic loads (bottom of p6) for a 5 MW system; the figures in the table assume that efficiencies increase with size;
Va Redox: DoE (American Department of Energy) http://www.sandia.gov/ess/publications/SAND2015-1002.pdf; Flywheels: DoE (American Department of Energy) http://www.sandia.gov/ess/publications/SAND2015-1002.pdf.
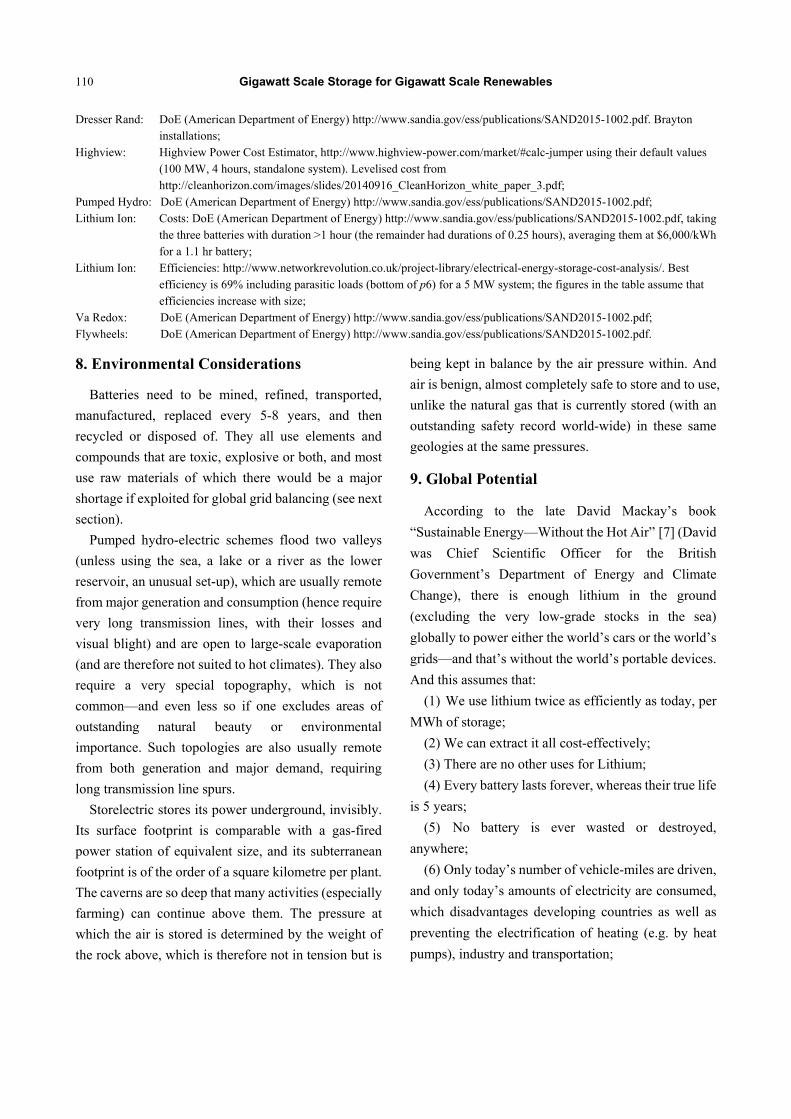
8. Environmental Considerations
Batteries need to be mined, refined, transported,
manufactured, replaced every 5-8 years, and then
recycled or disposed of. They all use elements and
compounds that are toxic, explosive or both, and most
use raw materials of which there would be a major
shortage if exploited for global grid balancing (see next
section).
Pumped hydro-electric schemes flood two valleys
(unless using the sea, a lake or a river as the lower
reservoir, an unusual set-up), which are usually remote
from major generation and consumption (hence require
very long transmission lines, with their losses and
visual blight) and are open to large-scale evaporation
(and are therefore not suited to hot climates). They also
require a very special topography, which is not
common—and even less so if one excludes areas of
outstanding natural beauty or environmental
importance. Such topologies are also usually remote
from both generation and major demand, requiring
long transmission line spurs.
Storelectric stores its power underground, invisibly.
Its surface footprint is comparable with a gas-fired
power station of equivalent size, and its subterranean
footprint is of the order of a square kilometre per plant.
The caverns are so deep that many activities (especially
farming) can continue above them. The pressure at
which the air is stored is determined by the weight of
the rock above, which is therefore not in tension but is
being kept in balance by the air pressure within. And
air is benign, almost completely safe to store and to use,
unlike the natural gas that is currently stored (with an
outstanding safety record world-wide) in these same
geologies at the same pressures.
9. Global Potential
According to the late David Mackay’s book
“Sustainable Energy—Without the Hot Air” [7] (David
was Chief Scientific Officer for the British
Government’s Department of Energy and Climate
Change), there is enough lithium in the ground
(excluding the very low-grade stocks in the sea)
globally to power either the world’s cars or the world’s
grids—and that’s without the world’s portable devices.
And this assumes that:
(1) We use lithium twice as efficiently as today, per
MWh of storage;
(2) We can extract it all cost-effectively;
(3) There are no other uses for Lithium;
(4) Every battery lasts forever, whereas their true life
is 5 years;
(5) No battery is ever wasted or destroyed,
anywhere;
(6) Only today’s number of vehicle-miles are driven,
and only today’s amounts of electricity are consumed,
which disadvantages developing countries as well as
preventing the electrification of heating (e.g. by heat
pumps), industry and transportation;

Gigawatt Scale Storage for Gigawatt Scale Renewables
111
(7) We ignore the scarcity of the other elements
(manganese, cobalt, nickel, and alloying metals) that
form an essential part of a modern lithium battery.
Clearly none of these assumptions is remotely
sustainable, except the first which may be achievable in
10-20 years. The only reason why lithium prices were
(until recently) dropping is because extraction
technologies and volumes are still improving faster
than demand: if demand was to grow to such global
levels, scarcity pricing would soon start.
According to information from the economist,
vehicles alone would exhaust the world’s stock of
lithium in 2-10 years for the number of battery vehicles
forecast in 2040 [8]1. This leaves nothing available for
portable devices or grid applications.
And batteries require other, scarcer, materials too,
such as cobalt and, somewhat less scarce, nickel.
In contrast, salt basins alone offer enormous
potential for CAES, referring to Fig. 1.
Note that global salt basins are:
On a scale that only shows one of the 10 UK
basins;
Only shown in countries that divulge their
geology publicly; and
Coincident with areas explored for
petrochemicals: it is not normal to seek salt basins, they
are found by accident;
Therefore there are many more, often
undiscovered as yet: we know of one three times the
1 https://www.economist.com/news/briefing/21726069-no- need-subsidies-higher-volumes-and-better-chemistry-are-causing-costs-plummet-after - Vehicles, 2016 25 GWh 750,000 vehicles Mid-range: 2040 Bloomberg 15,500 GWh 465,000,000 vehicles
2040 OPEC 5,000 GWh 150,000,000 vehicles 2040 ExxonMobil 3,000 GWh 90,000,000 vehicles
Total lithium, 2016 180,000 tonnes in one year 2040 Bloomberg 111,600,000 tonnes in one year,
just for vehicles 2040 OPEC 36,000,000 tonnes in one year,
just for vehicles 2040 ExxonMobil 21,600,000 tonnes in one year,
just for vehicles Total available lithium in planet 210,000,000 tonnes Years’ output: 2040 Bloomberg 1.9 years,
just for vehicles 2040 OPEC 5.8 years,
just for vehicles 2040 ExxonMobil 9.7 years,
just for vehicles
size of the Cheshire basin located west of New Delhi,
India, and another in Queensland, Australia.
Moreover, the other six geologies in which CAES
can be built (following minor R & D) extend potential
areas globally, without necessarily having any impact
on resources that people would otherwise use. These
geologies are all currently used safely for storing
methane:
Saline and sweet water aquifers (deeper than used
for drinking water);
Depleted oil fields;
Depleted gas fields;
Chalk;
Gypsum;
Limestone.
However storing air in these geologies is not
straightforward and needs to be analysed carefully;
therefore salt caverns are the quick, safe and simple
way forward initially.
10. Other Analysts’ Views
We select a small number from among the hundreds
of reports that have analysed a variety of storage
technologies for their “sweet spots”. Almost without
exception, they support the above analysis. Note that
none of them was aware of Storelectic’s particularly
high-potential technology when undertaking these
analyses, and therefore base all their evaluations on
Huntorf and McIntosh.
Chinese paper on combined pumped hydro and
CAES [9].
The following four graphs (Figs. 2-5) provide
different ways of looking at storage:
(1) By cost and technology maturity;
(2) By power output and energy stored;
(3) By power rating and discharge time (another
view of the previous graph);
(4) By capital cost per unit energy.
All four show CAES comparable with pumped
hydro, fulfilling similar functions, and therefore not
competing with the other technologies. To compare
with pumped hydro, one must consider proximity to

Gigawatt Scale Storage for Gigawatt Scale Renewables
112
(a)
(b) (c)
(d)
Fig. 1 Maps of salt basins in Europe, North America, the Middle East, and the world.

Gigawatt Scale Storage for Gigawatt Scale Renewables
113
Table 5 Capital cost of installed storage plants.
Type Storage capital cost ($/kWh)
Plant capital cost ($/kW)
Storage capital (MWh)
Efficiency (%)
Operation and maintenance cost ($/kW/yr)
Hours (full power)
Power (MW)
CAES > 3 > 425 5-100,000 > 70 1.35 1-10 min 0.5-2,700
Pumped hydro > 10 > 600 20,000 > 70 4.3 10 s-4 min 300-1,800
Flywheel 300-25,000 280-360 0.0002-500 90-93 7.5 < 1 s 0.001-1
Superconducting Magnet 500-72,000 300 0.0002-100 95 1 < 1 s 0.001-2
Battery storage 1-15 500-1,500 0.0002-2 59 - < 1 s 0.01-3
Fig. 2 Types of storage, by cost and technology maturity [11].
Fig. 3 Types of storage, by power output and energy stored.
Source: Energy Storage Technologies for Electric Applications Authors: J. I. San Martín, I. Zamora, J. J. San Martín, V. Aperribay, P. Eguía

Gigawatt Scale Storage for Gigawatt Scale Renewables
114
Fig. 4 Types of storage, by power rating and discharge time (another view of the previous graph).
Fig. 5 Types of storage, by capital cost per unit energy.
Source: Energy Storage Technologies for Electric Applications Authors: J. I. San Martín, I. Zamora, J. J. San Martín, V. Aperribay, P. Eguía Note: CAES is gas-fired regeneration

Gigawatt Scale Storage for Gigawatt Scale Renewables
115
electricity supply and demand, topography/geology,
and environmental footprint as well as capital and
revenue costs (c.f. Table 5).
KIC InnoEnergy, Thematic Field: Smart Grids and
Electric Storage, Strategy and Roadmap 2014 (KIC =
Knowledge and Innovation Community) [10].
“Electricity storage is identified as a key technology
priority in the development of the European power
system, in line with the 2020 and 2050 EU energy
targets. Power storage has gained high political interest
in the light of the development of renewables and
distributed generation, as a way to reduce carbon
emissions, to improve grid stability and to control the
fluctuations of variable resources.”
11. How Much from Each Technology?
According to the UK Government’s TINA
(Technology Innovation Needs Assessment) 2015
main projection, by 2050 the UK needs 27.4 GW, 128
GWh storage [12]. This is in a range of needs that
extends to 59.2 GW, 286 GWh. It is notable that
dividing the GWh figure by the GW figure, the
government assesses that the average duration of
storage needed is 5 hours, which cannot be delivered
cost-effectively by solid state batteries. And this report
only analyses the storage required to turn renewable
generation into dispatchable electricity (“peak
smoothing”), without considering delivering baseload
or supporting the de-carbonisation of heating, industry
and transportation.
Taking the main projection, these can be satisfied as
follows, according to reasonable estimates of the
potential of each:
Technology Power (GW) Capacity (GWh)
Pumped hydro 2 GW 20 GWh
Batteries 2-3 GW 2-3 GWh
Interconnectors 8-12 GW n/a
Demand side response 2-3 GW 2-3 GWh
Unmet need for storage 7.4-13.4 GW 102-104 GWh
Storelectric’s CAES is one of the only technologies
capable of meeting this unmet need2—and certainly the
only one to meet it cost-effectively and minimising
environmental effects.
12. Conclusions
Electricity grids need to de-carbonise completely in
order to enable economies to achieve their necessary
carbon reduction targets. In order to do so, not only
must all energy be generated renewable (with or
without nuclear, depending on viewpoint), but also it
needs to be backed up renewably too. Current plans
revolve around interconnectors, grid-connected
batteries and Demand Side Response. These are all
part of the solution. However none of these will deal
with all scenarios, for example weather patterns that
cover whole regions, or multi-hour peak demand
during low renewable generation periods. The big
missing element in these plans is large scale long
duration storage at the same scale as their renewable
generation—i.e. at the scale of multi-GW and ranging
2 Basis of these figures: Pumped Hydro: 2,828 MW, 9 GWh current storage capacity. Total current projects: 1,960 MW. Therefore 6 GW, 12 GWh represents Storelectric’s assessment of the reasonable maximum available in the UK, given that each installation floods two valleys. Current projects are (maximum sizes only): Sloy: 60 MW conversion from hydro-electric CoireGlas: 600 MW Balmacaan: 600 MW Cruachan: 600 MW increase from current 440 MW Glyn Rhonwy: 100 MW Batteries: assumes wide-scale roll-out of grid connected batteries with 1-2 hours’ duration. Average size of current such batteries is under 1MW (ref. REA Energy Storage in the UK report 2016). Current interconnectors are 4GW, with projects in planning to increase this to 9GW. But this includes the Norwegian interconnector (~5x our cost per MW) and the Icelandic one (>10x) – and interconnectors cannot be relied upon to deliver power exactly when needed, at reasonable prices. Demand Side Response: Assumes that there are 4-6 GW (6-10% of peak demand) available at any time, that each call on resources continues for 30 minutes, and that any given resource cannot be called upon twice in quick succession. Therefore for 1 hour’s usage, only half the power rating can be used at any time. Note: National Grid in FES 2015 estimated maximum DSR capability at ~5% of peak demand, http://nationalgridconnecting.com/2015-uk-future-energy-scenarios-published/ fig. 46 (not updated since).

Gigawatt Scale Storage for Gigawatt Scale Renewables
116
from tens of GWh to multi-TWh depending on the
country. There are currently only two technologies
able to deliver such scales of storage: pumped hydro
and Compressed Air Energy Storage. Traditional
CAES still has emissions and low levels of round trip
efficiency, but adiabatic CAES, such as that proposed
by Storelectric, is almost as efficient as pumped hydro,
a third of the cost and geographically much more
widely implementable. Therefore grids, governments
and industry should be developing large numbers of
such projects in order to provide the energy the world
needs, cost-effectively, cleanly and securely.
References
[1] https://www.bloomberg.com/news/articles/2018-03-26/meeting-paris-agreement-targets-will-take-massive-cuts-in-emissions.
[2] https://ec.europa.eu/clima/citizens/eu_en. [3] https://theenergyst.com/energy-risks-and-rewards-what-w
ill-hit-businesses-in-2018/.
[4] https://www.sciencealert.com/europe-braces-most-severe
-beast-from-the-east-cold-snap-in-five-years.
[5] https://www.theguardian.com/australia-news/2017/dec/01
/south-australia-turns-on-teslas-100mw-battery-history-in
-the-making.
[6] http://www.networkrevolution.co.uk/project-library/electr
ical-energy-storage-cost-analysis/.
[7] http://www.withouthotair.com/.
[8] https://www.economist.com/news/briefing/21726069-no-
need-subsidies-higher-volumes-and-better-chemistry-are-
causing-costs-plummet-after.
[9] https://www.mdpi.com/1996-1073/6/3/1554/pdf.
[10] http://cip2014.kic-innoenergy.com/thematic-roadmaps/.
[11] http://www.sc.ehu.es/sbweb/energias-renovables/temas/al
macenamiento/almacenamiento.html.
[12] http://www.lowcarboninnovation.co.uk/working_together
/technology_focus_areas/electricity_networks_storage/.

Gigawatt Scale Storage for Gigawatt Scale Renewables 117
About Storelectric
Storelectric (www.storelectric.com) is developing truly grid-scale energy storage using an innovative form of
CAES. This is TES CAES (TES = thermal energy storage), licensed from TES CAES Technology Ltd. which is
mostly owned by the same shareholders. It uses existing, off-the-shelf equipment to create installations of 500 MW,
6-21 GWh with zero or low emissions, operating at 68-70% round trip efficiency, at a cost of £ 350 m (€ 500 m)
(estimated for 3rd-5th plant), and a levelised cost cheaper than that of gas-fired peaking plants (OCGT). CAPEX is
one-third that of pumped hydro per MW and 1/75th/MWh; similar to 10-year target prices of batteries per MW and
less than 1/1,000 th/MWh. There is sufficient geological potential in the UK to store the entire continent’s energy
requirements for over a week; potential in mainland Europe and the USA is greater still, with global roll-out planned.
Returns on capital are expected to be of the order of 15% in today’s market—and the market is improving each year.
Storelectric has a second technology, CCGT CAES, which uniquely is retro-fittable to either OCGT or CCGT
power stations if over a suitable geology. The cost of conversion depends on what is there, but a new-build CCGT
CAES would cost about 10-15% more than a CCGT power station and have very similar returns on capital to TES
CAES.
The next stage is to build a 40 MW, > 100 MWh pilot plant with over 62% efficiency, using scale versions of the
same technology, for which Storelectric is currently raising funds. Construction will take 2-3 years from funding,
and the first large-scale plant a further 3-4 years. The consortium includes global multinationals who cover all the
technologies involved, their installation, financial and legal aspects.


