Gifted and Talented Education Update - Los Angeles … · · 2015-05-21Gifted and Talented...
24
Curriculum, Instruction and Assessment Committee May 21, 2015 Gifted and Talented Education Update Arzie Galvez Director Advanced Learning Options OCISS 1
Transcript of Gifted and Talented Education Update - Los Angeles … · · 2015-05-21Gifted and Talented...

Curriculum, Instruction and Assessment Committee May 21, 2015
Gifted and Talented Education Update
Arzie Galvez Director Advanced Learning Options OCISS
1

Gifted and Talented Update
• Identification • Equitable Access • Program Options • Budget/Staffing • Professional Development
2

Who are our “gifted” learners?
High Achiever
Intellectual Creative Thinker
Leader
Performing Artist
Visual Artist
English Learner
Standard English Learner
Twice Exceptional
Able Underachiever
Social-Emotional Needs
3

Gifted and Talented Identification
State District California Ed Code permits each school district to develop its own identification criteria.
• Intellectual Ability • High Academic Achievement • Specific Academic Achievement • Visual Arts Ability • Performing Arts Ability • Creative Ability • Leadership Ability
4

Gifted Identification Seven categories: 1. Intellectual Ability: I.Q. Assessment – verbal & non- verbal; grades 2nd semester (Kindergarten-12)
2. High Achievement: Two consecutive years in both ELA and Mathematics (Grades 4-12) or OLSAT-8: (Grade 2)
3. Specific Academic: Three consecutive years in ELA or mathematics (Grades 4-12)
5

Gifted Identification 4. Visual Arts: Demonstration (Grades 2-12) November 15, 2014 & May 16, 2015
5. Performing Arts: Audition (Grades 2-12) November 15, 2014 & May 16, 2015
6. Creativity: Individual Student Portfolio and Proposal (Grades 4-12)
7. Leadership: Individual Student Portfolio and Proposal (Grades 4-12)
6

Gifted/Talented Access
• 68,000 LAUSD students identified gifted • Percentage of LAUSD students identified as gifted (13%)
exceeds national average (6-10%) • Multi-dimensional view of giftedness • Open referral/application process • Use of multiple methods to identify
7

Identification Flow Chart
Search and Referral
Screening
PRELIMINARY SCREENING (Local School Screening Committee)
Student NOT recommended Student recommended (Charter Schools only – Request Fee-For-Service
from Charter School Office)
Indicate Not Recommended in MiSiS
(Do Not Proceed)
Proceed with Referral in MiSiS
8

Identification Procedures
MiSiS Job Aides http://achieve.lausd.net/misis
9

principalportal.lausd.net
10

Gifted and Talented Identification 2013-2014
Total # of Students
% of Total Enrollment
Total # Identified GATE
% of Students Identified GATE
LAUSD 554,886 100% 75,069 13.5% Board District 1 64,283 100% 6,594 10.3% Board District 2 90,906 100% 10,759 11.8% Board District 3 79,929 100% 16,621 20.7% Board District 4 49,371 100% 9,064 18.4% Board District 5 90,476 100% 11,883 13.1% Board District 6 82,713 100% 9,282 11.2% Board District 7 97,208 100% 10,866 11.1%
11

Status Report: Intellectual Ability
2013-2014 Backlog 2014-2015
a
ESC Pending
North 3,052 West 1,628 East 886 South 1,219 ISIC 498
ESC Referrals Pending North 1998 0 West 875 0
12
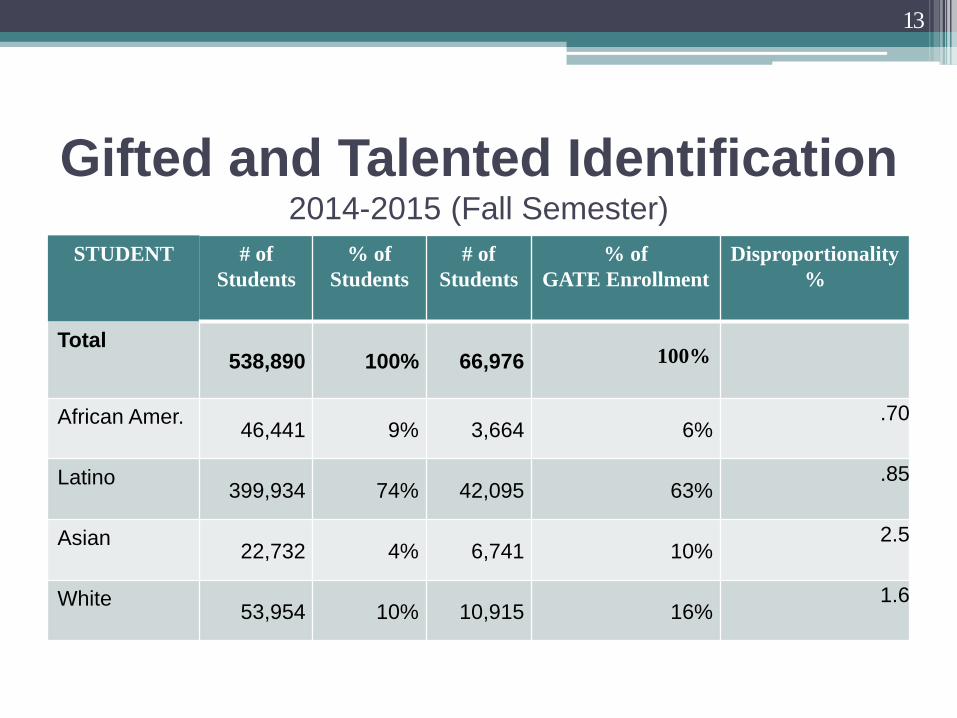
Gifted and Talented Identification 2014-2015 (Fall Semester)
STUDENT # of Students
% of Students
# of Students
% of GATE Enrollment
Disproportionality %
Total 538,890 100% 66,976
100%
African Amer. 46,441 9% 3,664 6% .70
Latino 399,934 74% 42,095 63% .85
Asian 22,732 4% 6,741 10% 2.5
White 53,954 10% 10,915 16% 1.6
13
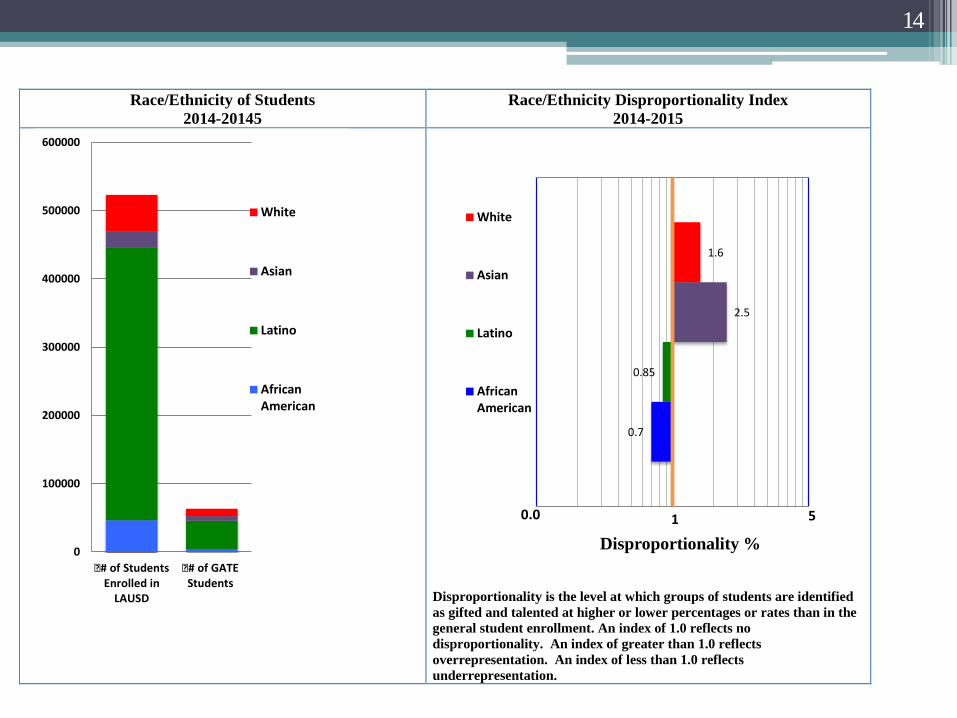
Race/Ethnicity of Students 2014-20145
Race/Ethnicity Disproportionality Index 2014-2015
Disproportionality is the level at which groups of students are identified as gifted and talented at higher or lower percentages or rates than in the general student enrollment. An index of 1.0 reflects no disproportionality. An index of greater than 1.0 reflects overrepresentation. An index of less than 1.0 reflects underrepresentation.
0
100000
200000
300000
400000
500000
600000
�# of StudentsEnrolled in
LAUSD
�# of GATEStudents
White
Asian
Latino
AfricanAmerican
0.7
0.85
2.5
1.6
Disproportionality %
White
Asian
Latino
AfricanAmerican
510.0
14

Gifted/Talented Access
• Percentage of LAUSD students identified as gifted (13%) exceeds national average (6-10%)
• Gifted identification rates for African American (8%) and Latino (11%) students are lower than the District average (13%) • District entered a voluntary agreement with the Office for Civil Rights to address the disproportionality
15

Targeted Action Steps
• Targeted Identification Program (TIP) • Pilot/administer linguistic and culture-free assessments • Professional Development/Resources • Parent Resources/Training
16

Targeted Identification Schools
2014-2015 Elementary Middle High Total
LAUSD 129 3 1 133 Board District 1 33 1 1 35 Board District 2 22 1 23 Board District 3 1 1 Board District 4 5 5 Board District 5 16 16 Board District 6 15 15 Board District 7 37 1 38
17

Gifted/Talented Program Options
Options
• Local School • Schools for Advanced Studies • Gifted/High Ability Magnets • Highly Gifted Magnets • Conservatory of Fine Arts
18

Schools for Advanced Studies 2014-2015
Number of District Schools with Students Participating Elementary Middle High Total
LAUSD 98 50 27 175 Board District 1
12 5 3 20 Board District 2
9 4 2 15 Board District 3
26 13 6 45 Board District 4
18 8 5 31 Board District 5
9 3 3 15 Board District 6
15 6 4 25 Board District 7
9 11 4 24
19

Gifted/High Ability/Highly Gifted Magnet Programs 2014-2015
Gifted/High Ability Highly Gifted Magnet Centers Elem Middle High Total Elem. Middle High Total
LAUSD 18 14 4 36 2 1 1 4 Board District 1
2 3 0 5 0 0 0 0 Board District 2
3 3 0 6 0 0 0 0 Board District 3
3 2 0 5 0 0 1 1 Board District 4
3 0 1 4 0 1 0 1 Board District 5
1 2 3 6 1 0 0 1 Board District 6
3 2 0 5 1 0 0 1 Board District 7
3 2 0 5 0 0 0 0
20

Conservatory of Fine Arts 2014-2015
Number of District Schools with Students Participating Elementary Middle High Total
LAUSD 90 46 35 171 Board District 1
15 5 3 23 Board District 2
13 6 9 28 Board District 3
10 9 11 30 Board District 4
18 11 4 33 Board District 5
19 7 4 30 Board District 6
8 4 2 14 Board District 7
7 4 2 13
21

GATE Budget/Staffing 2014-2015
GATE FUNDING: LCFF GATE Dedicated Staffing
“The GATE program funding is now included in the Local Control Funding Formula (LCFF), authorized by the 2013-2014 Budget Act, in place of most previously existing K-12 state funding streams. Funding for the program will be determined at the local level.” California Department of Education
• GATE Coordinator (each school) • District GATE Coordinators (4) • District GATE Coordinator, Psychological Services (1) • Psychologists (12) • Director (1)
22

Professional Development 2014-2015
Activity Description Participant # Salary Point Classes Differentiated curriculum focus 1000 Small Group Offered on multiple topics 100 GATE/SAS Coordinator Supports school site GATE/SAS
coordinators 800
School Site Schools select from menu of options
1200
GATE Webinars Differentiated instruction focus 1000 GATE Symposium One day annual event 400 GATE Conference District co-sponsored conference
on gifted education 1800
GATE/SAS Parent Workshops Offered at each ESC 450 GATE/SAS Parent Conference Half-day conference 500
23

“Failure to help the gifted child is a societal tragedy, the extent of which is difficult to measure, but which is surely great. How can we measure the sonata unwritten, the curative drug undiscovered, the absence of political insight? They are the difference between what we are and what we could be as a society.”
James Gallagher
24