M Cotton, H Cassim , N Pavía-Ruz , L Ross, S Ford, N Givens, K Cheng, J Sievers


GIC RE SOUTH AFRICA LTD
The financial statements have been audited in compliance with Section 30 of the
South African Companies Act 71 of 2008.
Prepared under the supervision of:
C. G. Asirvatham
Managing Director and Chief Excecutive Officer
ANNUAL FINANCIAL STATEMENTS
FOR THE YEAR ENDED 31 MARCH 2019
2 Annual Report 2018-2019

45Annual Report 2018-2019
(Left to Right):
Mr. Sanjay R Bhikha (Non-Executive Director), Mr. Jonathan Bagg (Lead Independent Director),
Adv. Cassim I Moosa (Non-Executive Director), Mrs. Alice G Vaidyan (Chairman), Mr Devesh Srivastava
(Non Executive Director), Mr. Charles G Asirvatham, (Managing Director & Chief Executive Officer)
BOARD OF DIRECTOR'S

46 Annual Report 2018-2019
(Left to Right):
Ms. Farzana Mosam (Chief Technical Accounts Officer), Mr. Chandan Verma (Chief Underwriting Officer
& Chief Technology Officer), Mr. Sanjeev Shankar (Chief Operating Officer), Mr. Charles G Asirvatham
(Managing Director & Chief Executive Officer), Mrs. Alice G Vaidyan (Chairman), Mr. Devesh Srivastava
(Non Executive Director), Mr. Wilson Mwase (Company Secretary & Public Officer), Mr Ajinkya Tamhane
(Chief Risk Officer), Mr Sameer Sapdhare (Chief Financial Officer)
MANAGEMENT

3Annual Report 2018-2019
DIRECTORS’ RESPONSIBILITY STATEMENT
The directors are responsible for the preparation and fair presentation of the annual financial statements of GIC Re South
Africa Ltd, comprising the statement of financial position as at 31 March 2019, and the statements of comprehensive income,
changes in equity and cash flows for the period then ended, and the notes to the financial statements which include a
summary of significant accounting policies and other explanatory notes, in accordance with International Financial Reporting
Standards and the requirements of the Companies Act of South Africa. In addition the directors are responsible for preparing
the Directors’ report.
The directors are also responsible for such internal control as the directors determine necessary to enable the preparation of
financial statements that are free from material misstatement, whether due to fraud or error, and for maintaining adequate
accounting records and an effective system of risk management.
The directors have made an assessment of the ability of the company to continue as a going concern and have no reason to
believe the business will not be a going concern in the year ahead.
The auditor is responsible for reporting on whether the financial statements are fairly presented in accordance with the
applicable financial reporting framework.
Approval of the annual financial statements
The annual financial statements of GIC Re South Africa Ltd, as identified in the first paragraph, were approved by the board of
directors on 21 May 2019 and are signed on their behalf by
C G Asirvatham A G Vaidyan
Authorised Managing Director Chairman
Declaration of the Company Secretary
In terms of S88 (2)(e) of the Companies Act 71 of 2008, I certify that in respect of the financial period ended 31 March 2019,
the company has lodged with the Registrar of Companies all such returns that are required by the Companies Act, and that
all such returns are to the best of my knowledge and belief, true, correct and up to date.
W Mwase
Company Secretary
21-May-19
Directors’ Responsibility Statement

4 Annual Report 2018-2019
Audit Committee Report
In addition to having specific statutory responsibilities, the
audit committee is a sub-committee of the board of directors.
It assists the board through advising and making
recommendations on financial reporting, oversight of
financial risk management and internal financial controls,
external audit functions and statutory and regulatory
compliance of the company. General risk management
remains the responsibility of the board.
The executive directors and managing executives attend the
committee meetings by invitation only. The external and
internal auditors have unrestricted access to the audit
committee.
Meetings
The audit committee held four meetings during the year.
Attendance at the meetings is shown below:
3-May- 20-Aug- 19-Nov- 25-Feb-
18 18 18 19
Members
S Bhikha Yes Yes Yes Yes
J Bagg Yes Yes Yes Yes
CI Moosa* N.A N.A N.A Yes
B N Narasimhan No No. N.A N.A
* Became member of the Audit committee from 25th
February 2019.
Name Appointed Qualifications Position Independent
S Bhikha 24-Apr-14 B Compt Hons CA(SA) Chairman Yes
J Bagg 24-Apr-14 B.Sc. FASSA, FIA, ASA Member Yes
B N Narasimhan 23-Jun-16 MA, MBA, B.Sc., AIII Member No
C I Moosa 25-Feb-19 B.A. (Law) (UDW), LLB (UDW), Member Yes
PG Diploma Labor Law (UJ)
Terms of reference
The audit committee has adopted the formal terms of
reference that have been approved by the board of directors,
and has executed its duties during the past financial year in
accordance with these terms of reference.
The composition of the audit committee
Statutory duties
In the execution of its statutory duties, as required in terms
of the Companies Act, during the past financial year the audit
committee has:
• Ensured the re-appointment as external auditor of the
company of a registered auditor who, in the opinion of
the audit committee, is independent of the company.
• Determined the fees to be paid to the external auditor
and such auditor’s terms of engagement.
• Ensured that the appointment of the external auditor
complies with this Act and any other legislation relating
to the appointment of such auditor.
• Considered the independence of the external auditor
and has concluded that the external auditor has been
independent of the company throughout the year taking
into account all other non-audit services performed and
circumstances known to the committee.

5Annual Report 2018-2019
• Confirmed that there were no complaints relating to
the accounting practices of the company, the content
or auditing of its financial statements, the internal
financial controls of the company, or to any related
matter.
• Based on reports from the external auditor, internal
auditor and appropriate inquiries, made submissions to
the board on any matter concerning the company’s
accounting policies, financial control, records and
reporting, including input to the board’s statement
regarding control effectiveness.
Audit Committee Report
Legal requirements
The Audit committee has complied with all applicable legal,
regulatory and other responsibilities for the year under review.
Annual financial statements
Following our review of the annual financial statements of
GIC Re South Africa Ltd for the year ended 31 March 2019,
we are of the opinion that, in all material respects, they comply
with the relevant provisions of the Companies Act and
International Financial Reporting Standards, and that they fairly
present the financial position at 31 March 2019 and the results
of operations and cash flows for the year then ended.
S Bhikha
Chairman of the Audit committee
21 May 2019
6 Annual Report 2018-2019
GIC RE SOUTH AFRICA LTD
DIRECTORS’ REPORT
FOR THE YEAR ENDED 31 MARCH 2019
The directors have pleasure in presenting their report for the
year ended 31 March 2019.
Business
GIC Re South Africa Ltd is a 100% owned subsidiary of General
Insurance Corporation of India (GIC Re) which is owned by
the Government of India.GIC Re made its first move to Africa
in April 2014, when it acquired South African composite
reinsurer Saxum Re and renamed it as GIC Re South Africa
Ltd. GIC Re South Africa Ltd’s vision is to become a truly African
Reinsurer. The core business philosophy includes reinsurance
capacity development in Africa, application of the state of art
technology, mutually beneficial relationships, benchmarking
reinsurance and service delivery mechanism and a
professional attitude.The company is rated BB+ (Global) and
zaAAA (National) by S&P. GIC Re South Africa Ltd commenced
underwriting business on 1 January 2015. The company
underwrites business from the entire African continent
except Egypt and Libya. For the year ended March 2019, the
company recorded a growth of 78.86% in GWP as accounted.
Global Economic Outlook
The World Economic Outlook (WEO) (published by the
International Monetary Fund, April 2019) projects a decline
in global economic growth in 2019. Global growth which
peaked at close to 4% in 2017, softened to 3.6% in 2018, and
is projected to decline further to 3.3% in 2019. While 2019
started out on a weak footing, a pickup is expected in the
second half of the year. Global economic growth in 2020 is
projected to return to 3.6%. This return is predicated on a
rebound in Argentina and Turkey and some improvement in
a set of other stressed emerging market and developing
economies. Beyond 2020 growth will stabilize at around 3.5%,
bolstered mainly by growth in China and India and their
increasing weights in world income.
Directors’ Report
South Africa Economic Outlook
The International Monetary Fund, in its latest World Economic
Outlook publication (April 2019), has lowered South Africa’s
projected GDP growth rate for 2019 from 1.4% to 1.2%,
putting the country among the worst performers in sub-
Saharan Africa. Projected GDP expansion for 2020 has also
been lowered from 1.7% to 1.5%.The International Monetary
Fund projected that GDP growth in sub-Saharan Africa would
average 3.4% in 2019, meaning South Africa will be growing
at less than half the average rate. At a growth rate of 1.2%,
South Africa’s economic expansion would still be above the
0.8% level at which the economy expanded in 2018.A 1.2%
GDP growth rate for 2019 is far below the 5% growth required
in terms of the National Development Plan to reduce poverty
and inequality by 2030.The IMF’s growth projection is slightly
lower than what was recently published by the South Africa
Reserve Bank (SARB). In late March, SARB Governor said the
central bank expected South Africa’s GDP growth for 2019
to average 1.3%, down from the bank’s January projection of
1.7%. The bank’s forecast for 2020 was 1.8%, down from
2.0%.
As the performance of short term insurance industry is closely
linked to the performance of the economy, the growth will
be fairly muted for GIC Re South Africa Ltd.
Share capital
The company issued 149,174,187 ordinary shares of no par
value totalling R298.35 million during 2019
(2018: 294 906 675 ordinary shares of no par value totalling
R589.81 million).
Overview for the year
The results for the year and the financial position of the
company are fully disclosed in the attached financial
statements.
Holding company
The company is a wholly owned subsidiary of General
Insurance Corporation of India (GIC Re).

7Annual Report 2018-2019
Directors’ Report
Dividends
No dividends were paid or declared during the year (2018:
Nil).
Directors
The directors in office Date Date
at the date of this Appointed Resigned
report are :
A G Vaidyan
(Chairman, non-executive) 23-Jan-16
J Bagg (Lead Independent,
non-executive) 24-Apr-14
B N Narasimhan
(non-executive) 4-Feb-16 11-May-18
D Srivastava (non-executive) 18-Jun-18
C G Asirvatham
(Managing Executive) 29-Mar-18
S Bhikha (Independent,
non-executive) 24-Apr-14
C I Moosa
(Independent, non-executive) 24-Apr-14
Directors’ interest
No directors have a conflicting interest in the company.
Secretary and registered office
W Mwase is the company secretary. The registered office
and office of the secretary are:
First Floor, Block C
Riviera Road Office Park
No. 6-9 Riviera Road
Houghton - 2193
Auditor
KPMG Inc.
Company registration number
1956/003037/06
Number of employees
The number of people employed by the company at 31 March
2019 is 26 (2018: 23).
8 Annual Report 2018-2019
To the shareholder of GIC Re South Africa Ltd
Report on the audit of the financial statements
Opinion
We have audited the financial statements of GIC Re South
Africa Limited (the company) set out on pages 8 to 45 which
comprise the statement of financial position as at 31 March
2019, and the statement of comprehensive income, the
statement of changes in equity and the statement of cash
flows for the year then ended, and notes to the financial
statements, including a summary of significant accounting
policies.
In our opinion, the financial statements present fairly, in all
material respects, the financial position of GIC Re South Africa
Limited as at 31 March 2019, and its financial performance
and cash flows for the year then ended in accordance with
International Financial Reporting Standards and the
requirements of the Companies Act of South Africa.
Basis for Opinion
We conducted our audit in accordance with International
Standards on Auditing (ISAs). Our responsibilities under those
standards are further described in the Auditor’s
Responsibilities for the Audit of the Financial Statements
section of our report. We are independent of the company in
accordance with the sections 290 and 291 of the
Independent Regulatory Board for Auditors’ Code of
Professional Conduct for Registered Auditors (Revised January
2018), parts 1 and 3 of the Independent Regulatory Board for
Auditors’ Code of Professional Conduct for Registered Auditors
(revised November 2018) (together the IRBA codes) and other
independence requirements applicable to performing audits
of financial statements in South Africa. The IRBA codes are
consistent with the corresponding sections of the
International Ethics Standards Board for Accountants’ Code of
Ethics for Professional Accountants and the International Ethics
Standards Board for Accountants’ International Code of Ethics
for Professional Accountants (including International
Independence Standards) respectively. We believe that the
audit evidence we have obtained is sufficient and appropriate
to provide a basis for our opinion.
Other Information
The directors are responsible for the other information. The
other information comprises the Directors’ Report, Audit
Committee Report and the declaration of the Company
Secretary as required by the Companies Act of South Africa
and Director’s Responsibility Statement. The other information
does not include the financial statements and our auditor’s
report thereon.
Our opinion on the financial statements does not cover the
other information and we do not express an audit opinion or
any form of assurance conclusion thereon.
In connection with our audit of the financial statements, our
responsibility is to read the other information and, in doing
so, consider whether the other information is materially
inconsistent with the financial statements or our knowledge
obtained in the audit, or otherwise appears to be materially
misstated. If, based on the work we have performed, we
conclude that there is a material misstatement of this other
information, we are required to report that fact. We have
nothing to report in this regard.
Responsibilities of the Directors for the Financial
Statements
The directors are responsible for the preparation and fair
presentation of the financial statements in accordance with
International Financial Reporting Standards and the
requirements of the Companies Act of South Africa, and for
such internal control as the directors determine is necessary
to enable the preparation of financial statements that are
free from material misstatement, whether due to fraud or
error.
In preparing the financial statements, the directors are
responsible for assessing the company’s ability to continue
as a going concern, disclosing, as applicable, matters related
to going concern and using the going concern basis of
accounting unless the directors either intend to liquidate
the company or to cease operations, or have no realistic
alternative but to do so.
Independent Auditor’s Report
9Annual Report 2018-2019
Auditor’s Responsibilities for the Audit of the Financial
Statements
Our objectives are to obtain reasonable assurance about
whether the financial statements as a whole are free from
material misstatement, whether due to fraud or error, and to
issue an auditor’s report that includes our opinion. Reasonable
assurance is a high level of assurance but is not a guarantee
that an audit conducted in accordance with ISAs will always
detect a material misstatement when it exists. Misstatements
can arise from fraud or error and are considered material if,
individually or in the aggregate, they could reasonably be
expected to influence the economic decisions of users taken
on the basis of these financial statements.
As part of an audit in accordance with ISAs, we exercise
professional judgement and maintain professional scepticism
throughout the audit. We also:
• Identify and assess the risks of material misstatement of
the financial statements, whether due to fraud or error,
design and perform audit procedures responsive to those
risks, and obtain audit evidence that is sufficient and
appropriate to provide a basis for our opinion. The risk of
not detecting a material misstatement resulting from
fraud is higher than for one resulting from error, as fraud
may involve collusion, forgery, intentional omissions,
misrepresentations, or the override of internal control.
• Obtain an understanding of internal control relevant to
the audit in order to design audit procedures that are
appropriate in the circumstances, but not for the purpose
of expressing an opinion on the effectiveness of the
company’s internal control.
• Evaluate the appropriateness of accounting policies used
and the reasonableness of accounting estimates and
related disclosures made by the directors.
• Conclude on the appropriateness of the directors’ use of
the going concern basis of accounting and based on the
audit evidence obtained, whether a material uncertainty
exists related to events or conditions that may cast
significant doubt on the company’s ability to continue as
a going concern. If we conclude that a material
uncertainty exists, we are required to draw attention in
our auditor’s report to the related disclosures in the
financial statements or, if such disclosures are inadequate,
to modify our opinion. Our conclusions are based on the
audit evidence obtained up to the date of our auditor’s
report. However, future events or conditions may cause
the company to cease to continue as a going concern.
• Evaluate the overall presentation, structure and content
of the financial statements, including the disclosures, and
whether the financial statements represent the
underlying transactions and events in a manner that
achieves fair presentation.
We communicate with the directors regarding, among other
matters, the planned scope and timing of the audit and
significant audit findings, including any significant deficiencies
in internal control that we identify during our audit.
Report on other legal and regulatory requirements
In terms of the IRBA Rule published in Government Gazette
39475 dated 4 December 2015, we report that KPMG Inc.
has been the auditor of GIC Re South Africa Ltd for 6 years.
KPMG Inc.
Registered Auditor
Per Nishen Bikhani KPMG Crescent
Chartered Accountant (SA) 85 Empire Road
Registered Auditor Parktown
Director 2193
25 June 2019
Independent Auditor’s Report
10 Annual Report 2018-2019
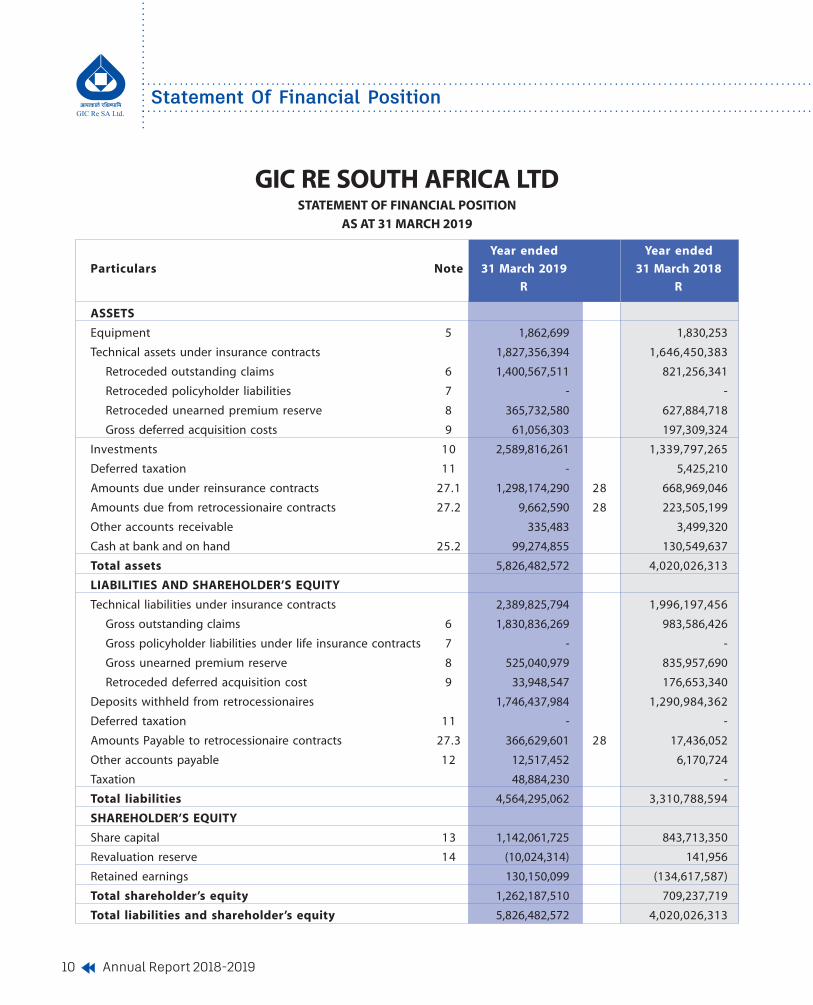
Year ended Year ended
Particulars Note 31 March 2019 31 March 2018
R R
ASSETS
Equipment 5 1,862,699 1,830,253
Technical assets under insurance contracts 1,827,356,394 1,646,450,383
Retroceded outstanding claims 6 1,400,567,511 821,256,341
Retroceded policyholder liabilities 7 - -
Retroceded unearned premium reserve 8 365,732,580 627,884,718
Gross deferred acquisition costs 9 61,056,303 197,309,324
Investments 10 2,589,816,261 1,339,797,265
Deferred taxation 11 - 5,425,210
Amounts due under reinsurance contracts 27.1 1,298,174,290 28 668,969,046
Amounts due from retrocessionaire contracts 27.2 9,662,590 28 223,505,199
Other accounts receivable 335,483 3,499,320
Cash at bank and on hand 25.2 99,274,855 130,549,637
Total assets 5,826,482,572 4,020,026,313
LIABILITIES AND SHAREHOLDER’S EQUITY
Technical liabilities under insurance contracts 2,389,825,794 1,996,197,456
Gross outstanding claims 6 1,830,836,269 983,586,426
Gross policyholder liabilities under life insurance contracts 7 - -
Gross unearned premium reserve 8 525,040,979 835,957,690
Retroceded deferred acquisition cost 9 33,948,547 176,653,340
Deposits withheld from retrocessionaires 1,746,437,984 1,290,984,362
Deferred taxation 11 - -
Amounts Payable to retrocessionaire contracts 27.3 366,629,601 28 17,436,052
Other accounts payable 12 12,517,452 6,170,724
Taxation 48,884,230 -
Total liabilities 4,564,295,062 3,310,788,594
SHAREHOLDER’S EQUITY
Share capital 13 1,142,061,725 843,713,350
Revaluation reserve 14 (10,024,314) 141,956
Retained earnings 130,150,099 (134,617,587)
Total shareholder’s equity 1,262,187,510 709,237,719
Total liabilities and shareholder’s equity 5,826,482,572 4,020,026,313
Statement Of Financial Position
GIC RE SOUTH AFRICA LTDSTATEMENT OF FINANCIAL POSITION
AS AT 31 MARCH 2019

11Annual Report 2018-2019
Statement Of Comprehensive Income
GIC RE SOUTH AFRICA LTDSTATEMENT OF COMPREHENSIVE INCOME
FOR THE YEAR ENDED 31 MARCH 2019
Year ended Year ended
Particulars Note 31 March 2019 31 March 2018
R R
Gross premiums written 2,935,603,723 1,641,253,719
Retroceded premiums (2,120,305,206) (1,267,664,011)
Net premiums written 815,298,517 373,589,708
Change in provision for unearned premiums 8 48,764,573 (163,713,328)
Gross 310,916,711 (503,792,782)
Reinsured (262,152,138) 340,079,454
Net premium earned 864,063,090 209,876,380
Commission income 17 678,595,274 266,209,780
Net investment income 15 107,358,649 44,574,954
Decrease in net life policyholder liabilities 7 - 13,835,338
Net income 1,650,017,012 534,496,452
Claims incurred, net of reinsurance 16 (556,454,378) (220,441,026)
Commission expense 17 (822,053,450) (294,606,833)
Interest paid (35,531,226) (9,953,112)
Investment management expenses (4,823,844) (3,034,423)
Management expenses (31,283,486) (25,991,898)
Increase in provision for doubtful debts (14,639,867) (3,168,950)
Foreign exchange gain/(loss) 123,742,368 (53,175,431)
Profit/(Loss) before taxation 18 308,973,129 (75,875,221)
Taxation 19 (54,371,713) (545,985)
Profit/(Loss) for the year 254,601,416 (76,421,206)
Other comprehensive income for the year, net of taxation - -
Total comprehensive income (loss) for the year 254,601,416 (76,421,206)

12 Annual Report 2018-2019
Share Revaluation Retained Total
Particulars capital reserve earnings
R R R R
Statement Of Changes In Equity
31 March 2019
Balance as at 1 April 2018 843,713,350 141,956 (134,617,587) 709,237,719
Share issue 298,348,375 - - 298,348,375
Non-life 298,348,375 - - 298,348,375
Total comprehensive profit/(loss)
for the period - - 254,601,416 254,601,416
Non-life - - 253,756,672 253,756,672
Life - - 844,744 844,744
Transfer to reserves
Revaluation of investments - (10,166,270) 10,166,270 -
Balance as at 31 March 2019 1,142,061,725 (10,024,314) 130,150,099 1,262,187,510
31 March 2018
Balance as at 1 April 2017 253,900,000 1,733,310 (59,787,735) 195,845,575
Share issue - - - -
Non-life 589,813,350 - - 589,813,350
Total comprehensive loss
for the year (76,421,206) (76,421,206)
Non-life - - (84,234,930) (84,234,930)
Life - - 7,813,724 7,813,724
Transfer from reserves
Revaluation of investments - (1,591,354) 1,591,354 -
Balance as at 31 March 2018 843,713,350 141,956 (134,617,587) 709,237,719
GIC RE SOUTH AFRICA LTDSTATEMENT OF CHANGES IN EQUITY
FOR THE YEAR ENDED 31 MARCH 2019

13Annual Report 2018-2019
Year ended Year ended
Particulars Note 31 March 2019 31 March 2018
R R
Cash flows from operating activities
Cash generated by operations 25.1 849,672,112 230,376,946
Interest received 95,792,577 30,608,343
Interest paid (35,531,226) (9,953,112)
Dividends received 10,073,618 1,279,037
Net cash inflow from operating activities 920,007,080 252,311,214
Cash flows from investing activities
Net acquisition of investments (1,248,743,388) (787,891,315)
Additions to property and equipment (886,850) (1,460,416)
Proceeds on disposal of property and equipment - 103,560
Net cash outflow from investing activities (1,249,630,238) (789,248,171)
Cash flows from financing activities
Shares issued 298,348,375 589,813,350
Net increase in cash and cash equivalents 31,274,783 52,876,393
At the beginning of year 130,549,637 77,673,244
At the end of year 25.2 99,274,855 130,549,637
Statement Of Cash Flows
GIC RE SOUTH AFRICA LTDSTATEMENT OF CASH FLOWS
FOR THE YEAR ENDED 31 MARCH 2019
14 Annual Report 2018-2019
GIC Re South Africa Ltd (“Company”) is a company domiciled
in South Africa. The company is wholly owned by General
Insurance Corporation of India (GIC Re) and authorised to
write short-term and long-term insurance business.
1 Accounting policies
1.1 Statement of compliance
The financial statements of the company are prepared
on the going concern basis and in accordance with
International Financial Reporting Standards (IFRS) and
the requirements of the Companies Act of South Africa.
The accounting policies set out below have been
applied consistently to all years presented in the
financial statements.
1.2 Basis of preparation
The company is domiciled in South Africa and its
reporting currency is Rand.
Basis of measurement
The financial statements are prepared on the historical
cost basis, adjusted by the revaluation of investments
to fair value.
Use of estimates
The preparation of financial statements in conformity
with International Financial Reporting Standards
requires management to make judgements, estimates
and assumptions that affect the application of policies
and reported amounts of assets, liabilities, income and
expenses. The estimates and associated assumptions
are based on historical experience and various other
factors that are believed to be reasonable under the
circumstances, the results of which form the basis of
making judgements about carrying values of assets and
liabilities that are not readily apparent from other
sources. Actual results may differ from these estimates.
The most significant judgements, estimates and
assumptions relate to technical provisions and liabilities
Notes To The Financial Statements
GIC RE SOUTH AFRICA LTDNOTES TO THE FINANCIAL STATEMENTS
FOR THE YEAR ENDED 31 MARCH 2019
under insurance contracts detailed in note 4. In addition,
assumptions are made about the recoverability of
insurance receivables and credit control is strictly
monitored.
1.3 Classification of contracts
Contracts under which the company accepts significant
insurance risk from another party (the policyholder)
through reinsurance inwards by agreeing to
compensate the policyholder or other beneficiary if a
specific uncertain future event (the insured event)
adversely affects the policyholder or other beneficiary
are classified as insurance contracts. The same definition
is applied to reinsurance outwards. Insurance risk is risk
other than financial risk. Financial risk is the risk of a
possible future change in one or more of a specific
interest rate, security price, commodity price, foreign
exchange rate, index of prices or rates, a credit rating or
credit index or other variable, provided in the case of a
non-financial variable that the variable is not specific to
a party to the contract.
Contracts that do not meet the above definition are
classified as investment contracts and are deposit
accounted.
1.4 Equipment
Equipment, furniture and motor vehicles are stated at
cost less accumulated depreciation which is calculated
to write off the cost of the assets to its residual value
over their useful lives in a pattern that reflects their
economic benefits.
The current estimated useful lives are as follows:
• Equipment
Office Equipment 6 years
Computer equipment 3 years
• Furniture and fittings 6 years
• Motor vehicles 5 years
15Annual Report 2018-2019
Notes To The Financial Statements
The useful lives and depreciation methods are
reassessed annually. The residual values, if not
insignificant, are also reassessed annually. Where the
carrying amount of an asset is greater than its estimated
recoverable amount, it is written down immediately to
its recoverable amount.
Gains and losses on disposals are determined by
comparing the proceeds with the carrying amount of
the assets and are included in profit or loss.
1.5 Outstanding and unintimated claims
Provisions are made for claims incurred up to the
reporting date. The provisions exclude Value Added Tax
but include an estimate for future claims handling costs.
1.6 Policyholder liabilities for life insurance contracts
The liabilities under life insurance contracts are valued
in terms of the Financial Soundness Valuation (“FSV”)
basis contained in SAP104 issued by the Actuarial
Society of South Africa and are reflected as policyholder
liabilities under life insurance contracts in the statement
of financial position. The operating surpluses or losses
arising from insurance contracts are determined by the
annual actuarial valuation. These surpluses or losses are
arrived at after taking into account the movement in
actuarial liabilities under unmatured policies, provisions
for profit commissions accrued and adjustments to
contingency and other reserves within the policyholder
liabilities as well as recoveries under retrocession
agreements.
1.7 Deposits
Deposits retained on retrocession placed are stated at
amortised cost.
1.8 Revaluation reserve
The company has chosen to disaggregate equity into
more classes than the minimum required by creating a
revaluation reserve as an additional class within equity.
This is to present unrealised gains and losses on
investments separately from other profits or losses and
is shown separately on the statement of financial
position.
The revaluation reserve comprises of the revaluation
of investments above or below their original cost, after
deferred tax is recognised on the revaluation. A gain or
loss arising from a change in fair value is recognised in
net profit or loss for the period in which it arises and
thereafter is transferred to a revaluation reserve. When
investments are disposed of, the cumulative gain or
loss previously recognised in the revaluation reserve is
transferred to retained income.
1.9 Premiums
Premium income on insurance contracts is brought to
account at the earlier of the date of notification or the
date of receipt. At year end, an estimate is raised for
premiums where notification has not been timeously
received.
1.10 Unearned premium provision
The provision for unearned premium comprises the
portion of premiums written which are estimated to
be earned in future periods. The unearned premium
provision is calculated at the balance sheet date using
the 365th method for Facultative business, a blend of
8th method and 50% methods for Proportional treaty
and 8th method for Non-proportional treaty business.
1.11 Commission expense
Acquisition costs comprise commission and other
variable costs directly connected with the acquisition
or renewal of insurance policies. Commission expenses
are charged to profit or loss as incurred and include
commission, brokerage, taxes, and profit commission
which is paid to cedants based on the performance of
the contracts underwritten.
1.12 Investment income
Interest income is recognised as it accrues, using the
effective interest method. Dividends are recognised
when the right of receipt is established.
1.13 Gain or loss on realisation of investments
Gains or losses on realisation of investments are
calculated on a weighted average basis.

16 Annual Report 2018-2019
1.14 Income tax
Income tax on profit and loss for the year comprises
current and deferred tax. Income tax is recognised in
profit or loss except to the extent that it relates to items
recognised directly in equity, in which case it is
recognised in equity, or other comprehensive income.
Current tax is the expected tax payable on the taxable
income for the year, using tax rates enacted or
substantively enacted at the reporting date, and any
adjustment to tax payable in respect of previous years.
Deferred tax is provided using the liability method,
providing for temporary differences between the
carrying amounts of the assets and liabilities for financial
reporting purposes and the amounts used for taxation
purposes. The amount of deferred tax provided is based
on the expected manner of realisation or settlement of
the carrying amount of assets and liabilities, using tax
rates enacted or substantively enacted at the reporting
date.
A deferred tax asset is recognised only to the extent
that it is probable that future taxable profits will be
available against which the asset can be utilised.
Deferred tax assets are reduced to the extent that it is
no longer probable that the related tax benefit will be
realised.
1.15 Provisions
A provision is recognised in the statement of financial
position when the company has a present legal or
constructive obligation as a result of a past event, and it
is probable that an outflow of economic benefits will
be required to settle the obligation.
1.16 Impairment
The carrying amounts of the company’s assets are
reviewed at each reporting date to determine whether
there is any indication of impairment. If there is any
indication that an asset is impaired, its recoverable
amount is estimated. The recoverable amount is the
higher of its fair value less costs to sell and its value in
use. An impairment loss is recognised in profit or loss
whenever the carrying amount of an asset exceeds its
recoverable amount. In assessing the value in use, the
expected future cash flows from the asset are
discounted to their present value using a pre-tax
discount rate that reflects current market assessments
of the time value of money and the risks specific to the
asset.
A previously recognised impairment loss is reversed if
the recoverable amount increases as a result of a change
in the estimates used to determine the recoverable
amount, but not to an amount higher than the carrying
amount that would have been determined (net of
amortisation) had an impairment loss not been
recognised in prior years.
1.17 Financial instruments
Financial assets are recognised when the company
becomes a party to the contractual terms that comprise
an asset. On initial recognition these instruments are
recognised at fair value or for financial instruments not
carried at fair value, the cost thereof, including
transaction costs. Subsequent to initial recognition,
these instruments are measured as set out below:
Investments
Investments are classified at fair value through profit or
loss. The investments are managed and their
performance evaluated and reported internally on a
fair value basis in terms of a documented investment
strategy. The fair value of listed investments is measured
with reference to their quoted bid prices at the
reporting date.
Trade and other receivables/Other accounts payable
Trade and other receivables/payables (which includes
amounts due from/to reinsurance contracts/
retrocessionaires) are stated at amortised cost using
the effective interest rate method, less any impairement
losses.
Cash and cash equivalents
Cash and cash equivalents comprise cash balances and call
deposits with original maturities of three months or less.
Cash and cash equivalents are stated at amortised cost.
Notes To The Financial Statements

17Annual Report 2018-2019
Financial liabilities
Non-derivative financial liabilities are recognised at
amortised cost, comprising original debt less principal
payments and amortisations.
Derecognition
A financial asset is derecognised when the company
loses control over the contractual rights that comprise
an asset and consequently transfers the risks and
benefits associated with the asset on trade date. This
occurs when the rights are realised, expire or are
surrendered. A financial liability is derecognised when
it is legally extinguished.
Offset
Financial assets and financial liabilities are offset and
the net amount reported in the statement of financial
position when the company has a legally enforceable
right to set off the recognised amounts, and intends
either to settle on a net basis, or to realise the asset and
settle the liability simultaneously.
1.18 Foreign currencies
Assets and liabilities in foreign currencies are translated
to South African Rand at rates of exchange ruling at the
reporting date.
Foreign currency transactions during the year are
recorded at rates of exchange ruling at the transaction
date. Realised and unrealised gains or losses on
exchange are accounted for in profit and loss during
the period that they arise.
1.19 Retrocession
The company retrocedes insurance risk in the normal
course of business for the purpose of limiting its net
loss potential through the diversification of its risk.
Retrocession arrangements do not relieve the company
from its direct obligation to cedants. Amounts
recoverable under retrocession contracts are recognised
in the same year as the related claim. Amounts
recoverable under retrocession agreements are
assessed for impairment at each reporting date. Such
assests are deemed impaired if there is objective
evidence, as a result of an event that occurred after its
initial recognition that the company may not recover
all amounts due.
Premiums retroceded, claims reimbursed and
commission income are presented in the statement of
comprehensive income and statement of financial
position separately from the gross amounts. Deferred
retrocession income is recognised on a basis consistent
with the provision for earned premiums.
2 Reinsurance risk management
2.1 Non-life reinsurance contracts
2.1.1 Risk management objectives and policies for
mitigating reinsurance risk
The company reactivated its underwriting non-life
reinsurance business as of 1 January 2015 after having
been in run off since 2002. The cover periods for all
historical reinsurance contracts, which were annual in
nature, had expired by the end of 2005. The company’s
exposure is therefore limited to the uncertainty
surrounding the timing of payment and severity of
claims already incurred under historical reinsurance
contracts. This is commonly referred to as claims
development risk.
Sound underwriting principles are applied when the
reinsurance contracts are underwritten. In order to
ensure that each contract was comprehensively
evaluated for underwriting and rating purposes, strict
underwriting guidelines, agreed to with the parent
company, are followed. The underwriting guidelines
stipulate the type of risks that could be underwritten,
as well as the exposure per risk that was acceptable.
The reinsurance contracts underwritten by the
company comprise:
• Property reinsurance: contracts that indemnify
against physical loss or damage and the financial
consequences from a loss or damage to land and
buildings.
• Transport reinsurance: contracts that indemnify
against losses from the possession, use or
Notes To The Financial Statements

18 Annual Report 2018-2019
ownership of a vessel, aircraft or other craft for the
conveyance of persons or goods.
• Accident reinsurance: contracts that indemnify
against losses from a variety of risks. These include:
- Motor
- Personal accident and health
- Guarantee
- Liability
- Engineering
- Miscellaneous
The claims liabilities recognised for each of these classes
at year end are disclosed in note 6.
The largest claims development uncertainty is
concentrated in those classes that are classified as long
tail, such as liability and engineering. Long tail business
is defined as reinsurance contracts under which claims
are typically not settled within one year of the
occurrence of the events giving rise to the claims. In
long tail classes, there is still significant scope for future
development, positive or negative, both in number of
claims, as well as the value of the claims.
• GIC Re South Africa Limited commenced its
operations from 01 January 2015 and is
underwriting non-life reinsurance business
emanating from Sub-Saharan Africa. In the month
of October 2017, the company’s territorial scope
was widened to underwrite business from 5 North
African Countries namely Algeria, Tunisia, Morocco,
Sudan and South Sudan. As a result GIC Re South
Africa has been underwriting business from the
entire Africa continent except Egypt and Libya.
• The company has regarded its concentration in
South Africa as a primary concern from the point of
view of hailstorm and earthquake exposures. To
mitigate the underwriting risk, it has in place a 70%
Whole Account Quota Share Treaty from Sirius,
Sweden. Further based on its internal assessment
and a catastrophe model sourced from a third party,
has calculated realistic disaster scenario in any one
catastrophe and as a matter of abundant precaution
procured an excess of loss protection from GIC Re,
India for US$ 49 million Xs. US$ 1 million for the
year 2018-19. The cover is currently in place. These
arrangements will protect the capital of the
company in any catastrophe event.
• The company had launched two new products last
year namely (1) Stand-alone Political Violence and
Terrorism (PVT) and (2) Retakaful business.
• For PVT business, the company has obtained an
Excess of Loss Protection for 12 months beginning
01 August, 2018 from the Lloyd’s Market.
• The Retakaful business has been protected under
the existing Whole Account Quota Share Treaty and
Whole Account Excess of Loss Cover.
2.1.2 Concentrations of reinsurance risk
Concentrations of risk may arise with a particular event
or series of events for example in one geographical
location.
2.1.3 Claims development information
Consistent with practice in the reinsurance industry,
quarterly statements received from insurers under
proportional reinsurance contracts, do not detail the
date of loss of reinsurance claims. Proportional
reinsurance contracts make up the largest part of the
company’s business. The majority of the business
underwritten is classified as “short-tail” meaning that
claims are settled within a year after the loss date. In
terms of IFRS 4, an insurer need only disclose claims
run-off information where uncertainty exists about the
amount and timing of claim payments not resolved
within one year.
Claims development is monitored in aggregate for all
loss years. Note 6 provides details of the overall changes
in estimates of claims liabilities created in earlier years.
2.2 Life reinsurance contracts
2.2.1 Risk management objectives and policies for
mitigating reinsurance risk
The company ceased underwriting life reinsurance
Notes To The Financial Statements

19Annual Report 2018-2019
business during 2002, and entered into a run-off phase.
The company has recaptured the entire life business in
the year ended 2018 and no liabilities are remaining at
the year end related to this business.
3 Financial risk
Transactions in financial instruments result in the
company assuming financial risks. These include market
risk, liquidity risk and credit risk. Each of these risks is
described below, together with ways in which the
company manages these risks.
3.1 Market risk
Market risk can be described as the risk of a change in
the fair value of a financial instrument brought about
by changes in interest rates, equity prices, or foreign
exchange rates.
• Equity price risk
The portfolio of listed equities, which are stated at
fair value at reporting date, has exposure to price
risk, being the potential loss in market value
resulting from adverse changes in prices. The
company’s objective is to earn competitive relative
returns by investing in a diverse portfolio of
securities. Portfolio characteristics are analysed on
a regular basis. The portfolio is invested in various
industries as detailed in note 10, and the largest
investment in any one company comprises 0.56%
(2018: 0.48%) of the total assets.
At 31 March 2019, the company’s ordinary listed
equities were recorded at their fair value of R141.63
million (2018: R89.10 million). A hypothetical 25%
decline in each share’s price would have decreased
profit before taxation by R35.41 million (2018:
R22.28 million).
• Interest rate risk
Fluctuations in interest rates impact on the value
of government securities and corporate bonds and
the interest returns from these investments. The
maturity profile of these instruments is set out in
note 10.
• Foreign currency risk
The company is exposed to foreign currency risk
for transactions that are denominated in a currency
other than Rand. The company is writing business
from whole of Africa, except Egypt and Libya. Initially
the company’s focus is to build foreign currency
reserves and match ZAR, USD and EUR Liabilities
with ZAR, USD and EUR assets.
3.2 Liquidity risk
The company ensures that the solvency of the company
meets the regulatory requirements at all times by
maintaining a high level of liquidity.
The company follows the regulatory provisions, in
conjuction with prudential norms laid out by the Board,
with regard to the investment of its funds. The general
investment strategy is to use cash as the default asset
class. In the initial years of operations equity exposure
will be maintained at lower levels.
Expected cashflows of liabilities:
Carrying 1 2 More
amount year years than 2
years
Deposits
withheld from
retrocessionaires 1,746,437,984 1,746,437,984 - -
Amounts
Payable to
retrocessionaire
contracts 366,629,601 366,629,601 - -
Other accounts
payable 12,517,452 12,517,452 - -
Maturity of Technical liabilities under insurance contracts have
been included in Note 6 - 9.
The company performs a currency-wise asset and
liability management exercise every quarter and any
decision on conversion of currencies is taken in ALCO
(Asset Liability Committee).
For Rand funds, the fund managers are instructed to
keep funds invested in such a way as to offer maximum
flexibility and high liquidity.
Notes To The Financial Statements
20 Annual Report 2018-2019
Over and above these liquidity measures, a letter of
comfort given by the parent company provides support
to the company in order to maintain adequate capital,
to meet solvency and policy holder liability
requirements and financial obligations.
3.3 Credit risk
The company has several exposures to credit risk,
which is the risk that a counterparty will be unable to
pay amounts in full when due. Key areas where the
company is exposed to credit risk are:
• amounts due from reinsurance policyholders;
• amounts due from reinsurance contract intermediaries;
• investments excluding equities; and
• retroceded technical liabilities.
Exposure to individual policyholders and groups of
policyholders are monitored as part of the credit control
process. Reputable financial institutions are used for
investing and cash handling purposes.
Under the terms of the retrocession agreements,
retrocessionaires agree to reimburse the ceded amount
in the event that a gross claim is paid. However, the
company remains liable to its cedants regardless of
whether the retrocessionaire meets the obligations it
has assumed. Consequently, the company is exposed
to credit risk.
GIC Re South Africa Ltd reinsures with Sirius
International Insurance Corporation which has been
rated A (excellent) by A.M.Best and A- (Strong) by S&P
Ratings.
From April 2018, Sirius International Insurance
Corporation arranged a 70% whole account quota share
treaty whereby 70% of the claims are recovered from
Sirius International Insurance Corporation. In addition
to this GIC Re South Africa Ltd continues to withhold
40% of the premium as premium reserve deposit and
retain 100% of the outstanding claims reserve as an
outstanding claims reserve deposit.
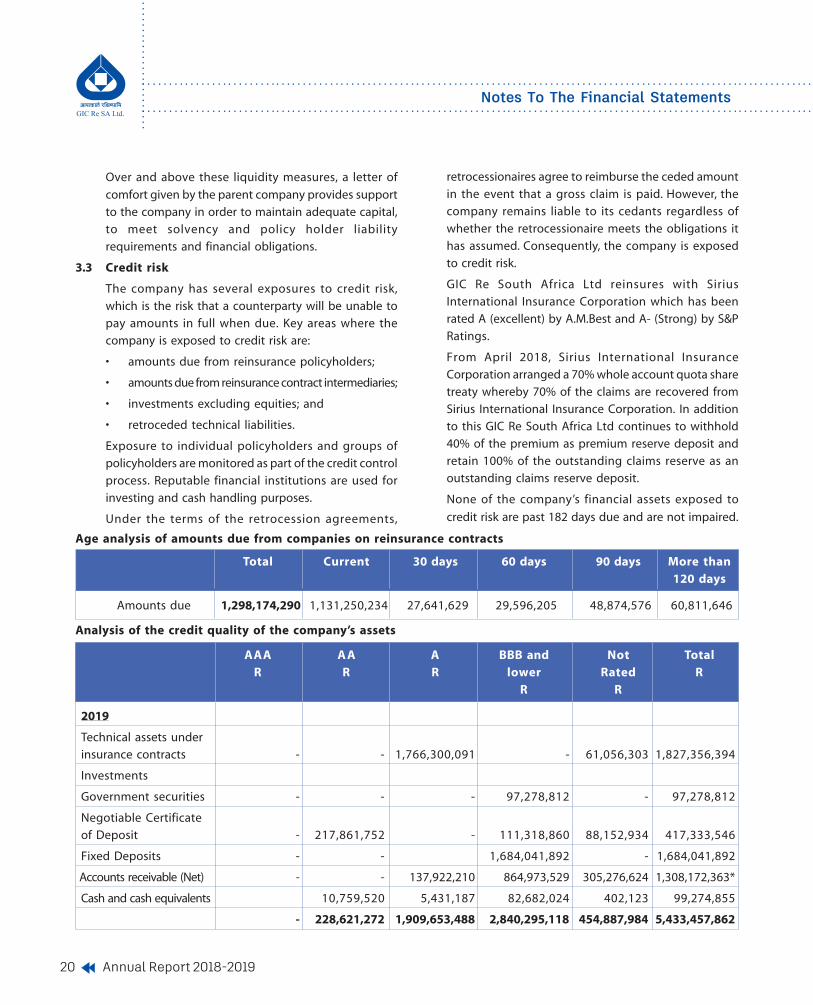
None of the company’s financial assets exposed to
credit risk are past 182 days due and are not impaired.
Age analysis of amounts due from companies on reinsurance contracts
Total Current 30 days 60 days 90 days More than
120 days
Amounts due 1,298,174,290 1,131,250,234 27,641,629 29,596,205 48,874,576 60,811,646
Analysis of the credit quality of the company’s assets
AAA A A A BBB and Not Total
R R R lower Rated R
R R
2019
Technical assets under
insurance contracts - - 1,766,300,091 - 61,056,303 1,827,356,394
Investments
Government securities - - - 97,278,812 - 97,278,812
Negotiable Certificate
of Deposit - 217,861,752 - 111,318,860 88,152,934 417,333,546
Fixed Deposits - - 1,684,041,892 - 1,684,041,892
Accounts receivable (Net) - - 137,922,210 864,973,529 305,276,624 1,308,172,363*
Cash and cash equivalents 10,759,520 5,431,187 82,682,024 402,123 99,274,855
- 228,621,272 1,909,653,488 2,840,295,118 454,887,984 5,433,457,862
Notes To The Financial Statements

21Annual Report 2018-2019
2018
Technical assets under
insurance contracts - - 1,449,141,057 - 197,309,326 1,646,450,383
Investments
Government securities - - - 17,967,667 - 17,967,667
Negotiable Certificate
of Deposit - 213,060,682 - 143,427,439 - 356,488,121
Fixed Deposits - - 10,251,853 501,159,385 - 511,411,238
Accounts receivable (Net) 3,257,836 - 367,163,904 419,909,132 105,642,693 895,973,565*
Cash and cash equivalents - 26,734,039 13,242,465 90,573,133 - 130,549,637
3,257,836 239,794,721 1,839,799,279 1,173,036,756 302,952,019 3,558,840,611
AAA A A A BBB and Not Total
R R R lower Rated R
R R
The company’s maximum exposure to credit risk is
analysed in the tables above.
The assets as above are based on external credit ratings
obtained from various reputable rating agencies like
Fitch and Standard and Poor’s. The international rating
scales are based on long-term investment horizons
under the following broad investment grade
definitions:
AAA The financial instrument is judged to be of the
highest quality, with minimal credit risk and
indicates the best quality issuers that are reliable
and stable.
AA The financial instrument is judged to be of high
quality and is subject to very low credit risk and
indicates quality issuers.
A The financial instrument is considered upper-
medium grade and is subject to very low credit
risk although certain economic situations can
more readily affect the issuers’ financial
soundness adversely than those rated AAA or AA.
BBB The financial instrument is subject to moderate
credit risk and indicate medium class issuers,
which are currently satisfactory.
* Amount receivable is net of provision for doubtful
debts of R19.72 million (2018 : R5.08 million).
Fair value hierarchy
The table below analyses assets carried at fair value, by
valuation method. The different levels have been
defined as follows:
Level 1
Quoted market price in an active market for an identical
instrument.
Level 2
Valuation techniques based on observable inputs, either
directly (i.e. as prices) or indirectly (i.e. derived from
prices). This category includes instruments valued using
quoted market prices in active markets for similar
instruments; quoted prices for identical or similar
instruments in markets that are considered less than
active; or other valuation techniques where all significant
inputs are directly observable from market data.
Level 3
Valuation techniques using significant unobservable
inputs. This category includes all instruments where the
valuation technique includes inputs not based on
observable data and the unobservable inputs have a
Notes To The Financial Statements

22 Annual Report 2018-2019
significant effect on the instrument’s valuation. This
category includes instruments that are valued based on
quoted prices for similar instruments where significant
2019 Level 1 Level 2 Level 3 Total
Financial assets designated at fair value
through profit or loss 97,278,812 - - 97,278,812
Financial assets mandatory at fair value
through profit or loss 154,832,643 236,329,368 - 391,162,011
252,111,455 236,329,368 - 488,440,823
2018 Level 1 Level 2 Level 3 Total
Financial assets designated at fair value
through profit or loss 3,080,649 - - 3,080,649
Financial assets mandatory at fair value
through profit or loss 119,184,388 349,632,869 - 468,817,257
122,265,037 349,632,869 - 471,897,906
Collective Investment schemes are valued based on its
unit price or the net asset value (NAV), depending onthe market value of the underlying investments inwhich the pool of money is invested. Its yield iscalculated by taking the interest and income receivableof all the instruments in the fund divided by the netasset value, expressed as a nominal annual rate.
Capital management
The company recognises equity and reserves as capitaland Management closely monitors the company’scapital position relative to the economic and regulatoryrequirements. The company submits quarterly andannual returns to the Prudential Authority in terms ofthe Insurance Act, 2017. The company is required to atall times to maintain a minimum capital adequacyrequirement as defined in the Insurance Act, 2017. Thecompany with the assistance of its consulting actuary,has addressed the capital needs under the new SolvencyAssessment and Management (SAM) regime (from July2018) and have complied with the transitional reportingrequirements as communicated by the Regulator.
4 Technical provisions and liabilities under
insurance contracts
Insurance risks are unpredictable and the companyrecognises that it is impossible to forecast with absolute
precision claims payable under insurance contracts.
Over time, the company has developed a methodology
that is aimed at establishing insurance provisions and
liabilities that have a reasonable likelihood of being
adequate to settle all its insurance obligations.
4.1 Non-life reinsurance contracts
4.1.1 Claim provisions
The outstanding claims provisions include notified
claims as well as incurred but not yet reported claims.
Outstanding claims provisions are not discounted.
Notified claims
Claims notified by cedants are assessed with due regard
to the specific circumstances, information available from
the cedant and/or loss adjuster and past experience
with similar claims. The company employs staff
experienced in claims handling and rigorously applies
standardised policies and procedures around claims
assessment.
The ultimate cost of the reported claims may vary as a
result of future developments or better information
becoming available about current circumstances.
Estimates are therefore reviewed regularly and followed
up with the cedant to ensure that it is still current.
Notes To The Financial Statements
unobservable adjustments or assumptions are required
to reflect differences between the instruments.

23Annual Report 2018-2019
4.1.2 Premium provisions and deferred commission
Unearned premium provisions and deferred
commission assets have been recognised. For
Facultative 365th method is used, a blend of 8th method
and 50% method is used for Proportional treaty business
and for the Non-proportional treaty 8th method is used.
4.1.3 Assumptions
As a reinsurer it is necessary to estimate proportional
premiums earned, but not yet reported by cedants
(pipeline premiums estimates). The Pipeline premium
is calculated separately for Facultative, Proportional
Treaty and Non-proportional treaty business. For each,
triangulation is done on an annual basis, separately
for foreign and local business. The chain ladder
method is then applied to determine the pipeline
premium.
Assumptions based on actual claims experience to date
have been used in determining the claim provisions.
Profit commissions are payable to cedants based on
the performance of the contracts underwritten and are
estimated with reference to premiums and claims
recorded in the financial statements.
4.1.4 Recoverability of Insurance Receivables
Amounts due from cedants have been assessed for an
indication of impairment due to significant financial
difficulty, a breach of contract or other observable data
indicating a measurable decrease in the future cash
recoverable. This may include adverse changes in the
payment status of cedants or economic conditions that
may lead to default of amounts due.
The carrying amount of insurance receivables has been
reduced by a provision for doubtful debts and the amount
of the loss has been recognised in the statement of
comprehensive income. If in future the amount becomes
recoverable the previously recognised provisions for
doubtful debts will be reversed through the statement
of comprehensive income.
5 Equipment
Particulars 31 March 31 March
2019 2018
R R
At cost
Equipment 1,862,918 1,646,630
Furniture 766,151 749,463
Motor vehicles 2,256,564 1,602,689
4,885,633 3,998,782
Accumulated depreciation
Equipment 1,383,799 1,076,678
Furniture 522,143 426,172
Motor vehicles 1,116,992 665,679
3,022,934 2,168,529
Net book value
Equipment 479,119 569,952
Notes To The Financial Statements

24 Annual Report 2018-2019
Furniture 244,008 323,291
Motor vehicles 1,139,572 937,010
1,862,699 1,830,253
Equipment
Net book value at beginning of year 569,952 485,960
Additions 216,288 464,225
Disposals - (24,999)
Depreciation (307,121) (355,234)
Net book value at end of year 479,119 569,952
Furniture
Net book value at beginning of year 323,291 328,508
Additions 16,687 93,402
Disposals - (4,031)
Depreciation (95,970) (94,588)
Net book value at end of year 244,008 323,291
Motor vehicles
Net book value at beginning of year 937,010 429,017
Additions 653,875 902,789
Disposals - (74,530)
Depreciation (451,313) (320,266)
Net book value at end of year 1,139,572 937,010
Total
Net book value at beginning of year 1,830,253 1,243,485
Additions 886,850 1,460,416
Disposals - (103,560)
Depreciation (854,404) (770,088)
Net book value at end of year 1,862,699 1,830,253
Particulars 31 March 31 March
2019 2018
R R
Notes To The Financial Statements
25Annual Report 2018-2019
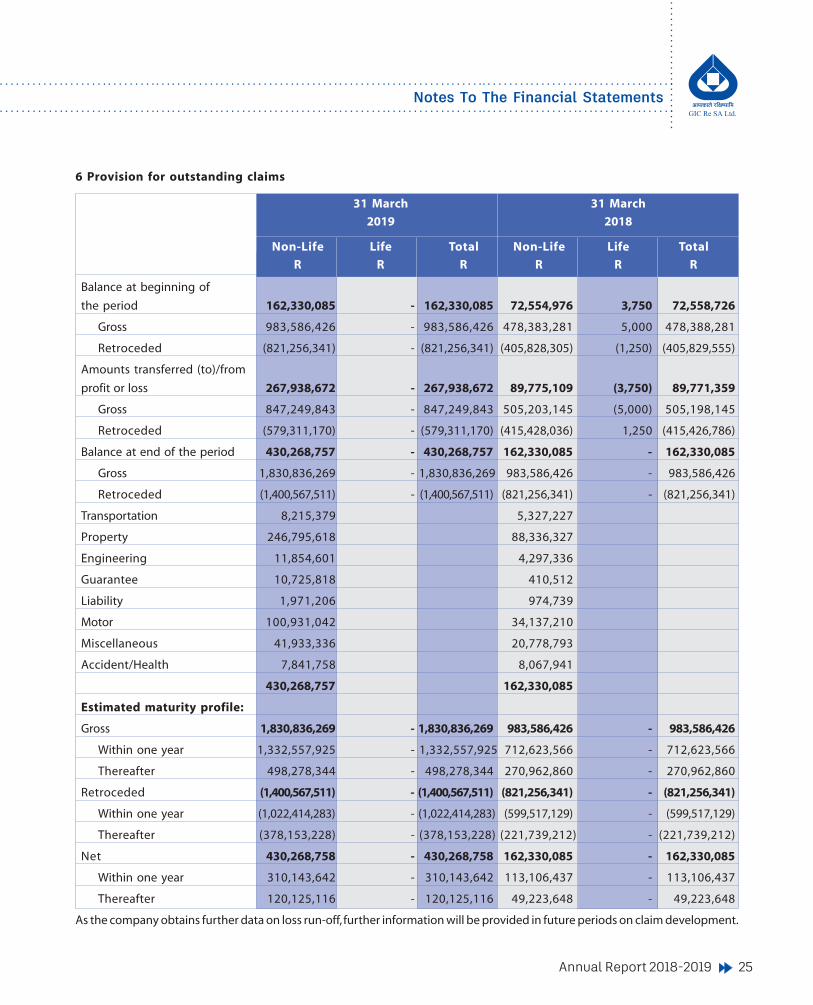
31 March 31 March
2019 2018
Non-Life Life Total Non-Life Life Total
R R R R R R
Balance at beginning of
the period 162,330,085 - 162,330,085 72,554,976 3,750 72,558,726
Gross 983,586,426 - 983,586,426 478,383,281 5,000 478,388,281
Retroceded (821,256,341) - (821,256,341) (405,828,305) (1,250) (405,829,555)
Amounts transferred (to)/from
profit or loss 267,938,672 - 267,938,672 89,775,109 (3,750) 89,771,359
Gross 847,249,843 - 847,249,843 505,203,145 (5,000) 505,198,145
Retroceded (579,311,170) - (579,311,170) (415,428,036) 1,250 (415,426,786)
Balance at end of the period 430,268,757 - 430,268,757 162,330,085 - 162,330,085
Gross 1,830,836,269 - 1,830,836,269 983,586,426 - 983,586,426
Retroceded (1,400,567,511) - (1,400,567,511) (821,256,341) - (821,256,341)
Transportation 8,215,379 5,327,227
Property 246,795,618 88,336,327
Engineering 11,854,601 4,297,336
Guarantee 10,725,818 410,512
Liability 1,971,206 974,739
Motor 100,931,042 34,137,210
Miscellaneous 41,933,336 20,778,793
Accident/Health 7,841,758 8,067,941
430,268,757 162,330,085
Estimated maturity profile:
Gross 1,830,836,269 - 1,830,836,269 983,586,426 - 983,586,426
Within one year 1,332,557,925 - 1,332,557,925 712,623,566 - 712,623,566
Thereafter 498,278,344 - 498,278,344 270,962,860 - 270,962,860
Retroceded (1,400,567,511) - (1,400,567,511) (821,256,341) - (821,256,341)
Within one year (1,022,414,283) - (1,022,414,283) (599,517,129) - (599,517,129)
Thereafter (378,153,228) - (378,153,228) (221,739,212) - (221,739,212)
Net 430,268,758 - 430,268,758 162,330,085 - 162,330,085
Within one year 310,143,642 - 310,143,642 113,106,437 - 113,106,437
Thereafter 120,125,116 - 120,125,116 49,223,648 - 49,223,648
As the company obtains further data on loss run-off, further information will be provided in future periods on claim development.
6 Provision for outstanding claims
Notes To The Financial Statements

26 Annual Report 2018-2019
Particulars 31 March 31 March
2019 2018
R R
7 Policyholder liabilities for life insurance contracts
Balance at beginning of year - 13,835,338
Gross - 16,894,528
Retroceded - (3,059,190)
Amounts transferred (to)/from profit and loss - 13,835,338
Gross 16,894,528
Retroceded (3,059,190)
Balance at end of year - -
Gross - -
Retroceded - -
Estimated maturity profile:
Gross - -
Within one year - -
Thereafter - -
Retroceded - -
Within one year - -
Thereafter - -
Net - -
Within one year - -
Thereafter - -
Notes To The Financial Statements

27Annual Report 2018-2019
8 Unearned premium reserve
Particulars 31 March 31 March
2019 2018
R R
Balance at beginning of year 208,072,972 44,359,644
Gross 835,957,690 332,164,908
Retroceded (627,884,718) (287,805,264)
Amounts transferred through profit and loss (48,764,573) 163,713,328
Gross (310,916,711) 503,792,782
Retroceded 262,152,138 (340,079,454)
Balance at end of year 159,308,399 208,072,972
Gross 525,040,979 835,957,690
Retroceded (365,732,580) (627,884,718)
9 Deferred acquisition costs
Particulars 31 March 31 March
2019 2018
R R
Balance at beginning of year 20,655,984 3,611,205
Gross 197,309,324 79,739,841
Retroceded (176,653,340) (76,128,636)
Amounts transferred through profit and loss 6,451,772 17,044,779
Gross (136,253,021) 117,569,483
Retroceded 142,704,793 (100,524,704)
Balance at end of year 27,107,756 20,655,984
Gross 61,056,303 197,309,324
Retroceded (33,948,547) (176,653,340)
For the year ended 31 March 2019, Actuarial Methodology has been used to calculate Unearned premium reserve and
Deferred Acquisition costs.
Notes To The Financial Statements

28 Annual Report 2018-2019
10 Investments
31 March 31 March
Particulars 2019 2018
R R R R
Cost Carrying Value Cost Carrying Value
Negotiable certificates of deposits 404,000,000 417,333,546 351,000,000 356,488,121
Treasury bills - - 14,887,018 14,887,018
Fixed deposits 1,684,041,892 1,684,041,892 501,365,028 511,411,238
Ordinary shares - listed 148,543,371 141,631,994 88,837,213 89,098,766
Collective investment schemes - listed 235,077,052 236,329,368 347,556,413 349,632,869
Preference shares - listed 16,203,959 13,200,649 15,793,596 15,198,604
Government bonds - listed 86,000,000 97,278,812 2,877,241 3,080,649
Total investments at fair value throughprofit or loss 2,573,866,274 2,589,816,261 1,322,316,509 1,339,797,265
% 2019 % 2018
Listed ordinary shares portfolio analysis
Basic materials 18 21
Consumer services 23 18
Financials 50 56
Industrials 9 5
100 100
Maturity profile of fixed interest securities
Less than One to More than Total
one year five years five years
R R R R
2019
Negotiable certificates of deposits 417,333,546 - - 417,333,546
Treasury bills - - - -
Fixed deposits 1,431,435,608 252,606,284 - 1,684,041,892
Government bonds - 97,278,812 - 97,278,812
2018
Negotiable certificates of deposits 356,488,121 - - 356,488,121
Treasury bills 14,887,018 - - 14,887,018
Fixed Deposits 440,878,433 70,532,805 - 511,411,238
Government bonds - 3,080,648 - 3,080,648
Notes To The Financial Statements
29Annual Report 2018-2019
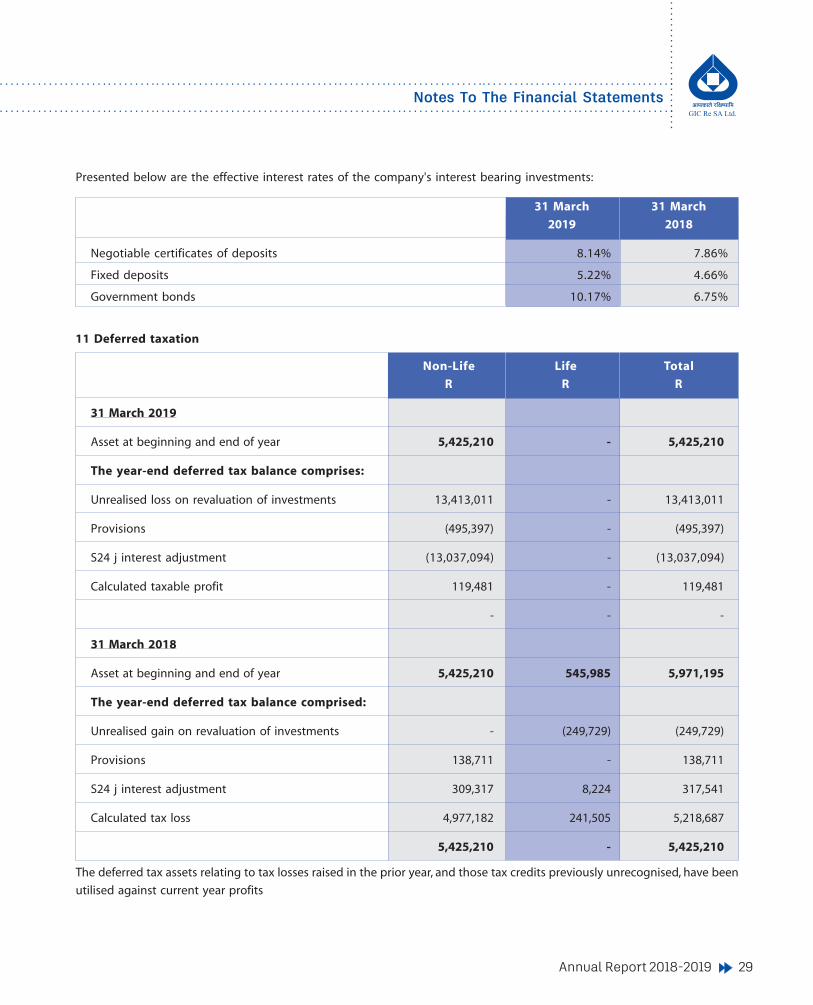
Non-Life Life Total
R R R
31 March 2019
Asset at beginning and end of year 5,425,210 - 5,425,210
The year-end deferred tax balance comprises:
Unrealised loss on revaluation of investments 13,413,011 - 13,413,011
Provisions (495,397) - (495,397)
S24 j interest adjustment (13,037,094) - (13,037,094)
Calculated taxable profit 119,481 - 119,481
- - -
31 March 2018
Asset at beginning and end of year 5,425,210 545,985 5,971,195
The year-end deferred tax balance comprised:
Unrealised gain on revaluation of investments - (249,729) (249,729)
Provisions 138,711 - 138,711
S24 j interest adjustment 309,317 8,224 317,541
Calculated tax loss 4,977,182 241,505 5,218,687
5,425,210 - 5,425,210
The deferred tax assets relating to tax losses raised in the prior year, and those tax credits previously unrecognised, have been
utilised against current year profits
11 Deferred taxation
Presented below are the effective interest rates of the company's interest bearing investments:
31 March 31 March
2019 2018
Negotiable certificates of deposits 8.14% 7.86%
Fixed deposits 5.22% 4.66%
Government bonds 10.17% 6.75%
Notes To The Financial Statements

30 Annual Report 2018-2019
12 Other accounts payable
31 March 31 March
Particulars 2019 2018
R R
Accrual for leave pay 625,074 495,397
Other 11,892,378 5,675,327
12,517,452 6,170,724
13 Share capital
31 March 31 March
Particulars 2018 2017
R R
Authorised
1 500 000 000 ordinary shares of no par value
Issued
At beginning of the year
421 856 675 ordinary shares of no par value 843,713,350 253,900,000
Issued during the year
149 174 187 ordinary shares of no par value 298,348,375 589,813,350
At end of the year
571 030 862 ordinary shares of no par value 1,142,061,725 843,713,350
The unissued shares are under the control of the directors.
14 Revaluation reserve
31 March 31 March
Particulars 2019 2018
R R
Investments
Opening Balance 141,956 1,733,310
Revaluation Gain/ (Loss) (10,166,270) (1,591,354)
Closing Balance (10,024,314) 141,956
The revaluation reserve represents the revaluation of traded securities which is net of deferred tax.
Notes To The Financial Statements

31Annual Report 2018-2019
Non-Life Life Total
R R R
31 March 2019
Dividends received - listed 9,690,084 383,534 10,073,618
Interest income 106,834,264 1,679,648 108,513,912
Realised gain/ (loss) on disposal of investments 2,605,968 284,970 2,890,937
Net movement in unrealised gains and losses on
revaluation and disposal of investments (13,413,011) (706,808) (14,119,819)
105,717,305 1,641,344 107,358,649
31 March 2018
Dividends received - listed 1,138,913 140,124 1,279,037
Interest received 41,084,034 2,028,799 43,112,833
Realised gain/ (loss) on disposal of investments 2,423,901 (30,603) 2,393,298
Net movement in unrealised gains and losses on
revaluation and disposal of investments (2,544,031) 333,817 (2,210,214)
42,102,817 2,472,137 44,574,954
15 Net investment income
16 Claims incurred
Non-Life Life Total
R R R
31 March 2019
Claims paid (288,515,706) - (288,515,706)
Gross (1,172,817,195) - (1,172,817,195)
Retroceded 884,301,490 - 884,301,490
Change in provision for outstanding claims (267,938,673) - (267,938,673)
Gross (847,249,843) - (847,249,843)
Retroceded 579,311,170 - 579,311,170
Claims incurred (556,454,378) - (556,454,378)
Notes To The Financial Statements

32 Annual Report 2018-2019
31 March 31 March
Particulars 2019 2018
R R
Commission expense
Gross commision and brokerage paid (685,800,428) (412,176,317)
Gross deferred acquisition cost (136,253,022) 117,569,484
(822,053,450) (294,606,833)
Commission income
Retrocession commision and brokerage received 535,890,480 366,734,485
Retroceded deferred commission revenue 142,704,794 (100,524,705)
678,595,274 266,209,780
17 Commission
31 March 2018
Claims paid (130,623,437) (46,229) (130,669,666)
Gross (740,056,477) (61,639) (740,118,116)
Retroceded 609,433,040 15,410 609,448,450
Change in provision for outstanding claims (89,775,110) 3,750 (89,771,360)
Gross (505,203,146) 5,000 (505,198,146)
Retroceded 415,428,036 (1,250) 415,426,786
Claims incurred (220,398,547) (42,479) (220,441,026)
Non-Life Life Total
R R R
Notes To The Financial Statements

33Annual Report 2018-2019
31 March 31 March
Particulars 2019 2018
R R
Profit before taxation is stated after charging:
Employee costs - salaries and bonuses 8,636,189 8,069,659
External auditor's remuneration
– audit services 501,800 897,324
– non-audit services - 15,000
501,800 912,324
Consulting fees paid 2,214,524 2,489,529
Depreciation of equipment 854,404 770,088
Operating lease expense 1,807,872 2,436,811
18 Profit before taxation
Non-Life Life Total
R R R
31 March 2019
South African normal tax
Current taxation
– current year (83,771,219) (411,361) (84,182,580)
– utilization of tax credit 29,810,867 - 29,810,867
Deferred taxation
– current year - - -
(53,960,352) (411,361) (54,371,713)
Tax rate reconciliation: % %
Standard tax rate 28 28
Dividends received (1) (9)
19 Taxation
Notes To The Financial Statements

34 Annual Report 2018-2019
Return transfers previously not recognised and other
four funds tax losses - -
Assessed losses brought forward (9)
Other 0 15
Effective tax rate 18 34
31 March 2018
South African normal tax
Current taxation
– current year - (545,985) (545,985)
– utilization of tax credit 545,985 545,985
Deferred taxation -
– current year 545,985 545,985
- 545,985 545,985
Tax rate reconciliation: % %
Standard tax rate 28 28
Dividends received - -
Return transfers previously not recognised and other
four funds tax losses - (18)
Calculated tax loss for which no deferred tax asset
is raised (27) (2)
Other (1) (1)
Effective tax rate 0 7
Deferred tax has not been raised in respect of non-life business, Assessed losses of R 106.4 million (2017: R29.36 million &
2018: R77.1 million) have recognised and offset against 2019 tax on profit
Non-Life Life Total
R R R
20 Related party transactions
20.1 Identity of related parties
The current holding company is General Insurance Corporation of India (GIC Re India), which acquired 100% of the company's
shares on 24 April 2014.
Notes To The Financial Statements

35Annual Report 2018-2019
Particulars 2019 2018
R R
Directors emoluments are set out below:
- Salaries and bonuses
D Prasad Managing director - 1,948,542
CG Asirvatham Managing director 2,027,698
2,027,698 1,948,542
- Fees
S Bhikha Non-executive director 380,000 360,000
CI Moosa Non-executive director 300,000 255,000
J Bagg Non-executive director 350,000 370,000
1,030,000 985,000
Other non-executive directors of GIC Re South Africa Ltd are appointed by GIC Re India (parent company) and do not earn
any remuneration for their services pertaining to the company.
Key personnel
- Salaries and bonuses
S Karmarkar Chief Operating Officer 337,239 * 710,971
SK Jangir Chief Finance Officer, Manager – HR 235,710 * 508,222
Z Ahmad Chief Underwriting Officer 235,710 * 509,041
SKR Chintapalli Chief Technology Officer 229,961 * 497,141
F Mosam Chief Technical Accounts Officer 329,500 313,500
W Mwase Public Officer, Company Secretary, Manager - Admin 325,000 310,500
S Shankar Chief Operating Officer 341,239 **
S Sapdhare Chief Finance Officer, Manager – HR 312,803 ***
C Verma Chief Underwriting Officer 349,204 #
A Tamhane Chief Risk Officer 349,204 ##
3,045,570 2,849,375
Apart from above, R1,31 million (2018 : R1,23 million) was paid as rent for accommodation provided to executive officers.
* From April 2018 to September 2018
** Joined 18 July 2018
*** Joined 01 August 2018
# Joined 28 June 2018
## Joined 21 June 2018
20.2 Transactions with key management personnel
The remuneration of the executive general management, who are key management personnel of the company, is set out
below in aggregate.
Notes To The Financial Statements

36 Annual Report 2018-2019
20.3 Other related party transactions
The following transactions were entered with the current holding company:
2019 2018
R R
Statement of comprehensive income effects :
Retroceded premiums to holding company 202,430,468 499,136,610
Retroceded claims from holding company (358,281,105) (512,458,497)
Retroceded commission from holding company (41,945,973) (152,513,943)
Interest paid on Reserve Deposits (7,803,301) (9,100,552)
Statement of financial position effects :
Retroceded outstanding claims 581,408,674 490,038,499
Retroceded unearned premium provision (22,378,180) 230,614,562
Retroceded deferred acquisition cost 6,704,898 (75,382,295)
Retroceded reserve deposit 383,492,862 653,274,462
Particulars 2019 2018
R R
21 Commitments and contingencies
The company entered into a lease agreement for the rental of its
premises for a period of three years with an escalation of 9% per annum.
Future rentals payable under the operating lease as at year end is:
Within one year 1,304,459 1,196,751
One to five years 1,304,459
1,304,459 2,501,210
The operating lease expires on 31 March 2020.
Notes To The Financial Statements

37Annual Report 2018-2019
22 Other company information
Business
The company is a composite reinsurer that was previously
in run-off and as of 1 January 2015 began writing non-life
reinsurance business. Company has recaptured the entire
Life Run-off business in FY 2017-18.
Dividends
No dividends were paid during the year (2018 : Nil)
Going concern
The directors believe that the company will be a going
concern in the future.
23 New standards, amendments and interpretations
to existing standards that are not yet effective
and have not been early adopted by the company
A number of new standards, amendments to standards
and interpretations are effective for annual periods
beginning on or after 1 January 2017, and have not
been applied in preparing these ûnancial statements.
Those which may be relevant to the Company are set
out below. The Company does not plan to adopt these
standards early. These will be adopted in the period
that they become mandatory unless otherwise
indicated:
lFRS 9: Financial instruments - periods beginning
on or after 1 January 2018
On 24 July 2014, the IASB issued the final IFRS 9
Financial instruments Standard, which replaces earlier
versions of IFRS 9 and completes the lASB’s project to
replace IAS 39 Financial Instruments: Recognition and
Measurement.
This standard will have a significant impact on the
Company, which will include changes in the
measurement bases of the Company’s financial assets
to amortised cost, fair value through other
comprehensive income or fair value through profit or
loss. Even though these measurement categories are
similar to IAS 39, the criteria for classification into these
categories are significantly different. In addition, the
IFRS 9 impairment model has been changed from an
“incurred loss” model from IAS 39 to an “expected
credit loss” model, which is expected to increase the
provision for bad debts recognised in the Company.
Considering that the wider GIC Re Group is not
implementing IFRS 9 in 2018, GIC Re SA Ltd has the
abililty to defer implementation of IFRS 9 until 2022
when IFRS 17 will also go live.While the deferral
exemption has been applied, some indicative
disclosure for new categories of fair value have been
reflected in notes 3 and 26.
IFRS 17: Insurance Contracts - effective for the
financial year commencing 1 January 2022
The standard supersedes IFRS 4 Insurance Contracts.
IFRS 17 addresses the recognition, measurement,
presentation and disclosure of insurance contracts
issued, reinsurance contracts held and investment
contracts with discretionary participation features. The
standard contains guidance on when to separate
components in an insurance contract and account for
them in terms of another standard. The components
that have to be separated (subject to certain criteria)
are embedded derivatives, distinct investment
components and distinct goods and non-insurance
services.
The standard requires an entity to identify portfolios of
insurance contracts and to group them into the
following groups at initial recognition:
- Contracts that are onerous
- Contracts that have no significant possibility of
becoming onerous subsequently and
- The remaining contracts in the portfolio.
Groups of insurance contracts should be measured at
initial recognition at the total of the following:
- The fulfilment cash flows which comprise estimates
of future cash flows, an adjustment to reflect the
time value of money and the financial risks and a
risk adjustment for non-financial risk and
Notes To The Financial Statements

38 Annual Report 2018-2019
- The contractual service margin which represents
the profit in the group of insurance contracts that
will be recognised in future periods.
The carrying amount of a group of insurance contracts
at the end of each reporting period shall be the sum of:
- the liability for remaining coverage (fulfilment cash
flows related to future service and the contractual
service margin) and
- the liability for incurred claims (fulfilment cash flows
related to past service).
An entity may simplify the measurement of a group of
insurance contracts using the premium allocation
approach if certain criteria is met.
The new standard will have a significant impact on the
financial statements when it is initially applied which
will include changes to the measurement of insurance
contracts issued and the presentation and disclosure.
The standard is effective for annual periods beginning
on or after 1 January 2022 and has to be applied
retrospectively. Early adoption is permitted. The
company is expecting to adopt IFRS 17 in its financial
statements for the year ending 31 March 2023.
IFRS 15: Revenue from Contracts with Customers –
periods beginning on or after 1 January 2018
IFRS 15 was issued in May 2014 and applies to an annual
reporting period beginning on or after 1 January 2018.
IFRS 15 specifies how and when an IFRS reporter will
recognise revenue as well as requiring such entities to
provide users of financial statements with more
informative, relevant disclosures. The standard provides
a single, principles based five-step model to be applied
to all contracts with customers.
IFRS 15 replaces the following standards and
interpretations:
IAS 11 Construction contracts
IAS 18 Revenue
IFRIC 13 Customer Loyalty Programmes
IFRIC 15 Agreements for the Construction of Real Estate
IFRIC 18 Transfers of Assets from Customers
SIC-31 Revenue - Barter Transactions Involving
Advertising Services
The objective of IFRS 15 is to establish the principles
that an entity shall apply to report useful information to
users of financial statements about the nature, amount,
timing, and uncertainty of revenue and cash flows
arising from a contract with a customer.
Although the new revenue standard does not apply to
Re/Insurance contracts , It may apply to other non Re/
Insurance contracts like asset management, insurance
broking, claims handling or custody services ,etc and
impact the company. Insurance contracts, along with
contractual rights or obligations in the scope of the
financial instruments standard (IFRS 9), are fully or partly
scoped out of the new revenue standard.
However, non -Re/insurance service contracts may fall
entirely in the scope of the new standard.Contracts
that are partly in the scope of another standards will be
first subject to the requirements of the other standard
(e.g. IFRS 9 Financial instruments ), if that standard
specifies how to separate and/or initially measure one
or more parts of the project.
The impact of IFRS15 has not been material for the
company for the year. Revenue caught within the scope
of the standard is immaterial, and prior recognition and
measurement practise for those revenues are in line
with IFRS15.
IFRS 16: Leases – periods beginning on or after 1
January 2019
IFRS 16 was issued in January 2016 and applies to annual
reporting periods beginning on or after 1 January 2019.
IFRS 16 specifies how an IFRS reporter will recognise,
measure, present and disclose leases. The standard
provides a single lessee accounting model, requiring
lessees to recognise assets and liabilities for all leases
unless the lease term is 12 months or less or the
underlying asset has a low value. Lessors continue to
classify leases as operating or finance, with IFRS 16’s
approach to lessor accounting substantially unchanged
from its predecessor, IAS 17.
Notes To The Financial Statements

39Annual Report 2018-2019
Notes To The Financial Statements
IFRS 16 replaces the following standards and
interpretations:
IAS 17 Leases
IFRIC 4 Determining whether an Arrangement contains
a Lease
SIC-15 Operating Leases - Incentives
SIC-27 Evaluating the Substance of Transactions
Involving the Legal Form of a Lease
The impact on GIC Re SA Ltd of this standard is unlikely
to be material as there are few operating leases in place.
Management are still assessing the most appropriate
transition option.
24 Revenue account split between non-life and life reinsurance contracts
Total Non-life Life
31 March 31 March 31 March 31 March 31 March 31 March
Note 2019 2018 2019 2018 2019 2018
R R R R R R
Gross premiums written 2,935,603,723 1,641,253,719 2,935,603,723 1,649,181,344 - (7,927,625)
Retroceded premiums (2,120,305,206) (1,267,664,011) (2,120,305,206) (1,269,884,198) - 2,220,187
Gross UPR movement 310,916,711 (503,792,782) 310,916,711 (503,792,782) - -
Retro UPR movement (262,152,138) 340,079,454 (262,152,138) 340,079,454 - -
Net premiums written
and earned 864,063,090 209,876,380 864,063,090 215,583,818 - (5,707,438)
Claims incurred (556,454,378) (220,441,026) (556,454,378) (220,398,547) - (42,479)
Claims paid 16 (288,515,706) (130,669,666) (288,515,706) (130,623,437) - (46,229)
Gross (1,172,817,195) (740,118,116) (1,172,817,195) (740,056,477) - (61,639)
Retroceded 884,301,490 609,448,450 884,301,490 609,433,040 - 15,410
Change in provision
for outstanding claims 6 (267,938,672) (89,771,360) (267,938,672) (89,775,110) - 3,750
Gross (847,249,843) (505,198,146) (847,249,843) (505,203,146) - 5,000
Retroceded 579,311,170 415,426,786 579,311,170 415,428,036 (1,250)
Net commission (143,458,176) (28,397,053) (143,458,176) (28,514,414) 117,361
Commissions (paid)/
received (149,909,948) (45,441,832) (149,909,948) (45,559,193) 117,361
Gross (685,800,428) (412,176,317) (685,800,428) (412,130,745) (45,572)
Retroceded 535,890,480 366,734,485 535,890,480 366,571,552 162,933
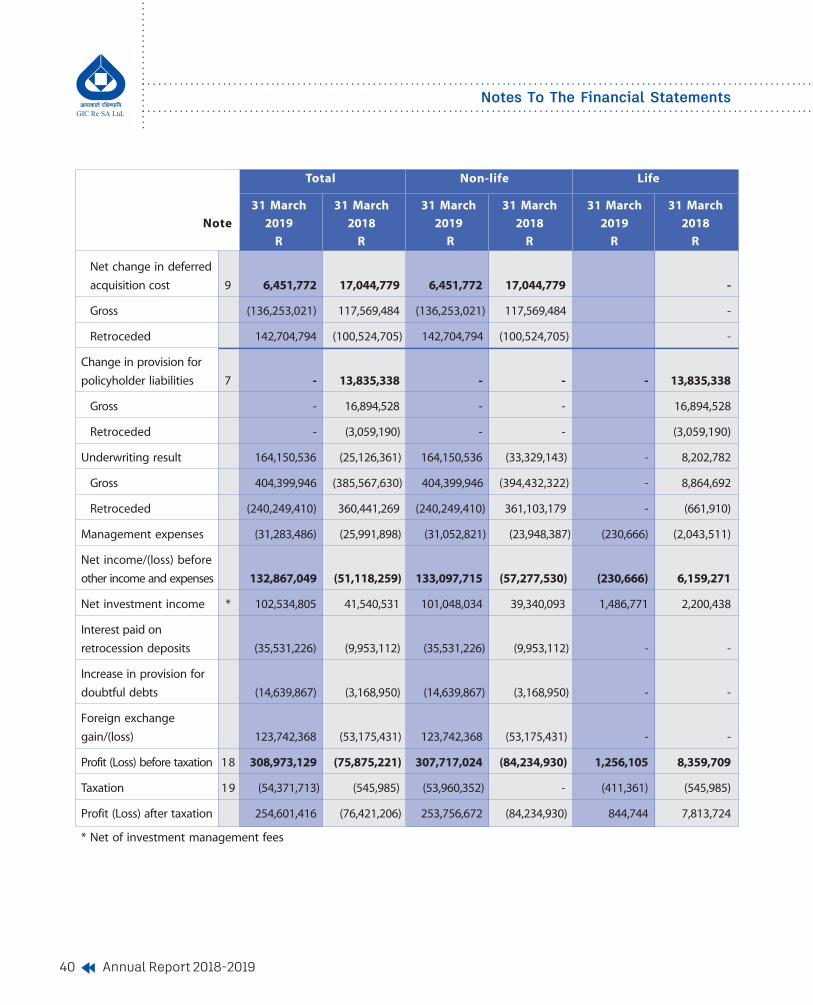
40 Annual Report 2018-2019
Total Non-life Life
31 March 31 March 31 March 31 March 31 March 31 March
Note 2019 2018 2019 2018 2019 2018
R R R R R R
Net change in deferred
acquisition cost 9 6,451,772 17,044,779 6,451,772 17,044,779 -
Gross (136,253,021) 117,569,484 (136,253,021) 117,569,484 -
Retroceded 142,704,794 (100,524,705) 142,704,794 (100,524,705) -
Change in provision for
policyholder liabilities 7 - 13,835,338 - - - 13,835,338
Gross - 16,894,528 - - 16,894,528
Retroceded - (3,059,190) - - (3,059,190)
Underwriting result 164,150,536 (25,126,361) 164,150,536 (33,329,143) - 8,202,782
Gross 404,399,946 (385,567,630) 404,399,946 (394,432,322) - 8,864,692
Retroceded (240,249,410) 360,441,269 (240,249,410) 361,103,179 - (661,910)
Management expenses (31,283,486) (25,991,898) (31,052,821) (23,948,387) (230,666) (2,043,511)
Net income/(loss) before
other income and expenses 132,867,049 (51,118,259) 133,097,715 (57,277,530) (230,666) 6,159,271
Net investment income * 102,534,805 41,540,531 101,048,034 39,340,093 1,486,771 2,200,438
Interest paid on
retrocession deposits (35,531,226) (9,953,112) (35,531,226) (9,953,112) - -
Increase in provision for
doubtful debts (14,639,867) (3,168,950) (14,639,867) (3,168,950) - -
Foreign exchange
gain/(loss) 123,742,368 (53,175,431) 123,742,368 (53,175,431) - -
Profit (Loss) before taxation 18 308,973,129 (75,875,221) 307,717,024 (84,234,930) 1,256,105 8,359,709
Taxation 19 (54,371,713) (545,985) (53,960,352) - (411,361) (545,985)
Profit (Loss) after taxation 254,601,416 (76,421,206) 253,756,672 (84,234,930) 844,744 7,813,724
* Net of investment management fees
Notes To The Financial Statements
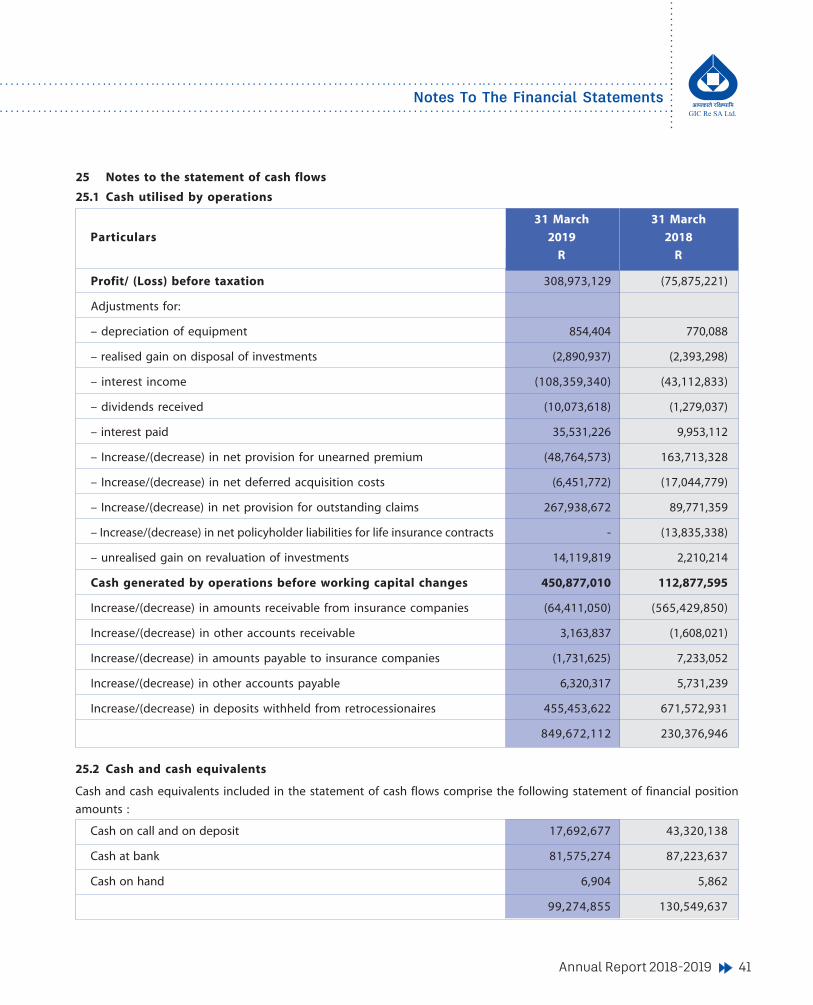
41Annual Report 2018-2019
31 March 31 March
Particulars 2019 2018
R R
25 Notes to the statement of cash flows
25.1 Cash utilised by operations
Profit/ (Loss) before taxation 308,973,129 (75,875,221)
Adjustments for:
– depreciation of equipment 854,404 770,088
– realised gain on disposal of investments (2,890,937) (2,393,298)
– interest income (108,359,340) (43,112,833)
– dividends received (10,073,618) (1,279,037)
– interest paid 35,531,226 9,953,112
– Increase/(decrease) in net provision for unearned premium (48,764,573) 163,713,328
– Increase/(decrease) in net deferred acquisition costs (6,451,772) (17,044,779)
– Increase/(decrease) in net provision for outstanding claims 267,938,672 89,771,359
– Increase/(decrease) in net policyholder liabilities for life insurance contracts - (13,835,338)
– unrealised gain on revaluation of investments 14,119,819 2,210,214
Cash generated by operations before working capital changes 450,877,010 112,877,595
Increase/(decrease) in amounts receivable from insurance companies (64,411,050) (565,429,850)
Increase/(decrease) in other accounts receivable 3,163,837 (1,608,021)
Increase/(decrease) in amounts payable to insurance companies (1,731,625) 7,233,052
Increase/(decrease) in other accounts payable 6,320,317 5,731,239
Increase/(decrease) in deposits withheld from retrocessionaires 455,453,622 671,572,931
849,672,112 230,376,946
Cash and cash equivalents included in the statement of cash flows comprise the following statement of financial position
amounts :
Cash on call and on deposit 17,692,677 43,320,138
Cash at bank 81,575,274 87,223,637
Cash on hand 6,904 5,862
99,274,855 130,549,637
25.2 Cash and cash equivalents
Notes To The Financial Statements

42 Annual Report 2018-2019
26. Categorisation of assets and liabilities
Fin
anci
al a
sset
s an
d li
abili
ties
Curr
ent/
non
- cur
rent
dis
tinc
tion
No
teTo
tal
Fin
anci
alFi
nan
cial
Fin
anci
alO
ther
no
n -
Cu
rren
t ass
ets
No
n -
curr
ent
asse
ts A
sset
sli
ab
ilit
ies
at
finan
cial
ass
ets
an
d li
ab
ilit
ies
asse
ts a
nd
at fa
ir v
alu
e a
tam
ort
ised
co
sta
nd
lia
bil
itie
sli
ab
ilit
ies
thro
ug
ham
ort
ised
pro
fit a
nd
loss
cost
20
19
RR
RR
RR
RA
SS
ETS
Equi
pmen
t5
1,86
2,69
9
-
-
-
1
,862
,699
-
1,8
62,6
99Te
chn
ical
ass
ets
un
der
in
sura
nce
co
ntr
acts
1,8
27,3
56,3
94
-
-
-
1,82
7,356
,394
1,44
9,561
,276
37
7,79
5,11
8Re
troce
ded o
utsta
ndin
g clai
ms
6 1
,400
,567
,511
-
-
- 1,
400,5
67,51
11,0
22,77
2,393
37
7,79
5,11
8Re
troce
ded
unea
rned
pre
miu
m re
serv
e8
3
65,7
32,5
80 3
65,7
32,5
8036
5,732
,580
-
Gros
s def
erre
d acq
uisit
ion c
osts
9
61,
056,
303
61
,056
,303
61,05
6,303
-
Retro
cede
d pol
icyho
lder
liabi
lities
7
-
-
-
-
--
-
Inv
estm
ents
2,5
89,8
16,2
61 48
8,440
,823
2,10
1,375
,438
-
-
2,239
,931,1
66
349,
885,
095
Gove
rnm
ent s
ecur
ities
*11
0
97,
278,
812
97,2
78,81
2
-
-
--
9
7,27
8,81
2Fix
ed d
epos
its1
0 1
,684
,041
,892
- 1,
684,0
41,89
21,4
31,43
5,608
25
2,60
6,28
4Ne
gotia
ble c
ertif
icate
s of d
epos
its1
0
417
,333
,546
- 4
17,3
33,5
46
-
-41
7,333
,546
-
Trea
sury
bills
*21
0
-
-
-
-
--
Liste
d or
dina
ry sh
ares
*21
0
141
,631
,994
141,6
31,99
4
-
-
-14
1,631
,994
-
Liste
d pr
efer
ence
shar
es*2
10
1
3,20
0,64
9 1
3,200
,649
13,20
0,649
-
Liste
d col
lect
ive in
vestm
ent s
chem
es*2
10
2
36,3
29,3
68 23
6,329
,368
-
-
-
236,3
29,36
8
-
Def
erre
d t
ax1
1
-
-
-
-
--
-
Amou
nts d
ue un
der r
eins
uran
ce co
ntra
cts
1,2
98,1
74,2
90
-
1,29
8,174
,290
-
-
1,131
,250,2
33
166,
924,
056
Amou
nts d
ue fro
m re
troce
ssio
n con
tract
s
9,
662,
590
9
,662
,590
8,420
,138
1
,242
,452
Oth
er ac
coun
ts re
ceiva
ble
335
,483
-
33
5,48
3
-
-33
5,483
-
Cash
on
call a
nd o
n de
posit
1
7,69
2,67
7
-
17
,692
,677
-
-
17,69
2,678
-
Cash
at b
ank a
nd o
n ha
nd
81,
582,
178
-
81,5
82,1
78
-
-81
,582,1
78
-To
tal
asse
ts 5
,826
,482
,572
488,4
40,82
3 3,
508,8
22,65
6
- 1,
829,2
19,09
34,9
28,77
3,153
89
7,70
9,42
0
LIA
BIL
ITIE
STe
chn
ical
lia
bili
ties
un
der
in
sura
nce
co
ntr
acts
2,3
89,8
25,7
94
-
-
-
2,38
9,825
,794
1,891
,547,4
51
498,
278,
344
Gros
s out
stand
ing c
laim
s6
1,8
30,8
36,2
69
-
-
-
1,83
0,836
,269
1,332
,557,9
25
498,
278,
344
Gros
s une
arne
d pr
emiu
m re
serv
e8
5
25,0
40,9
79
-
-
-
525
,040
,979
525,0
40,97
9
-Re
troce
ded d
efer
red a
cqui
sitio
n cos
t9
3
3,94
8,54
7
-
-
-
33
,948
,547
33,94
8,547
-
Gros
s pol
icyho
lder
liabi
lities
7
-
-
-
-
--
-
Depo
sits w
ithhe
ld fro
m re
troce
ssio
naire
s 1
,746
,437
,984
-
- 1,
746,4
37,98
4
-1,7
46,43
7,984
-
Amou
nts p
ayab
le to
retro
cess
iona
ire C
ontra
cts
3
66,6
29,6
01
-
-
366
,629
,601
-
366,6
29,60
1
-O
ther
acco
unts
pay
able
12
1
2,51
7,45
2
-
-
11
,892
,378
625,
074
12,51
7,452
-
Taxa
tion
4
8,88
4,23
0
48,8
84,2
3048
,884,2
30To
tal
liab
iliti
es 4
,564
,295
,062
-
- 2,
173,8
44,19
3 2,
390,4
50,86
84,0
66,01
6,718
.49
498,
278,
344
*1 D
esig
nate
d at
Fair V
alue
*2 M
anda
tory
Fair V
alue
Note
that
thes
e are
indi
cativ
e cla
ssifi
catio
ns un
der IF
RS9 w
hich
has
not
bee
n im
plem
ente
d in
the c
urre
nt ye
ar.
Categorisation of Assets and Liabilities

43Annual Report 2018-2019
Categorisation of assets and liabilities
Categorisation of Assets and LiabilitiesFi
nan
cial
ass
ets
and
liab
iliti
esCu
rren
t/no
n - c
urre
nt d
isti
ncti
on
No
teTo
tal
Fin
anci
alFi
nan
cial
Fin
anci
alO
ther
no
n -
Cu
rren
t ass
ets
No
n -
curr
ent
asse
ts A
sset
sli
ab
ilit
ies
at
finan
cial
ass
ets
an
d li
ab
ilit
ies
asse
ts a
nd
at fa
ir v
alu
e a
tam
ort
ised
co
sta
nd
lia
bil
itie
sli
ab
ilit
ies
thro
ug
ham
ort
ised
pro
fit a
nd
loss
cost
20
18
RR
RR
RR
R
AS
SET
SEq
uipm
ent
5
1,8
30,2
53
-
-
-
1
,830
,253
-
1,8
30,2
53Te
chni
cal a
sset
s und
er in
sura
nce c
ontra
cts
1,64
6,450
,383
-
-
- 1,
646,4
50,38
3 1,
424,7
11,17
1 22
1,739
,212
Retro
cede
d out
stand
ing c
laim
s6
821
,256
,341
-
-
- 8
21,2
56,3
41 5
99,5
17,1
29 22
1,739
,212
Retro
cede
d un
earn
ed p
rem
ium
rese
rve
8 6
27,8
84,7
18 6
27,8
84,7
18 6
27,8
84,7
18
-
Gros
s def
erre
d acq
uisit
ion c
osts
9 1
97,3
09,3
24 1
97,3
09,3
24 1
97,3
09,3
24
-
Retro
cede
d pol
icyho
lder
liabi
lities
7
-
-
-
-
-
-
-
Inv
estm
ents
1,33
9,797
,265
471,8
97,90
6 8
67,8
99,3
59
-
- 1,
266,1
83,81
1 7
3,613
,454
Gove
rnm
ent s
ecur
ities
*11
0
3,0
80,6
49 3
,080
,649
-
-
-
-
3,0
80,6
49Fix
ed d
epos
its1
0 5
11,4
11,2
38
-
511
,411
,238
440
,878
,433
70,5
32,80
5Ne
gotia
ble c
ertif
icate
s of d
epos
its1
0 3
56,4
88,1
21
-
356
,488
,121
-
-
356
,488
,121
-Tr
easu
ry b
ills*2
10
14
,887
,018
14,8
87,01
8
-
-
- 1
4,88
7,01
8Lis
ted
ordi
nary
shar
es*2
10
89
,098
,766
89,0
98,76
6
-
-
- 8
9,09
8,76
6
-
Liste
d pr
efer
ence
shar
es*2
10
15
,198
,604
15,1
98,60
4 1
5,19
8,60
4
-
Liste
d col
lect
ive in
vestm
ent s
chem
es*2
10
349
,632
,869
349,6
32,86
9
-
-
- 3
49,6
32,8
69
-
Def
erre
d t
ax1
1
5,4
25,2
10
-
-
-
5
,425
,210
-
5,4
25,2
10Am
ount
s due
unde
r rei
nsur
ance
cont
ract
s 6
68,9
69,0
46
-
668
,969
,046
-
-
668
,969
,046
Amou
nts d
ue fro
m re
troce
ssio
n con
tract
s 2
23,5
05,1
99 2
23,5
05,1
99 2
23,5
05,1
99O
ther
acco
unts
rece
ivabl
e
3,4
99,3
20
-
3
,499
,320
-
-
3
,499
,320
-Ca
sh o
n ca
ll and
on
depo
sit
43,3
20,1
38
-
43
,320
,138
-
-
43,
320,
138
-Ca
sh at
ban
k and
on
hand
87
,229
,499
-
87,2
29,4
99
-
- 8
7,22
9,49
9
-
Tota
l as
sets
4,02
0,026
,313
471,8
97,90
6 1,
894,4
22,56
1
- 1,
653,7
05,84
6 3,
717,4
18,18
4 30
2,608
,129
LIA
BIL
ITIE
STe
chn
ical
lia
bili
ties
un
der
in
sura
nce
co
ntr
acts
1,99
6,197
,456
-
-
- 1,
996,1
97,45
6 1,
725,2
34,59
6 27
0,962
,860
Gros
s out
stand
ing c
laim
s6
983
,586
,426
-
-
- 9
83,5
86,4
26 7
12,6
23,5
66 27
0,962
,860
Gros
s une
arne
d pr
emiu
m re
serv
e8
835
,957
,690
-
-
- 8
35,9
57,6
90 8
35,9
57,6
90
-
Retro
cede
d def
erre
d acq
uisit
ion c
ost
9 1
76,6
53,3
40
-
-
-
176
,653
,340
176
,653
,340
-Gr
oss p
olicy
hold
er lia
bilit
ies7
-
-
-
-
-
-
-
Depo
sits w
ithhe
ld fro
m re
troce
ssio
naire
s 1,
290,9
84,36
2
-
-
1,29
0,984
,362
-
1,29
0,984
,362
-Am
ount
s pay
able
to re
troce
ssio
naire
Con
tract
s
17,4
36,0
52
-
-
17
,436
,052
-
17,
436,
052
-O
ther
acco
unts
pay
able
12
6
,170
,724
-
-
5,6
75,3
27
49
5,39
7
6,1
70,7
24
-
Tota
l lia
bili
ties
3,31
0,788
,594
-
- 1,
314,0
95,74
1 1,
996,6
92,85
3 3,
039,8
25,73
4 27
0,962
,860
*1 D
esig
nate
d at
Fair V
alue
*2 M
anda
tory
Fair V
alue
Note
that
thes
e are
indi
cativ
e cla
ssifi
catio
ns un
der IF
RS9 w
hich
has
not b
een
impl
emen
ted
in th
e cur
rent
year
.

44 Annual Report 2018-2019
Notes To The Financial Statements
31 March 31 March
Particulars 2019 2018
R R
27.1 Amounts due under reinsurance contracts 1,298,174,290 668,969,046
27.2 Amounts due from retrocessionaire Contracts
Amounts due from retrocession contracts - 208,803,484
Provisional profit commission recievable from retrocession 9,662,590 14,701,715
9,662,590 223,505,199
27.3 Amounts Payable to retrocessionaires
Amounts Payable to retrocessionaires 353,832,497 -
Provisional profit commission payable to retrocessionaires 12,797,104 17,436,052
366,629,601 17,436,052
28 In the current year amounts reflected on the balance sheet in the prior year were grossed up to reflect balances payable
to retrocessionaires separately from balances due from cedants.
The impact of these grossed up adjustments are shown below:
As disclosed in the prior year for March 18 As disclosed in the current year for March 18
R R
Amounts due from companies on 909,050,084 Amounts due under reinsurance 668,969,046
reinsurance contracts contracts
Amounts due to companies on Amounts due from retrocessionaire 223,505,199
reinsurance contracts -34,011,891 contracts
Amounts payable to retrocessionaire
contracts -17,436,052
Net asset position remains consistent 875,038,193 875,038,193
The adjustments had no impact on the liquidity or solvency of the company nor were there any impacts on the
profitability for that period.