Gibbon foraging decisions and the marginal value model
17
hffernational Journal of PrimatolohT, Vol. 13, No. 1, 1992 Gibbon Foraging Decisions and the Marginal Value Model Gregory F. Grether, 1 Ryne A. Palombit, x and Peter S. Rodman z Received January 28, 1991: accepted May 1, 1991 We use data fi'om an obsen,ational fieM study of fi'ugivoty in two .sympatric gibbons, lar (Hylobates lar) and siamang (H. syndactylus), to test assumptions and predictions of the margbtal value model (MVM). A key prediction of the MVM is" that maqlbml gabz rates at the time of leaving the patch are equal across patch types. We found that this is not the case for gil)bons: rates of enepgy intake at the end of feeding sessions were significantly different for different types of fruit, and we could not attribute this to temporal variation in fruit availability. Initia ! and final caloric intake rates were highly correlated. This" suggests that gibbons do not adjust the time spent in patches in order to maximize the average rate of energy intake. Similar results were obtained for all other currencies considered. Gibbon foraging appears" to satisfy several, but not all, assumptions of the MVM. As required by the model, fruit patches occur as discrete units, patches are encountered sequentially, travel time between patches exceeds search time between items within a patch, search for and search within patches are &compatible activities, and bztake rates decline over time spent in a patch. However, the declinbTg rates we detected may be an effect of satiation instead of patch depletion, patches probably are not encountered at random, and group members may not forage independently. Thus, our results suggest that the MVM is not an adequate model of gibbon foraging behavior, but they do not invalidate the MVM pet" se. KEY WORDS: optimal foraging; Hylobates lar; Hylobates~yndactylus; frugivory; patch depression. IAnimal Behavior Graduate Group, c/o Department of Anthropology, University of California, Davis, California 95616. "Department of Anthropology, University of Calilbrnia, Davis, California 95616. 1 OIb4-O291/gZ/D2~I$f~.50/O r 1992 Plenum Publishing Corporation
Transcript of Gibbon foraging decisions and the marginal value model

hffernational Journal of PrimatolohT, Vol. 13, No. 1, 1992
Gibbon Foraging Decisions and the Marginal Value Model
Gregory F. Grether, 1 Ryne A. Palombit , x and Peter S. Rodman z Received January 28, 1991: accepted May 1, 1991
We use data fi'om an obsen,ational fieM study of fi'ugivoty in two .sympatric gibbons, lar (Hylobates lar) and siamang (H. syndactylus), to test assumptions and predictions of the margbtal value model (MVM). A key prediction of the MVM is" that maqlbml gabz rates at the time of leaving the patch are equal across patch types. We found that this is not the case for gil)bons: rates of enepgy intake at the end of feeding sessions were significantly different for different types of fruit, and we could not attribute this to temporal variation in fruit availability. Initia ! and final caloric intake rates were highly correlated. This" suggests that gibbons do not adjust the time spent in patches in order to maximize the average rate of energy intake. Similar results were obtained for all other currencies considered. Gibbon foraging appears" to satisfy several, but not all, assumptions of the MVM. As required by the model, fruit patches occur as discrete units, patches are encountered sequentially, travel time between patches exceeds search time between items within a patch, search for and search within patches are &compatible activities, and bztake rates decline over time spent in a patch. However, the declinbTg rates we detected may be an effect of satiation instead of patch depletion, patches probably are not encountered at random, and group members may not forage independently. Thus, our results suggest that the MVM is not an adequate model of gibbon foraging behavior, but they do not invalidate the MVM pet" se.
KEY WORDS: optimal foraging; Hylobates lar; Hylobates ~yndactylus; frugivory; patch depression.
IAnimal Behavior Graduate Group, c/o Department of Anthropology, University of California, Davis, California 95616.
"Department of Anthropology, University of Calilbrnia, Davis, California 95616.
1
OIb4-O291/gZ/D2~I$f~.50/O r 1992 Plenum Publishing Corporation

Grether, Palombit, and Rodman
INTRODUCTION
In this paper we apply a model from optimal foraging theory, the marginal value model (Charnov, 1976; Parker and Stuart, 1976), to ex- amine the foraging behavior of two sympatric gibbons: lar (Hylobates lar) and siamang (H. syndactylus). Primates and other mammalian herbivores are poorly represented in the optimal foraging literature (Stephens and Krebs, 1986). In part this may be a consequence of the widespread opin- ion that the diets of herbivores, and the constraints under which they forage, are too complex to expect simple rate-maximizing models to apply (Milton, 1979; Freeland and Janzen, 1974; Schoener, 1987). Herbivores may need to select a diverse array of food types in order to meet dietary requirements (Crawley, 1983) or to minimize the deleterious conse- quences of particular plant toxins and digestibility reducers (Rosenthal and Janzen, 1979). Some herbivores may be able to synthesize what they do not eat, however, or to maximize the rate of energy intake subject to other dietary constraints (Belovsky, 1978; 1984; Schoener, 1987). Alter- natively, herbivores may maximize some other currency, such as the ratio of protein to fiber gain (Milton, 1979), in a manner analogous to the marginal value model (Krebs and McCleery, 1984). Stephens and Krebs (1986) suggest that the emphasis on food quality for herbivores has pre- vented us from finding out how complex their foraging decisions actually are.
The marginal value model (MVM) (Charnov, 1976; Parker and Stuart, 1976) generates predictions regarding the behavior of animals util- izing a heterogeneous array of depletable food patches. In the model, foragers equipped only with knowledge of average path conditions travel from patch to patch and leave each patch when their rate of energy intake in that patch drops to the net rate of gain over all other patch types. De- spite its restrictive assumptions and theoretical limitations (Mangel and Clark, 1988), the basic model has held up well to considerable testing (Krebs and McCleery, 1984; Stephens and Krebs, 1986; Schoener, 1987; but see Gray, 1986). Some studies have yielded results at odds with the model, but these are often flawed by a failure to test its assumptions (Stephens and Krebs, 1986).
Frugivorous primates have several attributes that may make them more suitable than other mammalian herbivores for studies of foraging be- havior under natural conditions: (1) individuals can often be consistently monitored from patch to patch, (2) patches usually occur as readily distin- guishable, nonarbitrary units (i.e., trees), (3) food items usually occur in discrete units that can be unambiguously counted during feeding, and (4) frugivores, in general, may be virtually free from the constraints imposed
Gibbon Foraging Decisions
on other herbivores by plant defenses. A discontinuous distribution of food is especially important for the MVM, and for sequential patch models in general, since these require that searching for and foraging within patches are mutually exclusive activities (Stephens and Krebs, 1986). On the other hand, primate sociality introduces complexities that are not easily incorpo- rated into optimality models.
Our data on the foraging behavior of gibbons enable us to test a quali- tative prediction of the MVM: that foragers will leave patches of all types at the same marginal (energy) gain rate (Charnov, 1976; Parker and Stuart, 1976). Gibbons do not meet rigidly all the assumptions of the MVM, how- ever, so our data do not allow a rigorous test of the MVM itself. Instead, we aim to determine whether the MVM suffices as a model of gibbon patch-leaving decisions. Unless gibbon foraging deviates substantially from what the MVM predicts, there is little basis for considering more complex models.
METHODS
Study Area, Species, and Groups
This study was conducted at the Ketambe Research Station, Gunung Leuser National Park, northern Sumatra, Indonesia (3~ 97~ lo- cated in fairly undisturbed lowland tropical rain forest (Rijksen, 1978; van Schaik and Mirmanto, 1985). The two groups of each gibbon species (Hylobates lar and H. syndactylus) included in this study were the excep- tionally well-habituated subjects of a long-term study conducted by RAP. Both species are highly territorial, live in socially monogamous family units (Chivers, 1972, !978), and feed extensively on fig (Ficus spp.) fruit, though they differ in the proportion of leaves, nonfig fruit, and animal matter (primarily invertebrates) in their diets (Gittins and Raemaekers, 1980). For the most part, these dietary differences are quantitative. Siamang include more leaves in their diet; lar include more nonfig fruit, although this ap- pears to vary from site to site (Chivers, 1978; Gittins and Raemaekers, 1980). Groups were composed of one adult male-female pair and one to three juveniles. Siamang group sizes were two and three; lar group sizes were three and two to five [the size of the latter group varied both within and between days (Palombit, 1992). Two adult females, one siamang and one lar, were pregnant or lactating during this study. Siamang territories overlapped extensively with lar territories.

Grether, Palombit, and Rodman
Sampling Protocol
Observations were made by G F G between August and D e c e m b e r 1987. Full dawn-to-dusk focal samples were distributed as evenly as possible across the eight adults (four male and four female) included in the study (72 focal samples; ca. 648 observation hr; mean of 9 follows per individual; range, 2-14). The individual for which only two full follows were obtained was a partially habituated adult male, which was only occasionally present in one H. lar group. Only Ficus feeding data on this individual were in- cluded in the analysis. Whenever possible, individuals were followed from the time they exited a sleep-tree at daybreak until they entered (and re- mained within) a sleep-tree in the late afternoon.
During focal samples, continuous activity records were compiled by calling off transition times into a cassette recorder. Recorded activities included resting, traveling, feeding, foraging on invertebrates, and drink- ing water trapped in tree cavities. Patch entry and exit times defined a feeding session. Behavioral transitions were recorded within and between sessions. The onset of resting during a feeding session was identified by a characteristic pause in food processing. Typically, delays of greater than 1 min between hand-to-mouth movements were counted operationally as resting, except when food processing took more than 1 min (e.g., Myristica spp. and large Ficus fruit). During feeding sessions, each hand- to-mouth movement made by the focal animal was announced into a continuously running tape recorder, along with an estimate of the number of items per handful, whenever such movements were clearly visible. Preliminary data collected in August were not included in the analyses. For most of the analyses, only data from the most complete sessions are utilized, as described below.
The data were transcribed from cassette tape onto a microcomputer equipped with a millisecond timer by means of a custom program in BASIC.
Patch Definition and Fruit Type Classification
In this study a patch was defined as the crown of a fruit tree or liana. Only data on the consumption of fruit (by far the largest dietary component of both species) are presented in this report. Nonfig fruit were classified by species. Since few of the large number of Ficus species at Ketambe were fed in by more than two individuals, analysis by fig species was not possible. Instead, Ficus fruit were classified as "small figs" or "large figs" according to the way in which gibbons processed the fruit. Gibbons placed small figs
Gibbon Foraging Decisions
directly into their mouths one or more at a time, but they bit large figs repeatedly while grasping them manually, before proceeding to the next
item.
Analyses to Detect Patch Depression
The MVM assumes that intake rates decline with time spent feeding within patches. Two approaches were taken to test this assumption. First, the Spearman rank correlation between instantaneous intake rate and time spent feeding was calculated for each feeding session. Instantaneous intake rates were obtained by dividing the number of items in a handful by the corresponding interval between hand-to-mouth movements. When the number of items in a particular handful could not be counted, the average for that feeding session was substituted in its place. Session correlations were averaged by fruit type to obtain a mean value for each individual on
each fruit type. Our second approach was to compare intake rates near the beginning
and end of feeding sessions. In order to improve the accuracy of our rate estimates, particularly the rate of feeding at the end of feeding sessions (our estimate of the marginal rate), we analyzed a subset of the data in which less than 40 sec was missing from the end of the feeding session and more than 50% of the time spent feeding in the session was included in the sample. "Missing" time occurred when the observer was unable to see the focal animal clearly enough to count hand-to-mouth movements accu- rately. Each of the selected sessions was divided into quarters (i.e., the first 25% of hand-to-mouth movements counted in a session were allocated to the first quarter, and so on; remainders were allocated by a rounding rule), and mean intake ra~es were calculated separately for each quarter based on the number of items eaten and the time spent actually feeding (i.e., excluding "rests" and other activities). The mean rate for the first quarter served as a measure of the "entry" intake rate, i.e., the rate of feeding near the beginning of the feeding session. The mean rate of intake over the last three intervals (between hand- to-mouth movements) of each session provided an estimate of the marginal (or "exit") intake rate. Entry and exit rates were analyzed in a split-plot design repeated-measures A N O V A using Statistical Analysis System's GLM procedure with the R A N D O M and TEST statements for Satterthwaite approximate F tests (SAS version 6). The split-plot design was necessary to accommodate miss- ing cells (not all individuals were observed on all fruit types.)
Grether, Palombit, and Rodman
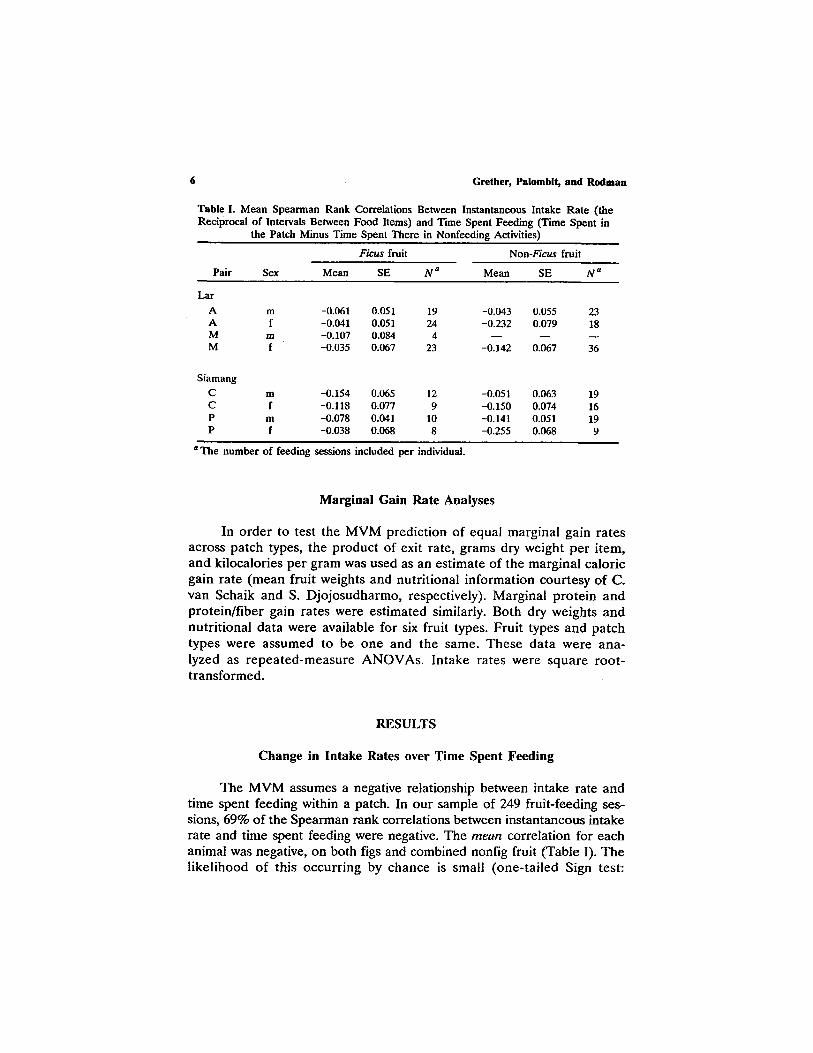
Table I. Mean Spearman Rank Correlations Between Instantaneous Intake Rate ( the Reciprocal o f Intervals Between Food Items) and Time Spent Feeding (Time Spent in
the Patch Minus Time Spent There in Nonfeeding Activities)
Ficus fruit Non-Ficus fruit
Pair Sex Mean SE N a Mean SE N a
Ear
A m -0.061 0.051 19 -0.043 0.055 23 A f -0.041 0.051 24 -0.232 0.079 18 M m -0.107 0.084 4 - - - - - - M f -0.035 0.067 23 -0.142 0.067 36
Siamang
C m -0 . i54 0.065 12 -0.051 0.063 19 C f -0.118 0.077 9 -0.150 0.074 16 P m -0.078 0.041 10 -0.141 0.051 19 P f -0.038 0.068 8 -0.255 0.068 9
a T he number of feeding sessions included per individual.
Marginal Gain Rate Analyses
In order to test the MVM prediction of equal marginal gain rates across patch types, the product of exit rate, grams dry weight per item, and kilocalories per gram was used as an estimate of the marginal caloric gain rate (mean fruit weights and nutritional information courtesy of C. van Schaik and S. Djojosudharmo, respectively). Marginal protein and protein/fiber gain rates were estimated similarly. Both dry weights and nutritional data were available for six fruit types. Fruit types and patch types were assumed to be one and the same. These data were ana- lyzed as repeated-measure ANOVAs. Intake rates were square root- transformed.
RESULTS
Change in Intake Rates over Time Spent Feeding
The MVM assumes a negative relationship between intake rate and time spent feeding within a patch. In our sample of 249 fruit-feeding ses- sions, 69% of the Spearman rank correlations between instantaneous intake rate and time spent feeding were negative. The m e a n correlation for each animal was negative, on both figs and combined nonfig fruit (Table I). The likelihood of this occurring by chance is small (one-tailed Sign test:
Gibbon Foraging Decisions
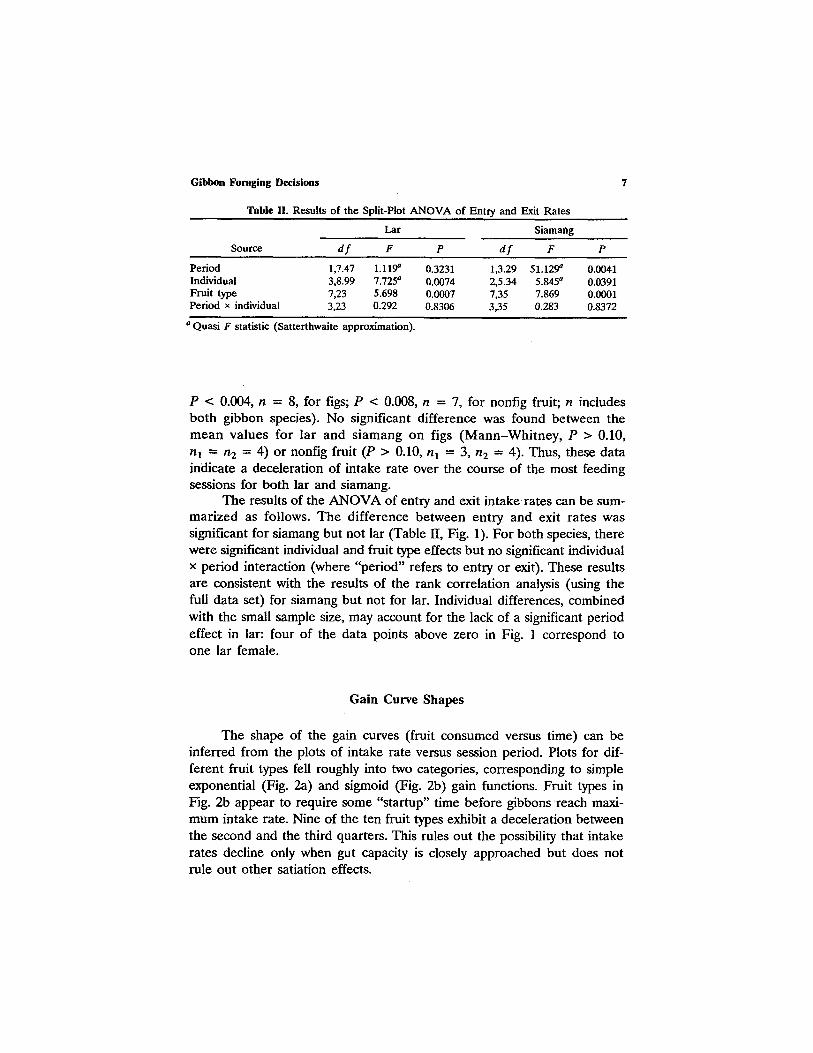
Table II. Results of the Split-Plot A N O V A of Entry and Exit Rates
Lar Siamang
Source d f F P d f F P
Period 1,7.47 1.119 a 0.3231 1,3.29 51.129 a 0.0041 Individual 3,8.99 7.725 a 0.0074 2,5.34 5.845 a 0.0391 Fruit type 7,23 5.698 0.0007 7,35 7.869 0.0001 Period x individual 3,23 0.292 0.8306 3,35 0.283 0.8372
a Quasi F statistic (Satterthwaite approximation).
P < 0.004, n = 8, for figs; P < 0.008, n = 7, for nonfig fruit; n includes both gibbon species). No significant difference was found between the mean values for lar and siamang on figs (Mann-Whi tney , P > 0.10, nl = n2 = 4) or nonfig fruit (P > 0.10, nl = 3, n2 = 4). Thus, these data indicate a deceleration of intake rate over the course of the most feeding sessions for both lar and siamang.
The results of the ANOVA of entry and exit intake rates can be sum- marized as follows. The difference between entry and exit rates was significant for siamang but not lar (Table II, Fig. 1). For both species, there were significant individual and fruit type effects but no significant individual x period interaction (where "period" refers to entry or exit). These results are consistent with the results of the rank correlation analysis (using the full data set) for siamang but not for lar. Individual differences, combined with the small sample size, may account for the lack of a significant period effect in lar: four of the data points above zero in F ig . 1 correspond to one lar female.
Gain Curve Shapes
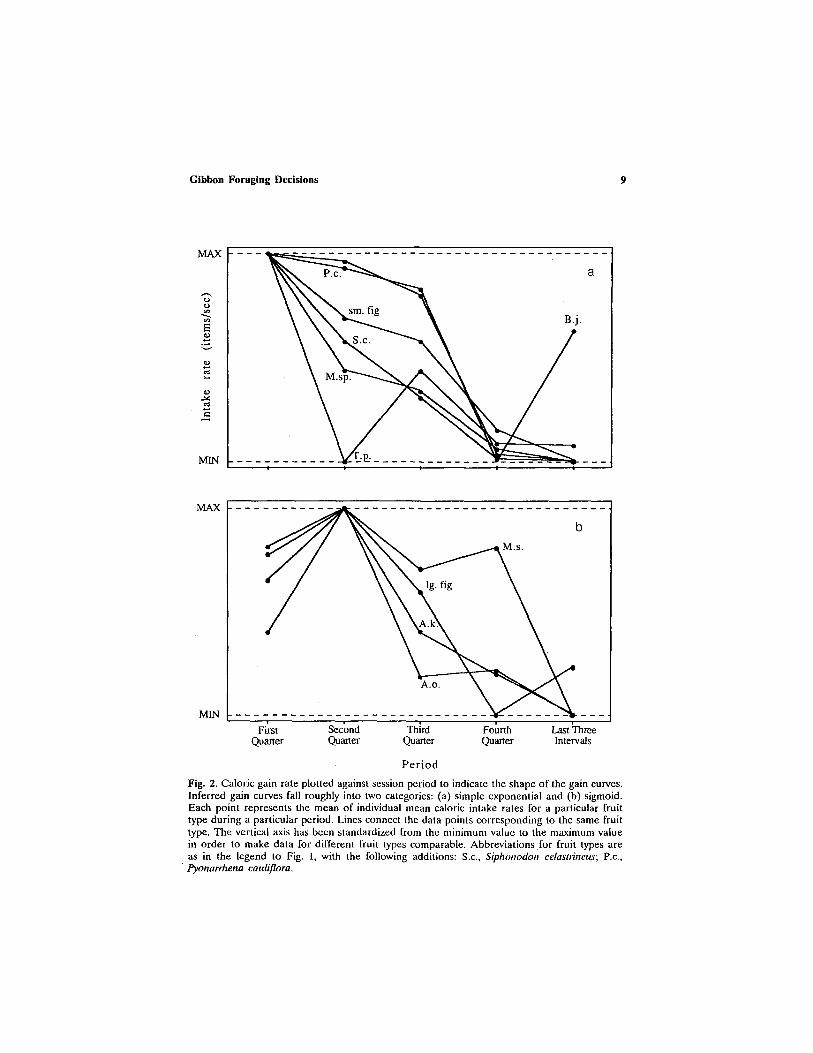
The shape of the gain curves (fruit consumed versus time) can be inferred from the plots of intake rate versus session period. Plots for dif- ferent fruit types fell roughly into two categories, corresponding to simple exponential (Fig. 2a) and sigmoid (Fig. 2b) gain functions. Fruit types in Fig. 2b appear to require some "startup" time before gibbons reach maxi- mum intake rate. Nine of the ten fruit types exhibit a deceleration between the second and the third quarters. This rules out the possibility that intake rates decline only when gut capacity is closely approached but does not rule out other satiation effects.

Grether, Palomhit, and Rodman
0 )
E r
r
L)
0.08
0.00 -0.02
-0.12
-0.22
-0.32
o o �9
: _ : �9 o o o
�9 o o �9
�9 0 �9 0 0
0 0
8 o o �9
o i i i i i i i i
sm fig lg fig T.p. A.k. B.j. M.s. A.o. M.sp.
F ru i t t ype
Fig. 1. The change in intake rate (items/sec) between tile first quar ter and the last three intervals of feeding sessions for both gibbon species on eight fruit types. Each point represents the mean change lbr a particular individual feeding on a particular fruit type, averaged over several sessions. Abbreviations for fruit types translate as follows: sm fig, small Ficus fruit; lg fig, large Ficus f r u i t ; T .p . , Tinomiscium phytocrenoMes; A.k. , Aglaia korthalsff; B.j., Biscoffia javanica; M.s., Mallotus ~l)haerocalpus; A.o., Aglaia odoratisshna; and M.sp., Myristica sp. Overlapping points were separated slightly for graphical presentation but so as to preserve the original order with respect to tile vertical axis.
Margina l Gain Rates
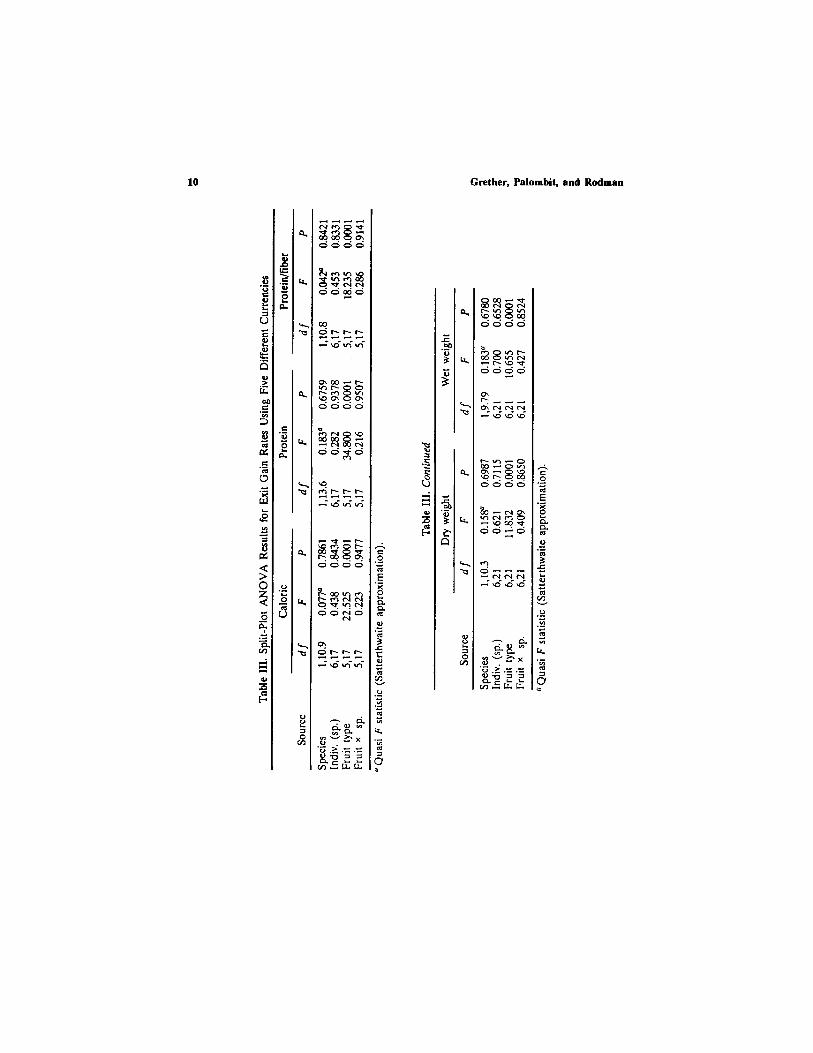
The effect of fruit type on caloric gain rate was significant (Table III, Fig. 3). No difference was detected between the exit gain rates of lar and siamang, and no fruit type x species interaction was detected. Thus, con- trary to the prediction of the MVM, patch types differ with respect to the average rate at which gibbons take in calories just before exiting the patch. The effects of fruit type on protein, on protein/fiber, and on dry and wet weight exit gain rates were also significant (Table III); neither gibbon spe- cies nor the interaction term had a significant effect.
Gibbon Foraging Decisions
. . . . . . . . . . . . . . . . . . . . . . . . . . . . . . . . . . . . . . .
a
13
MIN
MAX
MIN
First Second Third Fourth Last lhree Quarter Quaxter Quarter Quarter Intervals
P e r i o d
Fig. 2. Caloric gain rate plotted against session period to indicate the shape of the gain curves. Inferred gain curves fall roughly into two categories: (a) simple exponential and (b) sigmoid. Each point represents the mean of individual mean caloric intake rates for a particular fruit type during a particular period. Lines connect the data points corresponding to the same fruit type. The vertical axis has been standardized from the minimum value to the maximum value in order to make data for different fruit types comparable. Abbreviations for fruit types are as in the legend to Fig. 1, with the following additions: S.c., Siphonodon celastlineus; P.c., Pyonarrhena cauliflora.
10
o
< > 0
0 0 0 0
0 0 0 0
I'i ~ -
I'i N
. ~ x ~
Grether, Palombit, and Rodman
0 0 0 0
d d o d
0 0 0 0 "" c~ E
d d ~ d
�9 c -
O
�9 ~ .> .~_ .--_
Gibbon Foraging Decisions 11
1 .2 -
Q) .~ 1 .0 -
0.8
0.6
0.4 o
o t~
= 0.2
0.0
J o siamang �9 lar ]
0
o | | 8
0
�9 o o
o 8
o �9
o o
! i i | ! i
B.j. sm fig lg fig M.s. A.k. T.p.
Frui t t ype
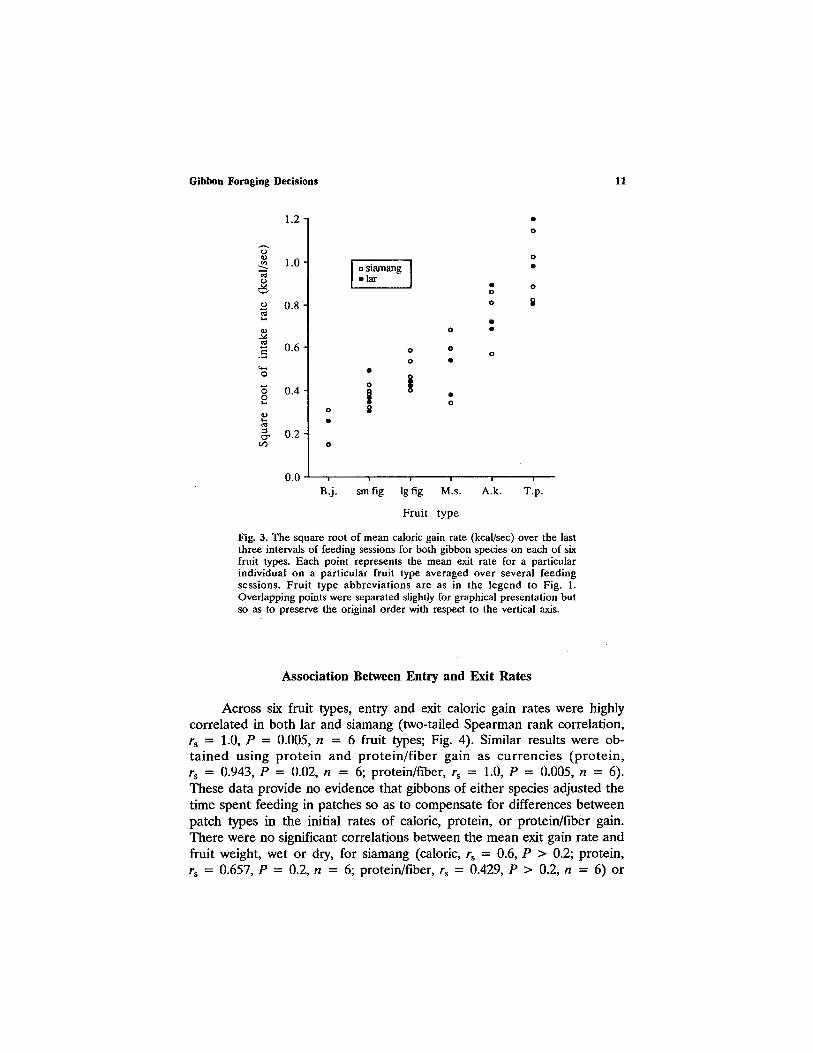
Fig. 3. The square root of mean caloric gain rate (kcal/sec) over the last three intervals of feeding sessions for both gibbon species on each of six fruit types. Each point represents the mean exit rate for a particular individual on a part icular fruit type averaged over several feeding sessions. Frui t type abbrevia t ions are as in the legend to Fig. 1. Overlapping points were separated slightly for graphical presentation but so as to preserve the original order with respect to the vertical axis.
Association Between Entry and Exit Rates
Across six fruit types, entry and exit caloric gain ra tes were highly cor re la ted in bo th lar and s iamang (two-tailed S p e a r m a n rank corre la t ion, rs = 1.0, P = 0.005, n = 6 fruit types; Fig. 4). Similar results were ob- t a i n e d u s i n g p r o t e i n a n d p r o t e i n / f i b e r ga in as c u r r e n c i e s ( p r o t e i n , r s = 0.943, P = 0.02, n = 6; protein/f iber , rs = 1.0, P = 0.005, n = 6). These da ta provide no evidence tha t gibbons of e i ther species adjusted the t ime spent feeding in pa tches so as to compensa te for differences be tween pa tch types in the initial ra tes o f caloric, prote in , o r prote in / f iber gain. T h e r e were no significant correlat ions be tween the m e a n exit gain ra te and fruit weight, wet or dry, for s iamang (caloric, rs = 0.6, P > 0.2; prote in , rs = 0.657, P = 0.2, n = 6; protein/f iber, rs = 0.429, P > 0.2, n = 6) o r

12 Grether, Palombit, and Rndman
1.4
~ 1.2 -
"-& 1.0. r
2 0 .8 .
.=_ 0.6.
0 .4 . t.-
L.O 0.2 .
I �9 siamang ] �9 lar
s " s ~
s " J
J s S
9 " /
s # t ' i o
s S
o " s S
s o s o
s �9
J �9 � 9
J
9" 0 " �9
0 012 014 0'.6 0'.8 1'.0 1'.2 1.4
Exit gain rate (kcal/sec)
Fig. 4. First quarter (entry) caloric gain rate versus exit ca- loric gain rate (kcal/sec). Each point represents the mean for one species on one fruit type. The ,diagonal dashed line has a slope of 1.
for lar (caloric, rs = 0.6, P > 0.2; protein, rs = 0.657, P = 0.2, n = 6; protein/fiber, rs = 0.371, P = 0.5, n = 6).
Weights and Caloric Value
Both the wet weight (weight before drying) and the dry weight of fruit were highly correlated with the caloric value of fruit (in both cases rs = 0.943, P = 0.02, n = 6). Thus, fruit weight could serve as a reliable indicator of caloric value.
DISCUSSION
Our results suggest that gibbons do not adjust their patch residence t imes in order to maximize their overall rate of energy intake while for- aging. Instead of leaving patches of different types at the same energy intake rate, as predicted by the marginal value model , gibbons systemati- cally leave patches of some types at substantially higher intake rates than others (Table III, Fig. 3). Furthermore, initial and final intake rates are
Gibbon Foraging Decisions 13
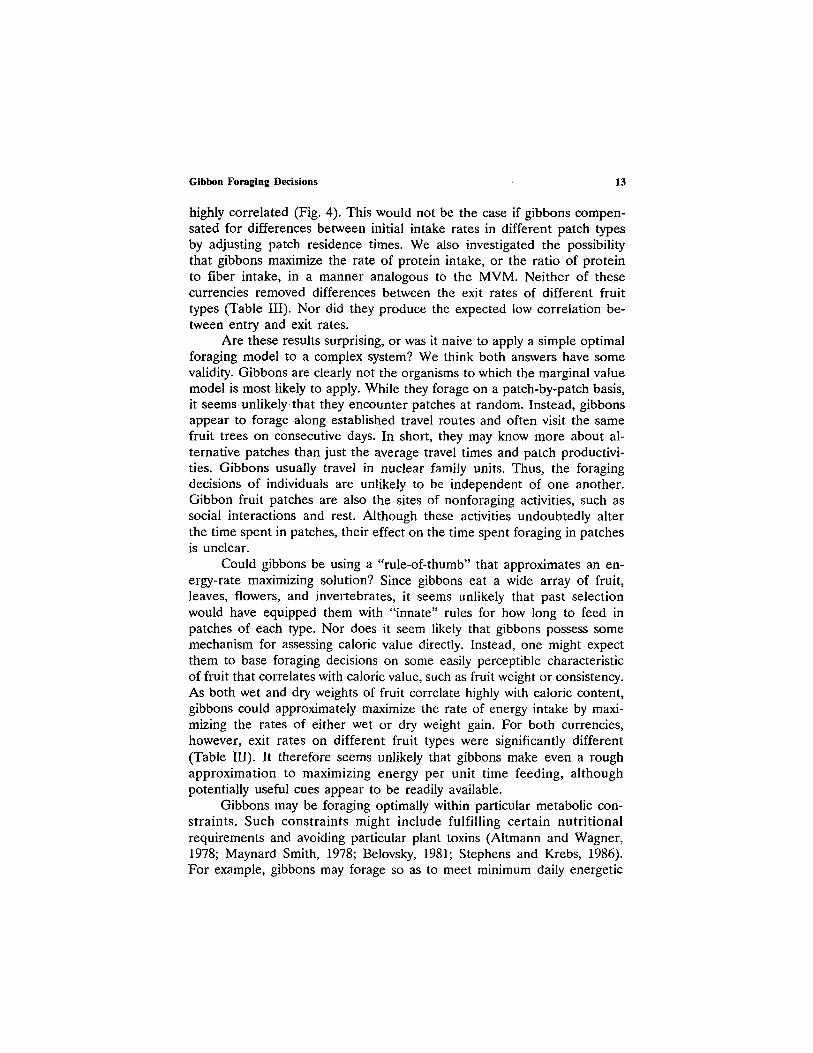
highly correlated (Fig. 4). This would not be the case if gibbons compen- sated for differences between initial intake rates in different patch types by adjusting patch residence times. We also investigated the possibility that gibbons maximize the rate of protein intake, or the ratio of protein to fiber intake, in a manner analogous to the MVM. Neither of these currencies removed differences between the exit rates of different fruit types (Table III). Nor did they produce the expected low correlation be- tween entry and exit rates.
Are these results surprising, or was it naive to apply a simple optimal foraging model to a complex system? We think both answers have some validity. Gibbons are clearly not the organisms to which the marginal value model is most likely to apply. While they forage on a patch-by-patch basis, it seems unlikely that they encounter patches at random. Instead, gibbons appear to forage along established travel routes and often visit the same fruit trees on consecutive days. In short, they may know more about al- ternative patches than just the average travel times and patch productivi- ties. Gibbons usually travel in nuclear family units. Thus, the foraging decisions of individuals are unlikely to be independent of one another. Gibbon fruit patches are also the sites of nonforaging activities, such as social interactions and rest. Although these activities undoubtedly alter the time spent in patches, their effect on the time spent foraging in patches is unclear.
Could gibbons be using a "rule-of-thumb" that approximates an en- ergy-rate maximizing solution? Since gibbons eat a wide array of fruit, leaves, flowers, and invertebrates, it seems unlikely that past selection would have equipped them with "innate" rules for how long to feed in patches of each type. Nor does it seem likely that gibbons possess some mechanism for assessing caloric value directly. Instead, one might expect them to base foraging decisions on some easily perceptible characteristic of fruit that correlates with caloric value, such as fruit weight or consistency. As both wet and dry weights of fruit correlate highly with caloric content, gibbons could approximately maximize the rate of energy intake by maxi- mizing the rates of either wet or dry weight gain. For both currencies, however, exit rates on different fruit types were significantly different (Table III). It therefore seems unlikely that gibbons make even a rough approximation to maximizing energy per unit time feeding, although potentially useful cues appear to be readily available.
Gibbons may be foraging optimally within particular metabolic con- straints. Such constraints might include fulfilling certain nutritional requirements and avoiding particular plant toxins (Altmann and Wagner, 1978; Maynard Smith, 1978; Belovsky, 1981; Stephens and Krebs, 1986). For example, gibbons may forage so as to meet minimum daily energetic

14 Grether, Palombit, and Rodman
and protein requirements while minimizing the ingestion of toxic sub- stances. Further nutritional analyses of gibbon diets are needed, None of the fruit included in this study contained toxic alkaloids (S. Djojosudharmo, unpublished data).
Gibbon foraging decisions may be constrained by factors other than nutritional requirements and plant toxins. Some patch types may consis- tently involve greater risks of predation than others (Altmann and Wagner, 1978), thereby altering relative patch profitabilities. Alterna- tively, the need to patrol territorial boundaries may play a major role in determining where gibbon pairs forage. The effect of a benefit to trav- eling between patches is to reduce the optimal stay time in patches (Kacelnik et al., 1981), but it is less clear how this would have differential effects by patch type. One possibility is that the benefits of feeding are increased in patches that permit greater territorial vigilance. Emergent fig trees, for example, may offer gibbons a better view than fruit trees with crowns within the canopy do. In fact, we know very little about what factors most influence gibbon foraging decisions. An analysis of gibbon foraging patterns in relation to predation hazard and territorial defense would be of value.
Thus far, we have assumed that the declining intake rates we detected (Table I, Fig. 1) were the result of patch depletion instead of satiation. Patch depression would not be expected if fruit were distributed randomly in patches and gibbons searched systematically (Stephens and Krebs, 1986). However, gibbon patches are three-dimensional and movement is restricted along particular routes (i.e., branches). It may be impossible for foraging gibbons to avoid crossing their own or others' paths. The more time a gib- bon spends in a patch, the more paths there are to cross. Moreover, if fruit are distributed heterogeneously within patches, gibbons may feed first where intake rates are highest and move to successively poorer regions be- fore finally exiting the tree. Either of these processes alone, or their combination, could lead to patch depression. Unfortunately, our data do not enable us to distinguish between depletion and satiation effects. The gain curve shapes (Fig. 2) are consistent with both mechanisms. We can rule out the influence of certain forms of satiation effects. Increasing sa- tiation may result in (1) progressively longer time intervals between bouts of feeding within sessions, (2) progressive reduction in the length of bouts, and/or (3) declining intake rates between successive bouts (McCleery, 1977). While any combination of these three effects could result in a re- duction in the overall rate of intake with time spent in the patch, only the third effect could explain our results since we excluded interbout intervals (i.e., "rests") from the rate calculations.
Gibbon Foraging Decis ions
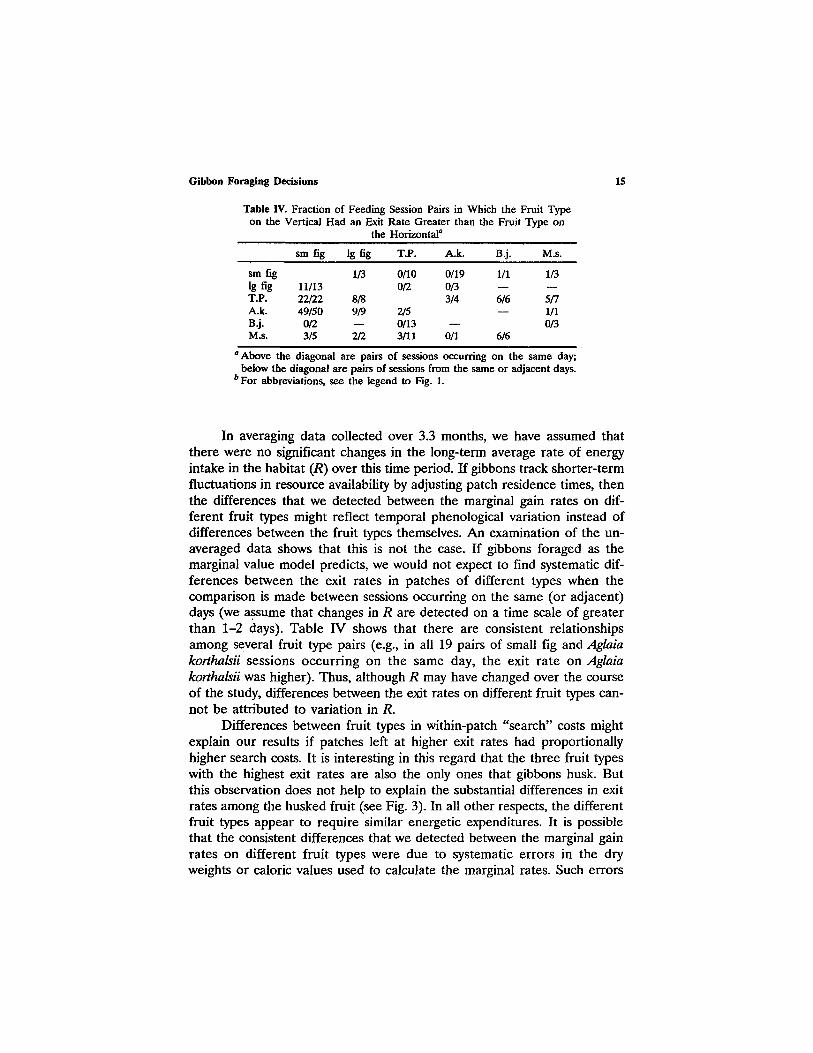
Table IV. Fraction of Feeding on the Vertical Had an Exit
the
Session Pairs in Which the Fruit Type Rate Greater than the Fruit Type on Horizontal ~
15
sm fig lg fig T.P. A.k. B.j. M.s.
sm fig 1/3 0/10 0/19 1/1 1/3 lg fig 11/13 0/2 0/3 - - - - T.P. 22/22 8/8 3/4 6/6 5/7 A.k. 49/50 9/9 2/5 - - 1/1 B.j. 0/2 - - 0/13 - - 0/3 M.s. 3/5 2/2 3/11 0/1 6/6
a Above the diagonal are pairs of sessions occurring on the same day; below the diagonal are pairs of sessions from the same or adjacent days.
b For abbreviations, see the legend to Fig. 1.
In averaging data collected over 3.3 months, we have assumed that there were no significant changes in the long-term average rate of energy intake in the habitat (R) over this time period. If gibbons track shorter-term fluctuations in resource availability by adjusting patch residence times, then the differences that we detected between the marginal gain rates on dif- ferent fruit types might reflect temporal phenological variation instead of differences between the fruit types themselves. An examination of the un- averaged data shows that this is not the case. If gibbons foraged as the marginal value model predicts, we would not expect to find systematic dif- ferences between the exit rates in patches of different types when the comparison is made between sessions occurring on the same (or adjacent) days (we ~sume that changes in R are detected on a time scale of greater than 1-2 days). Table IV shows that there are consistent relationships among several fruit type pairs (e.g., in all 19 pairs of small fig and Aglaia korthalsii sessions occurring on the same day, the exit rate on Aglaia korthalsii was higher). Thus, although R may have changed over the course of the study, differences between the exit rates on different fruit types can- not be attributed to variation in R.
Differences between fruit types in within-patch "search" costs might explain our results if patches left at higher exit rates had proportionally higher search costs. It is interesting in this regard that the three fruit types with the highest exit rates are also the only ones that gibbons husk. But this observation does not help to explain the substantial differences in exit rates among the husked fruit (see Fig. 3). In all other respects, the different fruit types appear to require similar energetic expenditures. It is possible that the consistent differences that we detected between the marginal gain rates on different fruit types were due to systematic errors in the dry weights or caloric values used to calculate the marginal rates. Such errors
16 Grether, Palombit, and Rodman
might result f rom weighing and analyzing portions of the fruit that are in- gested but not digested. Thus, differences between the marginal gain rates on different fruit might be a consequence of differences between fruits in the proport ion actually digested.
This preliminary study reveals that there are a number of important and potentially resolvable issues in primate foraging behavior that have hardly been addressed. Whether or not optimal foraging theory is a suitable f ramework for investigations of primate foraging behavior remains to be established. We hope that this report encourages further research on the subject,
ACKNOWLEDGMENTS
Fieldwork in Sumatra was sponsored by the Indonesian Institute of Sciences, the Indonesian Directora te of Forest Protect ion and Nature Conservat ion , and the Indones ian Primatological Society. G.F.G. and R.A.P. owe special thanks to Chuck Darsono and Kamil Oesman for logistical aid and to the Singh and Dar sono families for their warm hospitality. We thank Suharto Djojosudharmo and Carel van Schaik for providing unpublished data on nutritional information and fruit weights, respectively. Barita Manullang helped to clarify botanical taxonomy. Nell Willits provided invaluable statistical consultation. We thank Doro thy Cheney, Alexander Harcourt , Michael Mooring, Katherine Muller, Thomas Schoener, Walter Shriner, and Judy Stamps for their helpful comments on early drafts of the manuscript. Research was supported by PHS Grant RR00169 (P.S.R.), NSF Dissertation Improvement Grant BNS-8417662 (R.A.P. and P.S.R.), and a U C D Graduate Fellowship (G.F.G.).
REFERENCES
Altmann, S. A., and Wagner, S. S. (1978). A general model of the optimal diet. Rec. Advan. Primatol. 1: 407-414.
Belovsky, G. E. (1978). Diet optimization in a generalis! herbivore: The Moose. Theor. Popul. BioL 14: 104-134.
Belovsky, G. E. (1981). Food plant selection by a generalist herbivore, the moose. Ecology 62: 1020-1030.
Belovsky, G. E. (1984). Herbivore optimal Ioraging: A comparative tcst of three models. Am. Nat. 124: 97-115.
Charnov, E. L. (1976). Optimal foraging: The niarginal value theorem. Theor Popul. Biol. 9: 129-136.
Chivers, D..1. (1972). The siamang and gibbon in Ihe Malay Peninsula. Gibbon Siamang 1: 103-135.
Chivers, D. J. (1978). The gibbons of peninsular Malaysia. Malay. Nat. J. 30: 565-591.
Gibbon Foraging Decisions 17
Crawley, M. J. (1983). Herbivory, Blackwell Scientific, Oxford. Freeland, W. J., and Janzen, D. H. (1974). Strategies in herbivory by mammals: The role of
plant secondary compounds. Am. Nat. 108: 269-289. Gittins, S. P., and Raemaekers, J. J. (1980). Siamang, lar and agile gibbons. In Chivers, D.
J. (ed.), Malayan Forest Primates, Plenum Press, New York, pp. 63-105. Gray, R. (1986). Faith and foraging: A critique of the "paradigm argument from design." In
Kamil, A. C., Krebs, J. R., and Pulliam, H. R. (ed.), Foraging Behavior, Plenum Press, New York, pp. 69-140.
Kacelnik, A., Houston, A. I., and Krebs, J. R. (1981). Optimal foraging and territorial defense in the Great Tit (Parus major). Behav. Ecol. Sociobiol. 8: 35-40.
Krebs, J. R., and McCieery, R. H. (1984). Optimization in behavioral ecology. In Krebs, J. R., and Davies, N. B. (eds.), Behavioral Ecology: An Evolutionary Approach, Blackwell Scientific, Oxford, pp. 91-121.
Mangel, M., and Clark, C. W. (1988). Dynamic Modeling h~ Behavioral Ecology, Princeton University Press, Princeton, N.J.
Maynard Smith, J. (1978). Optimization theory in evolution. Annu. Rev. Ecol. Syst. 9: 31-56. McCleery, R. H. (1977). On satiation curves. Anbn. Behav. 25: 1005-1015. Milton, K., (1979). Factors influencing leaf choice by howler monkeys: A test of some
hypotheses of food selection by generalist herbivores. Am. Nat. 114: 362-368. Paiombit, R. A. (1992). Social and Ecological Variation hz Hylobatht Social Systems, Ph.D.
dissertation, University of California, Davis. Parker, G. A., and Stuart, R. A. (1976). Animal behavior as a strategy optimizer: Evolution
of resource assessment strategies and optimal emigration thresholds. Ariz. Nat. 110: 1055-1076.
Rijksen, H. D. (1978). A Field Study on Sumatran Orangutans (Pongo pygmaeus abelli Lesson 1827), H. Veenman & Zonen, Wageningen.
Rosenthal, G. A., and Janzen, D. H. (1979). Herbivores, Academic Press, New York. Schoener, T. W. (1987). A brief history of optimal lbraging theory. In Kamil, A. C., Krebs,
J. R., and Pulliam, H. R. (eds.), Foraging Behavior, Plenum, New York. Stephens, D. W., and Krebs, J. R. (1986). Foraging Theory, Princeton University Press,
Princeton, N. J. van Schaik, C. P., and Mirmanto, E. (1985). Spatial variation in the structure and litterfaU of
a Sumatran rain forest. Biotropica 17: 196-205.