GIA: Mr Thomas Sample Report · THOMAS GIA The overall percentile is a weighted combination of...
6
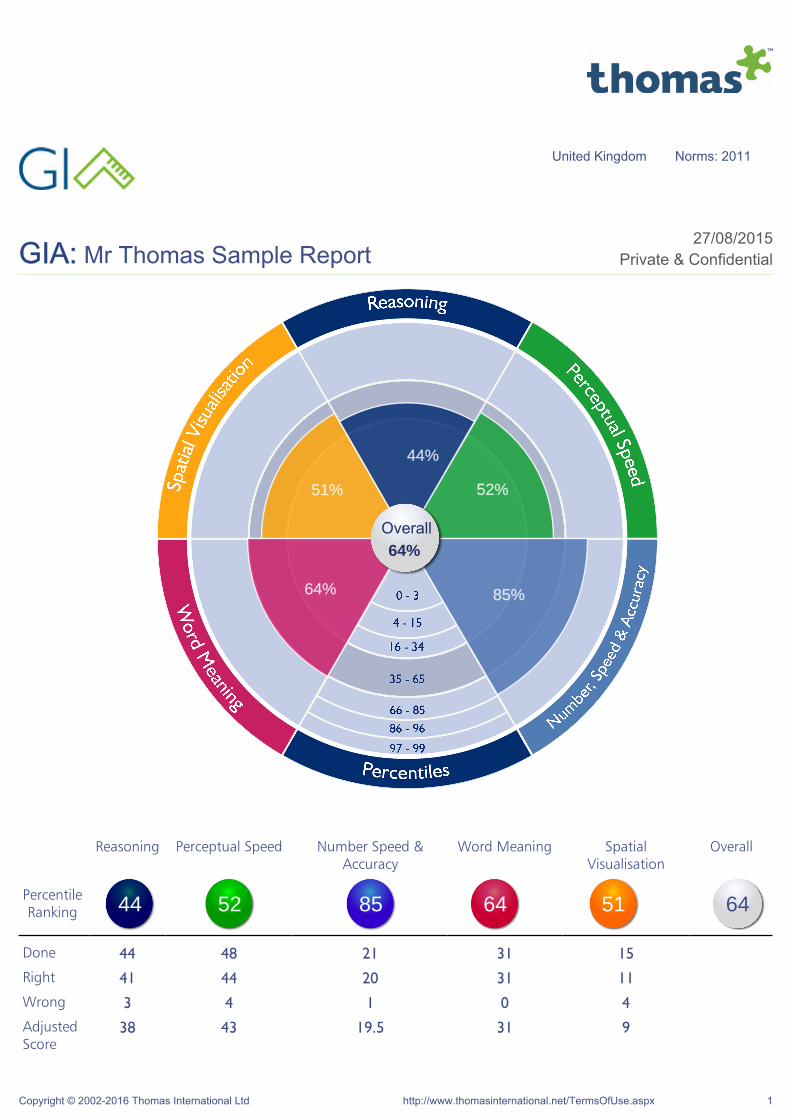
52% 44% 51% 64% 85% Overall 64% United Kingdom Norms: 2011 GIA: Mr Thomas Sample Report 27/08/2015 Private & Confidential Reasoning Perceptual Speed Number Speed & Accuracy Word Meaning Spatial Visualisation Overall Percentile Ranking 44 52 85 64 51 64 Done 44 48 21 31 15 Right 41 44 20 31 11 Wrong 3 4 1 0 4 Adjusted Score 38 43 19.5 31 9 Copyright © 2002-2016 Thomas International Ltd http://www.thomasinternational.net/TermsOfUse.aspx 1
Transcript of GIA: Mr Thomas Sample Report · THOMAS GIA The overall percentile is a weighted combination of...
52%
44%
51%
64% 85%
Overall
64%
United Kingdom Norms: 2011
GIA: Mr Thomas Sample Report27/08/2015
Private & Confidential
Reasoning Perceptual Speed Number Speed &Accuracy
Word Meaning SpatialVisualisation
Overall
PercentileRanking 44 52 85 64 51 64
Done 44 48 21 31 15Right 41 44 20 31 11Wrong 3 4 1 0 4AdjustedScore
38 43 19.5 31 9
Copyright © 2002-2016 Thomas International Ltd http://www.thomasinternational.net/TermsOfUse.aspx 1

THOMAS GIA
The overall percentile is a weighted combination of Perceptual Speed, Number Speed & Accuracy, Reasoning, Word Meaningand Spatial Visualisation. The overall percentile is an estimate of the candidate's general intelligence, reflecting both fluid andcrystallised intelligence. Its accent is on response to training, mental processing speed, concentration and fast track potential.
The results of Mr Thomas Sample Report are in the middle of the norm range. This suggests a standard ability to pick up newskills and abilities. He will be able to absorb new information and the time taken to respond to changing environments will betypical. The ability to process new information is likely to be average.
REASONING
44%
4-15Low
16-34BelowAverage
35-65Average
66-85AboveAverage
86-96High
Questions completed: 44 Correct answers: 41
The Reasoning Test assesses the ability to make inferences, to reason from information provided and to draw correctconclusions. This test assesses the ability of an individual to hold information in his short-term memory and solve problemsafter receiving either verbal or written instructions. A high score would suggest fluent verbal reasoning skills.
The following describes how Mr Thomas Sample Report performed in Reasoning:
Middle of the Norm range·Standard ability to draw correct conclusions·Can typically hold information in short-term memory, whilst solving problems from either written or verbal instructions·Verbal reasoning likely to be average·Likely to reason from information provided·
PERCEPTUAL SPEED
52%
4-15Low
16-34BelowAverage
35-65Average
66-85AboveAverage
86-96High
Questions completed: 48 Correct answers: 44
The Perceptual Speed Test assesses the capacity to recognise details in the environment, incorporating the perception ofinaccuracies in written material, numbers and diagrams, the ability to ignore irrelevant information, to identify similarities anddifferences in visual configurations. This test assesses how quickly and accurately an individual can check and report forerror/accuracy. It is a test of semantic encoding and perception. A high score would suggest the ability to: mentally match thefeatures of letters and the meaning of symbols. It would also indicate the ability to detect misfits.
The following describes how Mr Thomas Sample Report performed in Perceptual Speed:
Copyright © 2002-2016 Thomas International Ltd http://www.thomasinternational.net/TermsOfUse.aspx 2
Middle of the Norm range·Likely to identify inaccuracies in written material, numbers and diagrams·Standard ability to check for errors·Identifying similarities and differences in visual configurations likely to be average·Can typically ignore irrelevant information·
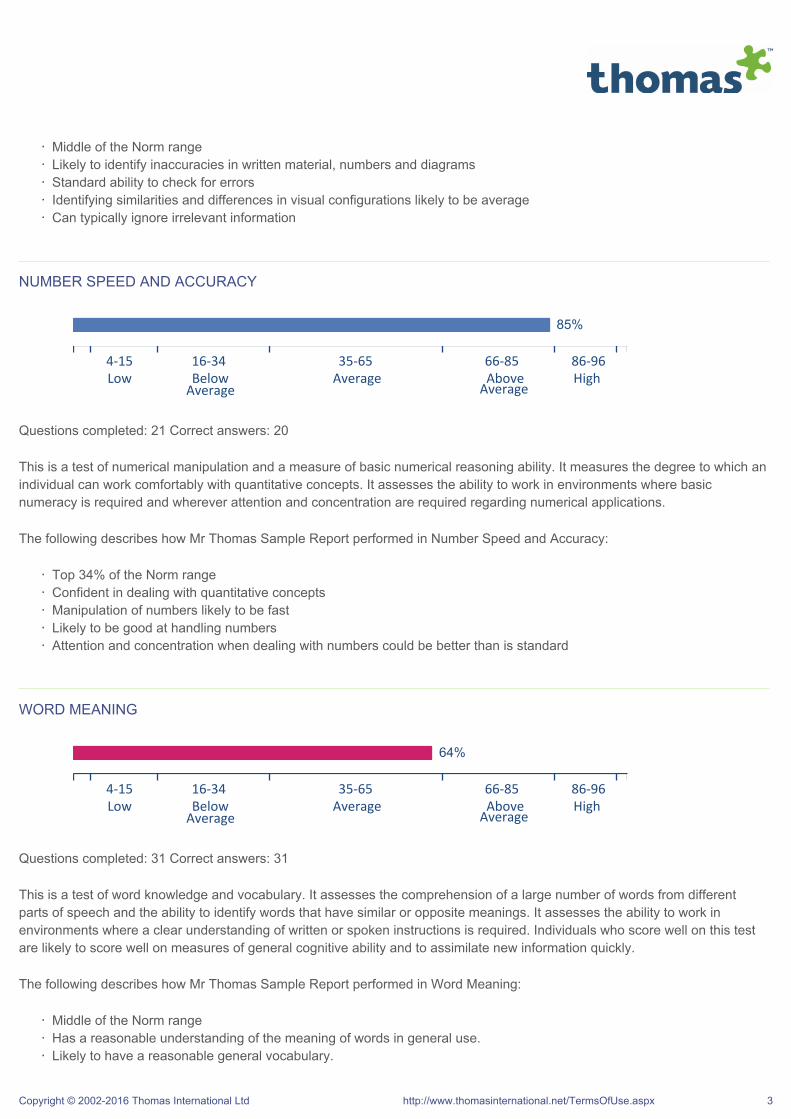
NUMBER SPEED AND ACCURACY
85%
4-15Low
16-34BelowAverage
35-65Average
66-85AboveAverage
86-96High
Questions completed: 21 Correct answers: 20
This is a test of numerical manipulation and a measure of basic numerical reasoning ability. It measures the degree to which anindividual can work comfortably with quantitative concepts. It assesses the ability to work in environments where basicnumeracy is required and wherever attention and concentration are required regarding numerical applications.
The following describes how Mr Thomas Sample Report performed in Number Speed and Accuracy:
Top 34% of the Norm range·Confident in dealing with quantitative concepts·Manipulation of numbers likely to be fast·Likely to be good at handling numbers·Attention and concentration when dealing with numbers could be better than is standard·
WORD MEANING
64%
4-15Low
16-34BelowAverage
35-65Average
66-85AboveAverage
86-96High
Questions completed: 31 Correct answers: 31
This is a test of word knowledge and vocabulary. It assesses the comprehension of a large number of words from differentparts of speech and the ability to identify words that have similar or opposite meanings. It assesses the ability to work inenvironments where a clear understanding of written or spoken instructions is required. Individuals who score well on this testare likely to score well on measures of general cognitive ability and to assimilate new information quickly.
The following describes how Mr Thomas Sample Report performed in Word Meaning:
Middle of the Norm range·Has a reasonable understanding of the meaning of words in general use.·Likely to have a reasonable general vocabulary.·
Copyright © 2002-2016 Thomas International Ltd http://www.thomasinternational.net/TermsOfUse.aspx 3
Likely to be able to express thoughts and ideas with a reasonable level of fluency.·Ability to assimilate new information is likely to be average.·
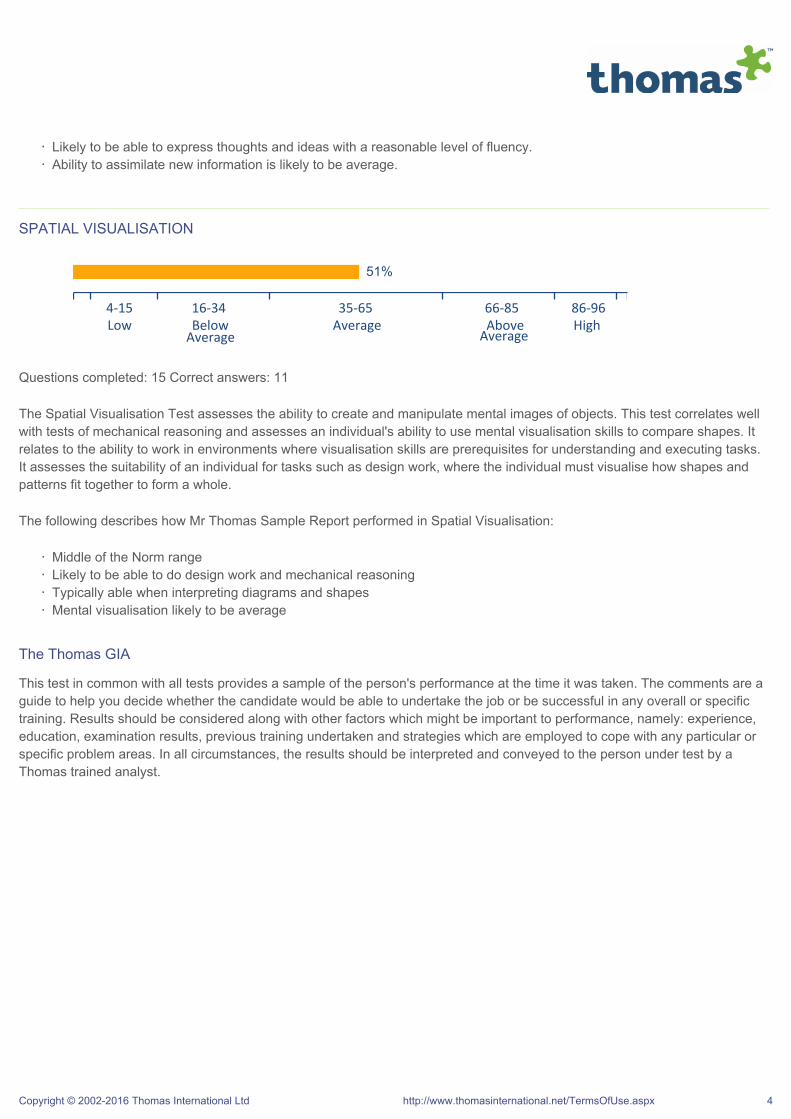
SPATIAL VISUALISATION
51%
4-15Low
16-34BelowAverage
35-65Average
66-85AboveAverage
86-96High
Questions completed: 15 Correct answers: 11
The Spatial Visualisation Test assesses the ability to create and manipulate mental images of objects. This test correlates wellwith tests of mechanical reasoning and assesses an individual's ability to use mental visualisation skills to compare shapes. Itrelates to the ability to work in environments where visualisation skills are prerequisites for understanding and executing tasks.It assesses the suitability of an individual for tasks such as design work, where the individual must visualise how shapes andpatterns fit together to form a whole.
The following describes how Mr Thomas Sample Report performed in Spatial Visualisation:
Middle of the Norm range·Likely to be able to do design work and mechanical reasoning·Typically able when interpreting diagrams and shapes·Mental visualisation likely to be average·
The Thomas GIA
This test in common with all tests provides a sample of the person's performance at the time it was taken. The comments are aguide to help you decide whether the candidate would be able to undertake the job or be successful in any overall or specifictraining. Results should be considered along with other factors which might be important to performance, namely: experience,education, examination results, previous training undertaken and strategies which are employed to cope with any particular orspecific problem areas. In all circumstances, the results should be interpreted and conveyed to the person under test by aThomas trained analyst.
Copyright © 2002-2016 Thomas International Ltd http://www.thomasinternational.net/TermsOfUse.aspx 4

INTERVIEWER NOTES
The following notes are given as a specific reminder to interviewers of some of the principle factors relating to GIA testing asdetailed at Thomas GIA training seminars. These points are vital.
1. Chance Levels
It is essential to ask questions to find out reasons for any poor test performance, especially if the other test scores are high. Ifthere are doubts about whether the person has had an adequate understanding of test instructions, then a complete re-test is apossibility provided that such a decision does not give an unfair advantage to someone who is initially a low scorer for otherreasons. Alternatively it may be best to assess the candidate on evidence other than that provided by the test programme. In allsuch cases great care is needed in interpreting the overall percentile.
2. Pronounced Highs and Lows
When the profile of test scores shows one or more pronounced highs or lows, then some inconsistency in performance isevident. A skilfully conducted interview should try to find out the reason for discrepancies, without upsetting the candidate byinadvertently suggesting that a "low" score is a failure. In many cases it is not. Where a low score is probed to find out if it canbe explained satisfactorily, the interview must be tactfully handled to avoid giving the impression that a single test has beensufficient to disqualify the person for a job or impair his development potential. In most instances such should not be the case.When evaluating pronounced highs and lows, the individual tests should be looked at carefully and employers should decidewhether slow, careful unsupervised work is preferable to faster more error-laden task completion.
3. General Recommendations on Fair Practice
a) Explain procedures and practices before administering the GIA and ensure that the candidate understands. b) Never offertest results as the reason for non-acceptance. c) In the event of any person declaring a cultural/linguistic and/or specificdisability disadvantage, use the GIA as a screen without prejudice to the rest of the process. d) Tests and inventories shouldnever be used in isolation to justify redundancy decisions. Such use could be construed as unfair.
For further information on fair practices refer to the Thomas leaflet Fair Recruitment and Appraisal Methods at Work, includedin all Thomas seminar materials.
Copyright © 2002-2016 Thomas International Ltd http://www.thomasinternational.net/TermsOfUse.aspx 5
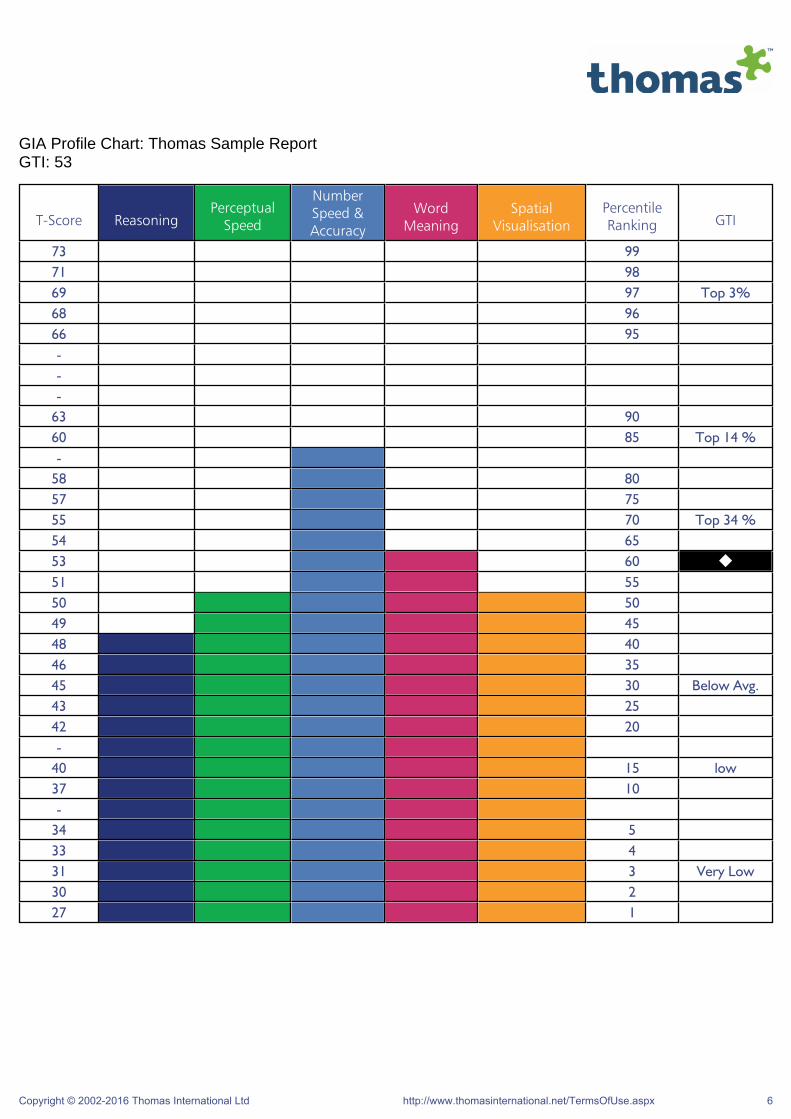
GIA Profile Chart: Thomas Sample ReportGTI: 53
T-Score ReasoningPerceptual
Speed
NumberSpeed &Accuracy
WordMeaning
SpatialVisualisation
PercentileRanking GTI
73 9971 9869 97 Top 3%68 9666 95---
63 9060 85 Top 14 %-
58 8057 7555 70 Top 34 %54 6553 60 u51 5550 5049 4548 4046 3545 30 Below Avg.43 2542 20-
40 15 low37 10-
34 533 431 3 Very Low30 227 1
Copyright © 2002-2016 Thomas International Ltd http://www.thomasinternational.net/TermsOfUse.aspx 6