GI Forum 2016, Vol.1 Context-aware Thinning of Artificial ... 0x0033fe76.pdf · Kadaster) Figure 1...
18
12 Context-aware Thinning of Artificial Water Networks for Map Generalization GI_Forum 2016, Vol.1 Page: 12-29 Full Paper Corresponding Author: [email protected] DOI: 10.1553/giscience2016_01_s12 Vincent van Altena 1 and Jantien Stoter 2 1 Cadastre, Land Registry and Mapping Agency of the Netherlands 2 Delft University of Technology, The Netherlands Abstract This paper summarizes the research conducted to improve the automatic generalization of man-made water networks for topographic maps by context-dependent pruning (Altena, 2014). The aim of this study was to improve existing thinning methods for map generalization by accounting for landscape types. The results show that it is possible to improve the thinning of water networks by taking into account separate landscape types. On a more abstract level, the study delivers a methodology for the pruning of man-made networks with regard to landscape typology. In addition, it provides a method for evaluating the quality of generalization results for networks. First, previous research on both thinning and evaluation of thinning results is described. Secondly, a selection of existing algorithms are implemented and evaluated by several experiments: identification of landscape variation based on feature morphology and humidity; selection of representative test areas; and geometric network improvement. Results show that the connectivity of the network can be significantly increased. This is important to obtain better generalization results. The final experiments investigated the effectiveness on various landscape types of three different thinning algorithms. The results are evaluated in terms of the amount of thinning, the resemblance of the results to the input data, and the deviation in connectivity. The findings of this research can be used to improve the thinning of artificial networks by applying a customized thinning method to each unique landscape type. In addition, the proposed metrics to measure the effectivity of thinning algorithms – reduction, resemblance and connectivity – have been proved to be appropriate criteria for the comparison of results of alternative thinning approaches. Keywords: automated generalization, cartography, evaluation metrics, hydrographic network 1 Introduction The issue of automated generalization has resounded for decades in the cartographic and academic worlds and has been seen as the 'holy grail' of cartography (Anderson-Tarver et al., 2011). Recently, there have been several automated generalization achievements, such as the automated generalization of OS MasterMap to OS VectorMap District in Great Britain
Transcript of GI Forum 2016, Vol.1 Context-aware Thinning of Artificial ... 0x0033fe76.pdf · Kadaster) Figure 1...

12
Context-aware Thinning of
Artificial Water Networks for Map
Generalization
GI_Forum 2016, Vol.1
Page: 12-29
Full Paper
Corresponding Author:
DOI: 10.1553/giscience2016_01_s12
Vincent van Altena1 and Jantien Stoter2
1 Cadastre, Land Registry and Mapping Agency of the Netherlands 2 Delft University of Technology, The Netherlands
Abstract
This paper summarizes the research conducted to improve the automatic generalization of
man-made water networks for topographic maps by context-dependent pruning (Altena,
2014). The aim of this study was to improve existing thinning methods for map
generalization by accounting for landscape types. The results show that it is possible to
improve the thinning of water networks by taking into account separate landscape types.
On a more abstract level, the study delivers a methodology for the pruning of man-made
networks with regard to landscape typology. In addition, it provides a method for
evaluating the quality of generalization results for networks. First, previous research on both
thinning and evaluation of thinning results is described. Secondly, a selection of existing
algorithms are implemented and evaluated by several experiments: identification of
landscape variation based on feature morphology and humidity; selection of
representative test areas; and geometric network improvement. Results show that the
connectivity of the network can be significantly increased. This is important to obtain better
generalization results. The final experiments investigated the effectiveness on various
landscape types of three different thinning algorithms. The results are evaluated in terms of
the amount of thinning, the resemblance of the results to the input data, and the deviation
in connectivity. The findings of this research can be used to improve the thinning of artificial
networks by applying a customized thinning method to each unique landscape type. In
addition, the proposed metrics to measure the effectivity of thinning algorithms –
reduction, resemblance and connectivity – have been proved to be appropriate criteria
for the comparison of results of alternative thinning approaches.
Keywords:
automated generalization, cartography, evaluation metrics, hydrographic network
1 Introduction
The issue of automated generalization has resounded for decades in the cartographic and academic worlds and has been seen as the 'holy grail' of cartography (Anderson-Tarver et al., 2011). Recently, there have been several automated generalization achievements, such as the automated generalization of OS MasterMap to OS VectorMap District in Great Britain

Altena & Stoter
13
(Revell et al., 2005), and the replacement of the manual generalization production line by a fully automated workflow, at the Dutch Kadaster, of the 1:50k map series (Stoter et al., 2014). Despite these successes, it is also acknowledged that further development is necessary. One area where further development is needed is the pruning of man-made water networks, because prevailing water-thinning algorithms do not deliver satisfying results for man-made water networks.
Generalization
Foundational to this research is the concept of generalization. This concept is best explained by visual examples.
Figure 1: A fragment of a 25k map (TOP25raster 12A,
CC-BY Kadaster)
Figure 2: (a) The same 25k map
fragment reduced in scale; (b) The
same geographical area, but
presented as a generalized 50k map
fragment (TOP50raster 12W, CC-BY
Kadaster)
Figure 1 is of a small portion of the most detailed topographic map in the Netherlands. It shows individual houses and trees, watercourses and parcels of land.
Often, this amount of detail is not necessary, or is even distracting, and an overview map is needed. One solution for creating an overview map is to simply shrink the original image by zooming out. However, this will create legibility problems (see Figure 2a).
To tackle these issues, it is common mapmakers’ practice to re-create a map by generalizing the input data for portrayal at a smaller scale. In the example above (compare the images in
Altena & Stoter
14
Figure 2), the individual houses are replaced by built-up areas, and the width of the roads is exaggerated to improve legibility. In performing generalization, operators (Kraak, 2010; Stanislawski et al., 2014) such as simplification, selection, exaggeration, typification and other strategies are used to create a meaningful map at a smaller (less detailed) scale.
Automation of generalization
Until recently, generalization was considered a manual craft. It was doubted whether it would be possible to replace the human cartographer by a computer: “After more than three decades of effort, it is still a question whether generalization can be formally defined, and whether automated generalization can be realized” (Peng, 1997, p. i).
Recently, there have been several successes. Burghardt et al. (2014), Stoter (2010a, 2010b), and Mackaness et al. (2007) can be consulted for an overview of the state-of-the-art up to 2014. The research presented in this article takes the Kadaster process (Stoter et al., 2014) as a case study. Although acceptable results have been achieved (evidenced by the willingness to fully replace the manual generalization workflow by an automatic procedure), one of the remaining issues is the thinning of the Dutch water network.
Problem description
The input data for automatic generalization is produce for a map at a scale of 1:10.000. Hydrography is represented as lines and polygons, depending on the width of the waterways. Figure 3 shows an example of the input data.
Figure 3: Ungeneralized input data for the dutch hydro network (Blue lines represent waterlines, black
lines dry ditches. Waterlines are of GREATER importance than ditches)

Altena & Stoter
15
After applying commonly-used thinning algorithms, the resulting data for this area looks as in Figure 4.
Figure 4: Current thinning results of the same area. disappearance of features is indicated by red oval
Many features have disappeared, as was intended. However, two issues remain: the loss of resemblance with the input data structure, and the neglect of the density variance in water networks.
Research aim and questions
This research aims to “deliver a methodology for pruning of artificial manmade networks with regard to landscape typology and to research methods to evaluate the quality of generalization results” (Altena, 2014, p. 20), in order to overcome the issues identified. Therefore, the research needs to answer two closely-related research questions: (1) What is a suitable methodology for pruning artificial man-made networks which takes landscape typology into account? (2) How can thinning results be evaluated objectively?
This paper is structured as follows: in section 2, answers to the research questions are obtained by studying the literature, starting with a brief overview of thinning algorithms, which is followed by a summary of evaluation approaches. Section 3 discusses the implementation of the concepts found in the literature and their application to test data. It also proves the added value of improved connectivity for the thinning results and discusses the application of new evaluation metrics. Finally, section 4 discusses the results and suggests subjects for further research.

Altena & Stoter
16
2 Literature Review
This section describes previous work on the two main issues of this research: the thinning of water networks and the evaluation of thinning results.
Thinning algorithms
Several approaches for thinning networks already exist. They can be categorized as semantic- stroke- or mesh-based.
Semantic-based selection uses attribute information for the selective omission of network features. For a hydrographical network, examples are: type of watercourse (hierarchical order of Dutch drainage system: trench, watercourse 1, watercourse 2), the width category of the object, whether part of main drainage, etc. The main drawback of this approach is that it does not guarantee that topological and geometrical structures are retained (Liu et al., 2010).
Stroke-based selection is a two-step method to select individual network objects based on their importance for keeping essential network characteristics. It derives its name from the idea of a ‘stroke’, which Thomson & Richardson (1999, p. 4) define as “a curvilinear segment that can be drawn in one smooth movement and without a dramatic change in style”. The underlying assumption is that “traffic routes are built as curvature-poor as possible” (Heinzle et al., 2005, p. 3). The main principles of stroke-based selection are to keep ‘good continuation’ and ‘similarity of characteristics’.
A network structure is broken down into topological edges and nodes. The relative importance of each edge within the network is identified by aggregating the individual elements into larger ones based on one or more shared characteristics and predefined rules (i.e. which characteristics are allowed to be dissolved with higher-order characteristics). The second step is performing a selection, using the identified hierarchy and a predefined threshold.
Finally, the mesh-based approach (Chen et al., 2009; Edwardes & Mackaness, 2000) focuses on density. It centres on the concept of a mesh, an area fully enclosed by edges (i.e. roads). The density of a theme (i.e. a road or a waterway network) can be calculated by the construction of meshes from the individual objects of the theme.
In this study, experiments were performed using the authors’ own implementations of a stroke-based algorithm and a mesh-based algorithm. The commercial implementation by Esri® in the Thin Road Networks tool was also used.
Evaluation of thinning results
Besides performing the thinning itself, the other main research problem was: How are these results to be evaluated? In the literature, two main metrics to evaluate the quality of the thinning can be found: the coefficient of correspondence and the application of network statistics. The coefficient of correspondence was first proposed by Stanislawski et al. (2010) to assess the amount of network thinning and was implemented by Buttenfield et al. (2013) as a raster method. The method compares the results of thinning operations with an existing

Altena & Stoter
17
benchmark dataset and provides statistics to evaluate the consistency of the pruning and generalization operations. Another approach to measure the quality of the thinning output can be found in the application of network statistics: “In a network database, linear features are linked together topologically” (Wong, 2005, p. 304). Two approaches to assess network qualities based on statistics can be distinguished. The first approach assesses the connectivity
of an entire network (γ-index), and the second assesses the accessibility of network elements
(α-index.)
Although their applicability for measuring the quality of networks is limited, both the γ- and
the α-indices are useful to assess the quality of networks (Wong, 2005). They are therefore used to compare the network connectivity of the input data with the output data and to differentiate the outcomes of several algorithms (Altena, 2014).
3 Experiments with the Dutch Hydro network
To improve the results of available thinning algorithms as shown in Figure 4, we propose to take landscape types into account when thinning. The whole of this research is based on the assumption that generalization and more precisely thinning cannot be carried out as individual or discrete units, but should be part of an experimental framework (see Figure 5).
Figure 5: Experimental Framework for thinning of a hydro network
The experimental framework consists of three phases. The first phase prepares the source data for the thinning algorithms. In the second phase, three existing thinning algorithms are used to prune the source data. The third and last phase evaluates the results for the individual test areas and compares the results for the three algorithms. This evaluation is based on three criteria: resemblance, thinning and connectivity.
Preparation
The preparation of the data can be split into three distinct activities. First, landscape types for the whole of the country are identified. Next, suitable test areas are selected based on the landscape types identified. Finally, the connectivity of the water networks in the selected test areas is improved.
Preparation
•Landscape
•Test areas
•Connectivity
Thinning
•Stroke-based
•Mesh-based
•Thin Road Network
Evaluation
•Network statistics
•Resemblance
•Thinning
•Connectivity
Altena & Stoter
18
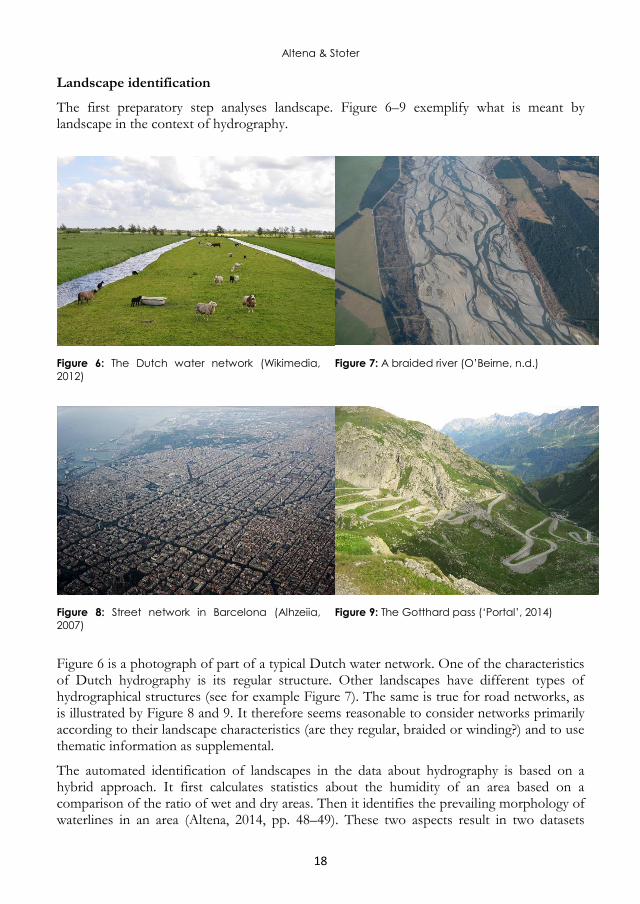
Landscape identification
The first preparatory step analyses landscape. Figure 6–9 exemplify what is meant by landscape in the context of hydrography.
Figure 6: The Dutch water network (Wikimedia,
2012) Figure 7: A braided river (O’Beirne, n.d.)
Figure 8: Street network in Barcelona (Alhzeiia,
2007) Figure 9: The Gotthard pass (‘Portal’, 2014)
Figure 6 is a photograph of part of a typical Dutch water network. One of the characteristics of Dutch hydrography is its regular structure. Other landscapes have different types of hydrographical structures (see for example Figure 7). The same is true for road networks, as is illustrated by Figure 8 and 9. It therefore seems reasonable to consider networks primarily according to their landscape characteristics (are they regular, braided or winding?) and to use thematic information as supplemental.
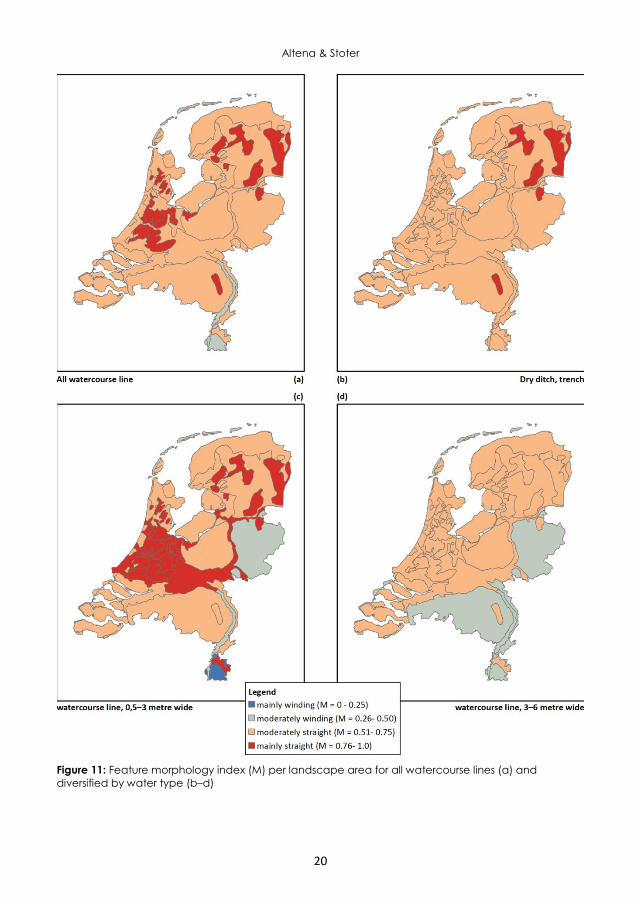
The automated identification of landscapes in the data about hydrography is based on a hybrid approach. It first calculates statistics about the humidity of an area based on a comparison of the ratio of wet and dry areas. Then it identifies the prevailing morphology of waterlines in an area (Altena, 2014, pp. 48–49). These two aspects result in two datasets

Altena & Stoter
19
which indicate the humidity of an area (Figure 10) and give an indication of its prevailing morphology (Figure 11).
Figure 10: Humidity per landscape type
Altena & Stoter
20
Figure 11: Feature morphology index (M) per landscape area for all watercourse lines (a) and
diversified by water type (b–d)

Altena & Stoter
21
These analyses evidence that the existing data set shows enough diversity when we consider the morphology of waterline features. As such, it is suitable input data to be used in identifying landscape typology. The feature morphology is calculated for the whole dataset and this is conflated with the test areas. Next, the smallest test areas (partitions), which are completely contained by a single landscape type, are selected. These test areas are used for experiments.
Geometric improvement
The second important preparatory step is the geometric improvement of the network. In a network, connectivity of features is the most important characteristic. Figure 12 shows a conceptual visualization of a network.
Dyke, cow dam
Culvert
Road
Perceptual link
Dry ditch, trench
Waterway, 0,5 – 3 metres
Waterway, 3 – 6 metres
Water area
Figure 12: Initial topographical situation
At first glance everything seems to be connected: water areas, waterlines and roads. This is easy to perceive for the human eye (compare Figure 13). This is why this kind of network is termed a ‘perceptual network’ (Altena, 2014, p. 56).
Altena & Stoter
22
These lines, though interrupted, form a perceptually continuous structure
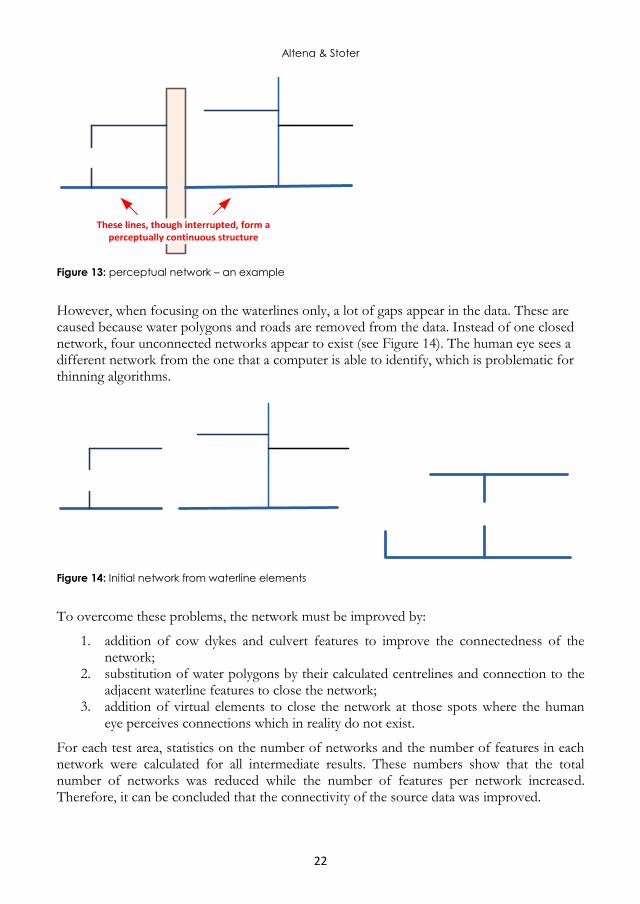
Figure 13: perceptual network – an example
However, when focusing on the waterlines only, a lot of gaps appear in the data. These are caused because water polygons and roads are removed from the data. Instead of one closed network, four unconnected networks appear to exist (see Figure 14). The human eye sees a different network from the one that a computer is able to identify, which is problematic for thinning algorithms.
Figure 14: Initial network from waterline elements
To overcome these problems, the network must be improved by:
1. addition of cow dykes and culvert features to improve the connectedness of the network;
2. substitution of water polygons by their calculated centrelines and connection to the adjacent waterline features to close the network;
3. addition of virtual elements to close the network at those spots where the human eye perceives connections which in reality do not exist.
For each test area, statistics on the number of networks and the number of features in each network were calculated for all intermediate results. These numbers show that the total number of networks was reduced while the number of features per network increased. Therefore, it can be concluded that the connectivity of the source data was improved.

Altena & Stoter
23
The second stage in the experimental framework consists in applying alternative thinning algorithms to the selected test areas. A stroke-based, a mesh-based and a commercial algorithm (Thin Road Networks – TRN – as implemented in ArcGIS software) were used on all test areas. The results are summarized later in this article. Detailed test results can be found in Altena (2014, pp. 60–65).
Evaluation
The assessment of cartographic generalization is prone to becoming subjective. What is a meaningful way to qualify these results? Metrics are suggested to achieve objectivity: to achieve ‘reduction’ of detail in a map in a meaningful way, to assure ‘resemblance’ with structures in the input data, and to retain ‘connectivity’ in the results. We quantify these three characteristics and use them in our evaluation.
For each criterion, the scores are displayed in tabular format. The last column (Rank) gives the score for the performance of the different algorithms in conjunction with each other. Here, S stands for Stroke-based algorithm, T the Thin Road Networks algorithm, and M the mesh-based algorithm. Ranking is from high (best performing) to low (worst performing).
Reduction
The first criterion used in comparing and evaluating the results of the different thinning algorithms for the various partitions (i.e. the different types of landscape) is the reduction in the number of features for the test areas. Table 1 shows the number of features for the input data and the results for the three algorithms. The reduction of features is compared to the input data for each thinning algorithm and is expressed as a relative decline. The largest negative percentage presents the largest decrease in feature count. From Table 1 it can be concluded that the stroke-based approach results in the greatest reduction in number of features.
Table 1: Results of thinning algorithm evaluated for reduction in number of features
partition input meshes % strokes % TRN % RANK
1 445 445 0% 168 -62% 317 -29% STM
17 108 100 -7% 52 -52% 54 -50% STM
49 29 26 -10% 8 -72% 14 -52% STM
93 820 789 -4% 496 -40% 766 -7% STM
198 1560 1482 -5% 516 -67% 1408 -10% STM
217 137 133 -3% 41 -70% 94 -31% STM
260 397 389 -2% 139 -65% 280 -29% STM
298 300 288 -4% 102 -66% 173 -42% STM
345 582 553 -5% 268 -54% 459 -21% STM
403 802 783 -2% 408 -49% 615 -23% STM
442 667 661 -1% 269 -60% 528 -21% STM
average change -4% -60% -29% STM

Altena & Stoter
24
Resemblance
The second criterion for comparison of the outcomes of the three algorithms is resemblance with the input data. Resemblance can be defined as “X showing the same character as Y”. It is not easy to find a metric which can be used. In this case we used the feature morphology as an evaluation metric. The Feature Morphology Index (FMI) is a value expressing the relation between the number of features and the number of corresponding vertices. This can be used to evaluate the average feature morphology within an area. It can also be used for comparison between areas or to evaluate the effects of different approaches (Altena, 2014, pp. 48–49). From Table 2 it can be concluded that the mesh-based approach changes the input data the least.
Table 2: Comparison of change in average feature morphology per algorithm for each partition
partition input strokes % meshes % TRN % RANK
1 0.235 0.076 -68% 0.228 -3% 0.174 -26% MTS
17 0.389 0.200 -49% 0.374 -4% 0.251 -35% MTS
49 0.475 0.214 -55% 0.442 -7% 0.353 -26% MTS
93 0.648 0.340 -47% 0.644 -1% 0.626 -3% MTS
198 0.761 0.411 -46% 0.771 1% 0.745 -2% MTS
217 0.643 S0.278 -57% 0.617 -4% 0.590 -8% MTS
260 0.629 0.270 -57% 0.630 0% 0.558 -11% MTS
298 0.517 0.228 -56% 0.542 5% 0.392 -24% MTS
345 0.689 0.383 -44% 0.689 0% 0.637 -8% MTS
403 0.675 0.444 -34% 0.672 0% 0.639 -5% MTS
442 0.616 0.300 -51% 0.611 -1% 0.588 -5% MTS
average deviation in FMI -51% -1% -14% MTS
Connectivity
The third criterion for comparison of the results is the connectivity level of the features. At first glance, using network statistics seems to be appropriate. Unfortunately, these metrics can only be applied to one network at a time, and they were therefore not useful for comparing the connectivity of the test partitions. For this reason, a different metric was chosen for comparison, i.e. the reduction in the number of networks.

Altena & Stoter
25
Table 3: Comparison of reduction in number of networks for each algorithm
input meshes % strokes % TRN % RANK
1 118 338 186% 37 -69% 19 -84% TSM
17 68 63 -7% 21 -69% 19 -72% TSM
49 15 14 -7% 5 -67% 5 -67% TSM
93 58 162 179% 58 0% 16 -72% TSM
198 48 228 375% 104 117% 13 -73% TSM
217 23 52 126% 15 -35% 6 -74% TSM
260 112 168 50% 35 -69% 20 -82% TSM
298 148 190 28% 36 -76% 31 -79% TSM
345 140 210 50% 83 -41% 52 -63% TSM
403 241 339 41% 152 -37% 106 -56% TSM
442 99 179 81% 50 -49% 15 -85% TSM
average change +100% -36% -73% TSM
If we compare the results of the stroke-based, mesh-based and TRN-based algorithms (Table 3), it can be seen that the most radical reduction in number of networks occurs when applying a TRN-based algorithm, while application of a mesh-based approach results in an increase of networks for most of the test partitions. The stroke-based algorithm results in the second-best reduction, but it is not always stable (Altena, 2014, p. 69).
Coherent evaluation
The scores on the individual metrics (Reduction, Resemblance and Connectivity) aggregated for the three thinning algorithms indicate the most suitable approach. The total score can be computed by adding the individual scores. All metrics have equal weights in a Multi Criteria Analysis (MCA), because all three criteria are assumed to be of equal importance (to be validated in future research).
Table 4: Overall evaluation for each algorithm (1= the lowest score, 3 the highest score)
stroke-based mesh-based TRN-based
Reduction 3 1 2
Resemblance 1 3 2
Connectivity 2 1 3
Total 6 5 7
The results of the MCA indicate a clear hierarchy for the performance of the algorithms: the Thin Road Network scores best, followed by the stroke-based algorithm. The mesh-based algorithm scores the lowest for both reduction (an average decrease of -4%) and connectivity (an average increase of +100%). Therefore it can be concluded that this approach is least useful for thinning artificial water networks compared to the other two methods.

Altena & Stoter
26
Another important conclusion is that the three thinning algorithms do not provide significant differences in results for the individual landscape types. Therefore using different thinning algorithms for different landscape types will not improve the overall thinning results, at least not for the three thinning methods investigated in our research.
4 Discussion and conclusion
This paper presents research to identify a suitable methodology for pruning man-made water networks which takes landscape typology into account. The question is answered by the introduction of a prototyping framework, which offers methods to identify landscape type for network features and to improve the connectivity of the networks in the input data. This is important to obtain better thinning results.
Results of the study
The identification of landscape type for an area was researched using a hybrid approach. An existing landscape classification dataset was evaluated on its merits to show variance in feature morphology and humidity. Results showed enough variety in the landscape for it to be suitable in the selection of test areas. This experiment also revealed the usability of morphology and humidity as metrics to characterize the hydrographical network of an area.
It was also shown that the connectivity of a network can be improved by computing perceptual links, which were added to the dataset. This results in a reduction of the number of networks and a significant improvement in network connectivity.
The usage and behaviour of this enhanced network in different thinning algorithms were the subjects of the next set of experiments. The application of three thinning algorithms was researched: a stroke-based approach, a mesh-based approach, and a TRN-based approach. The stroke-based algorithm is in essence not a thinning algorithm. Rather it should be regarded as a selection algorithm to identify a geometry-based hierarchy for a network. The thinning itself has to be implemented in a subsequent step, and results are dependent on the sophistication of such an algorithm (i.e. it should also take density and connectivity into account). The mesh-based algorithm performed worst: the most significant aspect in the results of the mesh-based algorithm is the increase in the number of networks, while hardly any thinning occurs. The reason for this is that the thinning breaks existing networks into multiple parts, resulting in loss of connecting patterns. The results of the TRN-based approach proved to be the most promising, both in general and in the test scores for the individual areas.
An important challenge of the research was to assess the outputs of different thinning algorithms. It appeared that existing evaluation methods have limited application possibilities for this study, due to the need for benchmark data and data regarding network structures Therefore, three new evaluation metrics on Reduction, Resemblance and Connectivity were designed for use in comparison with alternative thinning approaches. All three metrics were considered to be of equal importance. Each test area was scored on its performance and the ranking was determined by using a Multi Criteria Analysis. The results of the MCA indicate a

Altena & Stoter
27
clear hierarchy for the performance of algorithms: the Thin Road Network scores best, followed by the stroke-based algorithm. Because of the low scores for both reduction and connectivity obtained using the mesh-based algorithm, the use of this algorithm is not considered helpful for thinning.
Limitations and recommendations for further research
Although the study has successfully demonstrated the ability to identify landscape typology and its usefulness for evaluation purposes, it has provided limited results in tailoring the choice of thinning algorithm with regard to landscape type. It is possible to distinguish landscape types by humidity and feature morphology, and to use these to tailor the pruning algorithm. However, the thinning algorithms researched here did not provide significant differences in results where the individual landscape types were concerned.
It would be interesting in the future to assess the effects of other thinning algorithms on the identified landscape types (Brewer et al., 2009; Buttenfield, 2010; Savino, 2014). The framework proposed provides room for the addition of other algorithms and the comparison of different thinning solutions.
A future study investigating data enrichment from external data sources to generate a more sophisticated hierarchy for thinning purposes and its effect on the potential for generalizing results would also be of interest.
Acknowledgements
This research was performed under the supervision of Prof. Dr. Jantien Stoter, Delft University of Technology ([email protected]), and Prof. Dr. Henk Scholten, Vrije Universiteit Amsterdam ([email protected]).
References
Alhzeiia. (2007). Eixample de Barcelona vist des de l’aire. Retrieved 22 March 2016, from http://www.flickr.com/photos/ilak/3187655762/
Altena, V. van. (2014, December 1). Improvement of automatic generalisation of manmade water networks for topographic maps by context-dependent pruning. Vrije Universiteit, Amsterdam.
Alte Passstraße im Val Tremola auf der Südseite des Gotthards. (2014, May 18). In Wikipedia. Retrieved from https://de.wikipedia.org/w/index.php?title=Portal:Stra%C3%9Fen/Bild_der_Woche&oldid=130505021
Anderson-Tarver, C., Buttenfield, B. P., Stanislawski, L. V., & Koontz, J. M. (2011). Automated delineation of stream centerlines for the USGS National Hydrography Dataset. In Advances in Cartography and GIScience. Volume 1 (pp. 409–423). Springer. Retrieved from http://link.springer.com/chapter/10.1007/978-3-642-19143-5_23
Brewer, C. A., Buttenfield, B. P., & Usery, E. L. (2009). Evaluating generalizations of hydrography in differing terrains for The National Map of the United States. In Proceedings, 24 th International Cartographic Congress. Retrieved from

Altena & Stoter
28
http://www.personal.psu.edu/users/c/a/cab38/ScaleMaster/Brewer_etal_ICC2009_paper_Nov2009.pdf
Burghardt, D., Duchêne, C., & Mackaness, W. A. (Eds.). (2014). Abstracting Geographic Information in a Data Rich World Methodologies and Applications of Map Generalisation. Cham: Springer International Publishing. Retrieved from http://nbn-resolving.de/urn:nbn:de:1111-20140228111
Buttenfield, B. P. (2010). Generalization of Hydrographic Features and Automated Metric Assessment Through Bootstrapping.
Buttenfield, B. P., Stanislawski, L. V., Anderson-Tarver, C., & Gleason, M. J. (2013). Automatic Enrichment of Stream Networks with Primary Paths for Use in the United States National Atlas. Retrieved from http://icaci.org/files/documents/ICC_proceedings/ICC2013/_extendedAbstract/238_proceeding.pdf
Chen, J., Hu, Y., Li, Z., Zhao, R., & Meng, L. (2009). Selective omission of road features based on mesh density for automatic map generalization. International Journal of Geographical Information Science, 23(8), 1013–1032. http://doi.org/10.1080/13658810802070730
Edwardes, A., & Mackaness, W. (2000). Intelligent road network simplification in urban areas. Available on Http://www. Geos. Ed. Ac. uk/homes/wam/Edwardes-Mack2000. Pdf. Retrieved from http://www.geos.ed.ac.uk/homes/wam/EdwardesMack2000.pdf
Heinzle, F., Anders, K. H., & Sester, M. (2005). Graph based approaches for recognition of patterns and implicit information in road networks. In Proceedings of 22nd international cartographic conference, A Coruna, Spain. Retrieved from http://icaci.org/files/documents/ICC_proceedings/ICC2005/htm/pdf/oral/TEMA9/Session%204/FRAUKE%20HEINZLE.pdf
Kraak, M. J. (2010). Cartography: visualization of geospatial data (3rd ed). Harlow ; New York: Prentice Hall.
Liu, X., Zhan, F. B., & Ai, T. (2010). Road selection based on Voronoi diagrams and ‘strokes’ in map generalization. International Journal of Applied Earth Observation and Geoinformation, 12, S194–S202. http://doi.org/10.1016/j.jag.2009.10.009
Mackaness, W. A., Ruas, A., & Sarjakoski, L. T. (2007). Generalisation of geographic information cartographic modelling and applications. Amsterdam; Boston: Published on behalf of the International Cartographic Association by Elsevier.
O’Beirne, G. (n.d.). Waimakariri01 gobeirne. Retrieved from http://en.wikipedia.org/wiki/Braided_river#mediaviewer/File:Waimakariri01_gobeirne.jpg
Peng, W. (1997). Automated generalization in GIS. ITC, Enschede, the Netherlands. Revell, P., Regnauld, N., & Thom, S. (2005). Generalising OS Mastermap® Topographic buildings
and itn Road centerlines to 1: 50 000 scale using a spatial hierarchy of agents, triangulation and topology. In Proceedings of the International Cartographic Conference. Retrieved from http://icaci.org/files/documents/ICC_proceedings/ICC2005/htm/pdf/oral/TEMA9/Session%204/PATRICK%20REVELL.pdf
Savino, S. (2014). Generalization of braided streams. Presented at the 17th ICA Workshop on Generalisation and Multiple Representation, Vienna, Austria.
Stanislawski, L. V., Buttenfield, B. P., Bereuter, P., Savino, S., & Brewer, C. A. (2014). Generalisation Operators. In D. Burghardt, C. Duchêne, & W. A. Mackaness (Eds.), Abstracting Geographic Information in a Data Rich World Methodologies and Applications of Map Generalisation (pp. 157–196). Cham: Springer International Publishing.
Stanislawski, L. V., Buttenfield, B. P., & Samaranayake, V. A. (2010). Generalization of Hydrographic Features and Automated Metric Assessment Through Bootstrapping. Presented at the 13th Workshop of the International Cartographic Association commission on Generalisation and Multiple Representation, Zurich, Switzerland,.
Stoter, J. (2010a). Automatische generalisatie van topografische data. GEO-INFO, (2), 18–24.

Altena & Stoter
29
Stoter, J. (2010b). State-of-the-Art of Automated Generalisation in Commercial Software (Official Publication No. 58). EuroSDR.
Stoter, J., Post, M., van Altena, V., Nijhuis, R., & Bruns, B. (2014). Fully automated generalization of a 1:50k map from 1:10k data. Cartography and Geographic Information Science, 41(1), 1–13. http://doi.org/10.1080/15230406.2013.824637
Thomson, R., & Richardson, D. (1999). The ‘good continuation’ principle of perceptual organization applied to the generalization of road networks. ICA/ACI.
Wikimedia. (2012, May 16). Polderlandschap langs de N228 nabij Oudewater. Retrieved 23 March 2016, from https://upload.wikimedia.org/wikipedia/commons/2/27/Polder_Oudewater.JPG
Wong, D. W. S. (2005). Statistical analysis of geographic information with ArcView GIS and ArcGIS (Fully rev. & updated). Hoboken, N.J: John Wiley & Sons, Inc.
![Thinning - [email protected] Home](https://static.fdocuments.in/doc/165x107/613d1c55736caf36b7596fee/thinning-emailprotected-home.jpg)