GI Case Analysis Ecological Networks - IEEP - Institute for
31
TASK 4.1: IN-DEPTH CASE ANALYSIS – GREEN INFRASTRUCTURE IMPLEMENTATION AND EFFICIENCY – ENV.B.2./SER/2010/0059 PROJECT TEAM: IEEP, ECOLOGIC, GHK, SYZYGY, TAU, UNIVERSITY OF ANTWERP, VITO 1 GREEN INFRASTRUCTURE IN-DEPTH CASE ANALYSIS THEME 1: ECOLOGICAL NETWORKS Author: Graham Bennett (Syzygy) [email protected], + 31 24 6844443 Contributing authors: Andrew J. McConville (IEEP), Sonja Gantioler (IEEP) 1 Introduction This case analysis is concerned with Green Infrastructure policy initiatives which have biodiversity conservation as their primary objective and deliver this primarily by establishing a coherent network of core areas and connectivity zones that facilitate dispersal, migration and genetic exchange between local species populations. The network may be further complemented with buffer zones and sustainable-use areas. This model is generally known in English as an “ecological network”, although a range of variants exist in other languages (and in North America and Australia the term “reserve network” is commonly applied). The relevance of ecological networks for Green Infrastructure lies in their focus on strengthening ecological coherence in combination with sustainable forms of land use and the delivery of a wide range of ecosystem services. This is reflected in the elements that are common to all ecological network programmes (Bennett and Mulongoy, 2006): a focus on conserving biodiversity at the landscape, ecosystem or regional scale; an emphasis on maintaining or strengthening ecological coherence, primarily through providing for connectivity; ensuring that critical areas are buffered from the effects of potentially damaging external activities; restoring degraded ecosystems where appropriate; and promoting the sustainable use of natural resources in areas of importance to biodiversity conservation. Ecological networks therefore have the potential to deliver multiple ecosystem services from the same areas, to strengthen ecosystems and their services to people, to offer an integrated instead of a sector-based approach, to link protected and unprotected areas, to encourage strategically planned spatial interventions, and to compensate the impacts of grey infrastructure. In Central and Eastern Europe, several national ecological network programmes were developed from the 1970s that were inspired by the polarised landscape theory of the Russian geographer Boris Rodoman. Examples include the Estonian Network of Ecologically Compensating Areas (now known as the Green Network) and the Territorial System of Ecological Stability in former Czechoslovakia. Based on this theory, the “eco-stabilising” approach proposed that the landscape should be zoned in such a way that intensively used areas are balanced by natural zones that function as a coherent, self-regulating whole. The resulting programmes not only developed the first ecological networks but also integrated biodiversity conservation into broad environmental management plans, approximating what would now be described as national sustainable development strategies. In most other regions, including Western Europe, the ecological network model evolved out of developments in ecological theory, primarily the equilibrium theory of island biogeography and metapopulation theory. The most important insight that followed from these theories was that habitat fragmentation increases the vulnerability of species populations by reducing the area of habitat available to local populations. Interest therefore grew in developing conservation
Transcript of GI Case Analysis Ecological Networks - IEEP - Institute for

TASK 4.1: IN-DEPTH CASE ANALYSIS – GREEN INFRASTRUCTURE IMPLEMENTATION AND EFFICIENCY – ENV.B.2./SER/2010/0059
PROJECT TEAM: IEEP, ECOLOGIC, GHK, SYZYGY, TAU, UNIVERSITY OF ANTWERP, VITO
1
GREEN INFRASTRUCTURE IN-DEPTH CASE ANALYSIS
THEME 1: ECOLOGICAL NETWORKS
Author: Graham Bennett (Syzygy) [email protected], + 31 24 6844443 Contributing authors: Andrew J. McConville (IEEP), Sonja Gantioler (IEEP)
1 Introduction
This case analysis is concerned with Green Infrastructure policy initiatives which have biodiversity conservation as their primary objective and deliver this primarily by establishing a coherent network of core areas and connectivity zones that facilitate dispersal, migration and genetic exchange between local species populations. The network may be further complemented with buffer zones and sustainable-use areas. This model is generally known in English as an “ecological network”, although a range of variants exist in other languages (and in North America and Australia the term “reserve network” is commonly applied).
The relevance of ecological networks for Green Infrastructure lies in their focus on strengthening ecological coherence in combination with sustainable forms of land use and the delivery of a wide range of ecosystem services. This is reflected in the elements that are common to all ecological network programmes (Bennett and Mulongoy, 2006):
a focus on conserving biodiversity at the landscape, ecosystem or regional scale;
an emphasis on maintaining or strengthening ecological coherence, primarily through providing for connectivity;
ensuring that critical areas are buffered from the effects of potentially damaging external activities;
restoring degraded ecosystems where appropriate; and
promoting the sustainable use of natural resources in areas of importance to biodiversity conservation.
Ecological networks therefore have the potential to deliver multiple ecosystem services from the same areas, to strengthen ecosystems and their services to people, to offer an integrated instead of a sector-based approach, to link protected and unprotected areas, to encourage strategically planned spatial interventions, and to compensate the impacts of grey infrastructure.
In Central and Eastern Europe, several national ecological network programmes were developed from the 1970s that were inspired by the polarised landscape theory of the Russian geographer Boris Rodoman. Examples include the Estonian Network of Ecologically Compensating Areas (now known as the Green Network) and the Territorial System of Ecological Stability in former Czechoslovakia. Based on this theory, the “eco-stabilising” approach proposed that the landscape should be zoned in such a way that intensively used areas are balanced by natural zones that function as a coherent, self-regulating whole. The resulting programmes not only developed the first ecological networks but also integrated biodiversity conservation into broad environmental management plans, approximating what would now be described as national sustainable development strategies.
In most other regions, including Western Europe, the ecological network model evolved out of developments in ecological theory, primarily the equilibrium theory of island biogeography and metapopulation theory. The most important insight that followed from these theories was that habitat fragmentation increases the vulnerability of species populations by reducing the area of habitat available to local populations. Interest therefore grew in developing conservation

TASK 4.1: IN-DEPTH CASE ANALYSIS – GREEN INFRASTRUCTURE IMPLEMENTATION AND EFFICIENCY – ENV.B.2./SER/2010/0059
PROJECT TEAM: IEEP, ECOLOGIC, GHK, SYZYGY, TAU, UNIVERSITY OF ANTWERP, VITO
2
approaches that promoted ecological coherence at the landscape scale, and during the 1990s local, regional and national programmes that aimed to integrate protected areas into more extensive linked networks were developed in many countries in Western Europe, North America, Latin America, Australia and Asia.
The lead example selected for this analysis, which was considered among the most representative of the measures that could be reported under this theme, is the National Ecological Network in the Netherlands. This is one of the most ambitious examples of its type and features a complex implementing architecture involving a wide range of national, regional and local government bodies, water authorities, research institutes, NGOs and private parties. Two other examples have also been included in this fiche and, while they pursue similar objectives, they deliver them through varying approaches and processes. The Green Network in Estonia is the oldest ecological network programme in the world, having been initiated in the 1970s. It has inevitably evolved over time as the country’s political framework changed from a Soviet-style plan economy to a West European democracy and EU Member State and its biodiversity conservation policy was transformed with the implementation of Natura 2000. The Ecological Continuum/ECONNECT programme is an initiative launched in 2008 that aims to re-establish an ecological continuum across the Alps and involves cooperation between non-governmental and government partners in the seven Alpine countries.

TASK 4.1: IN-DEPTH CASE ANALYSIS – GREEN INFRASTRUCTURE IMPLEMENTATION AND EFFICIENCY – ENV.B.2./SER/2010/0059
PROJECT TEAM: IEEP, ECOLOGIC, GHK, SYZYGY, TAU, UNIVERSITY OF ANTWERP, VITO
3
2 Overview of Initiatives
2.1. Lead Initiative: National Ecological Network, the Netherlands
Green Infrastructure as such is not an established concept in the Netherlands. In the Dutch context, the National Ecological Network (Ecologische Hoofdstructuur) is the instrument that is most comparable. The primary goal of the programme, that was adopted in 1990, is to provide the long-term basis for ecological sustainability throughout the country (Ministry of Agriculture, Nature Management and Fisheries, 1990). The network aims to strengthen ecological coherence through the establishment of a nationwide system of functionally connected core areas, corridors and buffer zones. The primary focus of the National Ecological Network is therefore biodiversity conservation rather than a broader suite of objectives such as ecosystem services, climate change adaptation and disaster prevention. However, these objectives are being incorporated into implementing projects. Other forms of land use are also possible where these are compatible with the objectives of the network. Given the scale of the initiative, establishing the network is a long-term enterprise with full implementation currently projected for 2018.
2.2. Secondary Initiative I: The Green Network, Estonia
Estonia must be credited as the first country to develop the ecological network concept and to elaborate the model into a comprehensive plan and implementation programme. In Estonia’s vision, the ecological-network concept – now known as the Green Network (Eesti Roheline Võrgustik) –is regarded as a means to integrate land use with landscape functions in a model that can be incorporated into regional and national planning processes. From its inception in the 1970s, therefore, the Estonian ecological network has been developed as a spatial-planning tool for the purpose of balancing and integrating land uses. Today, despite the disruptions caused by the revolutionary changes of the early 1990s, plans for implementing the network into county-level spatial plans throughout the country are now vitually complete. While the lead example is primarily concerned with delivering biodiversity benefits, this initiative explicitly includes multiple benefits. Although no comprehensive cost-benefit analysis has been carried out on the Green Network, it is likely that the cost-benefit ratio relative to the National Ecological Network is more favourable because of the high costs of implementing the Dutch programe.
2.3. Secondary Initiative II: the Ecological Continuum Initiative and ECONNECT, the Alps
The Ecological Continuum Initiative was initiated in 2007 by four active alpine network organisations. The Platform of Ecological Networks was initiated at the same time. The initiative’s main aim is to maintain or restore ecological connectivity between important areas for nature conservation in the Alps. The Ecological Continuum is complemented by the ECONNECT project, a four-year programme for improving ecological connectivity running from 2007 to 2011. In comparison to the other examples, this initiative is more restricted in scope, focusing mainly on improving ecological connectivity through a series of projects. No conclusions can yet be drawn onthe cost-benefit ratio of the initiative since the projects have not yet reached an advanced state of completion.

TASK 4.1: IN-DEPTH CASE ANALYSIS – GREEN INFRASTRUCTURE IMPLEMENTATION AND EFFICIENCY – ENV.B.2./SER/2010/0059
PROJECT TEAM: IEEP, ECOLOGIC, GHK, SYZYGY, TAU, UNIVERSITY OF ANTWERP, VITO
4
3 National Ecological Network, the Netherlands
3.1. General background information (including legal basis and, if applicable, start and end date of the initiative):
The National Ecological Network in the Netherlands was originally prescribed in 1990 in the government’s Nature Policy Plan (Ministry of Agriculture, Nature Management and Fisheries, 1990). This document set out the policy framework within which the ecological network is to be developed and established. It therefore does not lay down statutory obligations; its operational philosophy is to establish a body of national long-term policy measures that persuade all the key parties to commit their policies and resources to the achievement of common objectives. The provisions in the Nature Policy Plan were refined to some extent in subsequent policy documents, particularly with respect to corridors. The key provisions are as follows:
NATURE POLICY PLAN (Ministry of Agriculture, Nature Management and Fisheries, 1990)
“The ecological network comprises several coherent systems of large homogeneous nature reserves that are connected with each other by corridors. Where these nature reserves are too small or do not yet exist, the respective systems can be enhanced through creating the appropriate conditions. This also applies to establishing or enhancing corridors.” (Page 52)
“Areas which harbour existing value and which are of international and national importance and of sufficient area are delineated as core areas within the ecological network.” (Page 79)
“Corridors are areas or structures that make species expansion, migration and exchange between different core areas possible.” (Page 87)
“The planned buffer policy has the goal, by means of structural measures outside the ecological network, of creating sustainable conditions through which the desired natural values within the ecological network can be realised or maintained.” (Page 88)
SPACE WHITE PAPER (Ministerie van Volkshuisvesting, Ruimtelijke Ordening en Milieubeheer, 2006)
“The robust corridor should be a coherent entity that is comprised of ecological and landscape elements that connect natural cores. With regard to the ecological function of robust corridors, the government expects provinces, when delineating and realising the corridors, to take account of the ecological requirements for the exchange of species that are found in the nature reserves that are to be connected. The robust corridors should, where possible, connect with nature in other countries so that an international ecological network can develop.” (Page 16)
The national government adopted a Multi-Annual Defragmentation Programme in 2004 (Ministerie van Verkeer en Waterstaat, 2004). It has the status of a policy programme with the following objective:
“The most important barriers for the National Ecological Network (including the robust connections) are eliminated in 2018 (the planning horizon of the National Ecological Network), to the extent that these are caused by major roads, railways and major waterways.” (Page 17)
Three types of area are being designated in order to create the network of core areas, corridors and buffer zones:
Existing nature reserves;
Areas where other forms of land use prevail but which are subject to appropriate forms of management;

TASK 4.1: IN-DEPTH CASE ANALYSIS – GREEN INFRASTRUCTURE IMPLEMENTATION AND EFFICIENCY – ENV.B.2./SER/2010/0059
PROJECT TEAM: IEEP, ECOLOGIC, GHK, SYZYGY, TAU, UNIVERSITY OF ANTWERP, VITO
5
“Nature-development areas” – that is, areas where the primary land use has to be changed to nature conservation.
The national network as originally configured in 1990 by the government took the form of an indicative map that is “oversized”. It is the task of the 12 provinces to delineate the boundaries of the network. Once the provinces have finalised the configuration of the network and adopted respective spatial plans, municipalities are required to take account of the provincial maps in their own development plans.
The delineation of the network in relation to the national goals for the nature target types is supervised by regional Area Commissions which enjoy a broad representation, including various public bodies, farmers’ organisations, nature conservation NGOs, heritage bodies and village associations. This delineation process is almost completed (although the original expectation was that the configuration would be finalised in 1998). The maps do, however, allow for some flexibility in implementing the ecological network on the ground since this is dependent on how certain policy instruments are applied in practice, particularly with regard to which agricultural plots can be purchased for inclusion in the network and the extent to which landowners agree to conclude management agreements.
The realisation of effectively functioning corridors has proven to pose serious challenges in practice. In the original plan for the National Ecological Network, 267 indicative corridors were proposed (including 43 transboundary corridors). These corridors – the concept (literally, “connecting zones”) was used in a functional sense rather than necessarily inferring a continuous linear connection – were identified on the basis of the contemporary knowledge of the spatial needs of a relatively small number of species, although it was argued that improving connectivity for these species populations would also benefit other species. However, a 1998 evaluation of the effectiveness of the connectivity measures showed that the measures taken were not as effective as intended. The corridor programme was therefore intensified with the aim of realising so-called “robust corridors”.
Implementing the National Ecological Network is secured through an intricate cooperative architecture that involves the national government and a wide range of regional and local organisations, both public and private. Five main components can be distinguished:
The overarching government policy framework on the National Ecological Network;
administrative agreements between the national government and the provinces;
The spatial planning system;
Formal site and species protection legislation (including the provisions to implement Natura 2000);
A range of specific policy instruments in diverse sectors.
The final network will total 728,500 ha – 17 per cent of Dutch territory – plus 6,300,000 ha of freshwater and marine areas. 275,000 ha of the terrestrial total can be regarded as “new nature” that in 1990 was not characterised as predominantly natural. The network includes all designated Natura 2000 sites.
3.2. Specific Objectives
Nature conservation policy in the Netherlands has three strategic goals:

TASK 4.1: IN-DEPTH CASE ANALYSIS – GREEN INFRASTRUCTURE IMPLEMENTATION AND EFFICIENCY – ENV.B.2./SER/2010/0059
PROJECT TEAM: IEEP, ECOLOGIC, GHK, SYZYGY, TAU, UNIVERSITY OF ANTWERP, VITO
6
1. The conservation, restoration, further strengthening and sustainable use of biodiversity.
2. Halting the loss of biodiversity.
3. Ensuring sustainable conditions for all species that were naturally occurring in 1982.
The establishment of the National Ecological Network is the most important means through which these goals are to be achieved, primarily through:
1. Increasing the area of appropriate habitat. The 12 provinces delineate the boundaries of the National Ecological Network using 132 “nature objective types” (subsequently reduced to 92 and clustered into 32 “nature objectives”) for which minimum aggregate total areas have been fixed at national level. The nature objective types are target ecosystems with a specified degree of naturalness and quality and fall into three main categories (Bal et al., 2001):
“Large-scale”, which are predominantly natural ecosystems, such as riparian systems;
“Special”, which are smaller-scale, semi-natural systems;
“Multifunctional”, where the land use contributes significantly to an area’s biodiversity value.
The nature objective types are coupled with particular types of management which primarily focus on supporting certain natural processes and realising the respective objectives in as natural a way as possible. In circumstances where this is not feasible – for example on privately owned agricultural land where management agreements are used to enhance its biodiversity value – a nature objective type is applied which relies on management actions that enhance the semi-natural value of the particular parcel of land.
2. Reducing fragmentation. In the original plan for the National Ecological Network, the main priority with regard to reducing fragmentation was to restore the opportunities for dispersal and migration. 267 indicative corridors were proposed for this purpose (including 43 transboundary corridors). An important consequence of this approach was that the many small-scale defragmentation measures required, such as tunnels for amphibians and fish ladders, could be realised without acquiring land. However, a 1998 evaluation concluded that the measures taken were not as effective in achieving their objectives as intended. The corridor programme was therefore intensified with the aim of realising 12 so-called “robust corridors” which are substantially larger in scale and have a higher level of protection. The robust corridors are less species-specific than in the original concept and are mainly intended to connect comparable habitats or to traverse environmental gradients in areas of high priority for increased connectivity. They would also require a substantial land acquisition programme. The revised target was to designate a total of 27,000 ha of robust corridors by 2008 (including aquatic linkages). However, many of these corridors have still not been designated, mostly because it is proving more difficult than expected to apply the necessary measures to agricultural land. The government that took office in 2010 has announced that it intends to end its financial support for realising the robust corridors (see 3.7).

TASK 4.1: IN-DEPTH CASE ANALYSIS – GREEN INFRASTRUCTURE IMPLEMENTATION AND EFFICIENCY – ENV.B.2./SER/2010/0059
PROJECT TEAM: IEEP, ECOLOGIC, GHK, SYZYGY, TAU, UNIVERSITY OF ANTWERP, VITO
7
3.3. Green Infrastructure Elements
Under the National Ecological Network the following GI elements are planned:
Protected areas: comprise large homogenous reserves. Areas of existing value that constitute national or international importance and are of sufficient size are recognised as core areas;
Restoration zones: where the reserves are too small or do not exist, they are to be enhanced through creating “appropriate conditions”;
Natural connectivity features: the reserves are connected by corridors
Artificial connectivity features: those features designed specifically to assist species in overcoming artificial barriers such as roads and dams;
Sustainable use/ecosystem service areas: where land use type contributes significantly to an area’s biodiversity value.
3.4. Implementation Costs
The most recent official estimate of the total costs involved in realising the National Ecological Network from 1990 to 2018 calculated the contribution by the Ministry of Agriculture, Nature and Food Quality (now the responsibility of the Ministry of Economic Affairs, Agriculture and Innovation) at €8.9 billion and by the Ministry of Transport, Public Works and Water Management (now the responsibility of the Ministry of Infrastructure and the Environment) at €3.5 billion (Tweede Kamer, 2006). The contribution by the Ministry of Housing, Spatial Planning and the Environment (now the responsibility of the Ministry of Infrastructure and the Environment), which includes costly measures such as reducing acid deposition, was not specified.
In addition to these estimates, various studies have been published on the financial and economic costs of the National Ecological Network. However, most of these studies do not cover the entire period 1990–2018. They also use different assumptions and methodologies and do not always include the same set of measures, particularly with respect to indirect costs such as reducing nitrogen deposition to secure the appropriate environmental conditions. The sources included in the following table are the most relevant for this review.
The methodology used by Koeijer et al. (2008) takes 2004 as the reference year and calculates all costs that will be necessary to ensure that the required spatial, environmental and management conditions are met, including land purchase. This method leads to relatively high costs for reducing nitrogen deposition and managing groundwater tables. Jongeneel et al. (2008) use a standard cost-benefit analysis for their calculations, although they also include transaction costs.

TASK 4.1: IN-DEPTH CASE ANALYSIS – GREEN INFRASTRUCTURE IMPLEMENTATION AND EFFICIENCY – ENV.B.2./SER/2010/0059
PROJECT TEAM: IEEP, ECOLOGIC, GHK, SYZYGY, TAU, UNIVERSITY OF ANTWERP, VITO
8
Table 3.4.1. Overview costs (total & per Green Infrastructure element) / Costs associated with the implementation of the initiative.
To
tal
(Lo
cal
Cu
rren
cy)
Co
re a
reas
Res
tora
tio
n
area
s
Su
stai
nab
le
use
/ ec
osy
stem
se
rvic
e zo
nes
G
reen
u
rban
an
d
per
i-u
rban
ar
eas
Nat
ura
l co
nn
ecti
vit
y A
rtif
icia
l
con
nec
tivi
ty
feat
ure
s
Comments
Total Cost €13.288 billion
€410 million
Comments on total cost estimate: – The estimate is for the period 2005–2018 based on 2006 figures. – The estimate includes all measures necessary to achieve objectives, including indirect
costs to ensure that necessary environmental conditions are created. In practice expenditure will be substantially less. The shortfall could be as high as €2.2 billion (land purchase, adaptation and management) plus €3.2 billion (improving environmental conditions), not including any further cuts to be finalised by the current government (Werkgroep IBO Natuur, 2010). The specific cost estimates are as follows: – land purchase and adaptation: €3.941 billion – management: €1.435 billion – water management: €0.93 billion – measures to reduce or manage the impacts of nitrogen deposition: €6.982 billion
– The estimate does not include freshwater and marine areas. – Further costs in the period 2019–2027 estimated at €4.115 billion. – Source: Koeijer et al. (2008). Comment on artificial connectivity features: – The figure is the budget of the national Multi-Annual Defragmentation Plan for the
period 2005–2018 that currently includes 208 projects. It does not include costs of additional provincial and municipal expenditures.
Time covered by total cost (Years)
14
Annualised costs €949 million
– Based on total cost estimate from Koeijer et al. (2008) – see comments above.
Area covered [ha] 727,270 – The total terrestrial area used in the analysis by Koeijer et al. is slightly less than the official objective of 728,500 ha.
Cost per hectare €1,300 / year

TASK 4.1: IN-DEPTH CASE ANALYSIS – GREEN INFRASTRUCTURE IMPLEMENTATION AND EFFICIENCY – ENV.B.2./SER/2010/0059
PROJECT TEAM: IEEP, ECOLOGIC, GHK, SYZYGY, TAU, UNIVERSITY OF ANTWERP, VITO
9
Financial Costs (List any details eg, Establishing management bodies)
See following table
Opportunity costs (uncompensated) (List any details eg Foregone resource use)
See following table

TASK 4.1: IN-DEPTH CASE ANALYSIS – GREEN INFRASTRUCTURE IMPLEMENTATION AND EFFICIENCY – ENV.B.2./SER/2010/0059
PROJECT TEAM: IEEP, ECOLOGIC, GHK, SYZYGY, TAU, UNIVERSITY OF ANTWERP, VITO
10
Table 3.4.2. Detailed costs.
FINANCIAL COSTS
Cost Comments
One-Off Costs
Administrative, management and information costs
Establishing management bodies
Surveys
Research
Consultation
Management plans
Land purchase: – government organisations – site management organisations – private organisations
€1,774/ha €1,774/ha €170/ha
Source: Jongeneel et al. (2008)
Restoring GI: – government organisations – site management organisations – private organisations
€318/ha €318/ha €318/ha
Source: Jongeneel et al. (2008)
Costs of green infrastructure provision
Land purchase €3.941 billion
Total expenditure for the period 2005–2018, including restoration (Koeijer, 2008).
One-off compensation payments
Creation of green infrastructure elements
Restoration of green infrastructure See land purchase
Ongoing Costs
Administrative, management and information costs
Running of administrative bodies
Monitoring
Ongoing management planning
Communications
Managing sites:– government organisations – site management organisations – private organisations – management agreements
€76/ha/year €12/ha/year €27/ha/year €70/ha/year
Source: Jongeneel et al. (2008)
Costs of green infrastructure provision
Maintenance of green infrastructure €1.435 billion
Total expenditure for the period 2005–2018 (Koeijer, 2008).
Costs of management agreements
Costs of protective actions

TASK 4.1: IN-DEPTH CASE ANALYSIS – GREEN INFRASTRUCTURE IMPLEMENTATION AND EFFICIENCY – ENV.B.2./SER/2010/0059
PROJECT TEAM: IEEP, ECOLOGIC, GHK, SYZYGY, TAU, UNIVERSITY OF ANTWERP, VITO
11
OPPORTUNITY COSTS (uncompensated)
Cost Comments
Foregone development opportunities
Value of potential development foregone
Foregone resource use
Loss of mineral extraction
Loss of water abstraction
Foregone output from land management
Foregone agricultural output
Foregone forestry output
Foregone socio-economic opportunities
Loss of regeneration opportunities
Loss of community uses of land
Reductions in land values
Price of land
Total net economic cost €3.978 billion
Estimate by Jongeneel et al. (2008), assuming the original targets are achieved. Jongeneel uses a substantially lower estimate of the total financial costs than De Koeijer (€5.589 billion).
3.5. Observed and/or Projected Impacts
Biodiversity Benefits
When the National Ecological Network was developed, the government did not adopt any performance indicators or introduce a monitoring system. Although several indicators have been developed since then, the main problem is that no baseline was established against which progress in achieving the objectives can be accurately measured. In its assessment of the network, the National Audit Office identified three indicators for measuring progress: nature objectives, environmental quality and target species (Algemene Rekenkamer, 2006):
Nature objectives: Over half of the subsidised sites (which comprise about half of the total area of the network) are subject to a type of management that matches the designated nature target.
Environmental quality: When the national map of nature objective areas was drawn up, no assessment was made of the prevailing environmental conditions in the respective areas or the extent to which these needed to be improved to ensure that the objectives could be achieved and how much this would cost. The four key environmental problems are low water tables, surface water quality, nitrogen deposition and acidification. – Water tables: National policy requires 25% of the total area suffering from a low water
table (400,000 ha) to be restored by 2000 and 40% by 2010 (against a 1985 baseline). However, by 2005 only 4% had been completely restored (IPO and RIZA, 2005). Moreover, a more recent assessment concluded that the total area suffering from low water tables in relation to the designated nature objective was only 45% of the original estimate (Milieu- en Natuurplanbureau, 2005).

TASK 4.1: IN-DEPTH CASE ANALYSIS – GREEN INFRASTRUCTURE IMPLEMENTATION AND EFFICIENCY – ENV.B.2./SER/2010/0059
PROJECT TEAM: IEEP, ECOLOGIC, GHK, SYZYGY, TAU, UNIVERSITY OF ANTWERP, VITO
12
– Surface water quality: Similarly, no specific water quality objectives have been set for the areas included in the ecological network. Generally, the objectives laid down in the EU Water Framework Directive apply.
– Nitrogen deposition and acidification: In the 23 years up to 2003 acid deposition declined by 51%. In the 9 years up to 2003, nitrogen deposition declined by 27%. Despite these reductions, nitrogen deposition in two-thirds of the ecological network was too high to achieve the nature objective, as was acid deposition in many areas.
Target species: One means of determining the extent to which the respective nature objective quality of the ecological network has been achieved is to monitor the prevalence of the flora and fauna species that are associated with each nature objective type. However, no monitoring system was established for this purpose when the National Ecological Network was launched. In a later assessment of 17 rare nature objective types, in only one type had all the target species increased.
However, the main result indicator that is used to assess the effectiveness of the National Ecological Network is the degree of sustainable spatial conditions that exist for the target species. This is derived from the number of “key patches” that are realised, where a key patch is defined as a patch with a carrying capacity large enough to sustain a key population and close enough to other patches to receive, on average, one immigrant per generation (Verboom et al., 2001) (cf. SEBI Indicator 13, Fragmentation of natural and semi-natural areas). Between 1990 and 2008 this area has increased steadily, but the increase in animal species for which sufficient spatial conditions have been established is only 2%. An important contributory factor for this modest increase is the negative impact of climate change (Ozinga et al., 2007; Planbureau voor de Leefomgeving, 2010). Moreover, the populations of animal species that require large areas of habitat have declined. In the longer term, when the National Ecological Network is completed, it is estimated that sufficient spatial conditions will be established for about two-thirds of the target species (Reijnen et al., 2005; Planbureau voor de Leefomgeving, 2010). See Figure 3.5.1.
Figure 3.5.1. The degree of sufficient sustainable spatial conditions in relation to the total area of the National Ecological Network (Planbureau voor de Leefomgeving, 2010).

TASK 4.1: IN-DEPTH CASE ANALYSIS – GREEN INFRASTRUCTURE IMPLEMENTATION AND EFFICIENCY – ENV.B.2./SER/2010/0059
PROJECT TEAM: IEEP, ECOLOGIC, GHK, SYZYGY, TAU, UNIVERSITY OF ANTWERP, VITO
13
To put these data into a broader perspective, the general long-term decline in species populations in the Netherlands has been halted, although significantly Red List species are continuing to decline. See Figure 3.5.2.
Figure 3.5.2. Size of species populations in the Netherlands, 1997–2008 (Planbureau voor de Leefomgeving, 2010a).
It is interesting to note that in areas where nature is the primary land use (which includes much of the National Ecological Network), the average number of target species in each area is increasing whereas for agricultural land it is still decreasing (Planbureau voor de Leefomgeving, 2010b; Knegt et al., 2010). However, on average the average quality of terrestrial ecosystems has declined since 1994, as have on average the populations of their characteristic species (although this trend cannot be directly related to the National Ecological Network since it was only partially implemented during the study period, many areas are not yet under appropriate forms of management and the necessary environmental conditions have not yet been secured) (Reijnen et al., 2010; Planbureau voor de Leefomgeving, 2010b).
The National Ecological Network does, however, play an important role in achieving the national species conservation objectives, including those for Natura 2000 species. A study by Bouwma et al. (2009) concluded that, in order to achieve the national targets, the conservation of 30% of the Natura 2000 species that depend on Special Protection Areas (Birds Directive) and Special Areas of Conservation (Habitats Directive) will require additional measures outside these areas (and inside the National Ecological Network) and that a further 24% will depend on measures taken solely in the National Ecological Network. With regard to the species under Annex IV of the Habitats Directive, the National Ecological Network will be an important instrument in achieving the national conservation targets for 25% of these species. Further, the National Ecological Network will contribute to achieving the necessary spatial conditions for 11% of the Natura 2000 species analysed in the study. An earlier study concluded that the National Ecological Network will be important for securing the necessary spatial conditions for 15% of all Natura species (Veen et al., 2007).

TASK 4.1: IN-DEPTH CASE ANALYSIS – GREEN INFRASTRUCTURE IMPLEMENTATION AND EFFICIENCY – ENV.B.2./SER/2010/0059
PROJECT TEAM: IEEP, ECOLOGIC, GHK, SYZYGY, TAU, UNIVERSITY OF ANTWERP, VITO
14
Ecosystem Service and Socio-Economic Benefits
No analyses have quantified the socio-economic benefits of the National Ecological Network. However, two studies have discussed the methodological issues of deriving the socio-economic costs and benefits of Dutch nature conservation policy (Koeijer, 2007; Jongeneel and Leneman, 2009). Further, a study has estimated the broader benefits delivered by the total area of Natura 2000 sites in the Netherlands (Kuik et al., 2006). This analysis reviewed 74 studies on the monetary valuation of habitats in the Netherlands and extrapolated the findings to seven groups of Natura 2000 sites (the North Sea; the Wadden Sea and the river deltas; rivers; lakes and marshes; dunes; bogs and high-lying sandy areas; and stream valleys and hilly areas). The findings of each study were further analysed with respect to the value of five natural resources (raw materials; recreation and tourism; amenity value; regulatory functions;and intrinsic value). Kuik et al. concluded that the total gross benefits of Natura 2000 sites amounted to over €4,000/ha/year and extrapolated the gross welfare benefits of all Natura 2000 sites in the Netherlands (1.1 million ha), to around €4.5 billion/year.
Table 3.5.1: Overview of biodiversity and socio-economic benefits.
Biodiversity Benefits
Species Habitats Genetic Diversity
2% increase in animal species for which sufficient spatial conditions have been established (1990–2008) (Planbureau voor de Leefomgeving, 2010).
In general, slight continuing decline in quality (1994–2007) (Reijnen et al., 2010).
No data available
Ecosystem Service/Socio-Economic Benefits
Provisioning Raw materials: €317/ha/year average.
Regulating €4,532/ha/year average (combined with supporting services).
Cultural Intrinsic value of nature: €1,873/ha/year average.
Supporting €4,532/ha/year average (combined with regulating services)
Wider socio-economic benefits (e.g. fuelling economic activity, job creation, health benefits)
Recreation and tourism: €4,481/ha/year average. Personal economic value of nature: €980/ha/year average.
Source: Kuik et al. (2006)
TASK 4.1: IN-DEPTH CASE ANALYSIS – GREEN INFRASTRUCTURE IMPLEMENTATION AND EFFICIENCY – ENV.B.2./SER/2010/0059
PROJECT TEAM: IEEP, ECOLOGIC, GHK, SYZYGY, TAU, UNIVERSITY OF ANTWERP, VITO
15
3.6. Observed and/or Projected Economic Impacts
The original 1990 plan for the National Ecological Network did not include an economic assessment, although it did estimate some quantitative impacts, such as a reduction in the area of agricultural land by a total of 150,000 ha. Jongeneel et al. (2005) analysed the financial and economic costs and benefits of the National Ecological Network for the government (excluding non-market benefits) using three scenarios, each using a different estimate of the area of land that will be purchased by the government compared to the extent to which management agreements will be used to achieve the nature conservation objectives. Assuming that the existing policy was implemented, the total net discounted economic costs of the National Ecological Network were calculated at €3.798 billion, equivalent to €795/ha/year. Kuik et al. (2006) estimated the benefits provided by Natura 2000 in the Netherlands to be around €4,000/ha/year, calculated as an average of €/ha/year benefits from different key Natura 2000 ecosystems (see 3.5 above). Recreation and tourism as well as wider ecosystem functions were important components of this value, as well as non-use benefits. The provisioning service of raw materials was of lesser importance in the Netherlands. The authors extrapolated the gross welfare benefits of all Natura 2000 areas in the Netherlands (1.1 million ha), deriving an estimate of around €4.5 billion/year.
3.7. Recent Developments and Outlook
The new government that took office in 2010 announced that year that, while it will continue with the realisation of the National Ecological Network, it will reassess the existing implementation measures. In September 2011 it was announced that the government had reached agreement with the provinces on several crucial changes to the previous plans (IPO, 2011). The total area of the National Ecological Network will be reduced from 728,500 to approximately 600,000 ha. The new configuration of the network wll be finalised by the provinces in 2012. The deadline for completing the network will be delayed by three years to 2021. Further, from 2014 the financial costs of realising the network will lie completely with the provinces. In return for ending its current substantial funding, the national government will increase its annual funding to the provinces for the management of network by €100 million.
With regard to the robust corridors, the agreement confirms the government’s earlier intention to end national funding for the corridors. It is therefore for each province to decide whether it wishes to continue with the development of the respective robust corridors on its territory and to fund their realisation. In one case, Flevoland Province has already announced that it will continue to realise the OostvaardersWold robust corridor, although it will be reduced in size.
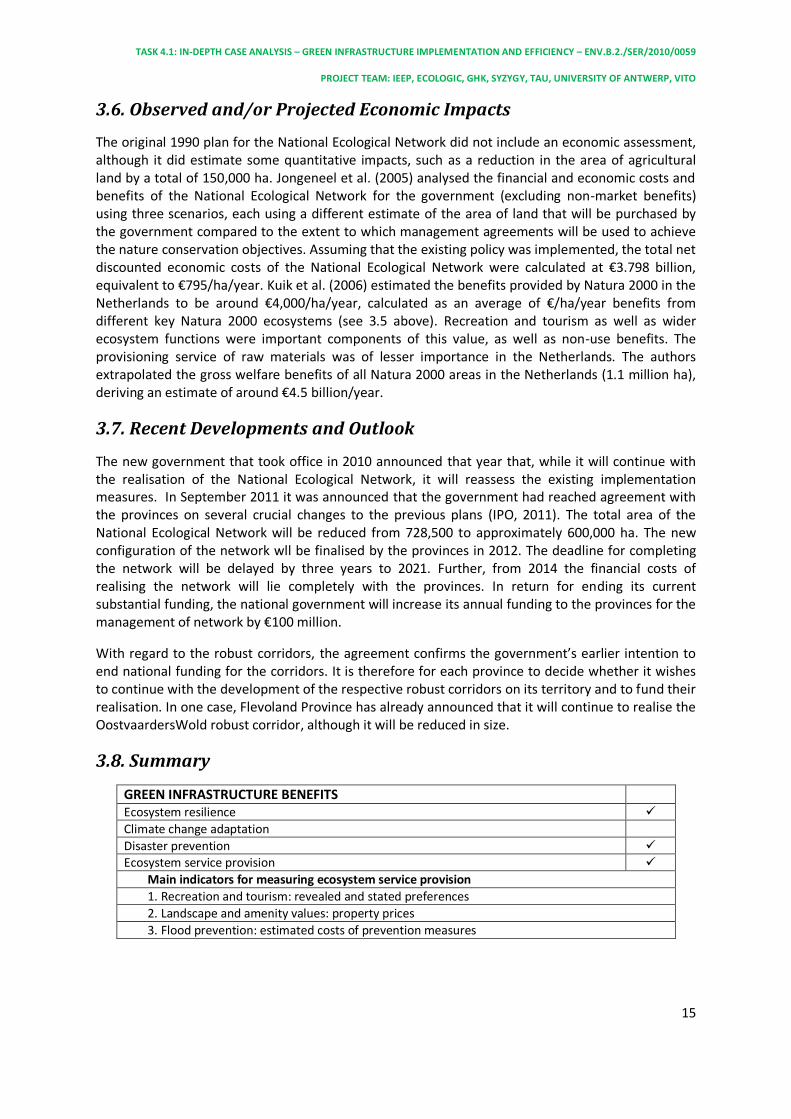
3.8. Summary
GREEN INFRASTRUCTURE BENEFITS Ecosystem resilience
Climate change adaptation
Disaster prevention Ecosystem service provision
Main indicators for measuring ecosystem service provision
1. Recreation and tourism: revealed and stated preferences
2. Landscape and amenity values: property prices
3. Flood prevention: estimated costs of prevention measures

TASK 4.1: IN-DEPTH CASE ANALYSIS – GREEN INFRASTRUCTURE IMPLEMENTATION AND EFFICIENCY – ENV.B.2./SER/2010/0059
PROJECT TEAM: IEEP, ECOLOGIC, GHK, SYZYGY, TAU, UNIVERSITY OF ANTWERP, VITO
16
3.9. Contact Details
Ministry of Economic Affairs, Agriculture and Innovation Mr Erik van Zadelhoff PO Box 20401 2500 EK The Hague The Netherlands +31 70 3786868 [email protected]
TASK 4.1: IN-DEPTH CASE ANALYSIS – GREEN INFRASTRUCTURE IMPLEMENTATION AND EFFICIENCY – ENV.B.2./SER/2010/0059
PROJECT TEAM: IEEP, ECOLOGIC, GHK, SYZYGY, TAU, UNIVERSITY OF ANTWERP, VITO
17
4 Comparable Initiatives
1. Policy Initiative
The Estonian Green Network (Eesti Roheline Võrgustik).
2. General Background Information
Since the 1970s the country has taken a multi-functional approach to ecological networks. In the early 1990s, the network initiative was taken up by experts on planning and in 1995 legislation was passed on ecological networks through the Building and Planning Act. The national long-term spatial plan, ‘Estonia 2010’, established basic principles of the Estonian ecological network by identifying corridors and 12 core areas of international importance. The first indicative map was produced in 1983 and in 1999, the second phase of county planning (thematic planning) was initiated. It aims to define environmental conditions for the development of land use and settlement. The main tasks of this phase included the design of the Green Network that would guarantee its natural, environmental and socio-economic uses for the area. (IEEP and Alterra, 2010).
The Estonian approach to ecological networks - the ‘network of ecologically compensating areas’ – has been noted in several studies as being among the pioneering national concepts in Europe. A new term– ‘the green network’ – has only recently entered into use in Estonia. The concept of ecological networks in Estonia is principally embedded in the spatial planning system and implemented through other sectors such as nature conservation, forestry, water management and others. At county level, the green network is an essential theme of county planning.
The Act on Planning, which is the main instrument for ecological network planning implementation in Estonia, legislates the planning of the green network and sets minimum requirements for participation processes, but the role of the wider public within the actual preparation of plans remains quite limited. The vision contains a chapter on ‘green networks’ and a schematic map of the Estonian green network (see Figure 1). The vision determines the ‘green network’ total coverage at around 55% of the whole Estonian territory, in 12 comparatively compact core areas. This area is large enough to fulfil the compensatory function not only on the national, but also on the European scale.
The hierarchy of the spatial planning system is mainly organized around basic administrative units of Estonia (country – national plan > counties – county plans > municipalities – comprehensive plans). The green network is, to various degrees, addressed at all three levels of planning. The national longterm spatial plan ‘Estonia 2010’ delineates basic principles of the Estonian ecological network (Estonian Ministry of Environment, 2001) by establishing corridors and core areas of national and international importance (Kulvik, 2008).
By December 2002, each of the 15 counties of Estonia was obliged to prepare a map of ecological networks on a scale of 1: 50 000, as one of the layers of thematic spatial planning. For this reason, three methodologies were elaborated: one for designing ‘green networks’, a second for defining valuable cultural landscapes, and a third to combine the two above-mentioned themes (Sepp, 2002; Kulvik et al., 2003: 17-18). However, the preparation of these plans for all 15 counties was not completed until 2008.

TASK 4.1: IN-DEPTH CASE ANALYSIS – GREEN INFRASTRUCTURE IMPLEMENTATION AND EFFICIENCY – ENV.B.2./SER/2010/0059
PROJECT TEAM: IEEP, ECOLOGIC, GHK, SYZYGY, TAU, UNIVERSITY OF ANTWERP, VITO
18
3. Specific Objectives
The main aims are:
to complete functionally the network of protected areas, connecting them into a complete system with natural areas;
to protect valuable natural habitats and preserve the migration routes of wild animals, and valuable landscapes;
to promote nature conservation outside protected areas.
Additional multifunctional aims are:
to shape the spatial structure of natural areas in the most reasonable way considering the ecological, environmental protection, economical and social aspects;
to soften, compensate, and forestall the anthropogenic impact on nature, to contribute to sustainable development strategy;
to offer the possibility of nature-friendly management, living styles and recreation by ensuring spatial accessibility to natural areas;
to minimise future conflicts of interest incorporating different sectors (forestry, agriculture, transport, recreation) through spatial planning;
to guide settlement and land use;
to preserve the natural self-regulation ability of the environment;
to support international and transboundary co-operation. (IEEP and Alterra, 2010, Annex 4)
4. Green Infrastructure Elements
Protected areas;
Natural connectivity features;
Sustainable use areas;
Green urban areas.
Protected areas (described as ‘Core Areas’1) and corridors are the main GI elements to which the Green Network is designed around. For each there are four levels (see table 4.1). Protected areas that are independent and have been determined by law are regarded as the core areas in the ecological network (Remm et al., 2004). Depending on their location and utilisation rate, arable land and the rural areas on the outskirts of town, as well as parks, garden suburbs and residential areas in towns may be partly included in the network. In addition the long-term strategy Estonia 2010 envisions the ecological network to include seashores to a depth of 6 m.
1 Check with Estonian experts to what degree Core Areas under the Green Network overlap with Protected Areas.

TASK 4.1: IN-DEPTH CASE ANALYSIS – GREEN INFRASTRUCTURE IMPLEMENTATION AND EFFICIENCY – ENV.B.2./SER/2010/0059
PROJECT TEAM: IEEP, ECOLOGIC, GHK, SYZYGY, TAU, UNIVERSITY OF ANTWERP, VITO
19
Table 4.1. Hierarchical levels and planning for the ecological network in Estonia
Districts, small group of countries, group system of settlements;
County or big group of parishes;
Small group of parishes or large town;
Parish, town, a part of a large town or big group of villages.
5. Implementation Costs
Estonian experts were unable to provide cost data.
6. Observed and/or Projected Impacts
The use of spatial planning to designate the Green Network has worked well through a process of public hearings, stakeholder engagement and the use of SEA (IEEP and Alterra, 2010). However, monitoring of biodiversity benefits have not been carried out, or in any case, not linked to the management/designation of areas under the Green Network. It is thought however, that specific measures to improve meta-populations have not been successful, although the country as a whole tends not to suffer from connectivity problems given its low population density (IEEP and Alterra, 2010, although no quantified data on the effect on meta-populations are available).

TASK 4.1: IN-DEPTH CASE ANALYSIS – GREEN INFRASTRUCTURE IMPLEMENTATION AND EFFICIENCY – ENV.B.2./SER/2010/0059
PROJECT TEAM: IEEP, ECOLOGIC, GHK, SYZYGY, TAU, UNIVERSITY OF ANTWERP, VITO
20
7. Observed and/or Projected Economic Impacts
Estonian experts were unable to provide relevant information.
8. Recent Developments and Outlook
Future plans include continuing to designate green network at municipal level and to harmonize different existing environmental spatial measures (IEEP and Alterra, 2010). National schemes like the agri-environment schemes don’t take into account the ecological network planning aspects so the two run in parallel when in fact they would be much more effective if they were somehow brought together.
The multi-functional approach involving different sectors (forestry, agriculture, transport, recreation) and interest groups (including local inhabitants) through the spatial planning was advantageous. However, according to some analysts the methodology was over complicated and sophisticated (relying on GIS) as at the time the methodology was developed, multiple layers did not exist (abandoned land etc.) (K. Sepp, in IEEP and Alterra, 2010, Annex 4.2 p153). The implementation between areas was very variable and many of the implementation measures were weak. Estonian legislation on spatial planning includes mechanisms for public involvement in Green Network planning. More specifically, at regional level the public should be involved in the final phases of the planning process. Public involvement includes a written consultation period in relation to draft planning documents for the Green Network, followed by a public discussion. The results indicated that the planning legislation, especially at municipal level, should be improved in order to enable the concept of the Green Network to be implemented more effectively. There is a need for practical advice on implementation and for involving stakeholders, supported by direct, open and flexible communication. (Taken from the transcript of a talk given by K. Sepp 2/7/2009, available in Annex 4.2 of IEEP and Alterra (2010)).
One of the goals of the Estonian Green Network was to spatially incorporate the Natura 2000 sites as areas of European importance. Results demonstrated that in 10 of the 15 counties, this goal can be considered to have been achieved, as a minimum of 95% of the Natura 2000 sites within these counties have been incorporated into the Green Network. In three of the other counties about 90% have been incorporated, but in Võru and Valga counties, this percentage is much lower. In Võru, 75% of the Natura 2000 sites have been incorporated into the Green Network and in Valga only 60%. It has therefore been suggested that a revision of the Green Network thematic plans should be considered in these counties in order to ensure that all Natura 2000 sites are include in the network (Raet et al, 2010).
9. Summary
GREEN INFRASTRUCTURE BENEFITS Ecosystem resilience Climate change adaptation
Disaster prevention
Ecosystem service provision Main indicators for measuring ecosystem service provision
1. Degree of recreational use
2. Physical resources supplied

TASK 4.1: IN-DEPTH CASE ANALYSIS – GREEN INFRASTRUCTURE IMPLEMENTATION AND EFFICIENCY – ENV.B.2./SER/2010/0059
PROJECT TEAM: IEEP, ECOLOGIC, GHK, SYZYGY, TAU, UNIVERSITY OF ANTWERP, VITO
21
10. Contact Details
The Environmental Ministry of the Environment is the responsible authority for the Green Network. Mart Kylvik, who is a professor at the Institute of Agricultural and Environmental Sciences, Estonian University of Life Sciences in Estonia is an expert on the Green Network and can be contacted here: [email protected].

TASK 4.1: IN-DEPTH CASE ANALYSIS – GREEN INFRASTRUCTURE IMPLEMENTATION AND EFFICIENCY – ENV.B.2./SER/2010/0059
PROJECT TEAM: IEEP, ECOLOGIC, GHK, SYZYGY, TAU, UNIVERSITY OF ANTWERP, VITO
22
1. Policy Initiative
The Ecological Continuum Initiative and the ECONNECT project.
2. General Background Information
Several closely linked initiatives are working together in implementing an ecological network for the Alpine region, based on the requirements on ecological networks of the protocol on the conservation of nature and the countryside of the Alpine Convention (Article 12). This Includes the Platform of Ecological Networks, which is mainly responsible for policy work and pilot areas patronage, established by the Alpine Convention. It includes representatives of the Alpine countries, those working on protected areas, Alpine institutions and experts, and aims to create a link between policy makers, the scientific community and practitioners, as such supporting the other two initiatives.
The Ecological Continuum Initiative was initiated in 2007 by four active alpine network organisations (WWF Alpine Space Programme, the International Commission for the Protection of the Alps – CIPRA, the International Scientific Committee for Alpine Research – ISCAR, and the Alpine Network of Protected Areas – ALPARC), with an open end. The Platform of Ecological Networks was initiated at the same time. The project’s main aim is to maintain or restore ecological connectivity between important areas for nature conservation in the Alps. The initiative is financed by the Swiss MAVA Foundation for Nature. Its work is mainly focused on initiating, promoting and mentoring activities, providing know-how and awareness building. On know-how, it evaluated approaches for designing and implementing ecological networks in the Alps (e.g., the Swiss National Network REN) and developed a catalogue of possible measures to improve ecological connectivity in the Alps. The latter refers to activities such as, for example, zoning measures, protected area enlargement, creation of ecological corridors and sustainable use agreements with farmers, foresters, hunters or tourism operators.
The initiatives are supported by the ECONNECT project, a three-year project for improving ecological connectivity in the Alps supported by the ETC Alpine Space Programme and co-funded by ERDF. It started in 2008 and will end in November 2011, with its results feeding into the Continuum initiative. The over-arching objective of the ECONNECT project is the protection of biodiversity using an integrated and cross-sectoral approach guaranteeing an ecological continuum for the Alpine region.
3. Specific Objectives
To achieve an ecological continuum across the Alps, the ECONNECT project iterates that it will not focus on purely “naturalistic aspects” only, but also on economic and social dimensions as considered equal important in promoting ecological networks. It aims at harmonising geographical data, analysing existing physical and legal barriers with a common terminology and methodology, and subsequently defining migration corridors on Alpine level, in order to achieve a comprehensive ecologic network. In order to test terminology and methodology, it will apply concepts and measures to seven pilot regions of high biodiversity value, including the transboundary area Berchtesgaden – Salzburg, the French department Isère, the Northern limestone Alps region, the Rhaethian Triangel (Engadin/Southtyrol/Trentino/Tyrol), the Hohen Tauern region, the Southwestern Alps – Mercantour/Alpi Marittime and the Monte Rosa region.

TASK 4.1: IN-DEPTH CASE ANALYSIS – GREEN INFRASTRUCTURE IMPLEMENTATION AND EFFICIENCY – ENV.B.2./SER/2010/0059
PROJECT TEAM: IEEP, ECOLOGIC, GHK, SYZYGY, TAU, UNIVERSITY OF ANTWERP, VITO
23
4. Green Infrastructure Elements
The concept developed by the Ecological Continuum Initiative and ECONNECT refers to the maintenance of connectivity within the landscape as an important factor for biodiversity conservation and to enabling the adequate provision of ecosystem services in the face of increasing human-developed and disturbed landscapes. The objective is to preserve the high potential of connectivity for the future on all landscape levels (precautionary principle):
permeable landscape with a high diversity of different biotopes of high quality as well as undisturbed large patches
suitability for the movement (migration/dispersal) of a wide range of different species
the potential to reflect functional relations within the landscape (between and within ecosystems).
This requires an active adaptive and integrated management and governance of ecosystems applied to the entire territory (landscape matrix) and across all sectors.
Very different spaces and structures within the landscape can make up the components of ecological networks, but only if they are designed in an ecologically compatible and functional manner and are managed appropriately, according to the project’s definition. Besides protected areas as core zones, the project will address linking elements such as sustainably used land in order to achieve the connectivity of alpine ecosystems. ECONNECT focuses on the implementation of measures in pilot areas in order to then extrapolate the results by way of guidelines and best practice dissemination. It is foreseen to provide an Alpine wide overview on areas relevant for ecological connectivity by referring to quantity and quality of selected habitats (core areas) and the level of interconnectivity between them (corridors); and to identify barriers and potential risk areas. The results of the different working packages of the project are currently tested in the pilot areas and the final results can be expected for September 2011.
5. Implementation Costs
The different working packages of the ECONNECT project seem not to include any analysis on the potential costs arising on the implementation of the different components for the different pilot areas.
6. Observed and/or Projected Impacts
The initiative is only at its pilot stage, but at least for the areas exemplary analysed it will likely come up with results on the potential physical and ecological impacts, as part of the detailed analysis, prior to extrapolating to other areas. in the idea is develop a likely successful concept based on scientific evidence.
7. Observed and/or Projected Economic Impacts
The different working packages of the ECONNECT project seem not to include any analysis of the potential socio-economic benefits arising on the implementation of the different components for the different pilot areas.
TASK 4.1: IN-DEPTH CASE ANALYSIS – GREEN INFRASTRUCTURE IMPLEMENTATION AND EFFICIENCY – ENV.B.2./SER/2010/0059
PROJECT TEAM: IEEP, ECOLOGIC, GHK, SYZYGY, TAU, UNIVERSITY OF ANTWERP, VITO
24
8. Recent Developments and Outlook
See Introduction.
9. Summary
GREEN INFRASTRUCTURE BENEFITS Ecosystem resilience Climate change adaptation
Disaster prevention
Ecosystem service provision
Main indicators for measuring ecosystem service provision:
No indicators applied
10. Contact details of person/authority(ies) in charge with the implementation of this initiative:
Yann Kohler Platform coordinator Task Force Protected Areas Permanent Secretariat of the Alpine Convention 256, rue de la république 73000 Chambéry France +33 4 79 26 55 07 [email protected]

TASK 4.1: IN-DEPTH CASE ANALYSIS – GREEN INFRASTRUCTURE IMPLEMENTATION AND EFFICIENCY – ENV.B.2./SER/2010/0059
PROJECT TEAM: IEEP, ECOLOGIC, GHK, SYZYGY, TAU, UNIVERSITY OF ANTWERP, VITO
25
5 Conclusions
5.1 Overview of the Initiatives
Of the three ecological networks studied in this case analysis, the Dutch and Estonian examples are broadly comparable in that they are comprehensive national programmes that form the primary framework for the countries’ respective nature conservation policies and established targets which will take decades to achieve. The Ecological Continuum/ECONNECT programme, by contrast, is a shorter-term initiative that essentially comprises a series of pilot projects.
In addition to these programmes, however, a large number of ecological networks are being developed across Europe and which are also generating valuable experience. The most obvious feature of these programmes is the variety of approaches that have been adopted. Many are government-driven: Estonia, the Netherlands, Germany, France, Lithuania, Czech Republic, Slovakia, Italy, the Carpathians, Cheshire (UK), Latvia, Flanders, Hungary, Finland, Lisbon and the Spanish regions. But some have been initiated by NGOs or research institutes: the Danish Nature Network, the Sava River (Slovenia), the Scottish Forest Habitat Network, the Bialowieza Forest (Poland/Belarus) and the European Green Belt. The scales of the initiatives also vary substantially, from a single biotope through a regional or national administrative unit or ecosystem to large-scale multilateral programmes.
It is not surprising that the national government-driven programmes which currently are actively being implemented – Estonia, the Netherlands, Germany and France – feature a complex implementing architecture that brings together a large number of public authorities at all levels and a range of non-governmental and private stakeholders. They also rely on a wide variety of implementing instruments, including legislation, regulations, spatial planning, financial instruments, land purchase and awareness-raising. However, the suite of instruments varies significantly from country to country. Estonia relies primarily on the spatial planning system; the Netherlands applies a wide range of instruments but with only a minimum of legislation; Germany (with its federal structure) and France (where the regions play an important role) both focus in their framework requirements on legislation and planning. This is in contrast to the non-governmental initiatives which, by necessity, give high priority to stakeholder processes and awareness-raising.
Few comprehensive data on the costs of developing and implementing ecological networks are available. The most interesting figures are from the Netherlands, where analyses indicate a total cost of establishing and managing the network over a period of 29 years in the order of €20,000/ha. This figure includes a substantial land purchase component (about 25%) and measures to create the necessary environmental conditions, such as measures to reduce or manage the impacts of nitrogen deposition and controlling groundwater tables (probably around 50% combined). Clearly, this level of expenditure requires a serious political commitment to such an initiative and also broader support by other stakeholders (although it should be noted that a substantial proportion of these costs will have to be made anyway in order to achieve the Natura 2000 objectives). A preliminary analysis suggests that the total ecosystem service and socio-economic benefits of the Natura 2000 sites (which are included in the network) amount to over €12,000/ha/year.
It is interesting to note that, compared to European practice, US government initiatives also feature a variety of implementing instruments but tend to avoid legislative prescriptions of the projected green infrastructure architecture. Maryland’s green infrastructure programme, for example, has identified a statewide ecological network that is being realised primarily through land acquisition and conservation easements (voluntary contracts with landowners that restrict the development of land and offer tax advantages). State funding is secured through issuing general obligation bonds

TASK 4.1: IN-DEPTH CASE ANALYSIS – GREEN INFRASTRUCTURE IMPLEMENTATION AND EFFICIENCY – ENV.B.2./SER/2010/0059
PROJECT TEAM: IEEP, ECOLOGIC, GHK, SYZYGY, TAU, UNIVERSITY OF ANTWERP, VITO
26
(that are guaranteed through levying property taxes), which for the first five years of the programme generated $145 million to fund land acquisition and easements. Land acquisition itself rose from 472 ha in 2003 to 5,143 ha in 2009 (The Conservation Fund, 2004).
5.2 Achievements and Successful Measures
The three ecological networks included in this case analysis and the several other examples in the country files (and other programmes not covered in detail in this analysis) show in the first place that extensive linked systems of core areas have succeeded in attracting broad support in many countries and are also implementable. It is notable that some of these initiatives – the Dutch National Ecological Network and the Estonian Green Network, for example – were planned as long-term programmes with an implementing horizon that extended decades into the future. The concept of developing and implementing an ambitious programme that aims to strengthen ecological coherence in combination with other functions has therefore been tried and tested in practice. The experience with the programmes has also generated many valuable lessons that can be taken into account when comparable initiatives are being considered. Foremost among these are practical experience with ecological network design and management, stakeholder cooperation and connectivity programmes. Although by the nature of the programmes their benefits will for the most part only become apparent in the long term, the fact that the “green infrastructure” on the ground is being steadily realised is an important achievement in itself given the management complexities and high costs involved.
5.3 Weaknesses of the Initiatives
The complex processes that are inherent in the national programmes have faced many challenges. These include lengthy planning procedures, deferred targets, increasing costs and vulnerability to changing political circumstances. Nature conservation policy in Estonia, for example, was confronted with the political transition of 1991 and the obligation to implement Natura 2000 on accession to the EU, which forced a shift in national priorities. In the Netherlands, the government elected in 2010, under pressure to make substantial cuts in public expenditure, has devolved responsibility for completing the National Ecological Network to the provinces, deferred the deadline by three years, reduced the total size of the network and considerably reduced its funding, with the likely result that many of the main corridors will not be established.
Assessing the biodiversity results of the ecological network programmes is complicated by a number of issues. In the first place, results on the ground in terms of improving the long-term viability of species populations will only be apparent many years after the programmes have been implemented, and this will take at least another decade since none of the larger examples has yet been fully implemented. However, the most serious difficulty in confirming such an improvement is that none of the initiatives has established a reliable biodiversity baseline against which progress can be measured. Neither were comprehensive monitoring programmes for key indicators instituted when the programmes were launched. The assessments that have been carried out in the Netherlands following the launch of the programme indicate that the network has more or less halted the long-term decline in species populations and led to a higher average number of species in each core area (although Red List species continue to decline). It should, however, be noted that the effect of the network on biodiversity has been tempered by the impact of climate change.
5.4 Potential to Contribute to Green Infrastructure
It is clear that ecological networks are not only contributing to strengthening ecosystem conservation but also delivering a range of services beyond biodiversity conservation. Prominent

TASK 4.1: IN-DEPTH CASE ANALYSIS – GREEN INFRASTRUCTURE IMPLEMENTATION AND EFFICIENCY – ENV.B.2./SER/2010/0059
PROJECT TEAM: IEEP, ECOLOGIC, GHK, SYZYGY, TAU, UNIVERSITY OF ANTWERP, VITO
27
among these are greater recreational opportunities (and higher income from tourism), higher landscape and amenity values (reflected, for example, in higher property prices) and innovative forms of integrated water management (including flood prevention schemes). Interestingly, this is being achieved in combination with the extension of biodiversity conservation beyond the boundaries of traditional protected areas.
5.5 Lessons for a Potential EU GI Strategy
The many ecological network programmes in Europe offer valuable lessons for a potential EU Green Infrastructure strategy. They show that broad support exists for programmes that aim to maintain and improve the conditions that are necessary for the long-term conservation of biodiversity through strengthening ecological coherence in combination with the delivery of ecosystem services. They also demonstrate that the key to delivering these multiple services lies in a strategic, integrated approach to the spatial management at the regional level. Indeed, because ecological networks share many common elements with Green Infrastructure and are under development in most Member States, they offer a firm foundation on which an EU Green Infrastructure strategy can be built. Moreover, the factors that determine the success and failure of such programmes are now clear, specifically with reference to process architecture, implementing instruments, delivering phased and demonstrable results over a long period, the global costs and benefits of ecological networks and the role of public and private stakeholders.

TASK 4.1: IN-DEPTH CASE ANALYSIS – GREEN INFRASTRUCTURE IMPLEMENTATION AND EFFICIENCY – ENV.B.2./SER/2010/0059
PROJECT TEAM: IEEP, ECOLOGIC, GHK, SYZYGY, TAU, UNIVERSITY OF ANTWERP, VITO
28
6 References
National Ecological Network, the Netherlands
Bal, D, et al. (2001) Handboek natuurdoeltypen, Expertisecentrum Ministerie van Landbouw, Natuur en Voedselkwaliteit, Wageningen.
Bennett, G and Mulongoy, K J (2006) Review of Experience with Ecological Networks, Corridors and Buffer Zones. CBD Technical Series no. 23, Secretariat of the Convention on Biological Diversity, Montreal, http://www.cbd.int/doc/publications/cbd-ts-23.pdf.
Bouwma, I, et al. (2009) Realisatie landelijke doelen Vogel- en Habitatrichtlijn. Een onderzoek naar de noodzaak voor aanvullende beleidsmaatregelen ter realisatievan de landelijke doelen van de Vogel- en Habitatrichtlijn. Alterra, Wageningen, http://edepot.wur.nl/10134.
Commissie voor de Milieueffectrapportage (2010) Factsheet nr. 4: Natuur algemeen, Commissie voor de Milieueffectrapportage, Utrecht, http://docs1.eia.nl/mer/diversen/factsheet_04_natuur_algemeen_webversie.pdf.
IEEP and Alterra (2010) Reflecting Environmental Land Use Needs into EU Policy: preserving and enhancing the environmental benefits of land service: soil sealing, biodiversity corridors, intensification/marginalisation of land use and permanent grassland. Final report to the European Commission, DG Environment on Contract ENV.B.1/ETU/2008/0030, Institute for European Environmental Policy, London.
IPO (2011) Onderhandelingsakkoord decentralisatie natuur. IPO, The Hague, http://www.ipo.nl/sites/default/files/onderhandelingsakkoord_decentralisatie_natuur_26-09-2011.pdf.
IPO and RIZA (2005) Concept – Landelijke inventarisatie van verdroogde gebieden en projecten verdrogingsbestrijding, versie 29 juli 2005, Interprovinciaal Overleg en RIZA, The Hague.
Jongeneel, R, et al. (2005) De doorwerking van natuurprojecten op de economie: financiële en economische analyse van kosten en baten, Wageningen Universiteit, Wageningen, http://www.lei.dlo.nl/wever/docs/Nieuws/doorwerkingseffecten_natuurprojecten.pdf.
Jongeneel, R J, Polman, N, and Leneman, H (2008) Cost Benefit Analysis of the Dutch Nature Conservation Policy: Direct, indirect effects and and transaction costs of the Ecological Main Structure in the Netherlands, paper presented to the 12th Congress of the European Association of Agricultural Economists, Ghent, http://edepot.wur.nl/41638.
Jongeneel, R J, and Leneman, H (eds.) (2009) Economische en sociale gevolgen van milieu- en natuurwetgeving: Ontwikkeling evaluatiekader en checklist, Wageningen University and Research Centre, Wageningen, http://edepot.wur.nl/11773.
Knegt, B de, et al. (2010) Natuurkwaliteit van het agrarisch gebied. WOt werkdocument 221. Wageningen, Wettelijke Onderzoekstaken Natuur & Milieu, http://edepot.wur.nl/167983.
Koeijer, T J de (ed.) (2007) Van aankoop naar beheer II Ex ante evaluatie omslag natuurbeleid, Milieu- en Natuurplanbureau, Bilthoven, http://www.rivm.nl/bibliotheek/rapporten/500402006.pdf.

TASK 4.1: IN-DEPTH CASE ANALYSIS – GREEN INFRASTRUCTURE IMPLEMENTATION AND EFFICIENCY – ENV.B.2./SER/2010/0059
PROJECT TEAM: IEEP, ECOLOGIC, GHK, SYZYGY, TAU, UNIVERSITY OF ANTWERP, VITO
29
Koeijer, T J de, et al. (2008) Kosteneffectiviteit van de terrestrische Ecologische Hoofdstructuur: Een eerste verkenning van mogelijke toepassingen, Wageningen University and Research Centre, Wageningen, http://edepot.wur.nl/45661.
Kuik, O, Brander, L, and Schaafsma, M (2006) Globale batenraming van Natura 2000 gebieden, Instituut voor Milieuvraagstukken, Amsterdam, http://www.grazingnetworks.nl/userImages/Image/batenraming%20N2000.pdf.
Milieu- en Natuurplanbureau (2005) Optimalisatie Ecologische Hoofdstructuur, Milieu- en Natuurplanbureau, Bilthoven, http://www.rivm.nl/bibliotheek/rapporten/408768003.pdf.
Ministerie van Landbouw, Natuur en Voedselkwaliteit (2007) Meerjarenprogramma vitaal platteland 2007–2013, Ministerie van Landbouw, Natuur en Voedselkwaliteit, The Hague, http://www.rijksoverheid.nl/bestanden/documenten-en-publicaties/notas/2006/02/01/agenda-voor-een-vitaal-platteland-meerjarenprogramma-vitaal-platteland-2007-2013/w160.pdf.
Ministerie van Verkeer en Waterstaat (2004) Meerjarenprogramma ontsnippering, Ministerie van Verkeer en Waterstaat, The Hague, http://www.mjpo.nl/downloads/MJPO_2004.pdf.
Ministerie van Volkshuisvesting, Ruimtelijke Ordening en Milieubeheer (2006) Nota ruimte, Ministerie van Volkshuisvesting, Ruimtelijke Ordening en Milieubeheer, The Hague, http://www2.vrom.nl/notaruimte/download/download/NotaRuimteCompleet.pdf.
Ministry of Agriculture, Nature Management and Fisheries (1990) Nature Policy Plan of the Netherlands, Ministry of Agriculture, Nature Management and Fisheries, The Hague.
Ozinga, W A, Bakkenes, M, and Schaminée, J H J (2007) Sensitivity of Dutch Vascular Plants to Climate Change and Habitat Fragmentation: a preliminary assessment based on plant traits in relation to past trends and future projections. Wageningen University and Research Centre, Wageningen, http://www.wur.nl/NR/rdonlyres/DD7204EB-F2FD-43F9-87E9-E66E20CF7DC5/51019/WOtrapport_49.pdf.
Planbureau voor de Leefomgeving (2010a) Balans van de leefomgeving 2010, Planbureau van de Leefomgeving, The hague/Bilthoven, http://www.rivm.nl/bibliotheek/rapporten/500206001.pdf.
Planbureau voor de Leefomgeving (2010b) Evaluatie biodiversiteitsdoelstelling 2010. Achtergrongdocument bij de balans van de leefomgeving 2010. Planbureau voor de Leefomgeving, The Hague/Bilthoven, http://www.rivm.nl/bibliotheek/rapporten/500402019.pdf.
Reijnen, M J S M, Kuipers, H, and Pouwels, R (2005) Optimalisatie Samenhang Ecologische Hoofdstructuur: Ruimtelijke Condities voor Duurzaam Behoud Biodiversiteit Diersoorten. Alterra, Wageningen, http://library.wur.nl/way/bestanden/clc/1844185.pdf.
Reijnen, M J S M, et al. (2010) Natuurwaarde 2.0 land. Graadmeter natuurkwaliteit landecosystemen voor nationale beleidsdoelen. Wageningen University and Research Centre, Wageningen, http://content.alterra.wur.nl/Webdocs/WOT/Rapporten/WOTrapport_110.pdf.
Tweede Kamer (2006) Ecologische hoofdstructuur, vergaderjaar 2006–2007, 30 825, nrs. 1–2, http://cdn.ikregeer.nl/pdf/kst-30825-2.pdf.
Veen, M van, et al. (2007) Milieuonstandigheden en ruimtelijke samenhang in Natura 2000-gebieden. Milieu en Natuur Planbureau, Bilthoven, http://www.rivm.nl/bibliotheek/rapporten/408763005.pdf.

TASK 4.1: IN-DEPTH CASE ANALYSIS – GREEN INFRASTRUCTURE IMPLEMENTATION AND EFFICIENCY – ENV.B.2./SER/2010/0059
PROJECT TEAM: IEEP, ECOLOGIC, GHK, SYZYGY, TAU, UNIVERSITY OF ANTWERP, VITO
30
Werkgroep IBO Natuur (2010) Eindrapportage van de Werkgroep IBO Natuur: Interdepartementaal beleidsonderzoek 2008–2009 nr. 2, Werkgroep IBO Natuur, The Hague, http://www.rijksoverheid.nl/bestanden/documenten-en-publicaties/rapporten/2010/03/02/eindrapportage-van-de-werkgroep-ibo-natuur/2010302-nlp-2010-1120-bijlage.pdf.
Estonian Green Network
Külvik, M (2008) Current status of the practical implementation of ecological networks in Estonia. ECNC, Tilburg, http://www.ecologicalnetworks.eu/html/visitors/publications.php.
Remm, K, et al. (2004) Design of the Pan-European Ecological Network: A national level attempt. Jongman,R.H.G., Pungetti,G. (Eds.). Ecological Networks and Greenways. Concept, Design, Implementation (151‒170), Cambridge University Press, Cambridge.
IEEP and Alterra (2010) Reflecting Environmental Land Use Needs into EU Policy: preserving and enhancing the environmental benefits of land service: soil sealing, biodiversity corridors, intensification / marginalisation of land use and permanent grassland. Final report to the European Commission, DG Environment on Contract ENV.B.1/ETU/2008/0030, Institute for European Environmental Policy, London, http://www.ieep.eu/topics/biodiversity/sustainable-land-use/2010/01/reflecting-environmental-land-use-needs-into-eu-policy-preserving-and-enhancing-the-environmental--905.
Raet, J, et al. (2010) Distribution of the Green Network of Estonia. – Forestry Studies/Metsanduslikud Uurimused 53, 66–74. ISSN 1406-9954. http://mivana.emu.ee/orb.aw/class=file/action=preview/id=516302/FSMU53_art6_66-74.pdf.
Ecological Continuum Initiative
European Commission (2010) Green Infrastructure Implementation: Proceedings of the European Commission Conference, 19 November 2010, Brussels (and related presentations), http://ec.europa.eu/environment/nature/ecosystems/index_en.htm.
Scheurer, T, Bose, L, and Künzle, I (2008) Evaluation of Approaches for Designing and Implementing Ecological Networks in the Alps. Assessment Report. Continuum Project, http://www.alpine-ecological-network.org/information-services/publications/4035.
Kohler, Y, and Heinrichs, A K (2009) Catalogue of Possible Measures to Improve Ecological Connectivity in the Alps. Continuum Project, http://www.kora.ch/malme/05_library/5_1_publications/K/Kohler_&_Heinrichs_2009_Massnahmen_zur_Verbesserung_der_oekol_Vernetzung_im_Alpenraum.pdf.
Heinrichs, A K, Kohler, Y, and Ullrich, A (2010) Implementing a Pan-Alpine Ecological Network – a Compilation of Major Approaches, Tools and Activities. BfN-Skripten 273. Bundesamt für Naturschutz, Bonn, http://www.alpine-ecological-network.org/information-services/publications/4447.
ECONNECT. Restoring the Web of Life, http://www.econnectproject.eu/cms/?q=homepage/en.
The Alpine Ecological Network, http://www.alpine-ecological-network.org/information-services/measure-catalogue.
Maryland Green Infrastructure

TASK 4.1: IN-DEPTH CASE ANALYSIS – GREEN INFRASTRUCTURE IMPLEMENTATION AND EFFICIENCY – ENV.B.2./SER/2010/0059
PROJECT TEAM: IEEP, ECOLOGIC, GHK, SYZYGY, TAU, UNIVERSITY OF ANTWERP, VITO
31
The Conservation Fund (2004) Maryland’s Green Infrastructure Assessment and GreenPrint Program, Chapel Hill, NC: The Conservation Fund, http://www.greeninfrastructure.net/sites/greeninfrastructure.net/files/1-mdgreeninfrastructurecasestudy.pdf. See also http://www.greenprint.maryland.gov/.