GHG Footprint Reduction Through Carbon Integration (and...
70
GHG Footprint Reduction Through Carbon Integration (and some more information) Patrick Linke Professor and Chemical Engineering Program Chair Doha, 16 February 2015
-
Upload
truongnhan -
Category
Documents
-
view
215 -
download
0
Transcript of GHG Footprint Reduction Through Carbon Integration (and...

GHG Footprint Reduction Through Carbon Integration
(and some more information)
Patrick LinkeProfessor and Chemical Engineering Program Chair
Doha, 16 February 2015

GLOBAL CHANGE:ENERGY & ENVIRONMENT IN HARMONY ?
• Climate:Drastically cut global GHG emissions or else face “Dangerous Climate Change”
• Water:1.8 billion people will suffer scarcity by 2025
• Food:Mounting pressures on food security
• Local & regional environments:Unsustainable footprints in emerging markets (e.g. contamination of air, water & land in Far East, air quality in GCC, …)
Energy Environment
Sources: EIA, UN, IPCC

OPPOSING TRENDS
Environment in Decline
Water Scarcity
Soil Exhaustion
Climate Change
…
Increasing Demands
Growing Population
Growing Income
Increasing Materials & Energy Intensity
In future we will need to achieve much more with much less !

90%of all food consumed in
Qatar is imported
7 daysof potable water reserve
No. 1In per capita GHG
emissions
100%Dependency on seawater
desalination for potable water
supply
Local Challenges – Qatar

TEES Qatar Sustainable Water &
Energy Utilization Initiative (QWE)
Directors:
Patrick Linke, Ahmed Abdel-Wahab

Current Research Activities
• Advanced water and wastewater treatment processes
– Advanced reduction processes
– Advanced oxidation processes
– Electrochemical and photo-electrochemical treatment processes
• Environmental impact assessment and management
– Marine discharges
– Air quality
– Regulatory revisions and recommendations of new standards
• Desalination Process Innovation
– Zero liquid discharge systems (ZLD)
– Hybrid desalination systems
– Desalination pretreatment
• Utilizing solar energy for carbon dioxide reduction and water treatment
– Photo-electrochemical processes for CO2 conversion to useful fuels
– Photo-electrochemical water and wastewater treatment processes

Current Research Activities (cont.)
• Heat to Power Technologies
- Organic Rankine Cycles
• Industrial Energy Systems
- Energy integration in industrial cities
- Renewable energy / systems integration
• Integrated water resources management
- Macroscopic water systems design and optimization
• Water-Energy Nexus and Eco-Industrial Parks
- Integrated water-Energy Systems
- Industrial ecologies around wastes and by-products, CO2 integration

EXAMPLES OF ONGOING RESEARCHResearch & outreach

Design Approaches for Sustainable Industrial Systems
Systematic minimization of footprints
Network synthesis, multi-period
planning, simultaneous
nexus integration

Now moving across nexus and widening scope for carbon dioxide management.
Design Approaches for Sustainable Industrial Systems

Innovating Organic Rankine Cycles
ORC
BiomassSolar Waste heat Geothermal
Computer-Aided Molecular Design
+ High-
performance Cycle Design & Optimization
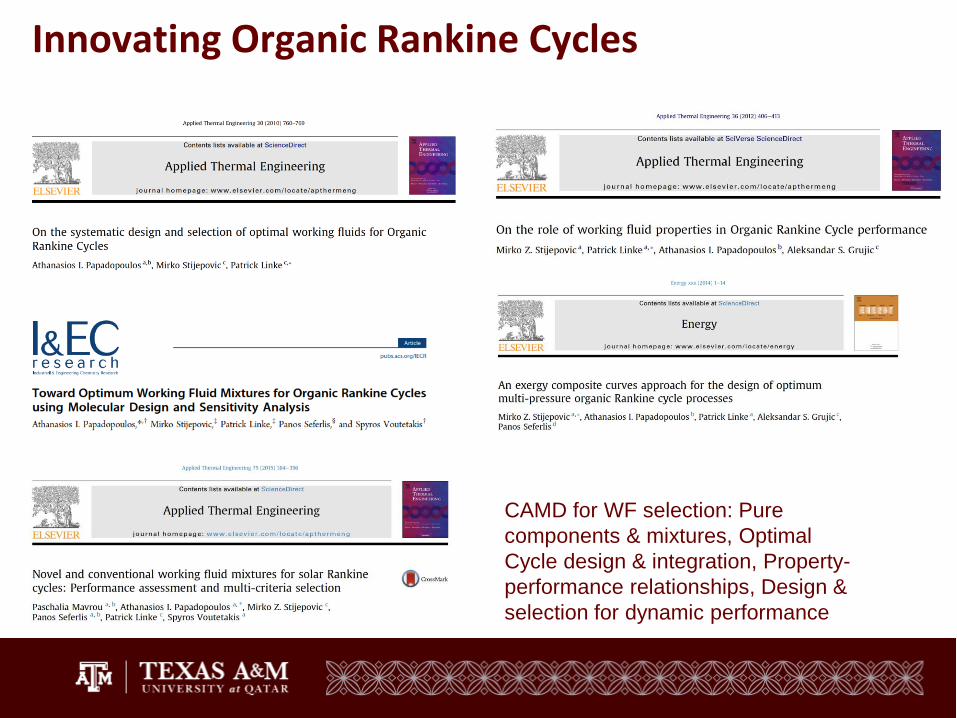
Innovating Organic Rankine Cycles
CAMD for WF selection: Pure
components & mixtures, Optimal
Cycle design & integration, Property-
performance relationships, Design &
selection for dynamic performance

Approaches to Process Design and Optimization
Optimization frameworks and tools for the systematic innovation of processes
NETWORK RECYCLE
VENT GASES
STYRENE
ETHYLBENZENE
BENZENE
TOLUENE
STEAM
ETHYLBENZENE
Het. catalytic conversions
Desalination processes

GHG FOOTPRINT REDUCTION THROUGH CARBON INTEGRATION
Grad students: Dhabia Al-Mohannadi, Sumit Binshu, Sabla Alnouri

“Unequivocal” Increase – IPCC, 2014
“Wake-Up Call” – John Kerry, US Secretary of State, 2014

Tuvalu
2009
Bangladesh
2009
Pakistan
2010

60%Global target for emission reduction by 2050
required to keep below 2°C increase- Presidential Climate Action Project

80%Industrial countries target for emission reduction
by 2050 required to keep below 2°C increase- Presidential Climate Action Project

What possibilities exist to reduce
industrial carbon footprints ?

Common approaches to industrial
carbon footprint reduction
Energy Efficiency
Alternative Energy
Carbon Capture and Sequestration
Reduction of CO2 produced as a result of fuel use
Reduction of amount of fuel through enhanced energy efficiency
Fuel switching
Renewables
Capture of produced CO2
Can be geological/biological
Involves removal of CO2 using a capture unit, delivery and injection into sites

NATURAL GAS & EFFICIENCY – IMPORTANT KEYS TO AN INTERMEDIATE LOW CARBON FUTURE
IEA: Avoiding dangerous Climate Change through abatement of energy-related CO2 over business as usual scenarios
Example: 450ppm scenario by 2050
(IEA, Energy Technology Perspectives, 2008)
“Efficiency &
fuel switching”
“Alternative energy” –only one
part of the answer.
“End-of-pipe”
Global problems vs. local impacts
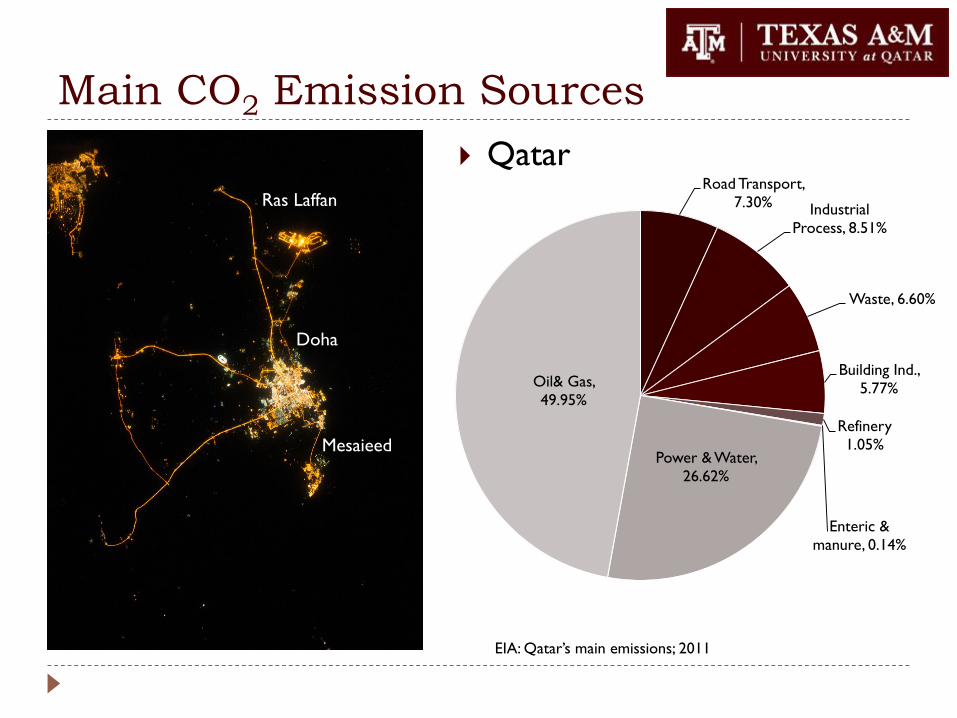
Main CO2 Emission Sources
Qatar
EIA: Qatar’s main emissions; 2011
Road Transport,
7.30% Industrial
Process, 8.51%
Waste, 6.60%
Building Ind.,
5.77%
Refinery
1.05%
Enteric &
manure, 0.14%
Power & Water,
26.62%
Oil& Gas,
49.95%
Ras Laffan
Doha
Mesaieed

Popular CO2 Reduction Methods
Energy Efficiency and Conservation
Alternative Energy
Carbon Capture and Sequestration
• Tarsheed National Program
• Most processing plants e.g.
• LNG facilities
• Most recent GTL
technologies
• Qatar Solar Technologies
• QSTP- Algal Biofuels
• Qatar 2022 carbon neutral
stadium
• Green Gulf Solar Test Facility
• Kahramaa; 220 MW solar plant
• QP-QSTP Imperial College of
London
• QAFAC Methanol CO2
Recovery plant
Qatar

CCS• Biofixation
• Enhanced Oil/Gas Recovery
• Storage in Saline Aquifers
EnergyFossil fuels
Renewable Energy
• Solar
• Wind
• Biofuels
Processes• Improve energy efficiency
• Substitute processes and technology
Capture via Re-use
ProductsWhich products?
Which processes?
Existing or new?
Capacity of fixation?
How will it fit in the
layout?
Is it better than CCS?
Utilization&
Symbiosis ?CO2
Industrial City
Industrial City Emissions Reduction Options

Previous Work – PSE Approaches
Linhoff 1978
Smith and Delaby, 1991
Klemes et al, 1997
Tan and Foo, 2007
Pekala et al, 2010
Al-Mayyahi, 2013
Ooi et al, 2013
Turk et al, 1987
Middleton et al, 2009
Tan et al, 2012
He et al. 2013
Hasan et al, 2014
Alhajaj et al, 2014
• Footprint through energy integration &
fuel switching
• Integration of renewable energy sources
• Carbon capture and storage
Energy Integration for CO2 Reduction
Carbon Capture and Sequestration
Allocation

How to allocate produced carbon
dioxide for efficient footprint reduction ?
Carbon Integration

• Multiple Sources
Different emission
points e.g.
– Process vents
– Natural gas
reformers
– Gas turbines
– Steam boilers
• Possible Sinks
– Existing
– Newly added
(to store or convert
CO2)
• Processing
– Capture
– Treatment
• Spatial constraints
– Source & Sink
locations
– Transportation
corridors

Which existing sinks to choose,
Which new sinks to add,
Which captured CO2 to feed to each sink,
Which sources to capture,
Which sources to purify,
Which sources to mix ,
… to achieve the lowest cost carbon dioxide footprint reduction ?
Source
compression
Pumping
Sink

Step1
Data acquisition for industrial zone
Step2
Identification of carbon
sinks
Step 3
Treatment, transmission and cost data
Step 4:
Identification
and design of
cost effective
carbon
integration
network
Approach
Data Collection Optimization
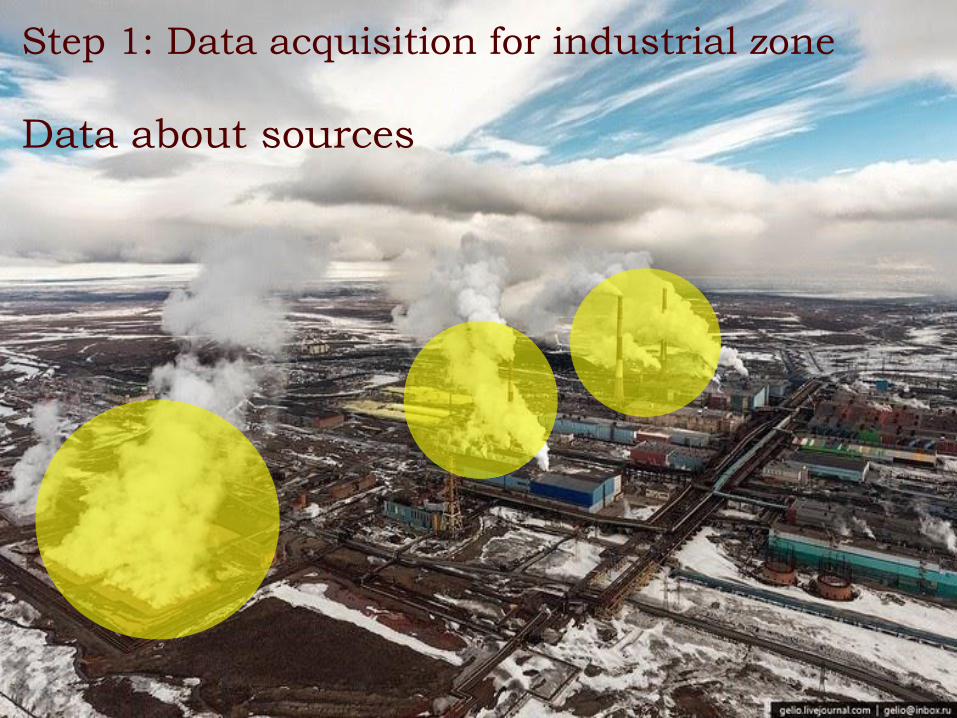
Step 1: Data acquisition for industrial zone
Data about sources

Step 1: Data acquisition for
industrial zone
CO2 Source Information
Spatial information (corridors)
Plant Source CO2 Flow Composition
of CO2
Pressure of
stream
released
Temperature
of stream
Location

Step 2: Identification of carbon
sinks
CO2
Enhanced Oil/Gas
Recovery
Urea
Salicylic Acid
Methanol
Food Production
Supercritical Solvent
Dry IceSaline
Aquifers
Mineral Carbonation
Greenhouses
Polymer production
Algae
Tree planting
Possible selection criteria
• Maturity
• Level of fixation
• Potential revenue
• Compatibility with
existing system
• Geological availability
Usual suspects +
New emerging options

CO2 Sink Information
Plant CO2 Flow
Capacity
Compositi
on of CO2
Required
Feed
Pressure
Cost of
CO2 in
sink
Efficiency
factor of
sink
Location
Step 2: Identification of carbon sinks

Step 3: Treatment, transmission and cost data
Carbon separations
Efficiency of carbon removal
Cost of capture
Transmission
Relative distances
Pipeline costs
Compression and pumping costs

Step 4:Identification
and design of cost
effective carbon
integration network

Problem Statement
Given
An industrial city with a number of plants
A number of emission streams (sources) of known flow rate, composition, temperature, pressure
A number of existing/potential processes (sinks) that can receive emissions with known CO2 capacity, purity requirements, temperature, pressure
One (or more) carbon separation technology with known performance
Distances between all sources and all sinks
Determine
The cost-optimal network
the connects sources and
sinks within the industrial
city for a given carbon
footprint reduction

Representation

Representation
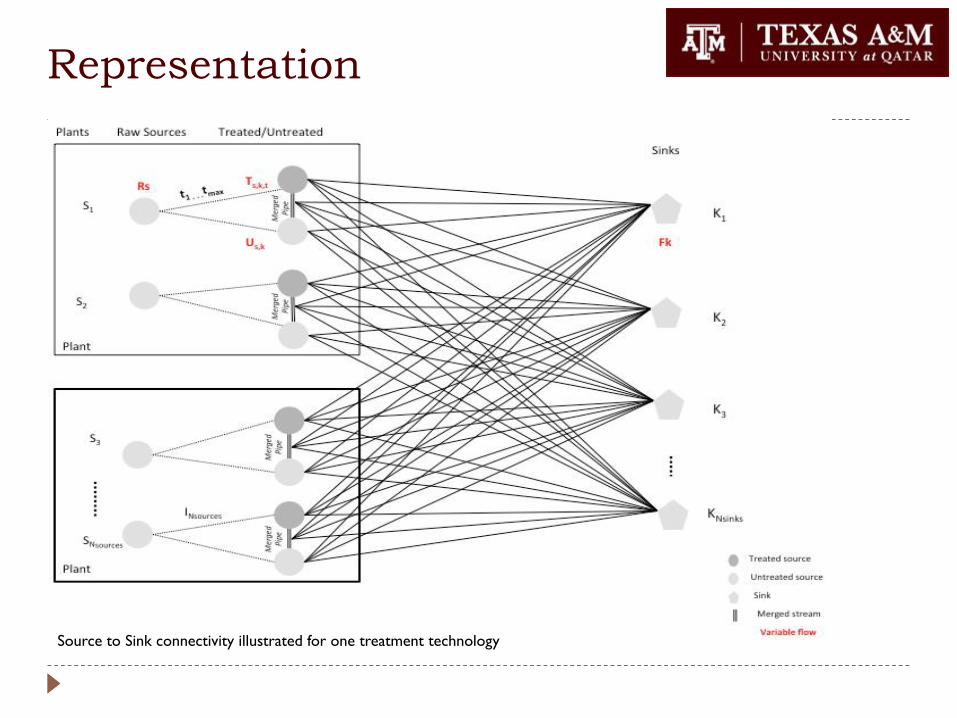
Representation
Source to Sink connectivity illustrated for one treatment technology

Optimization problem
Minimize Total Cost
Total Cost = Cost of sinks + Cost of treatment + Cost of compression + Cost of pumping + Cost of pipelines
Subject to
Network mass balances
Flow and purity constraints
Net capture requirements
Mixed Integer Non-Linear Program (MINLP)

Implementation
“What’s Best 12.0” Lindo Global solver for MS-Excel
2010 via a laptop with Intel Core i7 Duo processor, 8
GB RAM and a 32-bit operating System.

Case
Study
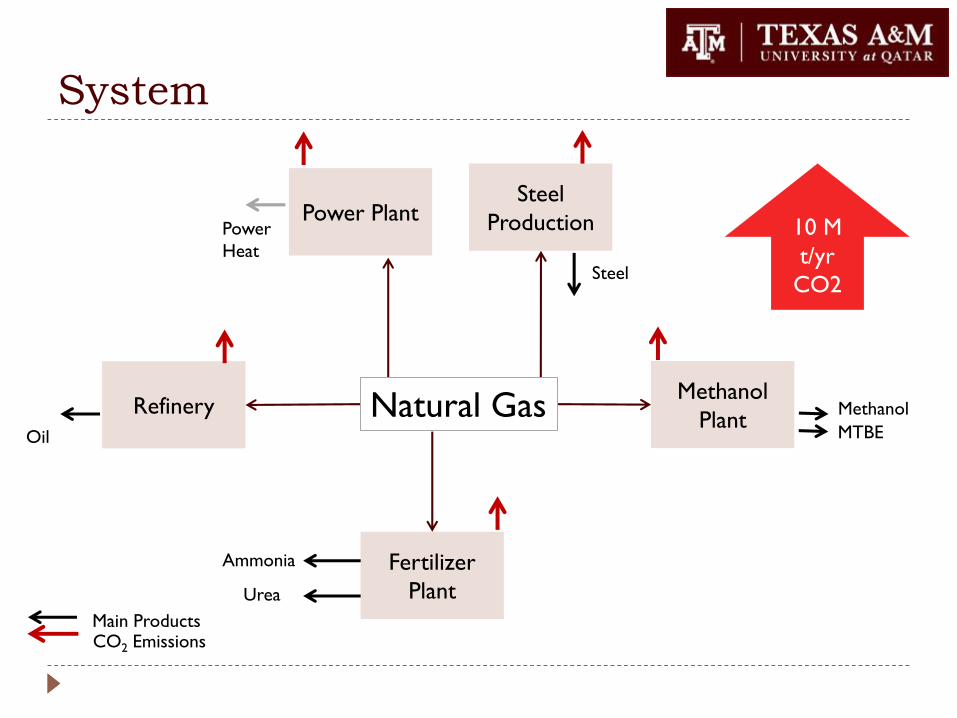
System
Power Plant
RefineryMethanol
Plant
Fertilizer
Plant
Steel
Production
Oil
Ammonia
Urea
Steel
Methanol
MTBENatural Gas
Main ProductsCO2 Emissions
Power
Heat
10 M
t/yr
CO2

Power Plant
RefineryMethanol
Plant
Fertilizer
Plant
Steel
Production
Oil
Ammonia
Urea
Steel
Methanol
MTBENatural Gas
Main ProductsCO2 Emissions
Power
Heat70%Of emissions accounted for in
selected sources
Step 1: Data acquisition for
industrial zone

Step 1: Data acquisition for
industrial zone
CO2 Source Information
Plant Source CO2 Flow, MTPD Composition of CO2, wt% P,
kPa
T, K
Ammonia amine unit977 100%
101 k
Pa
298 K
Steel Iron Mill3451 44%
Power Gas Turbine 9385 7%
Refinery Boiler 1092 27%

Step 2: Identification of carbon
sinks
Power Plant
RefineryMethanol
Plant
Fertilizer
Plant
Steel
Production
Oil
Ammonia
Urea
Steel
Methanol
MTBENatural Gas
Main ProductsCO2 Emissions
Power
Heat
Algae
Greenhouse
Storage
EOR

CO2 Sink Information
Enhanced Oil Recovery
Storage in Saline Aquifers
Boasting Urea Production
Methanol Production using Solar Energy
Microalgae Production
Greenhouses
Step 2: Identification of carbon sinks

CO2 Sink Information
*based on information from the IPCC report (Metz et al, 2005), (European Commission, 2007), (Campbell
et al 2009 ), (Bloom et al, 2009), (Van-Dal et al 2013), (Global CSS, 2011) and (Kojima et al, 2008).
**located out of the city
Step 2: Identification of carbon sinks
Negative cost indicates a profit
Sinks CO2 Composition (wt%) Flow CO2, MTPD P, kPa Csinkk, USD/ton CO2
* 𝜂𝑘
Algae 6 283 101 0 0.42
Greenhouses** 94 1030 101 -5 0.5
Methanol 99.9 1710 8080 -21 0.098
Urea 99.9 1126 14140 -15 0.39
CO2-EOR ** 94 2739 15198 -30 0
Saline Storage ** 94 8317 15198 8.6 0

Step 3: Treatment, transmission and cost data
Carbon removal cost from each source
Technology of choice: MEA Absorption
Literature Values
Costs estimation based on Hendrix and Graus (2004) and Rubin et al (2012)
Plant Source Estimated CsiT
Ammonia Plant Amine Unit 0
Steel Plant Iron Mill 29
Power Plant Gas Turbine 43
Refinery Boiler 35
E-7 E-7
E-8
E-9
Aminecontractor
AmineRegenerator
E-7
Flue
Gas
CO2
To stack
Low CO2
CO2-free

Step 3: Treatment, transmission and cost data
Compression and Pumping Correlations
Capital + Operating Cost
Cost Element Correlation sourceCapital cost of
compressor𝐶𝐶𝑐𝑎𝑝𝑖𝑡𝑎𝑙
USD
yr= 158,902 (
P𝑐𝑜𝑚𝑝.(T𝑠,𝑘,𝑡+U𝑠,𝑘)
224)0.84𝐶𝑅𝐹 Durao (2008)
Operating cost of
compressor𝐶𝐶𝑜𝑝𝑒𝑟𝑎𝑡𝑖𝑛𝑔
USD
yr= P𝑐𝑜𝑚𝑝. (T𝑠,𝑘,𝑡+U𝑠,𝑘) ∗ 𝐸𝑙𝑒𝑐. (
𝑈𝑆𝐷
𝑘𝑊ℎ) ∗
𝑑𝑎𝑦𝑠
𝑦𝑒𝑎𝑟∗ 24 ℎ
The overall cost of
compressor𝐶𝑠,𝑘𝐶𝑜𝑚𝑝𝑒𝑠𝑠𝑜𝑟 USD
yr= 𝐶𝐶𝑐𝑎𝑝𝑖𝑡𝑎𝑙 + 𝐶𝐶𝑜𝑝𝑒𝑟𝑎𝑡𝑖𝑛𝑔
Capital cost of
pump𝑃𝐶𝑐𝑎𝑝𝑖𝑡𝑎𝑙
USD
yr= [( 1.11 ∗ 106
𝑃𝑝𝑢𝑚𝑝 .(T𝑠,𝑘,𝑡+U𝑠,𝑘)
1000+ 0.07 ∗ 106) ∗ 𝐶𝑅𝐹)] McCollum and Ogden (2006)
Operating cost of
pump𝑃𝐶𝑜𝑝𝑒𝑟𝑎𝑡𝑖𝑛𝑔
USD
yr= 0.8 ∗ 𝑃𝑝𝑢𝑚𝑝 . (T𝑠,𝑘,𝑡+U𝑠,𝑘) ∗ 𝐸𝑙𝑒𝑐.
𝑈𝑆𝐷
𝑘𝑊ℎ∗
𝑑𝑎𝑦𝑠
𝑦𝑒𝑎𝑟∗ 24 ℎ
Total overall cost
of pump𝐶𝑠,𝑘𝑝𝑢𝑚𝑝 USD
yr= 𝑃𝐶𝑐𝑎𝑝𝑖𝑡𝑎𝑙 + 𝑃𝐶𝑜𝑝𝑒𝑟𝑎𝑡𝑖𝑛𝑔
Cost of piping C𝑠,𝑘Pipe USD
mi= 95,230 𝐷𝑐
𝑠,𝑘 + 96,904 ∗ CRF Parker (2004)
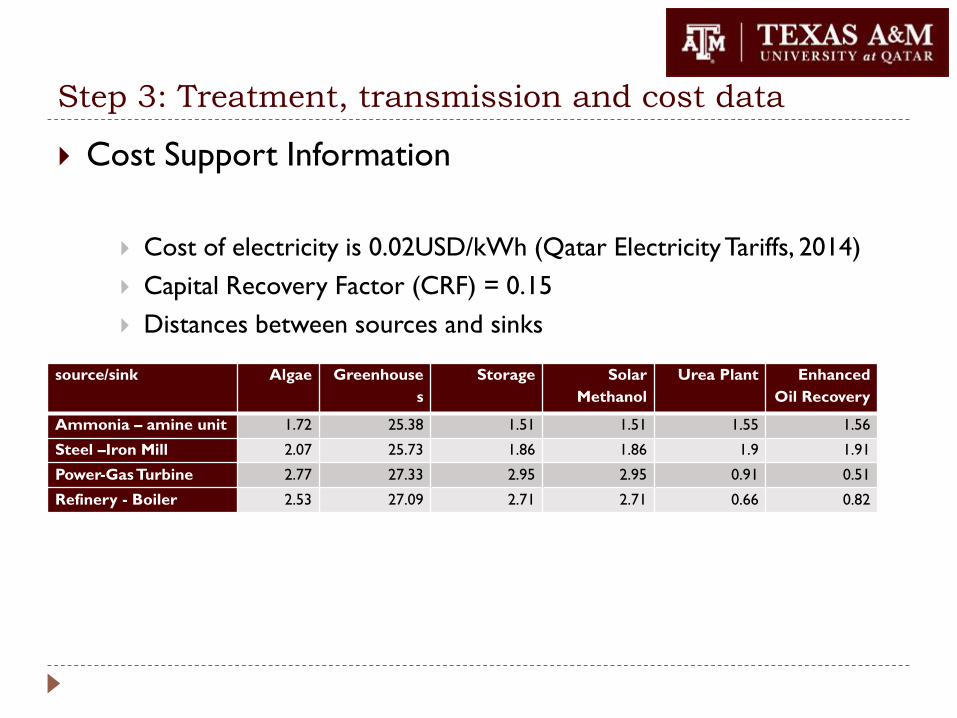
Step 3: Treatment, transmission and cost data
Cost Support Information
Cost of electricity is 0.02USD/kWh (Qatar Electricity Tariffs, 2014)
Capital Recovery Factor (CRF) = 0.15
Distances between sources and sinks
source/sink Algae Greenhouse
s
Storage Solar
Methanol
Urea Plant Enhanced
Oil Recovery
Ammonia – amine unit 1.72 25.38 1.51 1.51 1.55 1.56
Steel –Iron Mill 2.07 25.73 1.86 1.86 1.9 1.91
Power-GasTurbine 2.77 27.33 2.95 2.95 0.91 0.51
Refinery - Boiler 2.53 27.09 2.71 2.71 0.66 0.82

Results and
Discussion
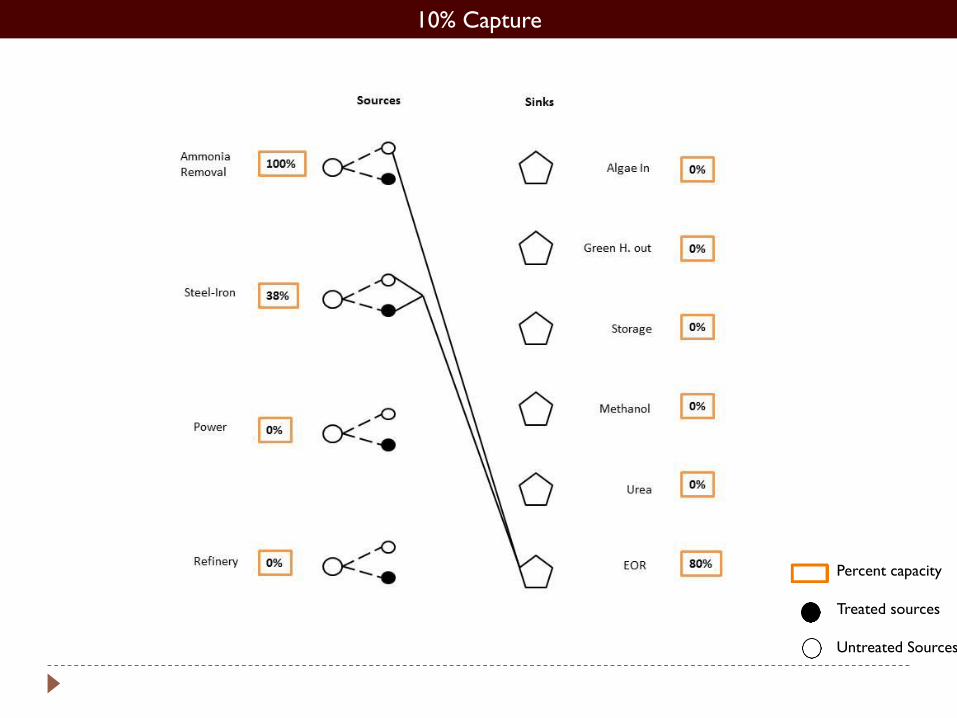
10% Capture
Percent capacity
Treated sources
Untreated Sources

40% Capture
Percent capacity
Treated sources
Untreated Sources

Capture Cost per ton CO2
vs. Capture Target
-40
-30
-20
-10
0
10
20
30
40
0% 10% 20% 30% 40% 50% 60%
Co
st o
f C
ap
ture
(U
SD
/tC
O2)
Percent of CO2 Net Capture

12,417 t/d CO2
Allocated
286 t/d CO2
Not fixed
sinks
361 t/d CO2
Treatment
energy input
469 t/d CO2
Compression
10,232 t/d
CO2
Net
1,069 t/d CO2
Not captured
in treatment
Carbon Dioxide Net Target
50% Capture Balance

Cost Breakdown

Summary
Carbon integration:
Systematic approach to identify low cost carbon management
options across multiple sources and multiple sinks using CO2
purification as appropriate
Focus on industrial parks / cities and interfaces to external
CO2 sinks
Enables exploration of scenarios to inform decision-making

Ongoing Work
Integration for tightening reduction targets over time
Carbon & Energy Integration (incl renewables)
Integrated carbon dioxide separation technology
selection

Artist: Pawel Kuczynski
Thank you.
Support from the Qatar Science Leadership
Program (QSLP) – QF Research division is
gratefully acknowledged (Dhabia Al-Mohannadi)
This work has greatly benefited from knowledge
gained in QNRF project NPRP grant no. 4-1191-
2468.

BACK-UPSome more slides

Acknowledgement
Qatar Science Leadership Program (QSLP) –
QF Research division (Dhabia Al-Mohannadi)

Ongoing Work:
Achieving targets over time
2015 2020 2030 2050
Defined Growth
Predictions Future?
80% - 60%
Target
ReductionCommitted Industrial Plan
Expected Growth or decline
Plant Lifetime Achieved
Future Technologies
Network Rearrangement

Ongoing Work:
Carbon & Energy Integration
Waste Heat
Power Heat Reuse
Renewables
Was
te h
eat
Heat
Dem
and
Pow
er
Treatment
Transmission
Variable
CO2
Constant
CO2

DecisionsSource
Treatment
Cost/Degree
treatment
Flow &
Composition
Mixing?
Transmission Distance
yes
No
Allocation Compression
Capture
source?
yesNo
yes
No
Eliminate
Degree
Picture: cleantechnica.com

Decisions
Biological
Allocation
Conversion
Type
Sequestration
Geological
Cost of
processing
New Sink
Existing
Sink
Requirements
Flow & Composition
Picture: cleantechnica.com

Source
compression
Pumping
Sink
Connection
http://www.seek.co.nz/

3% Capture
Percent capacity
Treated sources
Untreated Sources

20% Capture
Percent capacity
Treated sources
Untreated Sources

STRONG TRACK RECORD OF
RESEARCH WITH INDUSTRY & LOCAL SERVICE
Government Industry
•Emiri Diwan
•MinistriesMinistry of the EnvironmentMinistry of Development Planning and StatisticsMinistry of Economy & Commerce
•Qatar Petroleum
•Q-Companies:QAFCO, QAPCO, QChem, QVC, QatarGas, RasGas
•Multi-Nationals and Technology:Shell, Maersk, BP, ExxonMobil, Sasol, Chevron, GDF Suez, Mitsubishi Heavy Industries
•Engineering / Services:Worley Parsons, URS, Bauer
Main reason for excellent reputation with local stakeholders (besides impact from our graduates)