AN ASSESSMENT OF LIABILITY RULES FOR INTERNATIONAL GHG EMISSIONS
GHG Emission Assessment Guideline
Volume III: Guideline on Data Collection and
Estimation of GHG Emission
from Livestock and Manure Management

2
FEDERAL DEMOCRATIC REPUBLIC OF ETHIOPIA
MINISTRY OF AGRICULTURE
ADDIS ABABA
ETHIOPIA
About the authors
Dr. Million Tadessee
Acknowledgements
The authors would like to thank the Ministry of Agriculture – Natural Resources Management
Directorate – CRGE unit for providing financial assistance and technical support in the development
of this guideline.
Produced by Echnoserve Consulting
April 2015
Front cover photo: Echnoserve
Credit: Bayu Nebsu & Asefa Tadesse

3
Table of Contents
I. Introduction ................................................................................................................................................... 5
II. Livestock Green House Gas emission ................................................................................................... 6
III. Livestock feed characterization and GHG emission calculation approach ........................ 7
3.1. Livestock population and feed characterization .......................................................................... 7
3.1.1. Livestock species categories and subcategories .................................................................. 7
3.2 GHG emission estimation approach in livestock population in Ethiopia ........................ 8
3.3. Basic characterization for livestock population (tier 1 approach) ................................ 10
3.4. Enhanced characterization for livestock population (tier 2 approach) ...................... 12
IV. Methods for estimation of methane emission from enteric fermentation and manure
management in cattle ....................................................................................................................................... 20
4.1 Methane emission from enteric fermentation in cattle ..................................................... 20
4.1.1 Calculation of feed intake or gross energy (GE) intake for cattle ......................... 21
4.1.2 Calculation of methane emission factor for enteric fermentation ........................ 27
4.2 Methane emission from manure management in cattle .................................................... 28
V. Methods for estimation of nitrous oxide emission from manure management in cattle .. 31
VI. Green House Gas emission reporting .................................................................................................. 36
Reference............................................................................................................................................................... 38

4
LIST OF TABLE
Table 1. Livestock species that contribute to GHG emission and their emission sources category in Ethiopia ... 8
Table 2. GHG emission source category and calculation approaches ...................................................................... 9
Table 3. Level of characterization (livestock and feed) required for estimation of GHG emission in Ethiopia .. 10
Table 4. Definition of livestock (cattle) population category and sub-category in Ethiopia ................................ 13
Table 5. Example of body weight (in kg) of some cattle breed in Ethiopia at different age ................................. 15
Table 6. Livestock feeding situation and activity coefficient required for calculation of net energy for activity.
..................................................................................................................................................................................... 16
Table 7. Data on average milk production and lactation length for different breeds in Ethiopia ....................... 17
Table 8. Digestibility coefficient for different feed or diet type (Adopted from IPCC, 2006) ............................... 18
Table 9. The mean chemical composition and nutritive value of Ethiopian feeds by class on percent DM basis
(EIAR, 2007) ............................................................................................................................................................... 19
Table 10. Net energy for maintenance of indigenous cattle by sub-category ....................................................... 21
Table 11. Net energy requirement of indigenous cattle for activity ...................................................................... 22
Table 12. Estimate of Net Energy for growth requirement of indigenous cattle breed........................................ 23
Table 13. Calculating gross energy (GE) for indigenous cattle species by sub-category ...................................... 26
Table 14. Methane conversion factors (Adapted from IPCC 2006) ........................................................................ 27
Table 15.Ccalculating methane emission factor (EF) for enteric fermentation in cattle species by sub-category
..................................................................................................................................................................................... 27
Table 16. Example of methane emission from enteric fermentation indigenous cattle in Ethiopia .................... 28
Table 17. Dairy cows default methane emission factor from manure management (Adapted IPCC, 2006) ....... 29
Table 18. Example of calculation of methane emission from manure management ............................................ 30
Table 19. Example of calculation of N intake for indigenous cattle breed ............................................................. 33
Table 20. Example of calculation of N retention for indigenous cattle breed ....................................................... 34
Table 21. Example of calculation of N excretion for indigenous cattle breed ....................................................... 34
Table 22. Example of calculation of direct N2O emission for indigenous cattle .................................................... 34
Table 23. Example of calculation of total direct N2O emission for indigenous cattle ........................................... 35
Table 24. CH4 and N2O emission factor (kg/animal/year) for indigenous cattle in Ethiopia tier 2 methodology
..................................................................................................................................................................................... 36
Table 25. Green house gas (CH4+N2O) mission factors in tone of carbon dioxide equivalent for indigenous
cattle in Ethiopia ........................................................................................................................................................ 36
Table 26. Example of calculation of total GHG emission for indigenous cattle in Ethiopia for year 2013 .......... 37
5
I. INTRODUCTION
The livestock production system contributes to global climate change directly through the
production of methane (CH4) from enteric fermentation and manure management and nitrous
oxide (N2O) emission from manure management (Dourmad et al., 2008). Among Ethiopian
livestock species the major contributor to GHGs emission are cattle, which are used for meat, dairy
products, as draught animals, and are treated as financial assets. Given current practices, the cattle
population is likely to increase from today’s around 55 million (CSA, 2013) to more than 90 million
in 2030 (CRGE, 2011), thereby almost reaching the cattle carrying capacity of the country and
doubling emissions from the livestock sector. In a business-as-usual scenario, emissions from
livestock are projected to increase as a function of livestock population growth from 55 Mt CO2e in
2013 to 124 Mt CO2e in 2030 (CRGE, 2011 ), mainly driven by an increase in methane from enteric
fermentation and manure management (accounting for 112 Mt CO2e or 90% of emissions in 2030).
Emissions from manure left on pasture, range and paddock account for the remaining 10% of
livestock emissions in 2030 (CRGE, 2011). Cognizing this fact, Ethiopia set Climate Resilience Green
Economy Strategy to protect the country from adverse effect of climate change. As part of the
strategy, the government has selected four imitative for fast track implementation. Efficiency
improvement in livestock value chain is one of the initiatives selected for fast track implementation
to reduce GHG emission from livestock sector. Key to realizing emissions reductions is the ability to
measure and track emissions. Development of method and tools for GHG estimation provide this
ability and they can be used to quantify emission reduction at farm level, track progress toward
reduction goals, and communicate this progress to concerned body or key audiences.
The overall objective of this guideline is to impart the knowledge and skill on GHGs emission
measurement and reporting customized guidance to experts, professional, development agent, and
producers in Ethiopia on how they should collect data, measure, tracks and report GHG emissions
from livestock production customized to the Ethiopian context. Chapter 1 introduce the major GHG
emission sources in Livestock, chapter 2 describe the livestock and feed characterization data
required for estimation of GHG emission, chapter 3 introduce methodologies for estimation of CH4
emission from enteric fermentation and manure management in cattle and chapter 4 on
methodologies for estimation of nitrous oxide emission from manure management in cattle and the
last chapter (chapter 5) deals with GHG emission reporting.
6
II. LIVESTOCK GREEN HOUSE GAS EMISSION
The green house gas emission from livestock and manure management occurs at different stage
along the livestock value chain. However, the relative importance of each source varies
considerably. Understanding the qualitative differences amongst them is crucial to many steps in
inventory development, including emission calculation, emission reporting and inventory quality
control. The green house effect is a natural phenomenon necessary for life on Earth. Greenhouse
gases are atmospheric gases that absorb and re-emit long-wave radiation released by the earth
back to the surface and as a consequence average global temperatures are predicted to rise (0.5 to
2.5oC by 2030) (IPCC 2001).
The GHGs that contribute to global warming are CO2, CH4, N2O, SF6, PFCs, HFCs and NF3. After
carbon dioxide, the most important green house gas is methane which traps over 21 times more
heat per molecule compared to CO2 (EPA 2003). One of the largest biogenic sources of CH4 is
digestive fermentation from ruminant animals (Alan, 2008). CH4 is emitted through
methanogenesis under anaerobic conditions through enteric fermentation, in soils and manure
storage, N2O is primarily emitted as a by-product of nitrification and de-nitrification, while HFCs
and PFCs are emitted from refrigeration, air condition equipment.
Enteric fermentation is a natural part of the digestion process which results from the activity of
microorganisms in the digestive tract. Digestion in ruminants (e.g. cattle and sheep) differs from
that in mono-gastric (e.g. pigs and poultry) in that substantial fermentation occurs in their large
stomach called the rumen, resulting in large quantities of CH4 being produced which are voided
through belching (Frank et al., 2000). Methane originates from anaerobic microbial fermentation
processes in the gastrointestinal tract of ruminant animals particularly in the reticulorumen, or
rumen in short. In an adult cow, the rumen occupies a volume of over 100 litres of which usually 85
to 90% is fluid (Moss et al., 2000). The high moisture content and temperature that is kept rather
constant at around 37oc makes this an eminently suited environment for microbes to survive and
grow, provided the microbes are regularly supplied with a suitable substrate. Substrates needed by
the microbes are provided through the ingestion of feed by the host animal. The feed ingested by a
ruminant is attacked by the microbes and degraded in a wide range of end products including CH4.
7
III. LIVESTOCK FEED CHARACTERIZATION AND GHG EMISSION CALCULATION
APPROACH
Estimation of GHG emission can be the most challenging. The general approach is first to identify
the management practices and emissions sources that would need to be estimated, before selecting
a calculation approach and collecting input data. The selection of a calculation approach is a key
step, because the likely accuracy of GHG estimate and the types of input data required vary widely
amongst approaches, affecting the ability to realize GHG emission reporting. This chapter: -
Describes the livestock population and feed characterization applicable to GHG emission source
categories, the level of characterization and input data required for estimation of GHG emission
from livestock and the general types of approaches for data collection
3.1. Livestock population and feed characterization
The methods for estimating CH4 emission from enteric fermentation and manure management, and
N2O emissions from livestock manure management require definitions of livestock species category
and subcategories, annual population size, feed intake and feed characterization. The procedures
employees to define livestock subcategories, develop population data, and feed characterization
data. Feed digestibility coefficients for each livestock sub-categories is required to help estimation
of feed intake for use in calculation of CH4 and N2O emissions from enteric fermentation and
manure sources. Data on livestock population, management system, livestock production, feed type
and feeding system can be collected at the farm level or from existing data records held by
producers (e.g. from individual smallholder farmers, commercial private farms, or from research
center farms). Primary data on livestock population, milk yield, live-weight, feeding situation, feed
types, livestock management system, manure management system can be collected at farm level
through questionnaire based survey. In contrast, reliable data on feed characteristic (Digestibility
(DE%), crud protein (CP) content of feed) can be more difficult to obtain at farm level instead these
data can often be obtained from research.
3.1.1. Livestock species categories and subcategories
The livestock population category and subcategories need to be defined to create relatively
homogenous sub-groupings of animals. The criteria for grouping into subcategory will be based on
difference in breed, age, sex, production objective (dairy, meat, multipurpose). By dividing the
population into these subcategories, country-specific variations in animal performance within the
overall livestock population can be reflected. The steps to characterize livestock sub-category is: 1)
Identify livestock species applicable to each GHG emission sources: 2) determine GHG emission
estimation methods applicable: 3) identify the most detail characterization required.

8
The livestock species that contribute to more than one emission source category in Ethiopia are
typically: cattle, sheep, goats, horses, camels, mules/asses, and poultry according to their
importance (Table 1). The cattle species in Ethiopia are the major contributor to GHG emission due
to their number and level of emission compared to other livestock species. The majority of cattle
populations in Ethiopia are indigenous type but small number of exotic dairy cattle breed and
crossbred are found in urban and peri-urban areas. The indigenous cattle breeds are the major
contributor to GHGs emission in Ethiopia because of their large population size compared to other
livestock species. In terms of distribution, about 70% of cattle population in Ethiopia is found in the
highland mixed crop livestock production system. The pastoral and agro-pastoral production
system accounts for rest 30% of cattle population in Ethiopia. By dividing the cattle production
system into these production system country specific variation can be reflected
Table 1. Livestock species that contribute to GHG emission and their emission sources category in Ethiopia
Livestock species GHG emission sources category
Cattle CH4 from enteric fermentation and CH4 and N2O from manure management
Sheep CH4 from enteric fermentation and CH4 and N2O from manure management
Goat CH4 from enteric fermentation and CH4 and N2O from manure management
Camel CH4 from enteric fermentation and CH4 and N2O from manure management
Horse CH4 from enteric fermentation and CH4 and N2O from manure management
Mule CH4 from enteric fermentation and CH4 and N2O from manure management
Donkey CH4 from enteric fermentation and CH4 and N2O from manure management
Poultry CH4 and N2O emission from manure management
3.2 GHG emission estimation approach in livestock population in Ethiopia
On the base of existing reviewed emission estimation method, level of emission and trend, and
livestock and feed characterization data, IPCC, tier 2 (IPCC, 2006) emission estimation approach is
identified suitable in Ethiopia for the source categories of methane emission from enteric
fermentation in cattle (table 2). For methane emission from manure management there is no
manure characteristic data (e.g. volatile solid content) available to use tier 2 emission estimation
approaches and current level of emission is also small and does not warranty detail
characterization data to use tier 2 approaches. Hence, tier 1 emission estimates approach can be

9
used for methane emission from manure management. For nitrous oxide emission estimation from
manure management (direct source), tier 2 approach can be applied, because of availability of
country specific feed characterization data for estimation of nitrogen excretion rate in cattle
species. However the indirect emission of nitrous oxide from manure management could not be
accounted because of their relative importance (CRGE, 2011).
Table 2. GHG emission source category and calculation approaches
No Major GHG emission source categories in Ethiopia Calculation approach
relevant to Ethiopia
1 Methane emission from enteric fermentation in cattle IPCC, Tier 2
2 Methane emission from manure management IPCC, Tier 1
3 Nitrous oxide emission from manure management
(direct emission)
IPCC, Tiers 2
Level of characterization required for each GHG emission sources:
Once you determined the emission calculation approach under each source category, you need to
identify the most detailed characterization required to support each emissions estimate for each
livestock species category and sub-category (Table 3). For sources category of methane emission
from manure management in Ethiopia, the ‘basic’ characterization data (livestock population) could
be used for all livestock species category and sub-category, due to lack of country specific
information on manure characteristics. However, for estimation of methane emission from enteric
fermentation in cattle enhanced characterization (tier 2) is required to collect information on
livestock and feed characterization. The same characterization data can be used to estimate nitrous
oxide emission from manure management using tier 2 methods.
10
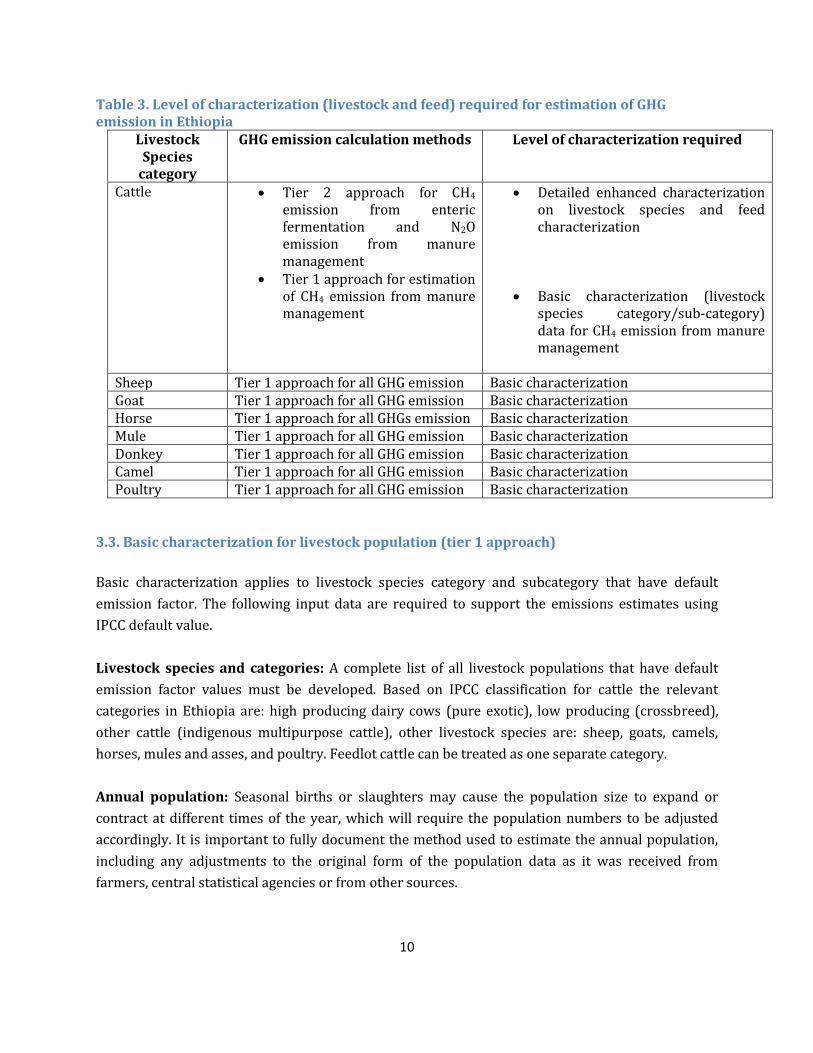
Table 3. Level of characterization (livestock and feed) required for estimation of GHG emission in Ethiopia
Livestock Species
category
GHG emission calculation methods Level of characterization required
Cattle Tier 2 approach for CH4 emission from enteric fermentation and N2O emission from manure management
Tier 1 approach for estimation of CH4 emission from manure management
Detailed enhanced characterization on livestock species and feed characterization
Basic characterization (livestock species category/sub-category) data for CH4 emission from manure management
Sheep Tier 1 approach for all GHG emission Basic characterization Goat Tier 1 approach for all GHG emission Basic characterization Horse Tier 1 approach for all GHGs emission Basic characterization Mule Tier 1 approach for all GHG emission Basic characterization Donkey Tier 1 approach for all GHG emission Basic characterization Camel Tier 1 approach for all GHG emission Basic characterization Poultry Tier 1 approach for all GHG emission Basic characterization
3.3. Basic characterization for livestock population (tier 1 approach)
Basic characterization applies to livestock species category and subcategory that have default
emission factor. The following input data are required to support the emissions estimates using
IPCC default value.
Livestock species and categories: A complete list of all livestock populations that have default
emission factor values must be developed. Based on IPCC classification for cattle the relevant
categories in Ethiopia are: high producing dairy cows (pure exotic), low producing (crossbreed),
other cattle (indigenous multipurpose cattle), other livestock species are: sheep, goats, camels,
horses, mules and asses, and poultry. Feedlot cattle can be treated as one separate category.
Annual population: Seasonal births or slaughters may cause the population size to expand or
contract at different times of the year, which will require the population numbers to be adjusted
accordingly. It is important to fully document the method used to estimate the annual population,
including any adjustments to the original form of the population data as it was received from
farmers, central statistical agencies or from other sources.
11
Annual average populations are estimated in various ways, depending on the available data and the
nature of the animal population. In the case of animal alive the whole year like dairy cattle,
estimating the annual average population may be as simple as obtaining data related to one-time
animal inventory. However, estimating annual average populations for a growing population (e.g.,
feedlot cattle and broiler) requires calculation/adjustment to the original data received. Most
animals in these growing populations are alive for only part of a complete year (for example, in
Ethiopia commercial feedlot fattening based on grain diet are practiced for duration of 3 or 6
months). Animals should be included in the populations regardless if they were slaughtered for
human consumption or die of natural causes. Equation 1 estimates the annual average of livestock
population.
AAP =Days _alive*( NAPA/365) (Equation 1)
Where:
AAP = annual average population
NAPA = number of animals produced annually
For example broiler chickens are typically grown approximately 60 days before slaughter.
Estimating the average annual population as the number of birds grown and slaughtered over the
course of a year would greatly overestimate the population, as it would assume each bird lived the
equivalent of 365 days. Instead, one should estimate the average annual population as the number
of animals grown divided by the number of growing cycles per year. For example, if broiler chickens
are typically grown in flocks for 60 days, an operation could turn over approximately 6 flocks of
chickens over the period of one year. Therefore, if the operation grew 60,000 chickens in a year,
their average annual population would be 9,863 chickens. For this example the result from
equation would be:
Annual average population = 60 days ● (60,000 / 365 days) = 9,863 chickens
Dairy cows: The majority of cattle population in Ethiopia is indigenous type found in smallholder
and pastoral production system and small number of improved dairy cattle population also exist in
peri-urban and urban milk shed areas.
Dairy cows in Ethiopian context are defined here as mature cows (pure exotic and crossbreed) that
are producing milk in commercial quantities for human consumption (IPCC, 2006). In Ethiopia the
dairy cow population is comprised of two well-defined segments: (i) high-producing exotic dairy
cow population found in urban and peri-urban commercial operations; and (ii) low producing dairy
cow population managed under medium input production system. These two segments could be
evaluated separately by defining two dairy cow categories. However, the dairy cow category does
not include indigenous cows kept for multipurpose production (meat, milk and draft power). Low
producing multi-purpose cattle and cattle managed under pastoral production system should be
considered as other cattle category (indigenous cattle).

12
3.4. Enhanced characterization for livestock population (tier 2 approach)
Enhanced characterization requires detailed information on:
Definitions for livestock category and subcategories;
Livestock population by subcategory, with consideration for estimation of annual
population as per tier 1; and
Feed intake estimates for the typical animal in each subcategory.
The livestock population subcategories are defined to create relatively homogenous sub-groupings
of animals. By dividing the population into these subcategories, country-specific variations in age
structure and animal performance within the overall livestock population can be reflected.
Enhanced characterization seeks to define animals, animal productivity, and diet quality and
management system used to support a more accurate estimate of feed intake for use in estimating
methane production from enteric fermentation using tier 2 method. The same feed intake estimates
should be used to provide harmonized nitrogen excretion rates to improve the accuracy and
consistency of CH4 and N2O emissions.
Definitions for livestock subcategories
IPCC 2006 recommends classifying livestock populations into subcategories for each species
according to age, production system, and sex. Representative cattle species sub-categories in
Ethiopia are shown in Table 4.
In Ethiopia, cattle populations are classified into at least three categories: pure exotic, crossbred
and indigenous cattle. These categories can be further divided into: mature dairy cow, growing and
young cattle. Feedlot cattle can be considered as separate category and could be further subdivided
into those cattle that are fed a high-grain diet (commercial feedlot) and those cattle that are grown
and finished solely on pasture (small holders fattening).
Ethiopia is a country with distinct production system differences, due to difference in climate,
breed, feed and feeding system, and manure management. These differences need to be considered
in order to obtain accurate estimate. For this, first define production system then define categories
and sub-categories within these production systems. For example, livestock production system in
Ethiopia can be classified into urban and peri-urban production system, mixed crop-livestock
system (mixed moisture sufficient and mixed moisture deficit system) found in the highland, and
pastoral and agro-pastoral production system found in the low land areas. Both urban and peri-
urban systems are located around Addis Ababa and regional towns and take the advantage of the
urban markets, the production system is based on the use of pure exotic breed and crossbred dairy
cows for commercial purpose, manures are managed in liquid based-system or pit form, feed and
13
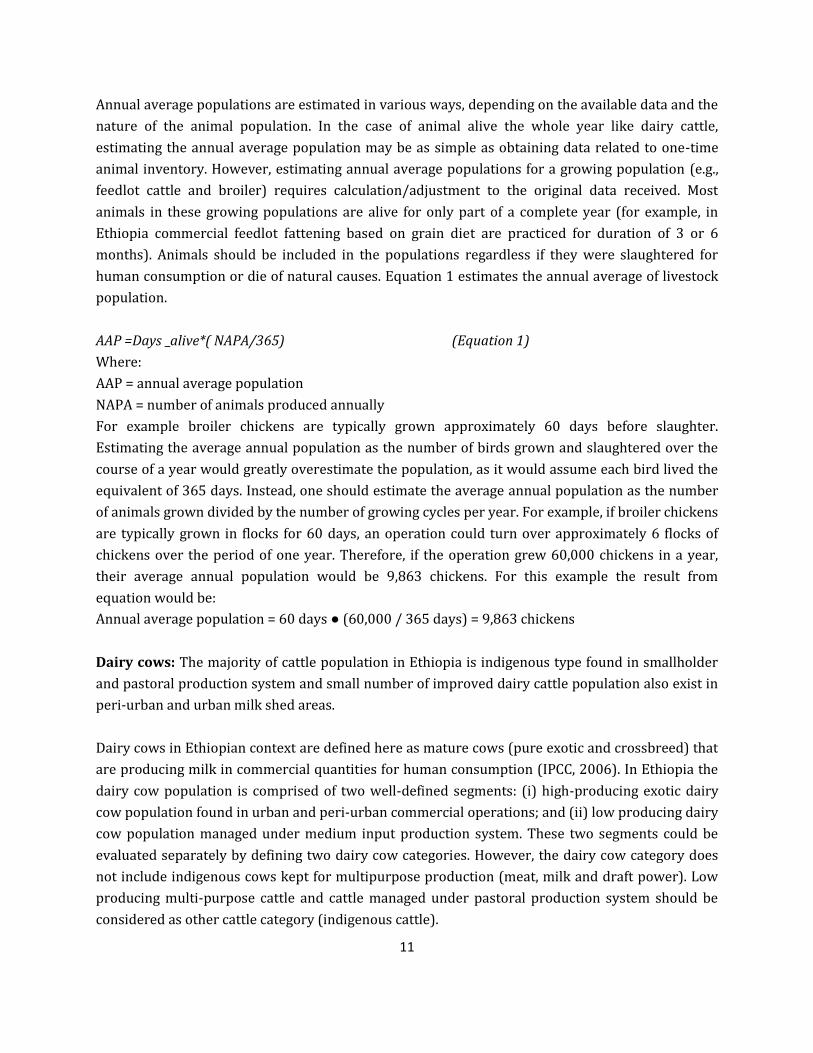
feeding system is based on concentrate supplementation. The mixed crop-livestock production
system is part of the subsistence farming system found in mixed highland area. Feed resources are
mainly natural grazing, crop residues and small amount of cultivated forages whereby a greater
fluctuation in availability and quality are manifested almost throughout the year (Alemayehu,
2003). In this system most livestock manure is left on pasture/grazing land, used as fuel for energy
sources or construction purpose. The pastoral and agro-pastoral production system is found in
extensive range land area of lowland part of the country. The major feed resources are grass,
shrubs, browse from rangeland. Livestock manure is managed as a solid left on rangeland/pasture.
Table 4. Definition of livestock (cattle) population category and sub-category in Ethiopia
Cattle species category Sub-category Age Feeding
system Manure
management system
1. Dairy cattle breeds (exotic)
Mature dairy cows > 3 years Stall feeding in urban and peri-urban dairy commercial production system
Liquid storage, Pit Growing heifers 2-3 years
Young female 1-2 years
Matured males (breeding bull) > 3 years
Growing male 2-3 years
Young male 1-2 years
2. Crossbred dairy cattle
Mature dairy cows > 3 years Communal grazing and cut and carry system found in mixed crop livestock
Spread on pasture, fuel, construction
Growing heifers 2-3 years
Young females 1-2 years
Mature males (breeding bull) > 3 years
Growing male 2-3 years
Young male 1-2 years
3. Indigenous cattle Mature cows > 3 years Free grazing in pastoral and agro-pastoral to limited grazing in mixed crop livestock, system, feedlot
Spread on pasture, fuel, construction
Growing heifers 2- 3 years
Young females 1- 2 years
Oxen > 3 years
Breeding bulls 2-3 years
Young male (steers) 1-2 years
Mature feedlot cattle fed on forage
2-3 years
Growing/fattening cattle fed a high-grain diet and housed in dry lot
1-2 years

14
For each of the representative animal sub-categories defined, the following information is required:
Annual average population (number of livestock similar to for Tier 1 basic
characterization);
Average daily feed intake (megajoules (MJ) per day and / or kg per day of dry matter); and
Methane conversion factor (percentage of feed energy converted to methane), data on
methane conversion factor is not available specific to Ethiopian feed, IPCC default value can
be used.
Generally, data on average daily feed intake are not available in Ethiopia condition, and need to be
estimated from available feed characteristic and animal productivity data.
The following general data should be collected for estimating the feed intake for each
representative animal category/sub-category:
Live Weight (LW), kg: Live-weight data should be collected for each animal sub-category.
These live-weight data can be obtained from previous study or to estimate by collecting data from
representative sample studies or from CSA if these already exist. Under field condition measuring
the actual live weight of animal may be difficult as weighing scale may not be available, instead
heart girth measurement tap can be used to obtain approximate weight of animal.
Average weight gain per day (AWG), kg per day: Data on average weight gain can be obtain or
collected for feedlot animals and young growing animals. Mature animals are generally assumed to
have no net weight gain or loss over an entire year. Mature animals frequently lose weight during
the dry season or during temperature extremes and gain weight during the following season (IPCC,
2006). However, increased emissions associated with this weight change are likely to be small.
Reduced intakes and emissions associated with weight loss are largely balanced by increased
intakes and emissions during the periods of gain in body weight. In general it is difficult to collect
data on average daily weight gain under field condition. Weight gain can be varies among breed and
can be obtained from previous studies by research or from central statistical authority (CSA) or
other sources. Table 5 presents average daily weight gain of some of the major cattle breed in
Ethiopia. These data are collected from different published literature sources in Ethiopia
Mature weight (MW), kg: The mature weight of the adult animal of each sub-category is required
to define a growth pattern, including the feed and energy required for growth. Mature weight of a
breed or category of cattle is generally considered to be the body weight at which skeletal
development is complete (IPCC, 2006). The mature weight will vary among breeds and should
reflect the animal’s weight when in moderate body condition. This is termed ‘reference weight’
(ACC, 1990) or ‘final shrunk body weight’ (NRC, 1996). Estimates of mature weight for some cattle
breeds in Ethiopia are available from research work (Table 5).

15
Table 5. Example of body weight (in kg) of some cattle breed in Ethiopia at different age
Parameters Weight by breed type
Male Boran Horro Barca Arsi Zebu Fogera
Birth weights 24.5 18.3 22.1 21.5 0 21
6 months weight 115 84 99
Yearling weight 156 112 116
Adult/mature weight 318 380 257 300
Female
Birth weights 24.5 18.3 22.1 21.5 21
Six months weight 115 84 99
Yearling weight 156 112 116
Adult or mature weight 225 280 257 250
Mekonnen, 1994; Habtamu Abera, 2012; Workneh et al (2002); 1 Mekonenen et al., 1996; Kiwuwa et
al., 1983; IAR, 1976; Goshu and mekonnin 1997
Average number of hours worked per day: Data on average number of hours worked for oxen
per day is required to estimate net energy for work. For drought animals, the average number of
hours worked per day must be determined. In Ethiopian highland mixed crop livestock production
system oxen are used only for a maximum of 3 months per year for cultivation of crop land. During
this period they used for a maximum of 8 hours per day. In order to obtain accurate estimate of
energy requirement for work adjustment to annual base is required.
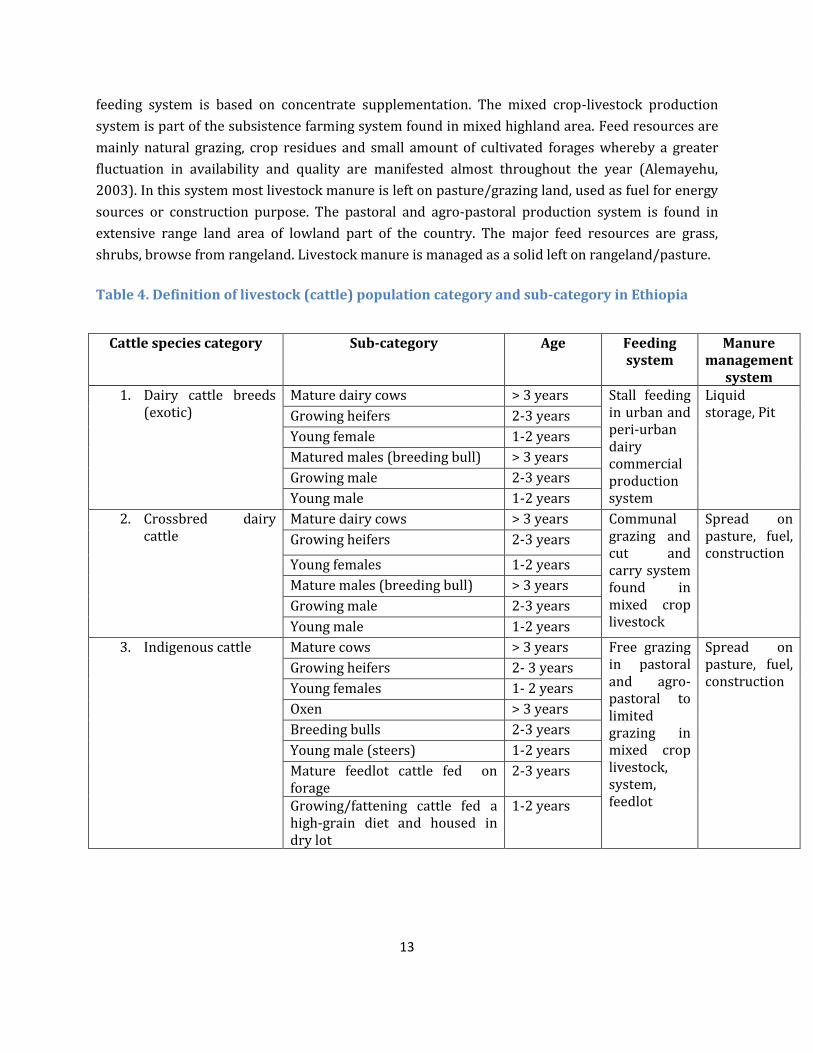
Feeding situation: Data on feeding situation is required to estimate net energy requirement for
activity (when animal move from place to place in search of feed they spent energy). Feeding
situation in Ethiopia are represented (Table 6) by (i) extensive range grazing system found in
pastoral areas and mixed crop livestock system where animal move from place to place (ii) stall
feeding with no movement in search of feed (dairy and feedlot) mostly found in peri-urban and
urban production system: (iii) pasture or cut and carry system with limited movement found in
mixed crop livestock production system in the highland.
16
Table 6. Livestock feeding situation and activity coefficient required for calculation of net energy for activity. Feeding situation Definition Activity coefficient
(Ca) is dimensionless) Extensive grazing Animals graze in open range land or hilly terrain
and expend significant energy to acquire feed (open grazing in pastoral area and communal grazing found in mixed crop livestock system).
0.36
Stall feeding (dairy and feedlot)
Animals are confined to a small area as a result they expend very little or no energy to acquire feed (Example; dairy cattle in urban and peri-urban commercial dairy production and feedlot animals).
0.00
Pasture based Animals are confined in areas with sufficient forage requiring modest energy expense to acquire feed.
0.17
Sources: Adapted from IPCC, 2006
Milk production data: for lactating animals, data on daily milk production is required to calculate
energy requirement for lactation. The data on milk production can be obtained from milk
production record (private commercial dairy and small holder farmers, public owned livestock
farm). In case of smallholders and pastoral production system it is difficult to obtain these records
under Ethiopian condition, as there is no recording system implemented. These data need to be
collected from farmers through questioner based survey or obtained from CSA, research centers or
other reliable sources. Example of milk production data compiled from different sources for
different cattle breeds in Ethiopia are presented in (Table 7).

17
Table 7. Data on average milk production and lactation length for different breeds in Ethiopia
Cattle breed Milk yield (kg/lactation)
Lactation length (days) Average milk yield (kg/day)
Sources
N Mean S.e N Mean S.e Mean
Indigenous cattle breed
Arsi cattle breed 3 589.33 124.80
4 258.67 18.65 2.28 Million et al. 2004; 2001;2006
Barca cattle breed
3 713.24 39.90 3 247.67 31.80 2.88 Million et al 2001; Goshu Mekonnen et al. 1983
Boran cattle breed
4 592.25 136.00
3 202.00 19.00 2.93 Gebeyehu Goshu, 1999; Moges Dereje et al. 1998
Fogera cattle breed
2 592.50 279.5 2 231.00 56.00 2.56 Asheber Sewalem, 1992, Mekonne et al. 1987
Horro cattle breed
2 529.00 21.00 2 201.00 28.00 2.63 Beyene Kebede, 1996.
Dairy cattle breed (Exotic dairy cattle)
Holstein Friesian dairy cattle
4 3746.4 216 2 342.5 195 10.93 Million et al. 2011;
Jersey dairy cattle
2 1640 2 277.1 6.0 Diriba et al. 2013
Crossbred dairy cattle breed
½ Jersey* ½ Arsi 3 1869.67 250 3 351.67 13 5.32 Million et al. 2004; 2001;1997
½ HF* ½ Arsi 4 1726.7 229 4 382.39 9 4.52 Million et al. 2004; 2001;1997
½ HF* ½ Barca 3 2160.65 235 1 326 6.63 Million et al 2001; Goshu Mekonnen et al. 1983
½ HF* ½ Boran 4 2327.06 228 3 306.2 22 7.60 Gebeyehu Goshu, 1999; Moges Dereje et al. 1998
½ HF* ½ Fogera 2 2428.65 95 2 400.45 14 6.06 Asheber Sewalem, 1992, Mekonne et al. 1987
½ HF* ½ Zebu 5 1983.72 156 4 337.67 5.87 Kiwuwa et al. 1983
N= number of data set/experiment; HF= Holstein Friesian; S.e =standard error

18
Fat content (%): Average fat content of milk is required for lactating cows. It is estimated to be 4%
for Holstein Friesian and their crosses with indigenous breed and 5.5% for indigenous breed.
Percent of females that give birth in a year: Data on percentage of females that give birth
annually is required only for mature cows and can vary with breed and management system. These
data can be collected through survey using representative samples, or obtained from previous
research work or from CSA if any. Percent of females that give birth in a year required to calculate
net energy requirement for pregnancy.
Feed characteristic data: feed characteristic data such as feed digestibility (DE%), protein (CP)
content are required to calculate CH4 emission from enteric fermentation and nitrogen excretion
from manure.
Feed digestibility (DE%): Complete information on digestibility values for different livestock
classes and diet types are not available in Ethiopian condition that can be used in estimating feed
intake. However IPCC 2006 digestibility values for range of livestock class and diet type are
available and can be used in estimating feed intake. These for cattle (Table 8), common ranges of
feed digestibility are 45-55% for crop by-products and range lands; 55-75% for good pastures,
good preserved forages, and grain supplemented forage-based diets; and 75-85% for grain-based
diets fed in feedlots. Variations in diet digestibility results in major variations in the estimate of feed
needed to meet animal requirements and consequently associated methane emissions and amounts
of manure excreted. It is also important to note that digestibility, intake, and growth are co-
dependent phenomena. For example, a low digestibility will lead to lower feed intake and
consequently reduced growth. Conversely, feeds with high digestibility will often result in a higher
feed intake and increased growth. A 10% error in estimating DE will be magnified to 12 to 20%
when estimating methane emissions and even more (20 to 45%) for manure excretion (IPCC,
2006).
Table 8. Digestibility coefficient for different feed or diet type (Adopted from IPCC, 2006)
Feed or diet characteristic Locality Digestibility
coefficient
Crop residue and communal grazing/green feed Mixed crop-livestock 45-55%
Range grazing animal Pastoral and ago-pastoral 45-55%
Cattle feed on green feed, good preserved grass
hay and grain supplemented forage diet
Urban and peri-urban dairy
Small holder fattening
55-75%
Concentrate based diet fed in feedlot Peri-urban fattening 75-85%

19
Digestibility data should be based on measured values for the dominant feeds or forages being
consumed by livestock with consideration for seasonal variation. In general, the digestibility of
forages decreases with increasing maturity and is typically lowest during the dry season. Due to
significant variation, digestibility coefficients should be obtained from local scientific data
(research) wherever possible. Although a complete census of digestibility is considered unrealistic,
at a minimum digestibility data from research studies should be consulted.
Some of feed characteristic such as measured values for Neutral Detergent Fiber (NDF), Acid
Detergent Fiber (ADF), Crude Protein (CP), % ash for major feed in Ethiopia are presented in Table
9. These feed characteristic data are measured in the laboratory to indicate the nutritive value of
the feed for ruminant livestock. Determination of these values can enable DE to be predicted as
defined in the recent dairy NRC (2001). The concentration of crude protein (CP) in the feed can be
used in the process of estimating nitrogen excretion rate for determination of N2O estimation.
Table 9. The mean chemical composition and nutritive value of Ethiopian feeds by class on percent DM basis (EIAR, 2007)
Composition Dry forage and
roughages
Green forages and
roughages
Energy
supplement
Protein
supplement
DM 91.3 44 78.7 78.9
EE 2.1 3.2 3.6 6.9
Ash 8.1 10.6 4.3 10.2
CP 6.7 10.9 13.9 30.6
NDF 68.1 56.2 29.3 48.5
ADF 44.6 39.3 10.3 28.6
Hemicelluloses 18.0 16.9 18.8 28.3
Lignin 9.3 8.8 2.7 6.99
DOMD 47.1 50.3 82.2 65.3
ME 7.3 7.6 13.1 10.2
DM= Dry matter; EE=Ether extract; CP=crude protein; NDF= Neutral Detergent Fiber; ADF= Acid
Detergent Fiber; DOMD=Digestible organic mater; ME=Metabolizable energy

20
IV. METHODS FOR ESTIMATION OF METHANE EMISSION FROM ENTERIC FERMENTATION
AND MANURE MANAGEMENT IN CATTLE
4.1 Methane emission from enteric fermentation in cattle
Methane is produced in ruminant as a by-product of enteric fermentation, whereby carbohydrates
are broken down by bacteria in the digestive tract. The amount of methane that is produced
depends on: The type of digestive tract. Ruminant livestock have an expansive chamber, the rumen,
which fosters extensive enteric fermentation and high CH4 emissions. The main ruminant livestock
are cattle, goats, sheep, and camel. Non-ruminant livestock (horses, mules, asses) and mono-gastric
livestock (poultry) have relatively lower CH4 emissions because much less CH4-producing digestion
takes place in their digestive systems. Among ruminant species methane emission from sheep and
goat are considered to be small to quantify.
In general methane production by ruminant livestock is influenced by dietary characteristics as
well as the fermentation conditions in the rumen. In addition to the above one methane production
from enteric fermentation depends on production level, stage of lactation, pregnancy, age, size of
livestock (feed intake is positively related to animal size, growth rate, and production e.g., milk
production, or pregnancy) and management related interventions like grazing regime, feeding
regime, housing and milking.
Among Ethiopian livestock species the major contributor to CH4 emission are cattle which account
for 83% of emission. Cattle also represent a large portion of Ethiopian livestock population. As a
result IPCC tier 2 approaches for estimation of methane emissions from enteric fermentation in
cattle is preferable as long as enhanced characterization data available. Detailed country-specific
data (input data) required for determination of feed intake for cattle species are presented in
chapter 2. The Tier 2 method also requires disaggregated livestock population sub-categories (See
chapter 2) to be used to calculate emission factors. The key considerations for the tier 2 method are
collection of detailed activity data (See chapter 2) and the development of emission factors.
The method for estimating methane emission from enteric fermentation using tier 2 methodology
requires three basic steps:
Step 1: Divide the livestock population into subcategory and characterize each sub-category as
described in Chapter 2.
Step 2. Estimate feed intake (gross energy) required for calculation of methane emission factor
Step 3: Calculate methane emission factors for each subcategory in terms of kilograms of
methane per animal per year.
21
Step 4: Multiply the subcategory emission factors by the subcategory populations to estimate
subcategory emission
Step 5. Sum-up the sub-category emission to get total emission from cattle
4.1.1 Calculation of feed intake or gross energy (GE) intake for cattle
Animal performance and diet data are required to estimate feed intake, which is the amount of
energy (MJ/day) an animal needs for maintenance and for activities, growth, lactation, work, and
pregnancy. The equations to estimate feed intake is as follows:
Net energy for maintenance: (NEm) is the net energy required for maintenance, which is the
amount of energy needed to keep the animal in equilibrium where body energy is neither gained
nor lost (Jurgen, 1988).
NEm = Cfi •(Weight)0.75 (Equation 2)
Where:
NEm = Net energy required by the animal for maintenance, MJ per day
Cfi = Coefficients for calculating NEm, MJ per day per kg which varies for each animal category
(0.386 for matured cows; 0.370 for lactating, non lactating and bull and 0.322 for growing cattle)
Weight = live-weight of animal, kg
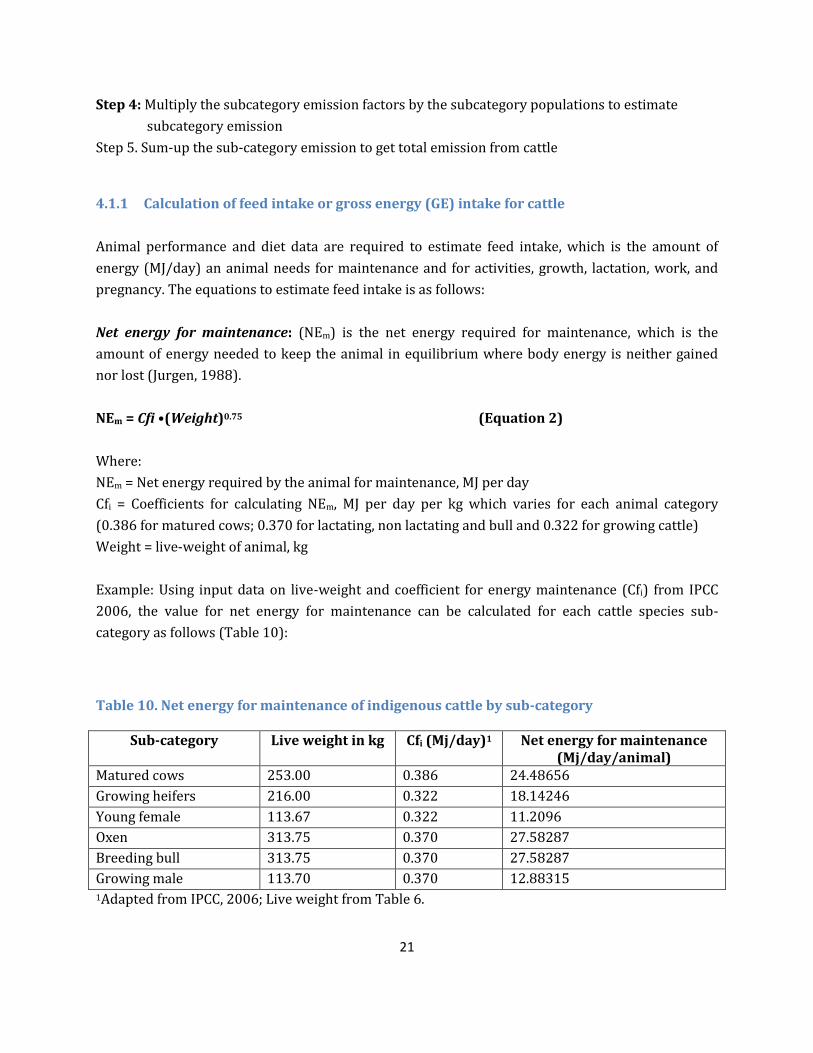
Example: Using input data on live-weight and coefficient for energy maintenance (Cfi) from IPCC
2006, the value for net energy for maintenance can be calculated for each cattle species sub-
category as follows (Table 10):
Table 10. Net energy for maintenance of indigenous cattle by sub-category
Sub-category Live weight in kg Cfi (Mj/day)1 Net energy for maintenance (Mj/day/animal)
Matured cows 253.00 0.386 24.48656
Growing heifers 216.00 0.322 18.14246
Young female 113.67 0.322 11.2096
Oxen 313.75 0.370 27.58287
Breeding bull 313.75 0.370 27.58287
Growing male 113.70 0.370 12.88315 1Adapted from IPCC, 2006; Live weight from Table 6.

22
Net energy for activity: (NEa) is the net energy needed for animals to obtain their food, water and
shelter. It is based on its feeding situation rather than characteristics of the feed itself. The equation
for estimating NEa for cattle is:
NEa = Ca • NEm (Equation 3)
Where:
NEa = net energy for animal activity, MJ per day
Ca = coefficient corresponding to animal’s feeding situation (activity coefficients for stall feed=0,
pasture animal with limited movement=0.17; range grazing animal =0.36)
NEm = net energy required by the animal for maintenance, MJ per day
Example: Calculating net energy for activity
Using the above equation and activity coefficient of 0.36 for grazing animal and 0 for young animals
(IPCC, 2006) the net energy value for activity for each subcategory are presented in the following
table (Table 11).
Table 11. Net energy requirement of indigenous cattle for activity
Sub-category Ca (Activity coefficient)1 Net energy for activity Matured cows 0.36 8.815 Growing heifers 0.36 6.531 Young female 0.36 4.035 Mature male (oxen) 0.36 9.930 Breeding bull 0.36 9.930 Growing male 0.36 4.638
1Adapted from IPCC, 2006
Calculation of Net Energy for growth: (NEg) is the net energy needed for growth (i.e., weight gain;
NRC 1996). Constants (C) for conversion from calories to joules and live to shrunk and empty body
weight have been incorporated into the equation (IPCC, 2006).
The equation for calculating Net Energy for growth in cattle is:
NEg= 22.02 BW/(C* MW)0.75*WG1,097 (Equation 4)
Where:
NEg = net energy needed for growth, MJ per day
BW = the average live weight (BW) of the animal in the population, kg
C = a coefficient with a value of 0.8 for females, 1.0 for castrates and 1.2 for bulls (NRC, 1996)

23
MW = the mature live body weight of an adult animal in moderate body condition, kg
WG = the average daily weight gain of the animals in the population, kg per day
Example of calculating Net Energy for growth
Net energy for growth can be calculated using live-weight, matured weight and daily weight gain of
individual animal in equation 4 for each sub-category. The result is presented in Table 12
Table 12. Estimate of Net Energy for growth requirement of indigenous cattle breed
Sub-category Growth
Coefficient (C )
Live
weight1
Matured
weight1
Weight
gain3
Net energy for
growth
Matured cows 0.8 253 253 0 0
Growing heifers 0.8 216 253 0.3 8.462
Young female 0.8 113.67 253 0.4 5.228
Oxen 1.2 313.75 313.75 0 0
Breeding bull 1.2 313.75 313.75 0.3 7.029
Growing male 1.2 113.7 313.75 0.4 3.283
1Matured weigh of indigenous cattle was estimated using average matured weight of different
breeds (Table 6) 3Daily weight gain was obtained from Boran (Mekonnin et al., 1994 and Horro breed (IAR, 1976) in
Ethiopia
Net energy for lactation: (NEl) is the net energy required for lactation. For cattle the net energy for
lactation is expressed as a function of the amount of milk produced and its fat content expressed as
a percentage (e.g., 4%; NRC, 1989). Both milk production and fat content varies with breed.
The equation for calculating Net Energy for lactation is:
NE1 = Milk • (1.47 + 0.40 • Fat) (Equation 5)
Where:
NEl = Net energy for lactation, MJ per day
Milk = Amount of milk produced, kg of milk per day
Fat = Fat content of milk, % by weight.
24
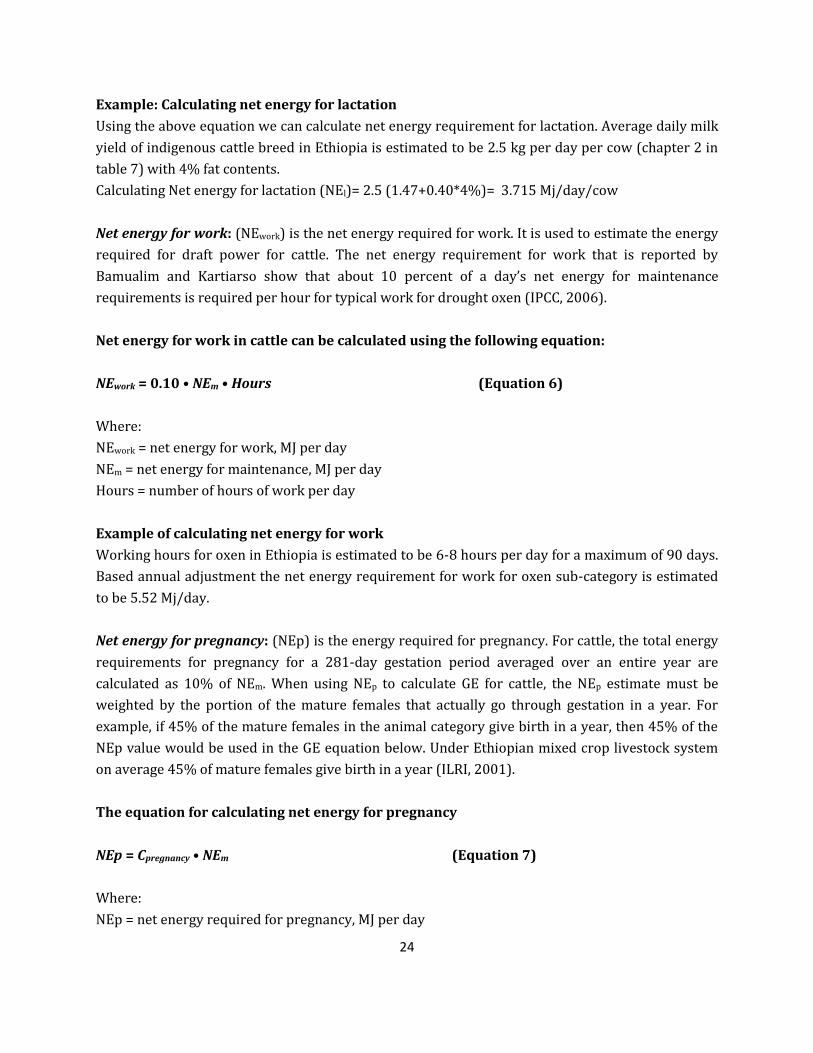
Example: Calculating net energy for lactation
Using the above equation we can calculate net energy requirement for lactation. Average daily milk
yield of indigenous cattle breed in Ethiopia is estimated to be 2.5 kg per day per cow (chapter 2 in
table 7) with 4% fat contents.
Calculating Net energy for lactation (NEl)= 2.5 (1.47+0.40*4%)= 3.715 Mj/day/cow
Net energy for work: (NEwork) is the net energy required for work. It is used to estimate the energy
required for draft power for cattle. The net energy requirement for work that is reported by
Bamualim and Kartiarso show that about 10 percent of a day’s net energy for maintenance
requirements is required per hour for typical work for drought oxen (IPCC, 2006).
Net energy for work in cattle can be calculated using the following equation:
NEwork = 0.10 • NEm • Hours (Equation 6)
Where:
NEwork = net energy for work, MJ per day
NEm = net energy for maintenance, MJ per day
Hours = number of hours of work per day
Example of calculating net energy for work
Working hours for oxen in Ethiopia is estimated to be 6-8 hours per day for a maximum of 90 days.
Based annual adjustment the net energy requirement for work for oxen sub-category is estimated
to be 5.52 Mj/day.
Net energy for pregnancy: (NEp) is the energy required for pregnancy. For cattle, the total energy
requirements for pregnancy for a 281-day gestation period averaged over an entire year are
calculated as 10% of NEm. When using NEp to calculate GE for cattle, the NEp estimate must be
weighted by the portion of the mature females that actually go through gestation in a year. For
example, if 45% of the mature females in the animal category give birth in a year, then 45% of the
NEp value would be used in the GE equation below. Under Ethiopian mixed crop livestock system
on average 45% of mature females give birth in a year (ILRI, 2001).
The equation for calculating net energy for pregnancy
NEp = Cpregnancy • NEm (Equation 7)
Where:
NEp = net energy required for pregnancy, MJ per day

25
Cpregnancy = pregnancy coefficient (0.10)
NEm = net energy required by the animal for maintenance, MJ per day
Example of calculating Net energy for pregnancy: Using the above equation multiply the net
energy for maintenance for matured cow sub-category (Table 10) by the pregnancy coefficient
value of 0.1 (IPCC, 2006) and herd pregnancy rate (45%). The result in net energy requirement for
pregnancy is then=1.10 Mj/day/cow.
Calculation of ratio of net energy available in diet for maintenance to digestible energy
consumed (REM)
Ratio of net energy available in diet for maintenance to digestible energy consumed (REM) is
required to estimate gross energy: For cattle, the ratio of net energy available in a diet for
maintenance to digestible energy consumed (REM) is estimated using the following equation (Gibbs
and Johnson, 1993):
REM= 1.123-(4.092*10 -3)*DE%+(1.126*10 -5)*DE% 2 (Equation 8)
Where:
REM = ratio of net energy available in a diet for maintenance to digestible energy consumed
DE% = digestible energy expressed as a percentage of gross energy
Example for calculation of REM: using DE% value of 50% from Table 8. (Crop residue and grazing
based system)
REM= 1.123-(4.092*10 -3)*50%+(1.126*10 -5)*50% 2= 1.1201
Calculation of the ratio of net energy available in the diet for growth to digestible energy
consumed (REG)
Ratio of net energy available in diet for growth to digestible energy consumed (REG) is required to
estimate gross energy: For cattle, the ratio of net energy available in a diet for growth to digestible
energy consumed (REG) is estimated using the following equation (Gibbs and Johnson, 1993):
REG=1.164-(5.160*10-3*DE%)+(1.308*10-5*DE%2) (Equation 9)
Where
REG = ratio of net energy available for growth in a diet to digestible energy consumed
DE% = digestible energy expressed as a percentage of gross energy

26
Example of calculating REG using DE% value of 50% from Table 8 (crop residue and grazing based
system)
REG=1.164-(5.160*10-3*50%)+(1.308*10-5*50%2) = 1.1614
Calculating Gross Energy, GE: GE requirement is derived based on the summed net energy
requirements and the energy availability characteristics of the feed(s) using the following equation.
The equation for calculating GE is
GE = (NEm+NEa+NEwork+NEL+NEp) + (NEg) (Equation 10)
REM REG
DE%/100
Substituting the entire net energy intake obtained in the above steps (Equation 1-8) in this equation
(equation 10) together with DE% value (Table 9), can result in GE estimated value in Table 13
bellow. Digestibility value of 55% upper limit for grazing and crop reside feed was taken (IPCC,
2006)
Table 13. Calculating gross energy (GE) for indigenous cattle species by sub-category
Sub-category Gross energy (GE) Mj/animal/day
Matured cows 6806.895
Growing heifers 5864.946
Young female 3623.749
Mature male (oxen) 7683.801
Breeding bull 7910.588
Growing male 3694.803
Determination of methane conversion factor (Ym)
The extent to which feed energy is converted to CH4 depends on several interacting feed and animal
factors. CH4 conversion factors for livestock species and diet type specific to Ethiopia are not
available; the values provided in Table 14 are adapted from IPCC, 2006 and can be used for cattle
species sub-category. These general estimates are a rough guide based on the general feed
characteristics and production practices found in different part of many developed and developing
countries. When good feed is available (i.e., high digestibility and high energy value) the lower
bounds should be used. When poorer feed is available, the higher bounds are more appropriate. A
CH4 conversion factor of zero is assumed for all juveniles consuming only milk (i.e., milk-fed calves).
27
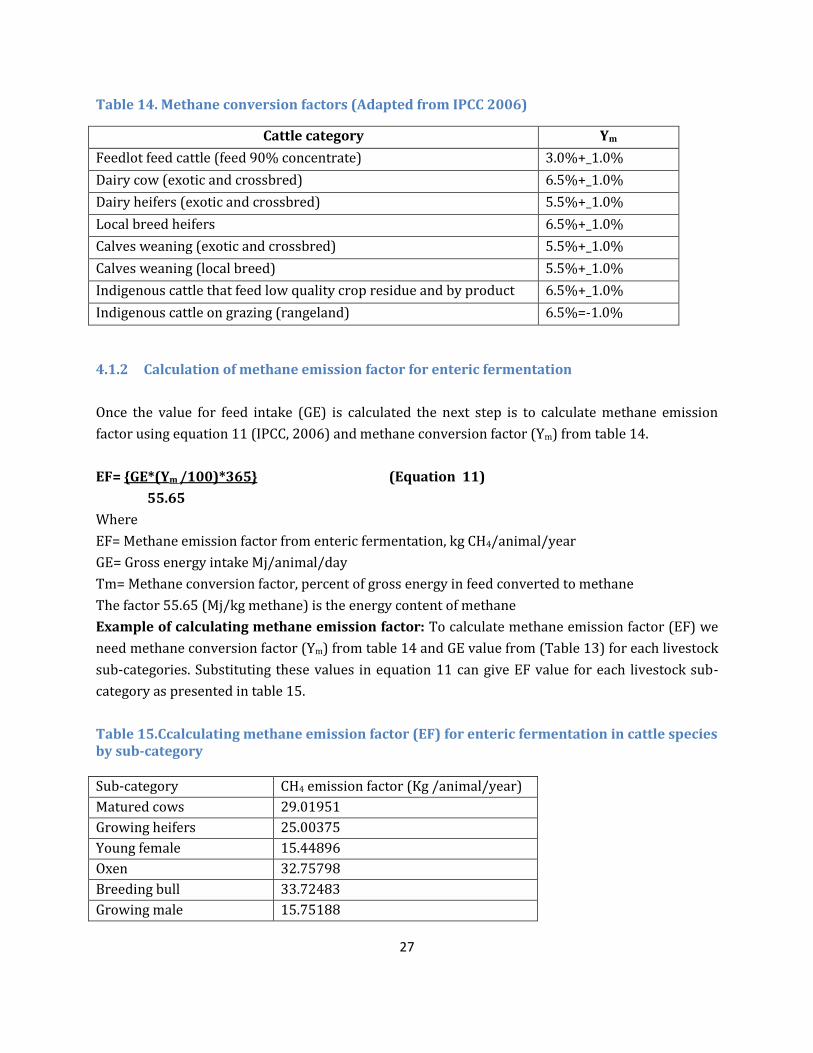
Table 14. Methane conversion factors (Adapted from IPCC 2006)
Cattle category Ym
Feedlot feed cattle (feed 90% concentrate) 3.0%+_1.0%
Dairy cow (exotic and crossbred) 6.5%+_1.0%
Dairy heifers (exotic and crossbred) 5.5%+_1.0%
Local breed heifers 6.5%+_1.0%
Calves weaning (exotic and crossbred) 5.5%+_1.0%
Calves weaning (local breed) 5.5%+_1.0%
Indigenous cattle that feed low quality crop residue and by product 6.5%+_1.0%
Indigenous cattle on grazing (rangeland) 6.5%=-1.0%
4.1.2 Calculation of methane emission factor for enteric fermentation
Once the value for feed intake (GE) is calculated the next step is to calculate methane emission
factor using equation 11 (IPCC, 2006) and methane conversion factor (Ym) from table 14.
EF= {GE*(Ym /100)*365} (Equation 11)
55.65
Where
EF= Methane emission factor from enteric fermentation, kg CH4/animal/year
GE= Gross energy intake Mj/animal/day
Tm= Methane conversion factor, percent of gross energy in feed converted to methane
The factor 55.65 (Mj/kg methane) is the energy content of methane
Example of calculating methane emission factor: To calculate methane emission factor (EF) we
need methane conversion factor (Ym) from table 14 and GE value from (Table 13) for each livestock
sub-categories. Substituting these values in equation 11 can give EF value for each livestock sub-
category as presented in table 15.
Table 15.Ccalculating methane emission factor (EF) for enteric fermentation in cattle species by sub-category Sub-category CH4 emission factor (Kg /animal/year)
Matured cows 29.01951
Growing heifers 25.00375
Young female 15.44896
Oxen 32.75798
Breeding bull 33.72483
Growing male 15.75188

28
Total methane emission from enteric fermentation can be calculated by multiplying sub-category
emission factor with number of animal in each sub-category and sum-up the sub-categories to
arrive at total emission from cattle (Table 16)
Table 16. Example of methane emission from enteric fermentation indigenous cattle in Ethiopia Sub-category Number of animal1 Total CH4 emission( kg/
year) Matured cows 20545625 596223970
Growing heifers 1972285 49314521
Young female 2958427 45704620
Oxen 12000000 393095760
Breeding bull 3846111 129709440
Growing male 4095873 64517700
Total 55067082 1356390204 1 CSA, 2013
4.2 Methane emission from manure management in cattle
This section present on how to estimate CH4 produced during the storage and treatment of manure
and from manure deposited on pasture. The term ‘manure’ is used here collectively to include both
dung and urine (i.e., the solids and the liquids) produced by livestock (IPCC, 2006).
Manure (and urine) management releases both CH4 and N2O, although the emissions of these GHGs
are influenced by different factors. CH4 is emitted during the storage and treatment of manure
under anaerobic conditions.
CH4 is most readily emitted when:
Large numbers of animals are managed in a confined area (e.g., dairy farms,
commercial feedlots, and poultry farms).
When manure is stored or treated as a liquid (e.g., in lagoons, ponds, tanks, or pits)
When manure is handled as a solid (e.g., in stacks or piles) or when it is deposited
onto pastures and rangelands, it tends to decompose under more aerobic
conditions, producing less CH4.
Manure related emissions result from the anaerobic decay of organic material in livestock manure.
Manure management systems that promote anaerobic conditions such as liquid/slurry storage
facilities and anaerobic lagoons produce the most methane. A relatively small percentage of
livestock manure is managed in this manner in Ethiopia and emission of methane from these
systems is negligible. Manure spreading directly on soils and pastureland, and composing maintain

29
aerobic conditions and have limited methane production potential. Manure spreading on soils,
crops and pastureland is the most common practice in extensive systems in Ethiopia.
Because of lack of country specific data on VS rates, manure conversion factor ( MCF) values,
maximum methane producing capacity (Bo) values, specific to Ethiopia, tier 1 methodology using
IPCC default emission factor were used to estimate CH4 emission from manure management. The
share of methane emission from manure management is not significant (less than 10% of total
emission from livestock in Ethiopia which imply currently there is no need to collect data for higher
tiers (IPCC, 2006). Tier 1 is a simplified method used to estimate methane emission it only requires
basic characterization (livestock population data by animal species/category) and temperature
data, in combination with IPCC default emission factors.
Calculation of methane emission from manure management (tier 1)
CH4manure= Σ(T) (EF(t)*N(T)) (Equation 12)
Where:
CH4manure = CH4 emissions from manure management, for a defined cattle population category, kg
CH4 per year
EF(t) = emission factor for the defined livestock population, kg CH4 per head per year
N(T) = the number of head of livestock species/category/sub-category T
T = species/category/sub-category of livestock
IPCC, default emission factors by average annual temperature are presented in (Table 17.) for cattle
population. These emission factors are adapted from IPCC developed for Africa the region that most
closely matches the animal operations in Ethiopia. Table 18 shows the default emission factors for
different livestock and temperature classification. Emission factors are listed by the annual average
temperature. The temperature data should be based on CSA or national meteorological statistics,
where available. It may be good practice to estimate the percentage of animal populations in
different temperature zones and compute a weighted average emission factor. Where this is not
possible, the annual average temperature for the entire country could be utilized.
Table 17. Dairy cows default methane emission factor from manure management (Adapted IPCC, 2006) Sub-category CH4 emission factor by average annual temperature (o
C) Cool Temperate Warm
Livestock species Less than 15 15-25 Greater than 26
Mature cow 1 1 1 Growing and young cattle 1 1 1

30
For indigenous cattle based on 45% of manure usage is for pasture/rangeland/grazing land Table 18. Example of calculation of methane emission from manure management
Sub-category Indigenous
cattle Population1
CH4 emission factor (Kg Ch4/animal/year for Temperature (15-
25 0C)
CH4 emission from cattle sub-category (Kg CH4/year)
Matured cows 20545625 1 20545625
Growing heifers 1972285 1 1972285
Young female 2958427 1 2958427
Oxen 12000000 1 12000000
Breeding bull 3846111 1 3846111
Growing male 4095873 1 4095873
Total 55067082 1 55067082 1CSA, 2013; Assume temperature between 15-25 0C in highland
31
V. METHODS FOR ESTIMATION OF NITROUS OXIDE EMISSION FROM MANURE MANAGEMENT
IN CATTLE
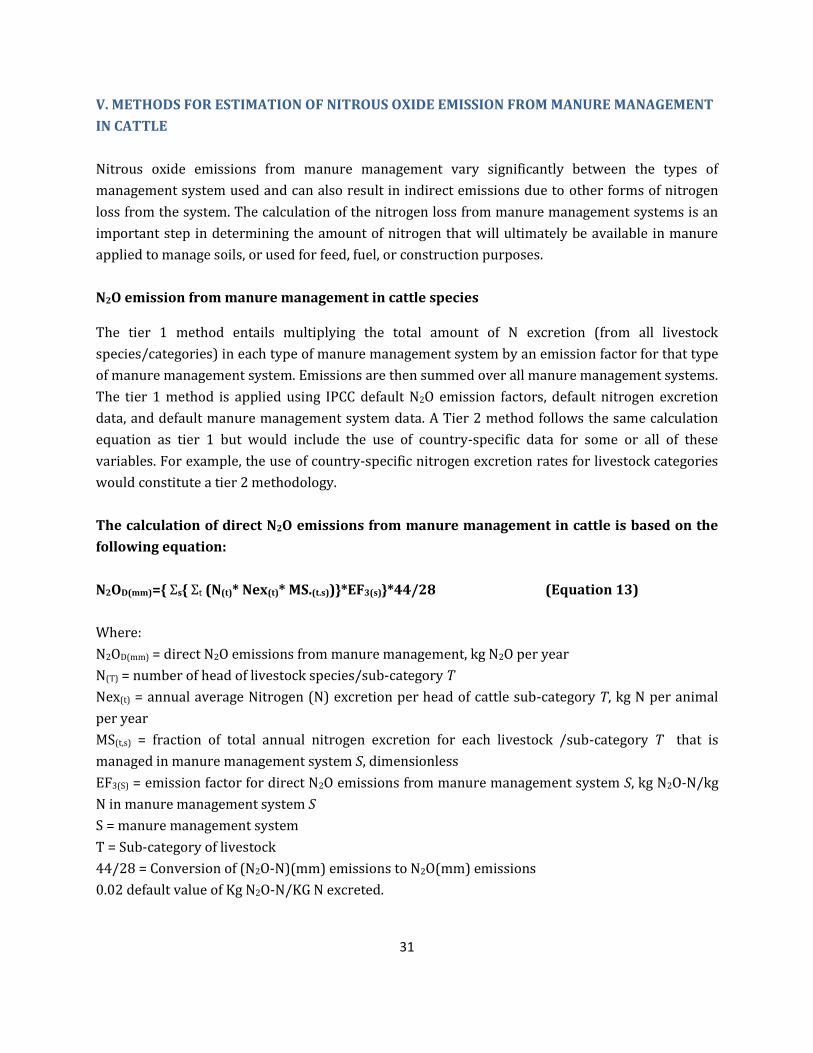
Nitrous oxide emissions from manure management vary significantly between the types of
management system used and can also result in indirect emissions due to other forms of nitrogen
loss from the system. The calculation of the nitrogen loss from manure management systems is an
important step in determining the amount of nitrogen that will ultimately be available in manure
applied to manage soils, or used for feed, fuel, or construction purposes.
N2O emission from manure management in cattle species
The tier 1 method entails multiplying the total amount of N excretion (from all livestock
species/categories) in each type of manure management system by an emission factor for that type
of manure management system. Emissions are then summed over all manure management systems.
The tier 1 method is applied using IPCC default N2O emission factors, default nitrogen excretion
data, and default manure management system data. A Tier 2 method follows the same calculation
equation as tier 1 but would include the use of country-specific data for some or all of these
variables. For example, the use of country-specific nitrogen excretion rates for livestock categories
would constitute a tier 2 methodology.
The calculation of direct N2O emissions from manure management in cattle is based on the
following equation:
N2OD(mm)={ Σs{ Σt (N(t)* Nex(t)* MS.(t.s))}*EF3(s)}*44/28 (Equation 13)
Where:
N2OD(mm) = direct N2O emissions from manure management, kg N2O per year
N(T) = number of head of livestock species/sub-category T
Nex(t) = annual average Nitrogen (N) excretion per head of cattle sub-category T, kg N per animal
per year
MS(t,s) = fraction of total annual nitrogen excretion for each livestock /sub-category T that is
managed in manure management system S, dimensionless
EF3(S) = emission factor for direct N2O emissions from manure management system S, kg N2O-N/kg
N in manure management system S
S = manure management system
T = Sub-category of livestock
44/28 = Conversion of (N2O-N)(mm) emissions to N2O(mm) emissions
0.02 default value of Kg N2O-N/KG N excreted.

32
Estimation of nitrogen (N) excretion rate in cattle using tier 2 methodologies
The annual amount of N excreted by each livestock sub-category depends on the total annual N
intake and total annual N retention of the animal. Therefore, N excretion rates can be derived from
N intake and N retention data. Annual N intake (i.e., the amount of N consumed by the animal
annually) depends on the annual amount of feed digested by the animal, and the protein (CP)
content of that feed. Total feed intake depends on the production level of the animal (e.g., growth
rate, milk production, draft power). Annual N retention (i.e., the fraction of N intake that is retained
by the animal for the production of meat or milk) is a measure of the animal's efficiency of
production of animal protein from feed protein.
Nitrogen intake can be calculated from data on feed and crude protein intake developed in chapter
2 and 3. Default N retention values are provided (0.02 for dairy cattle and 0.07 for other cattle;
IPCC, 2006). Rates of annual N excretion for each livestock species/sub-category (Nex(T)) are
derived as follows (Equation 14):
Nex(T ) = N intake(T ) • (1− N retention(T ) ) (Equation 14)
Where:
Nex(T) = annual N excretion rates, kg N per animal per year
Nintake(T) = the annual N intake per head of animal of sub-category T, kg N per animal per year
Nretention(T) = fraction of annual N intake that is retained by animal of sub-category T, dimensionless
Example of Tier 2 method for estimating nitrogen excretion for cattle
Nitrogen excretion may be calculated based on the same dietary assumptions used in estimating
enteric fermentation emissions. The amount of nitrogen excreted by cattle can be estimated as the
difference between the total nitrogen taken in by the animal and the total nitrogen retained for
growth and milk production. Equations 15 and 16 can be used to calculate the variables for
nitrogen intake and nitrogen retained for use in Equation 13. The total nitrogen intake is derived as
follows:
Nintake(T)= GE/18.45*(CP%/100/6.25) (Equation 15)
Where:
Nintake(T) = daily N consumed per animal of sub-category T, kg N per animal per year
GE = gross energy intake of the animal, in enteric fermentation model, MJ per animal per day
18.45 = conversion factor for dietary GE per kg of dry matter of, MJ per kg. This value is relatively
constant across a wide range of forage and grain-based feeds commonly consumed by livestock.
CP% = percent crude protein in diet
33
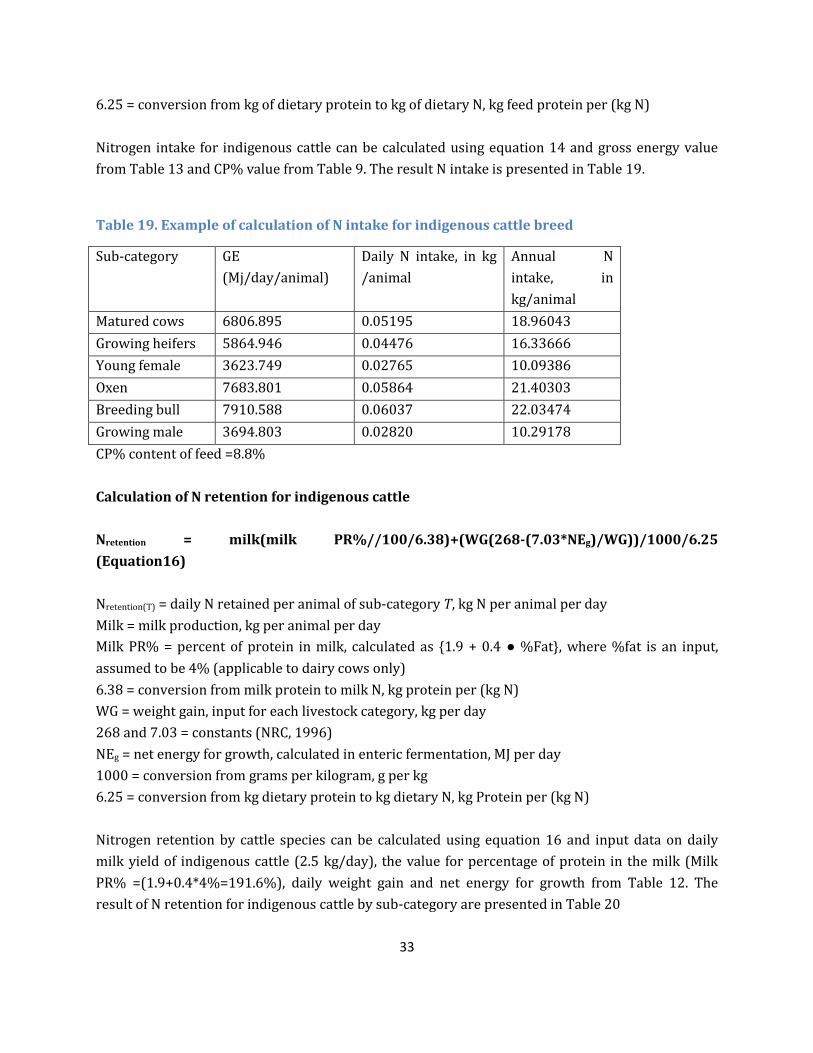
6.25 = conversion from kg of dietary protein to kg of dietary N, kg feed protein per (kg N)
Nitrogen intake for indigenous cattle can be calculated using equation 14 and gross energy value
from Table 13 and CP% value from Table 9. The result N intake is presented in Table 19.
Table 19. Example of calculation of N intake for indigenous cattle breed
Sub-category GE
(Mj/day/animal)
Daily N intake, in kg
/animal
Annual N
intake, in
kg/animal
Matured cows 6806.895 0.05195 18.96043
Growing heifers 5864.946 0.04476 16.33666
Young female 3623.749 0.02765 10.09386
Oxen 7683.801 0.05864 21.40303
Breeding bull 7910.588 0.06037 22.03474
Growing male 3694.803 0.02820 10.29178
CP% content of feed =8.8%
Calculation of N retention for indigenous cattle
Nretention = milk(milk PR%//100/6.38)+(WG(268-(7.03*NEg)/WG))/1000/6.25
(Equation16)
Nretention(T) = daily N retained per animal of sub-category T, kg N per animal per day
Milk = milk production, kg per animal per day
Milk PR% = percent of protein in milk, calculated as {1.9 + 0.4 ● %Fat}, where %fat is an input,
assumed to be 4% (applicable to dairy cows only)
6.38 = conversion from milk protein to milk N, kg protein per (kg N)
WG = weight gain, input for each livestock category, kg per day
268 and 7.03 = constants (NRC, 1996)
NEg = net energy for growth, calculated in enteric fermentation, MJ per day
1000 = conversion from grams per kilogram, g per kg
6.25 = conversion from kg dietary protein to kg dietary N, kg Protein per (kg N)
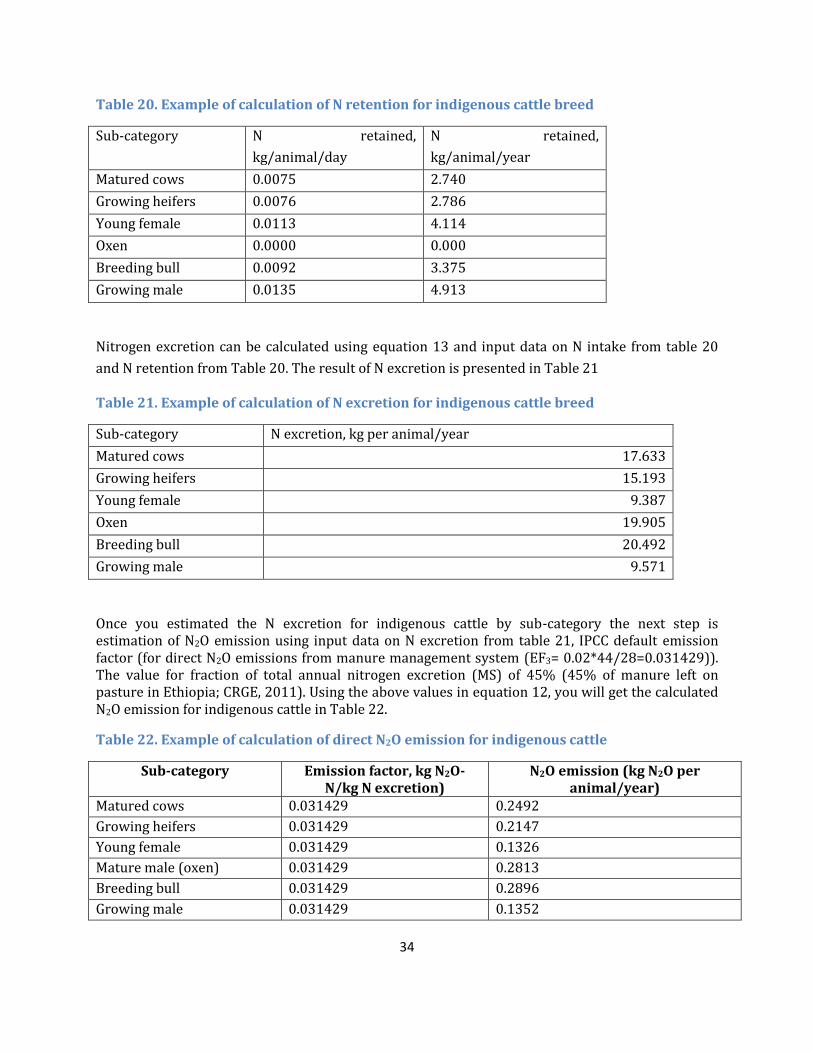
Nitrogen retention by cattle species can be calculated using equation 16 and input data on daily
milk yield of indigenous cattle (2.5 kg/day), the value for percentage of protein in the milk (Milk
PR% =(1.9+0.4*4%=191.6%), daily weight gain and net energy for growth from Table 12. The
result of N retention for indigenous cattle by sub-category are presented in Table 20
34
Table 20. Example of calculation of N retention for indigenous cattle breed
Sub-category N retained,
kg/animal/day
N retained,
kg/animal/year
Matured cows 0.0075 2.740
Growing heifers 0.0076 2.786
Young female 0.0113 4.114
Oxen 0.0000 0.000
Breeding bull 0.0092 3.375
Growing male 0.0135 4.913
Nitrogen excretion can be calculated using equation 13 and input data on N intake from table 20
and N retention from Table 20. The result of N excretion is presented in Table 21
Table 21. Example of calculation of N excretion for indigenous cattle breed
Sub-category N excretion, kg per animal/year
Matured cows 17.633
Growing heifers 15.193
Young female 9.387
Oxen 19.905
Breeding bull 20.492
Growing male 9.571
Once you estimated the N excretion for indigenous cattle by sub-category the next step is estimation of N2O emission using input data on N excretion from table 21, IPCC default emission factor (for direct N2O emissions from manure management system (EF3= 0.02*44/28=0.031429)). The value for fraction of total annual nitrogen excretion (MS) of 45% (45% of manure left on pasture in Ethiopia; CRGE, 2011). Using the above values in equation 12, you will get the calculated N2O emission for indigenous cattle in Table 22.
Table 22. Example of calculation of direct N2O emission for indigenous cattle
Sub-category Emission factor, kg N2O-N/kg N excretion)
N2O emission (kg N2O per animal/year)
Matured cows 0.031429 0.2492
Growing heifers 0.031429 0.2147
Young female 0.031429 0.1326
Mature male (oxen) 0.031429 0.2813
Breeding bull 0.031429 0.2896
Growing male 0.031429 0.1352

35
The average N2O emission calculated for each animal by sub-category can be multiplied by cattle
population number to get the total sub-category emission in kg per year. (See Table 23)
Table 23. Example of calculation of total direct N2O emission for indigenous cattle
Sub-category of indigenous
cattle
Population number Total N2O emission
(kg /year)
Matured cows 20545625 5119970
Growing heifers 1972285 423449.6
Young female 2958427 392287.4
Oxen 12000000 3375600
Breeding bull 3846111 1113834
Growing male 4095873 553762
Total 55067082 11646931

36
VI. GREEN HOUSE GAS EMISSION REPORTING
GHG emission can be reported at different level depending on the country requirement. The
approach for Ethiopia condition is to sum-up the different livestock species category emission to
get the total GHG emission from livestock species at farm level (house hold level) then the
household level emission can be aggregated to village level. The village level report can be
aggregated to woreda level, and woreda level reports to regional level. The regional GHG emission
data will be summed-up to get the national level emission report. The various GHG estimate can be
conversion to carbon dioxide equivalent (tCO2e) to arrive at one GHG emission factor. A summary of
CH4 and N2O emission factors estimated for indigenous cattle in Ethiopia, in unit of kg /animal/year
and in tCO2e/animal/year are indicated in Table 24 and Table 25 respectively.
The total GHG emission from indigenous cattle in 2013 in Ethiopia is estimated to be 36 million tCO2 equivalents. The major contributor is CH4 from enteric fermentation 86% of total emission. CH4 and N2O from manure management contributed only 3.5% and 9.6% of total GHG emission respectively (Table 26). Table 24. CH4 and N2O emission factor (kg/animal/year) for indigenous cattle in Ethiopia tier 2 methodology
Sub-category CH4 emission from Enteric fermentation (kg/animal)
CH4 emission from manure management (kg/animal)
Total CH4 emission (kg/animal)
N2O emission (direct)
(kg/animal/year)
Matured cows 29.01951 1 30.01951 0.2492
Growing heifers 25.00375 1 26.00375 0.2147
Young female 15.44896 1 16.44896 0.1326
Mature male (oxen) 32.75798 1 33.75798 0.2813
Breeding bull 33.72483 1 34.72483 0.2896
Growing male 15.75188 1 16.75188 0.1352
Table 25. Green house gas (CH4+N2O) mission factors in tone of carbon dioxide equivalent for indigenous cattle in Ethiopia
Sub-category CH4 emission (tCO2e/animal/year)
N2O emission (tCO2e/animal/year)
GHG emission factor (tCO2e/animal/year)
Matured cows 0.690449 0.073763 0.764212
Growing heifers 0.598086 0.063551 0.661637
Young female 0.378326 0.03925 0.417576
Mature male (oxen) 0.776434 0.083265 0.859698
Breeding bull 0.798671 0.085722 0.884393
Growing male 0.385293 0.040019 0.425312
To converter to CO2 equivalent; Kg CH4/Kg CO2 = 23; Kg N2O/Kg CO2=296

37
Table 26. Example of calculation of total GHG emission for indigenous cattle in Ethiopia for year 2013
CH4 emission N2O (direct) emission
Total GHG emission Sub-category Unit Enteric
fermentation Manure management
Matured cows tCO2 /year 13713151.3 472549.4 1515511.05 15701212 Growing heifers tCO2 /year 1134233.98 45362.56 125341.078 1304938 Young female tCO2 /year 1051206.26 68043.82 116117.076 1235367 Mature male (oxen) tCO2 /year 9041202.48 276000 999177.6 10316380 Breeding bull tCO2 /year 2983317.12 88460.55 329694.789 3401472 Growing male tCO2 /year 1483907.1 94205.08 163913.561 1742026 Total tCO2 /year 31196974.7 1266543 3447491.71 35,911,009 To converter to CO2 equivalent; Kg CH4/Kg CO2 = 23; Kg N2O/Kg CO2=296
38
REFERENCE
AFRC, Technical Committee on Responses to Nutrients (1990). Nutritive Requirements of Ruminant
Animals:Energy. Rep. 5, CAB International, Wallingford, U.K.
Alemayehu and Tegegn Fentahun, 2012. The effect of climate change on ruminant livestock
population dynamics in Ethiopia. Livestock Research for Rural Development 24 (10) 2012
Alan, D. 2008. Strategies to Reduce Greenhouse Gas Emissions through feeding and Grazing
management. Swift Current Research Centre EMBO Rep. 2008 June; 9(6): 508–511.
Asman, W.A.H., Sutton, M.A. and Schjoerring, J.K. 1998. Ammonia: emission, atmospheric transport
and deposition. New Phytol., 139, p. 27-48
CRGE (Ethiopia’s Climate Resilience Green Economy) 2011.Green Economy Strategy, Federal
Republic of Ethiopia.
EPA (Environmental Protection Agency). 2003. Global Warming-Emissions. U.S. Environmental
Protection Agency.
Francis, G., Kerem, Z., Makkar, H.S.P. & K. Becker, 2002. The biological action of saponins in animal
systems: a review. Br. J. Nutr., 88, 687-605.
Frank O’Mara, Michael Ryan, John Connolly, Pat O’Toole, Owen Carton, J.J. Lenehan, Dan Lovett,
Bernard Hyde, Eddie Jordan and Michael Hawkins. 2000. Climate Change Emissions of
Greenhouse Gases from Agriculture and Strategies for their Reduction (2000-LS-5.1.1)
Synthesis Report. UCD School of Agriculture, Food Science and Veterinary Medicine
Teagasc, Johnstown Castle Research Centre, Co. Wexford, Ireland.
(www.epa.ie/EnvironmentalResearch/ReportsOutput)
Gibbs, M.J. and Johnson, D.E. (1993). "Livestock Emissions." In: International Methane Emissions, US
Environmental Protection Agency, Climate Change Division, Washington, D.C., U.S.A.
Gibbs, M.J., Conneely, D., Johnson, D., Lassey, K.R. and Ulyatt, M.J. (2002). CH4 emissions
from enteric fermentation. In: Background Papers: IPCC Expert Meetings on Good Practice
Guidance and Uncertainty Management in National Greenhouse Gas Inventories, p 297–320.
IPCC-NGGIP, Institute for Global Environmental Strategies (IGES), Hayama, Kanagawa,
Japan.
39
Gebeyhu Goshu, 1999. Reproductive and productive performance of Friesian-Boran crossbred
Cattle at Cheffa State farm, Wollo, Ethiopia. Msc. Thesis, School of Graduate studies,
Alemaya University
Green House Gas Protocol, 2012. Agricultural Guidance draft document, a sector specific
supplementation to corporate standard for agriculture, horticulture and fisheries.
Agricultural Protocol, World Resource Institute (WRI).
http://www.ghgprotocol.org/standards/agriculture-guidance.
IPCC, 2001. In: Houghton, J.T., et al. (Eds.), Climate Change 2001: The Scientific Background, vol. 94.
Cambridge University Press, Cambridge, UK.
International Panel for Climate Change (PCC, 2006). Guideline for National Green House Gas
Inventory, Agriculture, forestry and other land use, Chapter 10 emission from Livestock and
manure management.
Jurgen, M.H. (1988). Animal Feeding and Nutrition, Sixth Edition, Kendall/Hunt Publishing
Company, Dubuque, Iowa, U.S.A.
Keberu Belayneh, 2000. Milk production and Lactation persistency of crossbred (Friesian * Arsi)
cattle at Agarfa Multipurpose training centre, Bale, Ethiopia. Msc. Thesis School of Graduate
studies, Alemaya University
Kiwuwa, G.H., Trail J.C. Yousef, M., Worku, G., Anderson F.M. and Durkin. J., 1983. Crossbred dairy
cattle productivity in Arsi region, Ethiopia. ILCA Research Report. No. 1. Addis Ababa,
Ethiopia. p29.
Mekonne Haile-Mariam and Goshu Mekonnen. 1987. Reproductive performance of Fogera cattle
and their Friesian crosses at Gonder, Ethiopia. Eth. J. Agri. Sci. 9:95-114
Million Tdesse, Tadelle Dessei Gifawesn Tesema, Tamirte Degefa and Yohanis Gojam 2006. Study on
Age at first calving, calving interval and breeding efficiency of Bos tauruus, Bos indicus and their
crosses in the highlands of Ethiopia, EJAP (6) 2. PP 1-16
Million T., Tadelle D. and Egbert K. 2004. Genetic and Non genetic Effects on productive and
Reproductive Parameters of Arsi Cattle and their Holestien Friesian crosses in Ethiopia, Eth.
J.Anim.Prod. 4(1). 71-79
Million Tadesse and Tadelle Dessie, 2003. Milk production performance of Zebu, Holstein Friesian
and their crosses in Ethiopia. Livest. Res. Rural Develop., 15:31-40.
40
National Research Council (NRC) (1996). Nutrient Requirements of Beef Cattle, 7th Edit., Nat. Acad.
Press, Washington, DC.
Mills, J.A.N., Dijkstra, J., Bannink, A., Cammell, S.B., Kebreab, E. & J. France, 2001. A mechanistic
model of whole-tract digestion and methanogenesis in the lactating dairy cow: Model
development, evaluation, and application. J. Anim. Sci., 79, 1584-1597
Moss, A.R., Jouany, J.-P. & J. Newbold, 2000. Methane production by ruminants: its contribution to
global warming. Ann. Zootech., 49, 2004, 231-253.
Monteny, G.J. and Erisman, J.W. 1998. Ammonia emissions from dairy cow buildings: A review of
measurement techniques, influencing factors and possibilities for reduction. Neth. J. Agric.
Sci., 46, Pp. 225-247.
National Research Council (NRC) (1996). Nutrient Requirements of Beef Cattle, 7th Revised Ed.,
Nat. Acad. Press, Washington., DC
National Research Council (NRC) (1989). Nutrient Requirements of Dairy Cattle, 6th Ed., Nat. Acad.
Press, Washington, DC.
Nicks, B., Laitat, M., Vandenheede, M., Desiron, A., Verhaege, C. and Canart, B. (2003). Emissions of
Ammonia, Nitrous Oxide, Methane, Carbon Dioxide, and Water Vapor in the Raising of
Weaned Pigs on Straw-Based and Sawdust-Based Deep Litters. Animal Research Journal,
52: pp. 299-308.
Seyoum Bediye, Zinash Sileshi and Dereje Fekadu. 2007. Chemical Composition and Nutritive
Values of Ethiopian Feeds. EIAR, Addis Ababa, Ethiopia.