Ghana: Agriculture Sector Policy Note - Documents &...
63
. Ghana: Agriculture Sector Policy Note Transforming Agriculture for Economic Growth, Job Creation and Food Security . June 2017 . Agriculture Global Practice AFR01 AFRICA . . Public Disclosure Authorized Public Disclosure Authorized Public Disclosure Authorized Public Disclosure Authorized
Transcript of Ghana: Agriculture Sector Policy Note - Documents &...
.
Ghana: Agriculture Sector Policy Note
Transforming Agriculture for Economic Growth, Job Creation and Food Security
. June 2017
. Agriculture Global Practice AFR01
AFRICA
.
.
Pub
lic D
iscl
osur
e A
utho
rized
Pub
lic D
iscl
osur
e A
utho
rized
Pub
lic D
iscl
osur
e A
utho
rized
Pub
lic D
iscl
osur
e A
utho
rized
Standard Disclaimer:
.
This volume is a product of the staff of the International Bank for Reconstruction and Development/ The World Bank. The findings,
interpretations, and conclusions expressed in this paper do not necessarily reflect the views of the Executive Directors of The World Bank
or the governments they represent. The World Bank does not guarantee the accuracy of the data included in this work. The boundaries,
colours, denominations, and other information shown on any map in this work do not imply any judgment on the part of The World Bank
concerning the legal status of any territory or the endorsement or acceptance of such boundaries.
.
Copyright Statement:
.
The material in this publication is copyrighted. Copying and/or transmitting portions or all of this work without permission may be a
violation of applicable law. The International Bank for Reconstruction and Development/ The World Bank encourages dissemination of
its work and will normally grant permission to reproduce portions of the work promptly.
For permission to photocopy or reprint any part of this work, please send a request with complete information to the Copyright Clearance
Center, Inc., 222 Rosewood Drive, Danvers, MA 01923, USA, telephone 978-750-8400, fax 978-750-4470, http://www.copyright.com/.
All other queries on rights and licenses, including subsidiary rights, should be addressed to the Office of the Publisher, The World Bank,
1818 H Street NW, Washington, DC 20433, USA, fax 202-522-2422, e-mail [email protected].
Acknowledgements
This note has been prepared by the team of Bank staff and consultants based on a number of sector
studies and reports from analytical work undertaken over the last few years either through the
Economic Sector Work (P133833) or other analytical studies undertaken to support the existing
investment projects. The primary author of the note and TTL of the ESW is Johannes (Hans)
Jansen, Senior Agricultural Economist. Other team members who provided various inputs include:
Kadir Osman Gyasi (Senior Agricultural Economist), Paul Siegel (Consultant) and Hardwick
Tchale (Senior Agricultural Economist). The overall leadership for this work was provided by
Simeon Ehui, Practice Manager for Agriculture in the West Africa Region.
Ghana: Agriculture Sector Policy Note
Transforming Agriculture for Economic Growth, Job Creation
and Food Security
The World Bank Group
Agriculture Global Practice
West Africa (AFR01)
June 20, 2017
1
ACRONYMS AND ABBREVIATIONS
[1 US$ = GHC 4.1]
AGRA Africa Green Revolution Alliance
ASTI Agricultural Science and Technology Institute
ASWG Agriculture Sector Working Group
ARI Animal Research Institute
AAIP Afghanistan Agricultural Inputs Project
CAADP Comprehensive African Agriculture Development Program
CGIAR Consultative Group for International Agricultural Research
CHED Cocoa Health and Extension Division
CMC Cocoa Marketing Company
CSDS Cocoa Sector Development Strategy
CSSVD Cocoa Swollen Shoot Virus Disease
COCOBOD Ghana’s Cocoa Board
CSIR Council for Scientific and Industrial Research
COCOSHE Cocoa Coffee Sheanut Association
CRIG Crops Research Institute of Ghana
DPs Development Partners
ECOWAS Economic Community of West African States
FAO Food and Agriculture Organization
FASDEP Food and Agriculture Sector Development Policy
FORIG Forestry Research Institute of Ghana
FRI Food Research Institute
GCP Ghana Cocoa Platform
GCAP Ghana Commercial Agriculture Project
GCLMS Ghana Child Labor Monitoring System
GIDA Ghana Irrigation Development Authority
GDP Gross Domestic Product
GSS
ICOUR
Ghana Statistical Services
Irrigation Company of the Upper Region of Ghana
IFPRI International Food Policy Research Institute
IWMI International Water Management Institute
KIS Kpong Irrigation Scheme
KLBIP Kpong Left Bank Irrigation Project
MESTI Ministry of Environment, Science, Technology and Innovation
METASIP Medium-Term Agriculture Sector Investment Plan
MLNR Ministry of Lands and Natural Resources
MOFA Ministry of Food and Agriculture
NAFCO National Food Buffer Stock Company
NPECLC National Program for the Elimination of Child Labor in Cocoa
NSEZ Northern Savannah Ecological Zone
OECD Organization for Economic Cooperation and Development
OPRI Oil Palm Research Institute
PGRI Plant Genetic Resources Institute
R&D Research and Development
SARI Savannah Agriculture Research Institute
SMEs Scheme Management Entities
STERRI Science and Technology Policy Research Institute
2
SPD Seed Production Division
SRI Soil Research Institute
WCF World Cocoa Foundation
WDI World Development Indicators
WUAs Water User Associations
USAID United States Agency for International Development
3
CONTENTS
Acronyms and Abbreviations ......................................................................................................... 1
Executive Summary ........................................................................................................................ 5
Objective of the policy note ................................................................................................ 5
Context ................................................................................................................................ 5
Key constraints to sector growth and competitiveness ...................................................... 6
Specific challenges affecting the cocoa sector .................................................................... 9
Opportunities for transforming agriculture in Ghana ....................................................... 11
Main policy recommendations .......................................................................................... 11
1. Introduction ........................................................................................................................... 14
Approach and methodology of the preparation of the policy notes ...................................... 16
Outline of the report .............................................................................................................. 16
2. Agriculture in the Ghana Economy ...................................................................................... 17
The macro context – role of agriculture in the Ghana economy ........................................... 17
3. Production of major staple crops .......................................................................................... 17
Cocoa sector performance and issues ................................................................................... 20
4. Key Constraints to sector growth and competitiveness ....................................................... 27
Ghana’s public expenditure in agriculture ............................................................................ 27
Agriculture Research and Development ............................................................................... 33
Irrigation Potential in Ghana ................................................................................................. 39
5. Opportunities for agricultural transformation in Ghana ....................................................... 40
Agriculture potential of the Northern Savannah Ecological Zone (NSEZ) .......................... 42
The Planting for Food and Jobs Program ………………………………………………….46
6. Key Policy Recommendations ............................................................................................... 49
Appendix: Summary of Background Studies
Boxes
Box 1: Ghana’s Second Generation Cocoa Sector Development Strategy (CSDS II, draft)…….24
Box 2: Cocoa farm-gate comparative analysis: Ghana and Coted’Ivoire………………………..26
Box 3: Key agricultural sector subsidy programs in Ghana ……………………………………..33
Box 4: Facilitating the entry of agribusiness investors into Ghana’s irrigation sector……… 40
Box 5: Key Elements of the Planting for Food and Jobs Program……………………….............46
4
Figures
Figure 1: Cereal yield, average for Sub-Saharan Africa ............................................................... 18 Figure 2: Sector contribution to real GDP growth (%) ................................................................. 18
Figure 3.1: Agricultural production by sub-sector, 2014 .............................................................. 18 Figure 3.2: Agricultural growth vs growth in all other sectors (2008-2014) ................................ 19 Figure 4: Annual agricultural sector growth rates (trendline) ...................................................... 20 Figure 5. Agricultural terms of trade ............................................................................................ 21 Figure 6 Public spending in the agricultural sector ..................................................................... 21
Figure 7: Organization of the cocoa value-chain in Ghana .......................................................... 23 Figure 8a: Ghana, cocoa prices ..................................................................................................... 28 Figure 8b: Ghana, cocoa producer price as a share of the FOB price (%) ................................... 28 Figure 9: Expenditure in agriculture, Ghana compared to other SSA countries .......................... 29
Figure 10a: Number of Full-time equivalents (FTE) researchers in Ghana ................................. 35 Figure 10b: Funding of Ghana’s national agricultural R&D (US$ million) ................................. 35
Figure 11: Population structure, Sub-Saharan Africa and Ghana (2010) ..................................... 42 Figure 12: NSEZ political regions and districts ............................................................................ 44
Tables
Table 1: Actual versus potential yields for key staple crops in Ghana ......................................... 14
Table 2: Productivity growth rates by sector ................................................................................ 17 Table 3: Crop production, ‘000 metric tons .................................................................................. 18
Table 4: Area cultivated (‘000 hectares) ....................................................................................... 19
Table 5: Ghana’s position in the global cocoa supply .................................................................. 22
Table 6: Public spending on agriculture, 2001 - 15 ...................................................................... 28
Table 7: MOFA financing composition and expenditure breakdown, 2006 - 11 ......................... 30
Table 8: Drivers of agricultural productivity growth in Sub-Saharan Africa ............................... 34
Table 9: Total area under irrigation (2009-12) ............................................................................. 39 Table 10: Summary of Ghana’s merchandise imports .................................................................. 41
Table 11: Agricultural potential zones and their commodity suitability in the NSEZ……… 45
Table 12: Summary of key recommendations……………………………………………... 52
5
EXECUTIVE SUMMARY
Objective
The objective of this note is to help the Ministry of Food and Agriculture (MoFA) identify
strategic policy directions and reform areas that are fundamental to accelerate and sustain
agriculture sector growth. Sustained agricultural growth will contribute to overall resiliency of
the economy as it undergoes structural transformation as it moves beyond lower middle-income
status. The agriculture sector policy note is expected to contribute towards the development of the
next generation of Food and Agriculture Sector Development Policy (FASDEP), its related
Medium Term Agriculture Sector Investment Plan (METASIP), and the Planting for Food and
Jobs Program for 2018-2020, which MoFA is currently developing with support from the African
Green Revolution Alliance (AGRA). The Agriculture Sector Policy Note is based on a number of
sector studies and reports prepared by the Bank to support the existing investment projects. The
main audience for this note is MoFA and its development partners united in the Agriculture Sector
Working Group (ASWG). The note will also provide input into the Strategic Country Diagnostics
(SCD) and the Country Partnership Framework (CPF) which the Bank will prepare in FY18.
Context
The objective of the Agricultural Sector Policy Note is to help Ghana achieve transformation
and modernization of its agriculture sector. There are both challenges and opportunities towards
achieving transformation and modernization of the agriculture sector in Ghana. The country’s
lower medium-income status supported by a growing extractive industries sector (especially oil)
is an opportunity as the growth of the middle class increases the demand for high-quality and safe
food products. However, high growth in the extractive sector and concomitant real exchange rate
appreciation also present the risk of undermining Ghana’s agricultural competitiveness as has been
observed in other countries such as Nigeria and Angola. These issues underline the special
challenges confronting Ghana to sustain and accelerate agriculture growth in the face of economic
transformation.
The agricultural sector accounts for one-fifth of Ghana’s Gross Domestic Product (GDP),
employs nearly half of the workforce and is the main source of livelihood for the majority of
the country’s poorest households. Two-thirds of non-oil manufacturing depends on agriculture
for raw materials. Agriculture and agribusiness account for a major share of all economic activities
and livelihoods among smallholder farmers. The major export crop, cocoa, accounts for 20-25
percent of total foreign exchange earnings. Ghana accounts for about 20 percent of global cocoa
exports and has an international reputation for high quality cocoa beans (which command a 3-5
percent market premium). Ghana is also known for its ability to deliver on forward cocoa contracts
with little counterpart risk to buyers.
Ghana’s agricultural sector is characterized by low yields for both staple and cash crops. Cereal yields are estimated at 1.7 t/ha compared to the regional average of 2.0 t/ha and with
potential yields in excess of 5.0t/ha (World Development Indicators, WDI, 2016).1 Average cocoa
1 World Development Indicators (WDI). 2016. World Bank, Washington DC, United States of America.
6
yield in Ghana, estimated at 400 – 450 kg/ha, is among the lowest in the world (Ghana COCOBOD,
2015).2
Ghana is a net importer of basic foods (raw and processed) including rice, poultry, sugar,
and vegetable oils. The annual food import bill now exceeds the estimated annual $2 billion
earned from cocoa exports. Population growth, high rates of urbanization, and increasing incomes
are driving the import bill as they lead to increased demand for more quality and safe foodstuffs
such as meat, dairy, and horticulture (fruits & vegetables). In 2015, food imports account for 16.8
percent of total merchandise imports estimated at US$ 13.3 billion,3 and the food import bill is
projected to increase fourfold over the next 20 years, unless local production is substantially
increased.
Ghana has significant agricultural potential, particularly in the semi-arid Northern
Savannah (agro-)Ecological Zone (NSEZ), including the Afram Plains. Ghana’s agricultural
potential in the NSEZ remains mostly untapped. The NSEZ covers over 40 percent of the country’s
total surface area, and has about six million hectares of arable land with great potential for
commercial production of cereals, sugarcane, cassava, cotton, cashew, shea and livestock.
However, agricultural production in the NSEZ is constrained by inadequate infrastructure
(especially roads and irrigation) and other poor socio-economic indicators including low education
and skills, poor access to finance, complicated land tenure arrangements etc. These factors are
compounded by the semi-arid and arid climate which make the savannah particularly susceptible
to environmental degradation and climate change. Irrigation development should therefore receive
top priority in any effort to exploit the productive potential of the NSEZ.
Key Constraints to sector growth and competitiveness
Low Public Expenditure and Efficiency
Ghana’s public expenditure on agriculture has been declining and lags behind the 10 percent
target agreed as part of the Maputo Declaration. A recent public expenditure review of the
agricultural sector by the World Bank estimates that spending on agriculture averaged about 5
percent of total spending between 2001 and 2014; while also declining as a percent of total GDP
since 2011 reflecting tightening of the country’s fiscal position (Jansen, 2016).4 This includes
funding to the cocoa sector, implying that non-cocoa public expenditure might only be about half
of the estimated 5 percent. Ghana’s public expenditure on agriculture is among the lowest in
Africa, and considerably below the Comprehensive African Agriculture Development Program
(CAADP) commitment of 10 percent (FAO, 2016).5 About two-thirds of the Ministry of Food and
Agriculture (MoFA) budget is allocated for operational costs, with Development Partners (DPs)
funding more than 70 percent of investment expenditures. Operational costs are mostly allocated
to salaries and input subsidies. This crowds-out expenditure on critical public goods such as access
infrastructure, irrigation, research and development (R&D), and extension services, among others.
2 Ghana Cocoa Board. 2015. The future of Ghana’s cocoa sector. “Building in robustness and resilience to What IF? Scenario
Planning Report. Accra, Ghana. 3 World Bank. 2015. World Development Indicators (WDI), global merchandise imports. 4 Jansen, Johannes, 2016. Revitalizing agricultural growth through enhanced expenditure targeting. World Bank, Accra, Ghana. 5 OECD/FAO, 2016. Agriculture in Sub-Saharan Africa: Prospects and challenges, for the next decade. Rome, Italy.
7
There are also issues related to agricultural services which have been devolved to the District
Assemblies. Although Ghana has implemented its decentralization policy, but a lot still needs to
be done to give full meaning to administrative and fiscal decentralization, particularly for key
sectors such as agriculture whose functions and services are needed most at the local level. The
provision of agricultural extension and other services at the local level remains rather poor, mainly
due to low capacity and limited and untimely provision of public funding.
A significant part of agricultural public expenditure is for input subsidies, yet evidence shows
that these subsidies are inefficient and generate low returns. The government provides
fertilizer subsidies through MoFA as well as to cocoa farmers through COCOBOD. In 2016,
MoFA provided subsidies on 180,000 metric tons of granular fertilizer at a cost of GH₵ 120
million and an unspecified quantity of organic fertilizer at a cost of GH₵ 18 million, representing
an average subsidy of 26 percent. In the cocoa sector, COCOBOD is the principal supplier of
fertilizers, pesticides and seedlings. The sustainability of these programs is of concern, given their
rising costs and ineffective targeting mechanisms. There are also operational issues, such as late
announcements regarding if, when and how the programs are to be implemented each year,
resulting in late delivery of fertilizers and creating substantial uncertainty for input suppliers and
hindering the development and strengthening of private fertilizer supply networks in the country.
(Houssou, Kolavalli, Silver, 2016).6 Where subsidies must be implemented in order to address
specific market failures affecting farmers’ uptake of inputs, there is need to ensure adherence to
the principles of smart subsidies, including: (a) targeting farmers that need to learn about proper
use of fertilizers; (b) targeting farmers that could use fertilizers profitably but are not able to do so
due to working capital constraints; and (c) delivering the subsidy through the private sector by
using modern voucher systems.
Agricultural R&D, which is a key driver of productivity growth is inadequately funded and
coordinated. In Ghana, spending on agricultural R&D amounts to about 0.7 percent of agricultural
output (excluding cocoa), above the Sub-Saharan Africa average of 0.5 percent, but below the rates
of regional leaders such as Kenya (1.4 percent) and South Africa (2 percent) (IFPRI/ASTI, 2014).7
This is also lower than the 1 percent target set by the African Union. Ghana’s institutional
mechanism for agricultural research and development is governed by the Council for Scientific
and Industrial Research (CSIR). It is estimated that less than 4 percent of the budget annually
allocated to CSIR is available to finance new operations. As a result, researchers are almost fully
dependent on donor funding which is also limited.
Significant productivity growth in agriculture requires a vibrant agricultural input supply
system, particularly for seed. Ghana’s seed sector has undergone some significant changes in the
past few years, including the establishment of a new seed law and regulations, the appointment of
a National Seed Council, and the emergence of a more diversified commercial seed sector. Trip
and Mensah-Bonsu (2013)8 reviewed factors critical to the development of the seed sector
6 Houssou, Nazaire; Kolavalli, Shashidhara; Silver, Jed. 2016. Agricultural intensification, technology adoption, and
institutions in Ghana. Washington DC: IFPRI. 2016. 7 Nienke Beintema, Gert-Jan Stads, Keith Fuglie, and Paul Heisey, 2012. Global assessment of agricultural R&D
spending. Agricultural Science and Technology Indicators (ASTI) and International Food Policy Research Institute
(IFPRI). 8 Trip, Robert and Akwasi Mensah-Bonsu, 2013. Ghana’s commercial seed sector: New incentives or continued
complacency. Ghana Strategy Support Program. International Food Policy Research Institute Working Paper 32.
8
including procedures regarding variety release, seed quality inspection and certification; consumer
protection; access to breeder seed; provision of information to farmers; and seed prices and
subsidies. They also evaluated the traits of major public sector crop varieties, the nature of farmers
seed demand, and the composition of the local seed industry. They concluded that the seed system
in Ghana is still largely dependent on public support (with minimal private sector participation),
and the seed value-chain (from the production of breeder seed, foundation seed, its multiplication,
and the production and distribution of certified seed) has inherent cost inefficiencies that invariably
affect the competitiveness of the domestic seed industry. Furthermore, with the limited
development of the private sector in this important area, access to good quality seed among
smallholder farmers remains a major issue.
The coordination of agricultural sector investments in Ghana needs to be improved. Sector
coordination is mainly done through the Agriculture Sector Working Group (ASWG) led by
MoFA. The ASWG is a policy dialogue platform for engaging the Government of Ghana and its
Development Partners (DPs). The ASWG coordinates the alignment towards the Food and
Agriculture Sector Development Plan (FASDEP II), supports the implementation of the medium-
term investment plan, and facilitates the preparation of Joint Annual Sector Reviews. However,
more needs to be done to strengthen ASWG’s impact on sector policy formulation, as well as
monitoring and evaluation. Over the last two years, MoFA’s participation and leadership has been
inconsistent. Furthermore, the funding of METASIP, including its steering and governance
structures remains inadequate. The coordination of the DPs’ support to the sector needs to be
improved. The framework and capacity to facilitate public-private partnerships (PPPs) in the sector
needs to be strengthened to further private sector investment in agriculture.
The collection and analysis of agricultural data/statistics is still weak and this undermines
proper development planning in the sector. Ghana has not conducted a comprehensive
agricultural census for the past 32 years.9 In order to obtain annual production data, MoFA relies
on Annual Crop and Livestock Surveys conducted at the district level by agricultural extension
officers. However, given the limited public funding and other constraints affecting the capacity of
public officials, the quality of the data is often challenged.
Impact of Climate Change
Ghana’s agriculture is vulnerable to the threat of climate change. Approximately 70 per cent
of the population directly or indirectly depends on agriculture and forestry. The agricultural
sector’s vulnerability to climate change effects threatens the food security and livelihoods of the
majority who depend on the sector. While the diversity of agro-climatic conditions, production
systems, and crops prevalent in Ghana lowers the level of aggregate risk for the agricultural sector
as a whole, the sector faces climate change effects whose causes, frequency, and severity vary
between regions, commodities, and years, with strong implications for localized risk management
strategies. According to a report by the World Bank10, climate change is expected to adversely
affect the stability of Ghana’s agricultural sector with the country’s millions of smallholder farmers
9 Quiñones, Esteban J.; Muñoz, Juan and Ngeleza, Guyslain. 2011. A Strategy for Agricultural Statistics in Ghana. Ghana
Strategy Support Program. International Food Policy Research Institute Working Paper 32. According to this paper, the last
agricultural census in Ghana was conducted in 1984. 10 Choudhary, Vikas; D'Alessandro, Stephen. 2015. Ghana Agricultural Sector Risk Assessment: Risk Prioritization. World
Bank, Washington, DC. © World Bank. https://openknowledge.worldbank.org/handle/10986/22498 License: CC BY 3.0 IGO.
9
particularly vulnerable. The report also highlight that climate change is projected to accentuate the
rise in food prices in the future. While the price of rice is projected to increase 60 percent by 2015
without climate change, it could go up by as much as 121 percent once climate change is taken
into account. Similarly, while the price of maize is projected to increase 60 percent without climate
change, with climate change this increase could be 153 percent. Northern Ghana is more vulnerable
to increased volatility in weather patterns caused by climate change than the rest of the country
because it is poorer, drier and more heavily dependent on subsistence agriculture. It is therefore
important for Ghana to deepen the implementation of its National Climate Change Policy (NCCP)
and the Agriculture Sector Implementation Plan, following the set principles in line with the
country’s Intended Nationally Determined Contributions (INDC) towards climate change
mitigation.
Specific challenges affecting the Cocoa Sector
Cocoa is very important to Ghana in terms of rural livelihoods, foreign exchange earnings
and employment, as well as being a key driver of sector growth. Cocoa accounts for about 7
percent of the country’s GDP and 20-25 percent of total export earnings. Ghana is the second most
important producer and exporter of cocoa in the world, accounting for about 20-25 percent of total
world supply. Total production increased from 400,000 MT in 1999-2000 to 1,000,000 MT in
2011-2012, but dropped to about 850,000 MT in 2013-2014, and has been fluctuating between
750,000-850,000 MT/year since.
The cocoa sector’s low productivity threatens Ghana’s competitiveness and position in the
international market. The low yields are a result of a multiplicity of factors such as age of the
trees, pest and disease infestation, and poor agricultural practices. According to a recent
assessment by the World Cocoa Foundation (WCF, 2016),11 of the 2.6 million hectares under
cocoa, about 23 percent have trees that are above 30 years old, and about 7 percent have been
affected by cocoa swollen shoot virus disease (CSSVD). During the past decades, growth in total
cocoa output has been more a result of expansion of area under cultivation than yield increase due
to technical change.
Ghana’s Cocoa Sector Development Strategy (CSDS II)12seeks to modernize Ghana’s cocoa
sector and promote climate smart cocoa and enhance the productivity of farms, but is yet to
be finalized and approved. The vision and strategy for modernizing Ghana’s cocoa sector is
based on three pillars: competitiveness, resilience, and robustness. To modernize and have a more
sustainable cocoa sector, Ghana needs to be more: (a) competitive by increasing the productivity
of cocoa producers and improve cost efficiency along the cocoa supply chain; (b) resilient to
challenges and risks related to global cocoa markets (demand and supply), and climate change;
and (c) robust by being an industry leader through innovation and differentiation by focusing on
high quality cocoa and niche markets.
11 World Cocoa Foundation (WCF), 2016. Cocoa Swollen Shoot Virus Disease: A holistic approach to control the
disease in West Africa. 12 Developed by COCOBOD with support from the World Bank, World Cocoa Foundation (WCF) and the Royal
Netherlands Embassy between January 2014 and March 2015.
10
There is a need to reconsider COCOBOD’s cocoa inputs program for fertilizer, agro-
chemicals and planting materials. The Ghana Cocoa Board (COCOBOD) which governs the
cocoa sector implements a distribution program for fertilizer, agro-chemicals and planting
materials. Cocoa planting materials (pods and seedlings) are supplied through its Seed Production
Division (SPD) and Cocoa Health and Extension Division (CHED) to farmers. Additionally,
COCOBOD procures fertilizer and agrochemicals and distributes them to the farmers under its
Cocoa High-Tech Program. Even though the distribution, as communicated within the public
domain, creates an impression that these inputs are supplied for free, in reality farmers pay for
them through the so-called “Industry Costs” that COCOBOD levies when setting the price at which
they purchase the cocoa from farmers. In addition, the input distribution system is highly
politicized, erratic and often corrupt. In addition, while all farmers effectively pay for cocoa inputs,
only selected farmers receive them, and in some cases COCOBOD inputs have been illegally
exported to neighboring countries.
Environmental issues affect the sustainability of Ghana’s cocoa sector and threaten Ghana’s
position in the global cocoa supply chain in the medium to long-term.13 Since its introduction
in West Africa, cocoa has been a major driver of deforestation in the high forest zones of the
regions in which it is grown and it has replaced agricultural activity that incorporated fallowing to
maintain land fertility (Gockowski and Sonwa 2007).14 Cocoa farmers in Ghana have a strong
preference for full-sun (as opposed to partially shaded) cocoa because of a belief of higher short-
term profits due to their much shorter growing cycle (Obiri et al. 2007).15 Although there have
recently emerged some climate smart cocoa interventions that focus on cocoa agroforestry
systems, they remain small scale pilot schemes.
Land tenure issues also affect the sustainability of Ghana’s agriculture in general, and the
cocoa sector in particular.16 Poor land management practices and inappropriate resource use
threaten the sustainability of agriculture in general. Indigenous norms that regulate land ownership
differ among communities and are usually associated with many shortcomings including undefined
boundaries, unclear rights and titles, undocumented transactions and disputes which sometimes
escalate into full-fledged conflicts.
13 More details on environmental issues affecting the cocoa sector are covered in a separate Environment and
Natural Resources (ENR) Policy Note. 14 Gockowski, James; and Sonwa, Denis, 2007. Cocoa Intensification Scenarios and Their Predicted Impact on CO2
Emissions, Biodiversity Conservation and Rural Livelihoods in the Rainforest of West Africa. Environmental
Management, November 2010. 15 Obiri, D.B., Geoff, A.B., Morag, A.M., Anglaare, L.C.N. and Cobbina, J. 2007. Financial Analysis of Shaded
Cocoa in Ghana. Agroforestry Systems 71:139-149. 16 Detailed land sector issues are covered in a separate Land Policy Note.
11
Modernization of the cocoa value chain, reform of COCOBOD’s institutional arrangements
including greater transparency, and improvements in the policy framework guiding the
cocoa sub-sector, are essential to enhance the efficiency of cocoa production and ensure the
long-term competitiveness of cocoa exports. Some necessary elements can be found back in the
Ghana Cocoa Sector Development Strategy II (CSDS II). In particular, CSDS II explicitly
recognizes the urgent need for improved management and accounting systems in COCOBOD,
better logistics and more efficient quality control systems, improved targeting and eventual
phasing out of government input supply programs, substantial upscaling of tree improvement
programs, and transforming the role of COCOBOD from that of a major market player to one of
enabler of certification, traceability, and inter-ministerial coordination towards improved
landscape management including payments for environmental services.
Opportunities for transforming agriculture in Ghana
Opportunities exist for Ghana to achieve significant transformation of its agricultural sector. Based on the previous section, these opportunities include the following: First, Ghana’s lower
medium-income status and a growing extractive industries sector imply an increasing demand by
the growing middle-class for high-quality and safe foodstuffs. Second, the size of Ghana’s food
import bill creates sufficient space for investments in import-substitution in key import
commodities for which the country either already has, or can develop a comparative advantage.
Third, Ghana is endowed with vast areas of high agricultural production potential which can
support a wide-range of commodities. Fourth, Ghana is experiencing vast demographic transition,
with a rapidly increasing labor force as a result of a continuing growth in the share of the population
in the youth category. Promotion of youth employment in agriculture/agribusiness value-chains
should be an important part of any strategy to achieve sustainable growth and would enable the
country to reap the dividend from the demographic transition. Ghana also continues to implement
reforms needed to attract more private sector investment – for example by improving the regulatory
framework, creation of a “one-stop shop” for investors, easing import restrictions (seeds,
equipment), promoting an open, transparent and efficient regime for land administration and
governance, improvements in access to finance, and strengthening institutions for research and
technology generation aimed at raising sector productivity.
Key Policy Recommendations
The first priority is to improve public expenditure allocation and management as well as
budget coordination in agriculture. The government needs to make a serious and sustained
funding commitment to the agriculture sector and back up declarations about its importance with
major increases in public expenditures on agriculture, at least to the level of 10 percent of the total
expenditure as committed under the Maputo Declaration. Budget coordination, prioritization and
execution in line with sector development goals and effective implementation are critical. Better
coordination of DPs’ support is also urgently required. MoFA should focus on its core function of
policy formulation, provision of public goods and monitoring & evaluation, while providing the
incentives and space for private sector (including smallholder farmers’) investment. Consistent
funding and technical support to devolved public sector agricultural services in the district
assemblies is critical to ensure quality support to farmers.
12
The second priority is for MoFA to improve the collection and analysis of agricultural
statistics to produce high quality and credible data for sector planning on a regular basis. It
is high time MoFA considers undertaking an agricultural census which will re-establish the
benchmark for monitoring sector progress going forward.
Third, MoFA should improve the efficiency and effectiveness of input subsidy programs and
fix gaps in input supply legislation. Agricultural input subsidy programs should be reviewed to
ensure better alignment of the program objectives and targeting criteria, and adopt smart
implementation approaches to avoid market distortions, and promote the development of more
sustainable private sector input supply systems. The government should take measures to promote
the domestic seed industry and encourage the commercial seed sector, including aligning seed
import rules with the harmonized Economic Community of Western African States (ECOWAS)
regulation on Seeds in order to ease the flow of seed within the sub-region. It is also important to
ensure that the regulations that accompany the Food and Fertilizer Acts which have been revised
six years ago should be passed. For example, easing import restrictions (seeds, equipment), and
promoting private sector participation in the multiplication of foundation seed and the distribution
of certified seed. Also critical is the need to strengthen institutions for research and technology
generation.
Fourth, prioritization of public investments in infrastructure, particularly in high
agricultural potential areas, such as the NSEZ (including the Afram Plains) is critical to
sustain Ghana’s agricultural growth. Priority should be placed on access to roads to enhance
logistical efficiency, irrigation, research and development, extension, and post-harvest aggregation
and value addition. The on-going reform of the Ghana Irrigation Development Authority (GIDA)
should be completed to promote public development of privately managed irrigation systems in
the NSEZ and elsewhere.
To address land tenure shortcomings, the government should stay the course on reform of
land tenure system. This should be done by ensuring the approval of an improved land bill,
facilitating the completion of an automated platform for the speedy preparation of land titles and
deeds, and strengthening the governance of customary land tenure systems.
The government should promote coordination in the the implementation of its National
Climate-Smart Agriculture and Food Security Action Plan, following the principles laid down in
the National Climate Change Policy as well as the Intended Nationally Determined Contributions
(INDC). The Government should also strengthen research on climate-smart agricultural
technologies, strengthen the research-extension linkages to promote farmers’ technology adoption
especially in fragile but high potential environments such as the NSEZ.
Recommendations for the cocoa sector
In the cocoa sector, the first priority is to ensure that the Cocoa Sector Development Strategy
(CSDS II) is finalized and approved, and governance arrangements are strengthened to
improve inclusion of all key stakeholders in decision-making. This can be achieved by reviving
the Ghana Cocoa Platform (GCP) as the country’s PPP platform for coordination of interventions
in the sector. It is also important to strengthen civil society engagement and advocacy on a wide
range of issues impacting the sector. The input supply and subsidy system should be reviewed to
13
improve targeting efficiency and equity in farmers’ access, with a possible vision of phasing out
gradually over time. COCOBOD should actively support an increased private sector role in input
supply and support services, while maintaining a pivotal role in monitoring and regulation to
ensure safety and quality of inputs.
Second, COCOBOD’s current organizational structure and functions should be reviewed to
make the institution operate in a more efficient manner. There is need to improve data
collection and analyses, mapping and registration of farmers to promote farm and farmer
identification, introduce digital accounting and management information systems, improve the
logistical, quality control and traceability systems, tree rehabilitation, cocoa agroforestry,
sustainable land use management, and better coordination of programs and projects.
Third, there is the need to improve productive and social infrastructures, and strengthen the
role of women and youth in the sector, while adhering to international commitments
restricting the use of child labor in cocoa production.17 For more than 4 years, Ghana has not
submitted a national report on efforts to eliminate the worst forms of child labor (WFCL) in cocoa
in compliance with the Harken-Engel Protocol. This breach can have dire consequence for the
country in terms of cocoa trading. The Ghana Child Labor Monitoring System (GCLMS)
developed to monitor WFCL and remediate children at risk of trafficking has lacked funding and
institutional support. It is recommended that the government resumes funding to revitalize the
National Program for the Elimination of Worst Forms of Child Labor in Cocoa (NPECLC) to
coordinate and report on public and private sector efforts in this area.
17 Detailed issues are highlighted in the section on cocoa.
14
1. INTRODUCTION
1.1 In Ghana, the agricultural sector accounts for one-fifth of Gross Domestic Product
(GDP), employs nearly half of the workforce and is the main source of livelihood for the
majority of the country’s poorest households. Two-thirds of non-oil manufacturing depends on
agriculture for raw materials. Agriculture and linked agribusinesses account for a major share of
all economic activities and livelihoods among smallholder farmers. The major export crop, cocoa,
accounts for 20-25 percent of total foreign exchange earnings. Ghana accounts for nearly 20
percent of global cocoa exports and has an international reputation for high quality cocoa beans
(and commands a 3-5 percent market premium). Ghana is also known for its ability to deliver on
forward contracts with little counterpart risk to buyers.
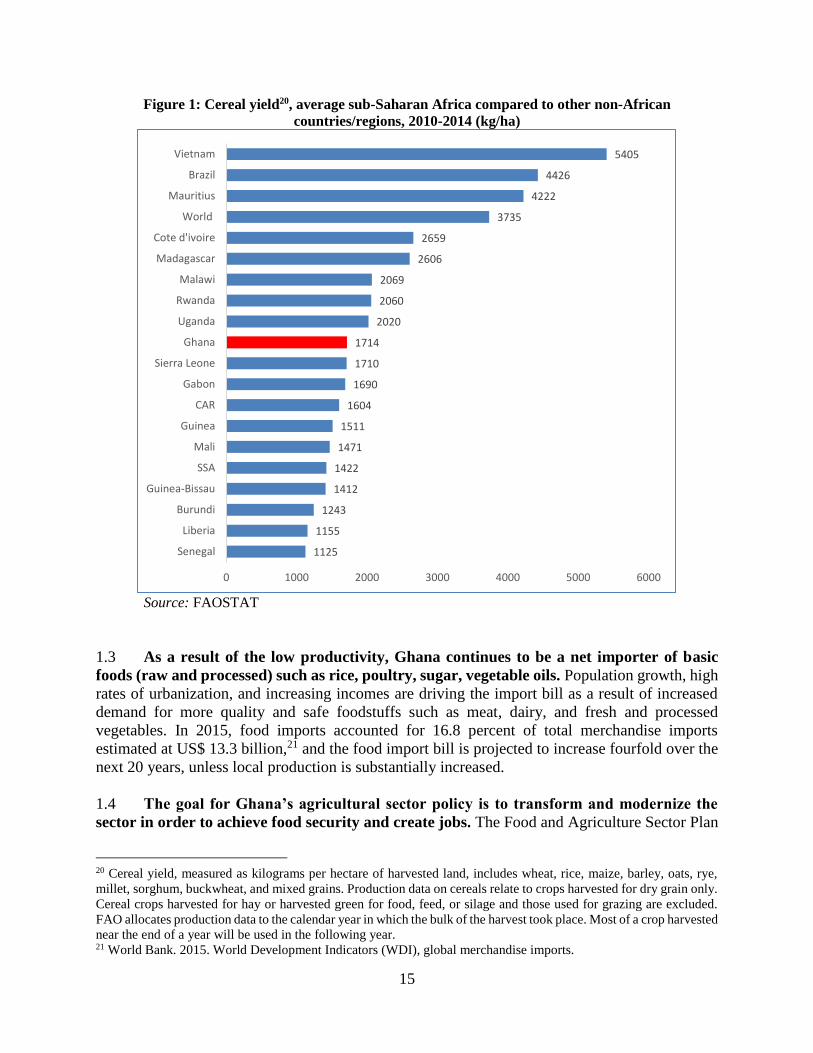
1.2 However, despite its important role in the Ghanaian economy, the agricultural sector
is characterized by low yields for staple as well as cash crops. Cereal yields are estimated at
1.7t/ha compared to the regional average of 2.0 t/ha, and with potential yields in excess of 5.0t/ha18
(Figure 1 Average cocoa yields in Ghana, estimated at 400 – 450 kg/ha, are among the lowest in
the world (Ghana COCOBOD, 2015).19 For most of the staple commodities, there is a 43 – 66
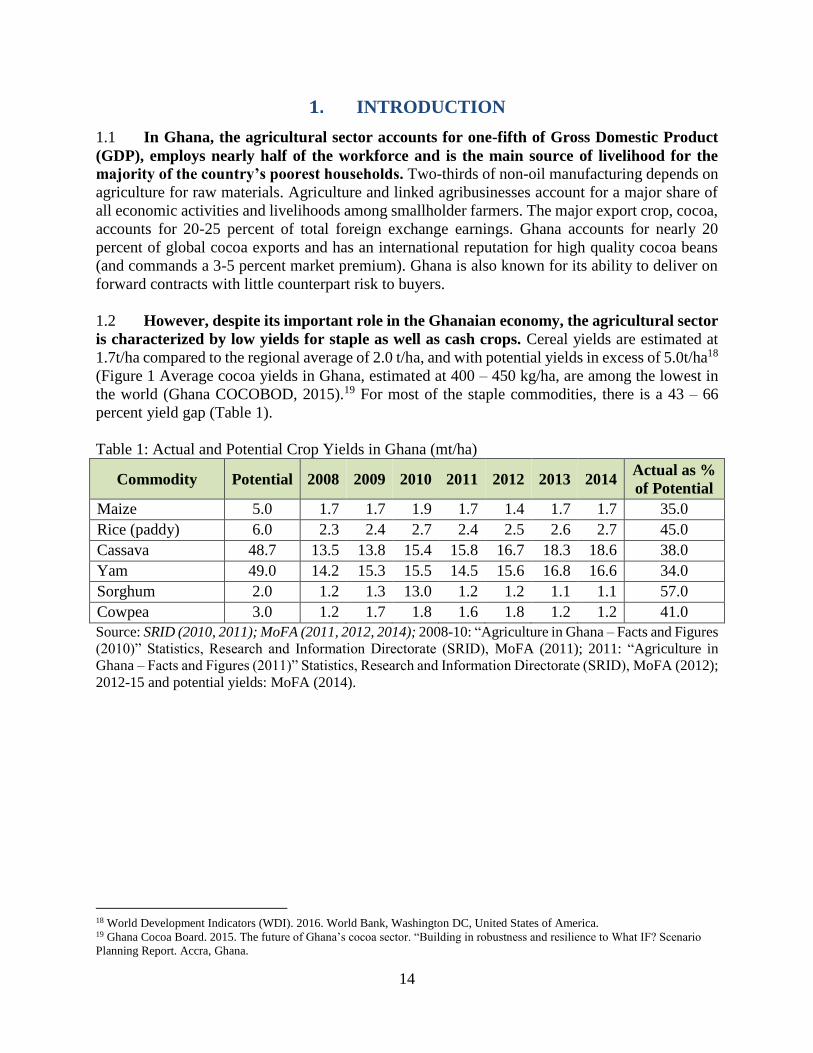
percent yield gap (Table 1).
Table 1: Actual and Potential Crop Yields in Ghana (mt/ha)
Commodity Potential 2008 2009 2010 2011 2012 2013 2014 Actual as %
of Potential
Maize 5.0 1.7 1.7 1.9 1.7 1.4 1.7 1.7 35.0
Rice (paddy) 6.0 2.3 2.4 2.7 2.4 2.5 2.6 2.7 45.0
Cassava 48.7 13.5 13.8 15.4 15.8 16.7 18.3 18.6 38.0
Yam 49.0 14.2 15.3 15.5 14.5 15.6 16.8 16.6 34.0
Sorghum 2.0 1.2 1.3 13.0 1.2 1.2 1.1 1.1 57.0
Cowpea 3.0 1.2 1.7 1.8 1.6 1.8 1.2 1.2 41.0
Source: SRID (2010, 2011); MoFA (2011, 2012, 2014); 2008-10: “Agriculture in Ghana – Facts and Figures
(2010)” Statistics, Research and Information Directorate (SRID), MoFA (2011); 2011: “Agriculture in
Ghana – Facts and Figures (2011)” Statistics, Research and Information Directorate (SRID), MoFA (2012);
2012-15 and potential yields: MoFA (2014).
18 World Development Indicators (WDI). 2016. World Bank, Washington DC, United States of America. 19 Ghana Cocoa Board. 2015. The future of Ghana’s cocoa sector. “Building in robustness and resilience to What IF? Scenario
Planning Report. Accra, Ghana.
15
Figure 1: Cereal yield20, average sub-Saharan Africa compared to other non-African
countries/regions, 2010-2014 (kg/ha)
Source: FAOSTAT
1.3 As a result of the low productivity, Ghana continues to be a net importer of basic
foods (raw and processed) such as rice, poultry, sugar, vegetable oils. Population growth, high
rates of urbanization, and increasing incomes are driving the import bill as a result of increased
demand for more quality and safe foodstuffs such as meat, dairy, and fresh and processed
vegetables. In 2015, food imports accounted for 16.8 percent of total merchandise imports
estimated at US$ 13.3 billion,21 and the food import bill is projected to increase fourfold over the
next 20 years, unless local production is substantially increased.
1.4 The goal for Ghana’s agricultural sector policy is to transform and modernize the
sector in order to achieve food security and create jobs. The Food and Agriculture Sector Plan
20 Cereal yield, measured as kilograms per hectare of harvested land, includes wheat, rice, maize, barley, oats, rye,
millet, sorghum, buckwheat, and mixed grains. Production data on cereals relate to crops harvested for dry grain only.
Cereal crops harvested for hay or harvested green for food, feed, or silage and those used for grazing are excluded.
FAO allocates production data to the calendar year in which the bulk of the harvest took place. Most of a crop harvested
near the end of a year will be used in the following year. 21 World Bank. 2015. World Development Indicators (WDI), global merchandise imports.
1125
1155
1243
1412
1422
1471
1511
1604
1690
1710
1714
2020
2060
2069
2606
2659
3735
4222
4426
5405
0 1000 2000 3000 4000 5000 6000
Senegal
Liberia
Burundi
Guinea-Bissau
SSA
Mali
Guinea
CAR
Gabon
Sierra Leone
Ghana
Uganda
Rwanda
Malawi
Madagascar
Cote d'ivoire
World
Mauritius
Brazil
Vietnam
16
(FASDEP II) emphasizes the sustainable utilization of all resources and commercialization of
activities in the sector with a focus on market-driven growth. The policy also targets fewer
commodities for food security and income diversification, especially of resource poor farmers.
The focus is on increased efficiency throughout the commodity value chain, through the
application of science and technology, and with improved environmental sustainability. Greater
engagement of, and collaboration with the private sector is emphasized to facilitate implementation
of the policy and investment plan.
Approach and methodology of the Policy Note
1.5 This Agriculture Sector Policy Note has been prepared based on a number of studies
and stakeholder consultations conducted by the World Bank. The first set of studies and
consultations focused on the cocoa sector. A cocoa sector development scenario planning exercise
was conducted which culminated into a scenario planning report as input into the preparation of
the new Cocoa Sector Development Strategy (CSDS II). Most of this work was undertaken from
2014-2015. A second study was commissioned as part of the preparation of the final report and
road-map for inclusive agriculture-led transformation of Ghana’s Northern Savannah Ecological
Zone (NSEZ). This was preceded by a high-level Agricultural Investment Workshop (AIW, held
in Tamale June 21-23, 2016) whose objective was to identify the short, medium and long-term
priorities for the economic transformation of the NSEZ.22 In 2017, after the Government
announced plans to launch the Planting for Food and Jobs Program as a new flagship sector
program aimed at rapidly increasing food production and creating jobs, a number of brainstorming
and discussions sessions were held to provide input into the preparation of the program.
1.6 The summary version of the main sector issues and policy recommendations was
discussed with the key development partners in the agricultural sector. This was undertaken
as part of the quality validation process to provide sector input into the Policy Advisory Note which
the Bank prepared and submitted to the country’s new administration. Also, the agricultural public
expenditure review is part of the broader public expenditure review study whose findings have
been widely disseminated. The full report was validated during a stakeholder workshop held May
29-30, 2017.
Outline of the Note
1.7 This Agriculture Sector Policy Note is structured as follows: Section 2 describes the
structure of the agricultural sector and its role in the economy, while section 3 discusses the
production of key staple crops and cocoa, Ghana’s most important cash crop. Section 4 highlights
the major constraints to sector growth and competitiveness. Section 5 highlights the key
opportunities for agricultural transformation. Section 6 concludes with the details of recommended
policies covering the key areas of the sector, with a particular focus on how improving the sector’s
productivity and foster its modernization.
22 This workshop was convened by the Savannah Accelerated Development Authority (SADA) and supported by the
World Bank and USAID. It was opened by the Minister of Finance and closed by the former State President of
Ghana.
17
2. Agriculture in the Ghanaian Economy
The macro context
2.1 Ghana’s agricultural sector is crucial to the country’s sustainable long-term growth
and development. Even though the rapid increase in the extractive sector (minerals, oil and gas)
has diminished the relative size of the agricultural sector in the overall economy, agriculture
remains vital to employment, income generation and poverty reduction. Agriculture employs 45
percent of the national labor force—far more than any other sector. Because rural poverty rates
significantly exceed the national average, and agriculture and other primary sector activities are
essential to the livelihoods of the country’s poorest households, agriculture development is critical
for poverty reduction. Despite the changing dynamics, inclusive agricultural growth remains so
effective in reducing poverty, especially when large numbers of the poor depend on farming. Even
with more rapid rural-urban migration, the majority of the poor in Ghana will continue to be rural
for decades to come.
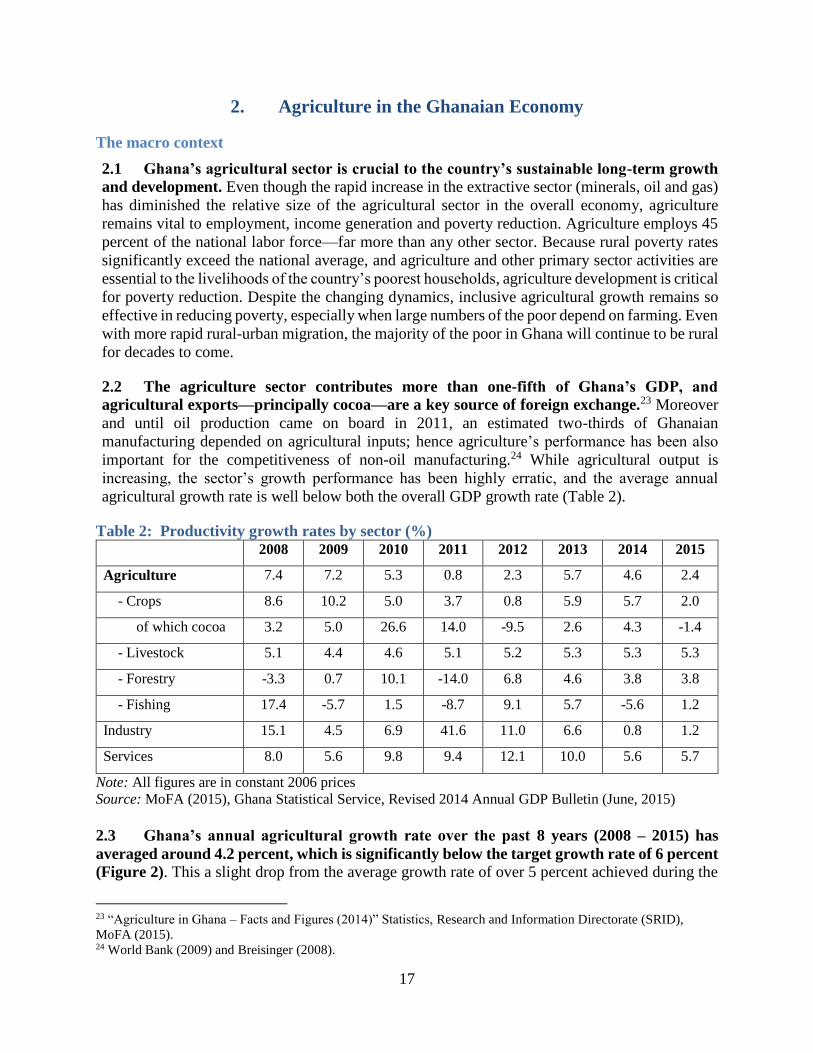
2.2 The agriculture sector contributes more than one-fifth of Ghana’s GDP, and
agricultural exports—principally cocoa—are a key source of foreign exchange.23 Moreover
and until oil production came on board in 2011, an estimated two-thirds of Ghanaian
manufacturing depended on agricultural inputs; hence agriculture’s performance has been also
important for the competitiveness of non-oil manufacturing.24 While agricultural output is
increasing, the sector’s growth performance has been highly erratic, and the average annual
agricultural growth rate is well below both the overall GDP growth rate (Table 2).
Table 2: Productivity growth rates by sector (%) 2008 2009 2010 2011 2012 2013 2014 2015
Agriculture 7.4 7.2 5.3 0.8 2.3 5.7 4.6 2.4
- Crops 8.6 10.2 5.0 3.7 0.8 5.9 5.7 2.0
of which cocoa 3.2 5.0 26.6 14.0 -9.5 2.6 4.3 -1.4
- Livestock 5.1 4.4 4.6 5.1 5.2 5.3 5.3 5.3
- Forestry -3.3 0.7 10.1 -14.0 6.8 4.6 3.8 3.8
- Fishing 17.4 -5.7 1.5 -8.7 9.1 5.7 -5.6 1.2
Industry 15.1 4.5 6.9 41.6 11.0 6.6 0.8 1.2
Services 8.0 5.6 9.8 9.4 12.1 10.0 5.6 5.7
Note: All figures are in constant 2006 prices
Source: MoFA (2015), Ghana Statistical Service, Revised 2014 Annual GDP Bulletin (June, 2015)
2.3 Ghana’s annual agricultural growth rate over the past 8 years (2008 – 2015) has
averaged around 4.2 percent, which is significantly below the target growth rate of 6 percent
(Figure 2). This a slight drop from the average growth rate of over 5 percent achieved during the
23 “Agriculture in Ghana – Facts and Figures (2014)” Statistics, Research and Information Directorate (SRID),
MoFA (2015). 24 World Bank (2009) and Breisinger (2008).
18
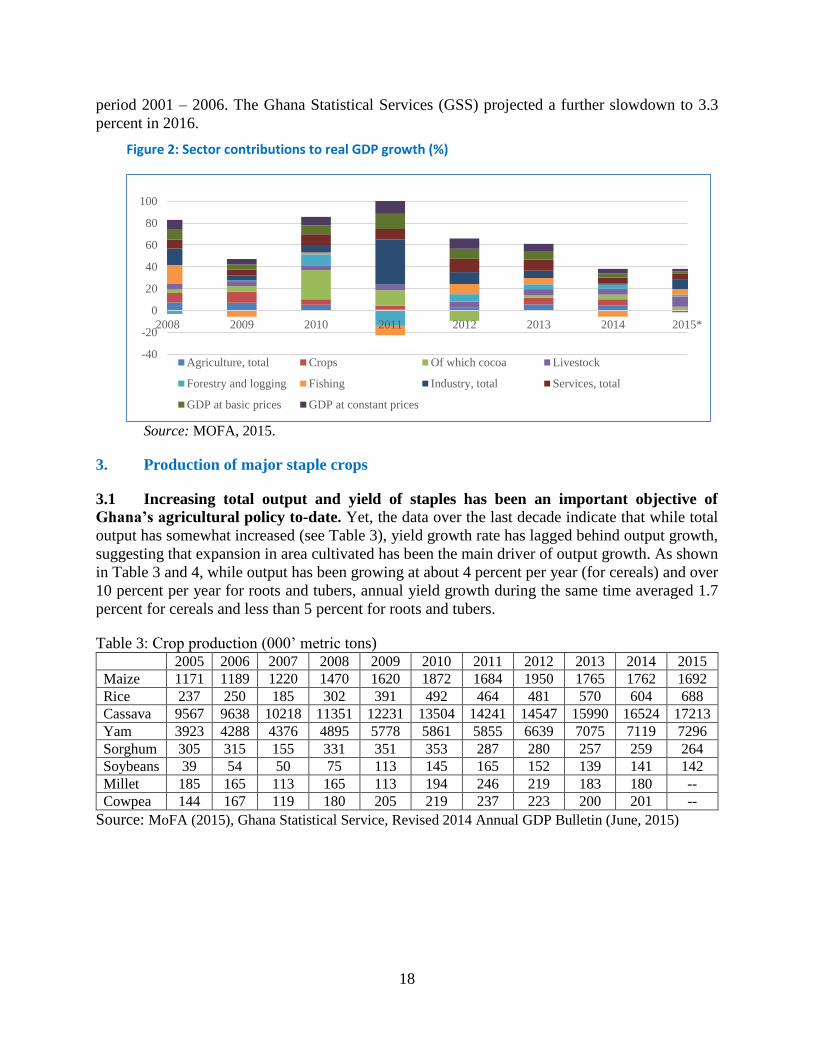
period 2001 – 2006. The Ghana Statistical Services (GSS) projected a further slowdown to 3.3
percent in 2016.
Figure 2: Sector contributions to real GDP growth (%)
Source: MOFA, 2015.
3. Production of major staple crops
3.1 Increasing total output and yield of staples has been an important objective of
Ghana’s agricultural policy to-date. Yet, the data over the last decade indicate that while total
output has somewhat increased (see Table 3), yield growth rate has lagged behind output growth,
suggesting that expansion in area cultivated has been the main driver of output growth. As shown
in Table 3 and 4, while output has been growing at about 4 percent per year (for cereals) and over
10 percent per year for roots and tubers, annual yield growth during the same time averaged 1.7
percent for cereals and less than 5 percent for roots and tubers.
Table 3: Crop production (000’ metric tons) 2005 2006 2007 2008 2009 2010 2011 2012 2013 2014 2015
Maize 1171 1189 1220 1470 1620 1872 1684 1950 1765 1762 1692
Rice 237 250 185 302 391 492 464 481 570 604 688
Cassava 9567 9638 10218 11351 12231 13504 14241 14547 15990 16524 17213
Yam 3923 4288 4376 4895 5778 5861 5855 6639 7075 7119 7296
Sorghum 305 315 155 331 351 353 287 280 257 259 264
Soybeans 39 54 50 75 113 145 165 152 139 141 142
Millet 185 165 113 165 113 194 246 219 183 180 --
Cowpea 144 167 119 180 205 219 237 223 200 201 --
Source: MoFA (2015), Ghana Statistical Service, Revised 2014 Annual GDP Bulletin (June, 2015)
-40
-20
0
20
40
60
80
100
2008 2009 2010 2011 2012 2013 2014 2015*
Agriculture, total Crops Of which cocoa Livestock
Forestry and logging Fishing Industry, total Services, total
GDP at basic prices GDP at constant prices
19
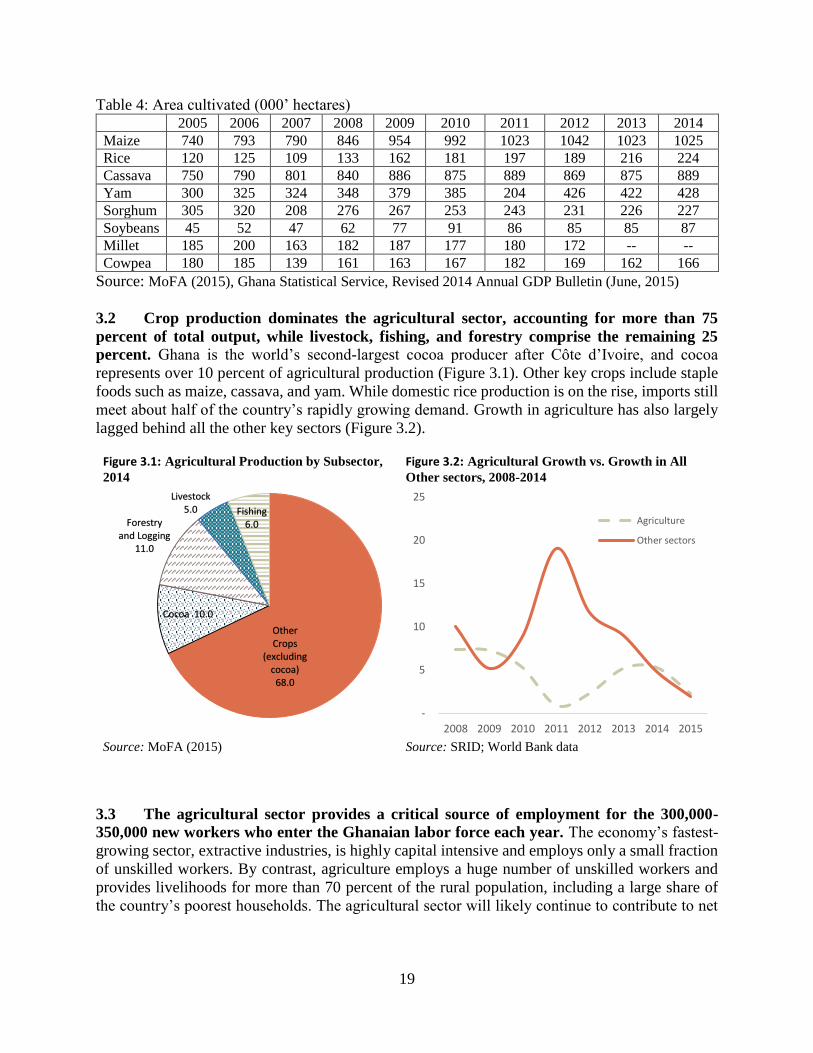
Table 4: Area cultivated (000’ hectares) 2005 2006 2007 2008 2009 2010 2011 2012 2013 2014
Maize 740 793 790 846 954 992 1023 1042 1023 1025
Rice 120 125 109 133 162 181 197 189 216 224
Cassava 750 790 801 840 886 875 889 869 875 889
Yam 300 325 324 348 379 385 204 426 422 428
Sorghum 305 320 208 276 267 253 243 231 226 227
Soybeans 45 52 47 62 77 91 86 85 85 87
Millet 185 200 163 182 187 177 180 172 -- --
Cowpea 180 185 139 161 163 167 182 169 162 166
Source: MoFA (2015), Ghana Statistical Service, Revised 2014 Annual GDP Bulletin (June, 2015)
3.2 Crop production dominates the agricultural sector, accounting for more than 75
percent of total output, while livestock, fishing, and forestry comprise the remaining 25
percent. Ghana is the world’s second-largest cocoa producer after Côte d’Ivoire, and cocoa
represents over 10 percent of agricultural production (Figure 3.1). Other key crops include staple
foods such as maize, cassava, and yam. While domestic rice production is on the rise, imports still
meet about half of the country’s rapidly growing demand. Growth in agriculture has also largely
lagged behind all the other key sectors (Figure 3.2).
Figure 3.1: Agricultural Production by Subsector,
2014 Figure 3.2: Agricultural Growth vs. Growth in All
Other sectors, 2008-2014
Source: MoFA (2015) Source: SRID; World Bank data
3.3 The agricultural sector provides a critical source of employment for the 300,000-
350,000 new workers who enter the Ghanaian labor force each year. The economy’s fastest-
growing sector, extractive industries, is highly capital intensive and employs only a small fraction
of unskilled workers. By contrast, agriculture employs a huge number of unskilled workers and
provides livelihoods for more than 70 percent of the rural population, including a large share of
the country’s poorest households. The agricultural sector will likely continue to contribute to net
Other Crops
(excluding cocoa) 68.0
Cocoa 10.0
Forestry and Logging
11.0
Livestock 5.0 Fishing
6.0
-
5
10
15
20
25
2008 2009 2010 2011 2012 2013 2014 2015
Agriculture
Other sectors

20
job growth over the medium term,25 and improving agricultural output will remain vital to poverty
reduction. Analysis done recently through the on-going private sector diagnostic indicates that
agribusiness has among the highest multipliers (1.8) and creates 750 jobs for every additional
million dollar of output. Agriculture and related sectors have also the highest potential to employ
women and youth because it is the key primary sector, and employer of last resort for the majority
of the population. In this context, the agricultural sector’s slowing growth rate (Figure 4) raises
development policy concerns that extend well beyond its immediate macroeconomic impact.
3.4 Ghana’s recent poverty dynamics further underscore the importance of the
agricultural sector. Following significant progress in poverty reduction over the past decade,
moderate and extreme poverty rates as well as inequality have hardly changed in recent years.26
Meanwhile, the international experience has shown that agricultural growth reduces poverty by
about three times as much as non-agricultural growth.27 In addition to fostering poverty reduction
and inclusive growth, investments and policies designed to support agricultural productivity will
be critical to facilitate the structural transformation of the Ghanaian economy and to manage the
ongoing process of urbanization.
Figure 4: Annual Agricultural Sector Growth Rates
Source: Author’s calculations
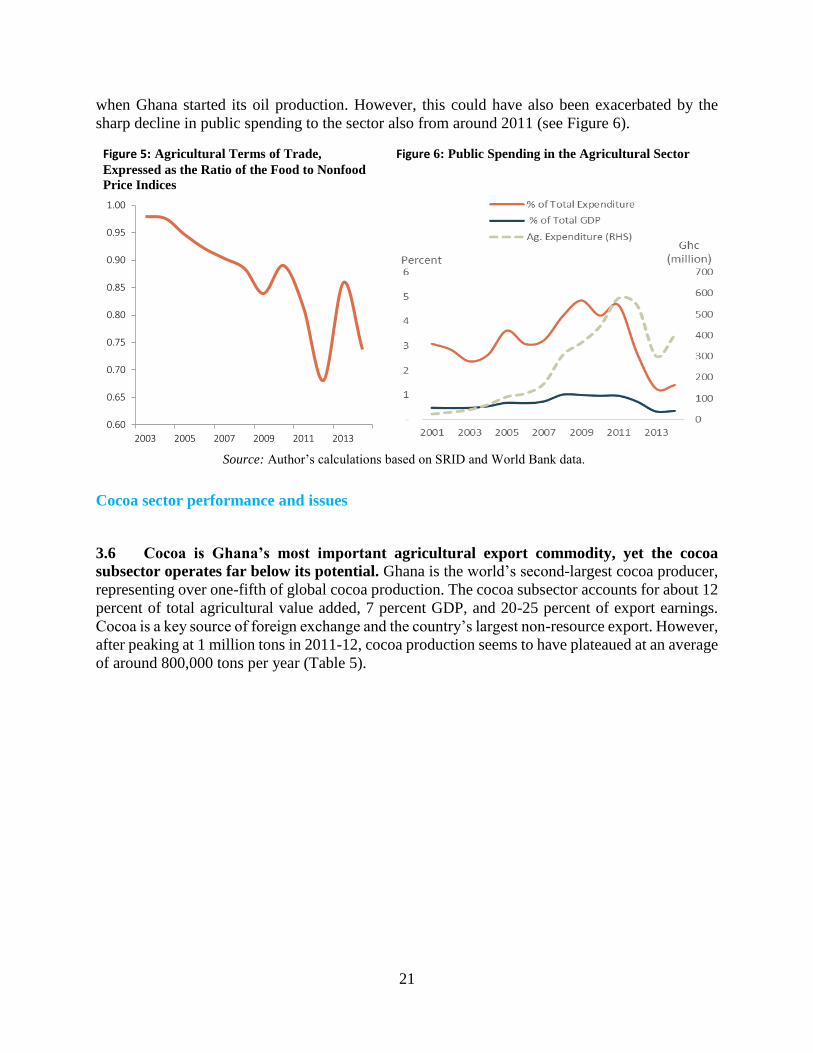
3.5 The agricultural sector experienced a sharp deterioration in its terms of trade from
2011. As can be seen from Figure 5, Ghana’s agricultural terms of trade, measured as a ratio of
food and non-food price indices has been on the decline, with a sharp fall after 2011. While the
impact of the extractive industries on Ghana’s non-resource economy has not yet been fully
explored, the agricultural sector experienced a sharp deterioration in its terms of trade from 2011
25 World Bank, 2016a. 26 World Bank, 2016b. 27 Christiansen et al., 2013; Christiansen and Kaminski, 2015.
y = -0.1242x + 253.44
-4
-2
0
2
4
6
8
2005 2006 2007 2008 2009 2010 2011 2012 2013 2014 2015 2016
An
nu
al A
gric
ult
ura
l Gro
wth
Rat
e (%
)
21
when Ghana started its oil production. However, this could have also been exacerbated by the
sharp decline in public spending to the sector also from around 2011 (see Figure 6).
Cocoa sector performance and issues
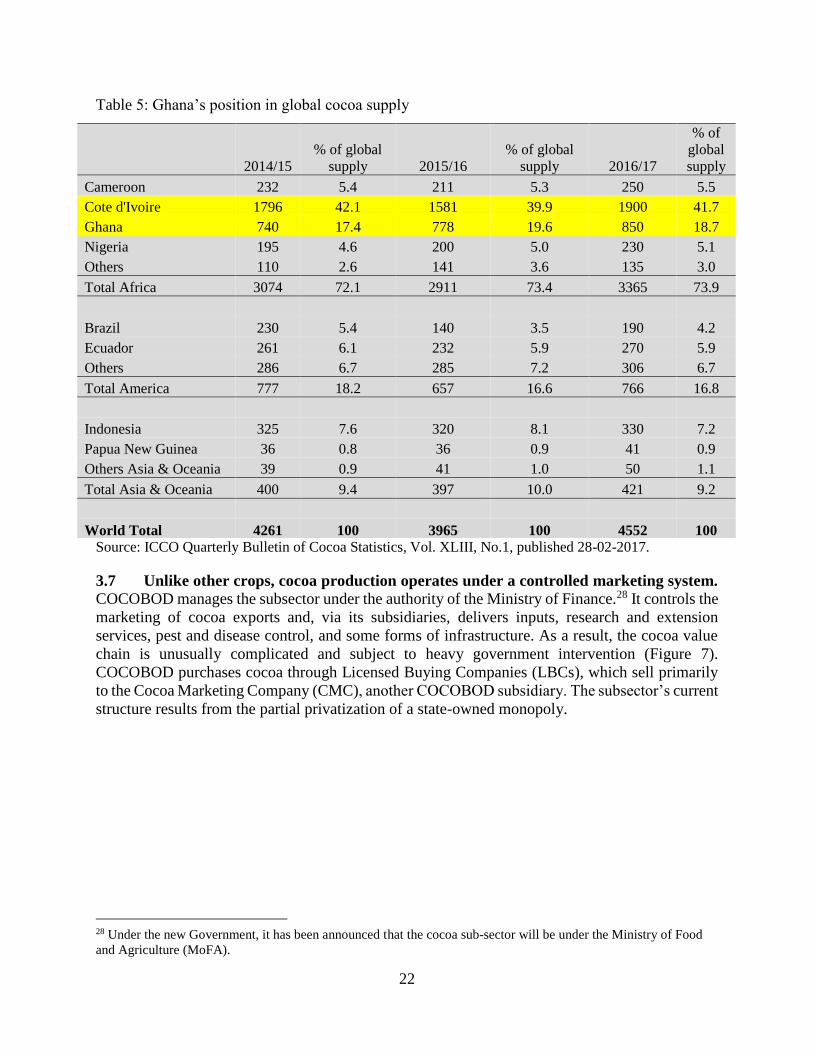
3.6 Cocoa is Ghana’s most important agricultural export commodity, yet the cocoa
subsector operates far below its potential. Ghana is the world’s second-largest cocoa producer,
representing over one-fifth of global cocoa production. The cocoa subsector accounts for about 12
percent of total agricultural value added, 7 percent GDP, and 20-25 percent of export earnings.
Cocoa is a key source of foreign exchange and the country’s largest non-resource export. However,
after peaking at 1 million tons in 2011-12, cocoa production seems to have plateaued at an average
of around 800,000 tons per year (Table 5).
Figure 5: Agricultural Terms of Trade,
Expressed as the Ratio of the Food to Nonfood
Price Indices
Figure 6: Public Spending in the Agricultural Sector
Source: Author’s calculations based on SRID and World Bank data.
0.60
0.65
0.70
0.75
0.80
0.85
0.90
0.95
1.00
2003 2005 2007 2009 2011 2013
22
Table 5: Ghana’s position in global cocoa supply
Source: ICCO Quarterly Bulletin of Cocoa Statistics, Vol. XLIII, No.1, published 28-02-2017.
3.7 Unlike other crops, cocoa production operates under a controlled marketing system.
COCOBOD manages the subsector under the authority of the Ministry of Finance.28 It controls the
marketing of cocoa exports and, via its subsidiaries, delivers inputs, research and extension
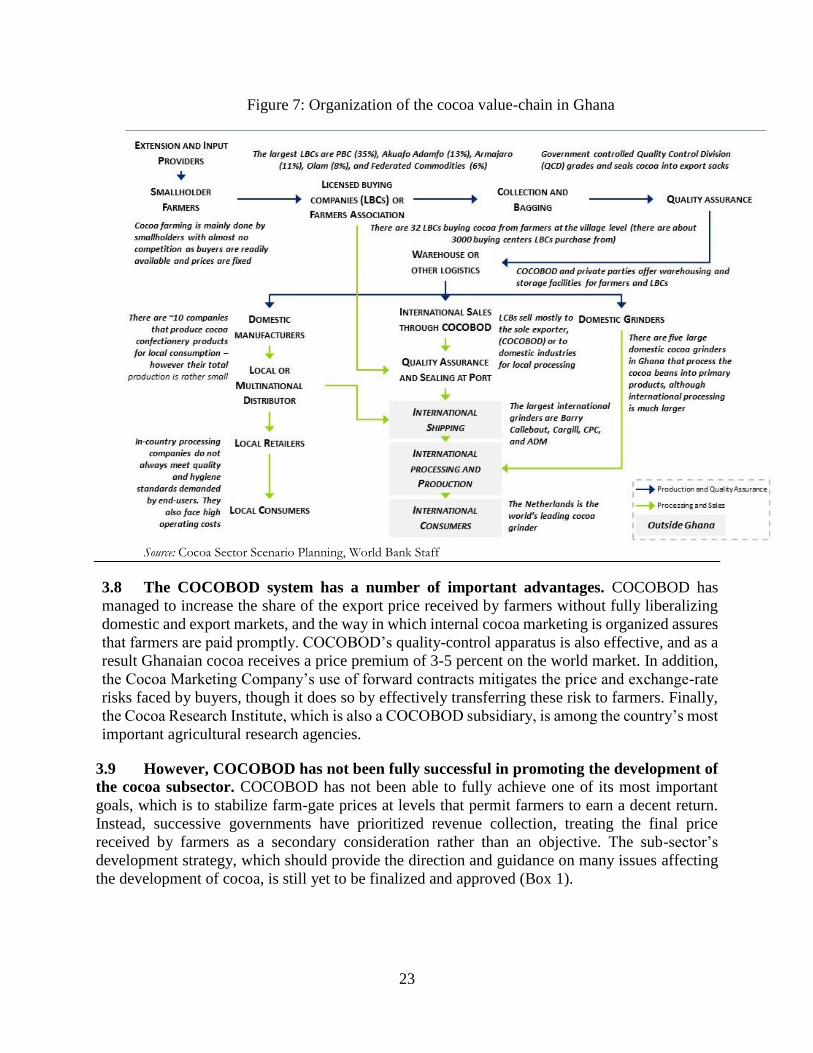
services, pest and disease control, and some forms of infrastructure. As a result, the cocoa value
chain is unusually complicated and subject to heavy government intervention (Figure 7).
COCOBOD purchases cocoa through Licensed Buying Companies (LBCs), which sell primarily
to the Cocoa Marketing Company (CMC), another COCOBOD subsidiary. The subsector’s current
structure results from the partial privatization of a state-owned monopoly.
28 Under the new Government, it has been announced that the cocoa sub-sector will be under the Ministry of Food
and Agriculture (MoFA).
2014/15
% of global
supply 2015/16
% of global
supply 2016/17
% of
global
supply
Cameroon 232 5.4 211 5.3 250 5.5
Cote d'Ivoire 1796 42.1 1581 39.9 1900 41.7
Ghana 740 17.4 778 19.6 850 18.7
Nigeria 195 4.6 200 5.0 230 5.1
Others 110 2.6 141 3.6 135 3.0
Total Africa 3074 72.1 2911 73.4 3365 73.9
Brazil 230 5.4 140 3.5 190 4.2
Ecuador 261 6.1 232 5.9 270 5.9
Others 286 6.7 285 7.2 306 6.7
Total America 777 18.2 657 16.6 766 16.8
Indonesia 325 7.6 320 8.1 330 7.2
Papua New Guinea 36 0.8 36 0.9 41 0.9
Others Asia & Oceania 39 0.9 41 1.0 50 1.1
Total Asia & Oceania 400 9.4 397 10.0 421 9.2
World Total 4261 100 3965 100 4552 100
23
Figure 7: Organization of the cocoa value-chain in Ghana
Source: Cocoa Sector Scenario Planning, World Bank Staff
3.8 The COCOBOD system has a number of important advantages. COCOBOD has
managed to increase the share of the export price received by farmers without fully liberalizing
domestic and export markets, and the way in which internal cocoa marketing is organized assures
that farmers are paid promptly. COCOBOD’s quality-control apparatus is also effective, and as a
result Ghanaian cocoa receives a price premium of 3-5 percent on the world market. In addition,
the Cocoa Marketing Company’s use of forward contracts mitigates the price and exchange-rate
risks faced by buyers, though it does so by effectively transferring these risk to farmers. Finally,
the Cocoa Research Institute, which is also a COCOBOD subsidiary, is among the country’s most
important agricultural research agencies.
3.9 However, COCOBOD has not been fully successful in promoting the development of
the cocoa subsector. COCOBOD has not been able to fully achieve one of its most important
goals, which is to stabilize farm-gate prices at levels that permit farmers to earn a decent return.
Instead, successive governments have prioritized revenue collection, treating the final price
received by farmers as a secondary consideration rather than an objective. The sub-sector’s
development strategy, which should provide the direction and guidance on many issues affecting
the development of cocoa, is still yet to be finalized and approved (Box 1).
24
Box 1: The Ghana Cocoa Sector Development Strategy II
For Ghana to continue to remain a key leader in the global cocoa supply chain, there is need to have a
strategy that will guide the development of the sector as well as provide a framework for public-private
partnerships in order to leverage stronger investment in this key sector. Ghana’s Cocoa Sector
Development Strategy (CSDS II) developed by COCOBOD seeks to modernize Ghana’s cocoa sector and
produce climate smart cocoa through increased farm productivity. The vision and strategy for
modernizing Ghana’s cocoa sector is based on three pillars: competitiveness, resilience, and
robustness. To modernize and have a more sustainable cocoa sector, Ghana needs to be more: (a)
competitive by increasing the productivity of cocoa producers and improve cost efficiency along the
cocoa supply chain; (b) resilient to challenges and risks related to global cocoa markets (demand and
supply), and climate change; and (c) robust by being an industry leader through innovation and
differentiation by focusing on high quality cocoa and niche markets. The Strategy was developed
following a number of scenario planning exercises in 2015, supported by the World Bank, World Cocoa
Foundation, the Royal Netherlands Embassy and Solidaridad. However, it is still to be finalized,
approved and notified by the government.
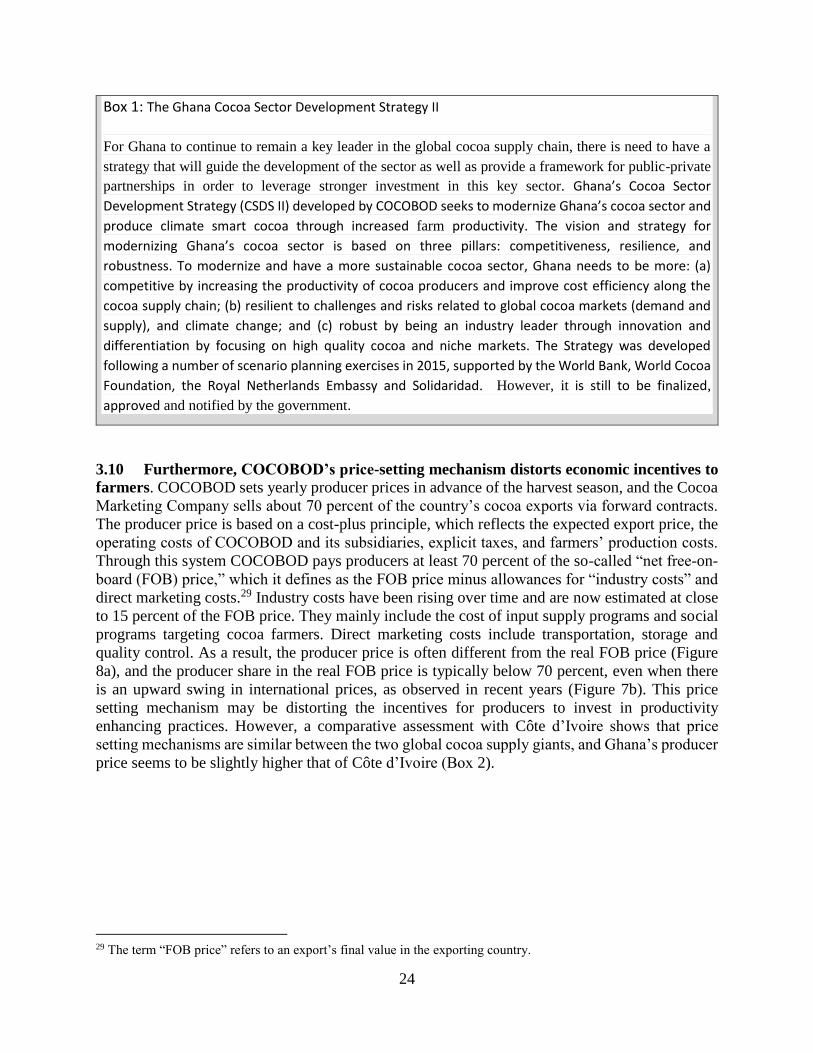
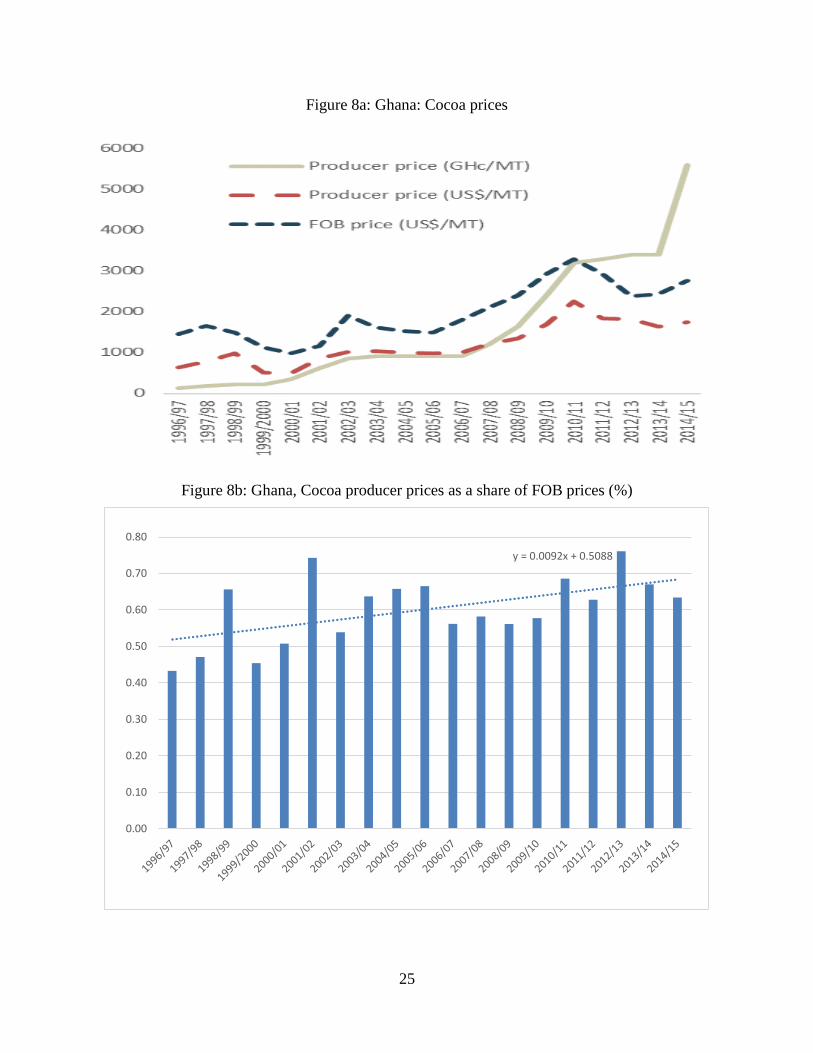
3.10 Furthermore, COCOBOD’s price-setting mechanism distorts economic incentives to
farmers. COCOBOD sets yearly producer prices in advance of the harvest season, and the Cocoa
Marketing Company sells about 70 percent of the country’s cocoa exports via forward contracts.
The producer price is based on a cost-plus principle, which reflects the expected export price, the
operating costs of COCOBOD and its subsidiaries, explicit taxes, and farmers’ production costs.
Through this system COCOBOD pays producers at least 70 percent of the so-called “net free-on-
board (FOB) price,” which it defines as the FOB price minus allowances for “industry costs” and
direct marketing costs.29 Industry costs have been rising over time and are now estimated at close
to 15 percent of the FOB price. They mainly include the cost of input supply programs and social
programs targeting cocoa farmers. Direct marketing costs include transportation, storage and
quality control. As a result, the producer price is often different from the real FOB price (Figure
8a), and the producer share in the real FOB price is typically below 70 percent, even when there
is an upward swing in international prices, as observed in recent years (Figure 7b). This price
setting mechanism may be distorting the incentives for producers to invest in productivity
enhancing practices. However, a comparative assessment with Côte d’Ivoire shows that price
setting mechanisms are similar between the two global cocoa supply giants, and Ghana’s producer
price seems to be slightly higher that of Côte d’Ivoire (Box 2).
29 The term “FOB price” refers to an export’s final value in the exporting country.
25
Figure 8a: Ghana: Cocoa prices
Figure 8b: Ghana, Cocoa producer prices as a share of FOB prices (%)
y = 0.0092x + 0.5088
0.00
0.10
0.20
0.30
0.40
0.50
0.60
0.70
0.80
26
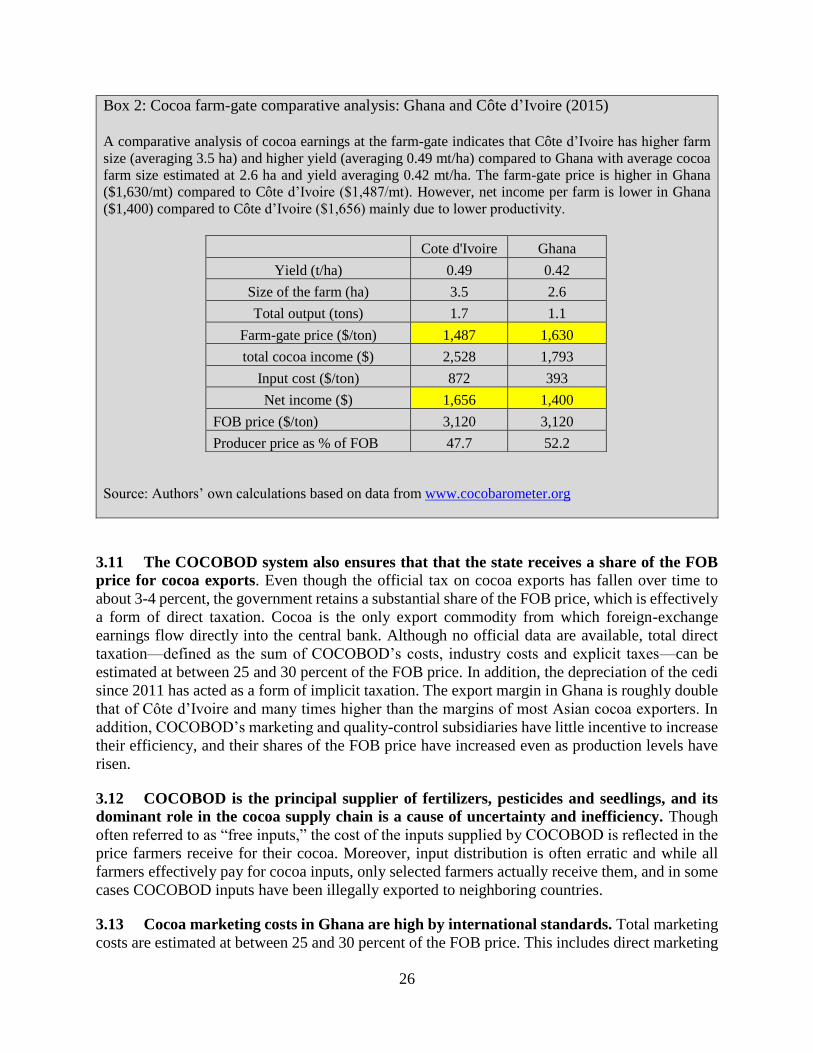
Box 2: Cocoa farm-gate comparative analysis: Ghana and Côte d’Ivoire (2015)
A comparative analysis of cocoa earnings at the farm-gate indicates that Côte d’Ivoire has higher farm
size (averaging 3.5 ha) and higher yield (averaging 0.49 mt/ha) compared to Ghana with average cocoa
farm size estimated at 2.6 ha and yield averaging 0.42 mt/ha. The farm-gate price is higher in Ghana
($1,630/mt) compared to Côte d’Ivoire ($1,487/mt). However, net income per farm is lower in Ghana
($1,400) compared to Côte d’Ivoire ($1,656) mainly due to lower productivity.
Cote d'Ivoire Ghana
Yield (t/ha) 0.49 0.42
Size of the farm (ha) 3.5 2.6
Total output (tons) 1.7 1.1
Farm-gate price ($/ton) 1,487 1,630
total cocoa income ($) 2,528 1,793
Input cost ($/ton) 872 393
Net income ($) 1,656 1,400
FOB price ($/ton) 3,120 3,120
Producer price as % of FOB 47.7 52.2
Source: Authors’ own calculations based on data from www.cocobarometer.org
3.11 The COCOBOD system also ensures that that the state receives a share of the FOB
price for cocoa exports. Even though the official tax on cocoa exports has fallen over time to
about 3-4 percent, the government retains a substantial share of the FOB price, which is effectively
a form of direct taxation. Cocoa is the only export commodity from which foreign-exchange
earnings flow directly into the central bank. Although no official data are available, total direct
taxation—defined as the sum of COCOBOD’s costs, industry costs and explicit taxes—can be
estimated at between 25 and 30 percent of the FOB price. In addition, the depreciation of the cedi
since 2011 has acted as a form of implicit taxation. The export margin in Ghana is roughly double
that of Côte d’Ivoire and many times higher than the margins of most Asian cocoa exporters. In
addition, COCOBOD’s marketing and quality-control subsidiaries have little incentive to increase
their efficiency, and their shares of the FOB price have increased even as production levels have
risen.
3.12 COCOBOD is the principal supplier of fertilizers, pesticides and seedlings, and its
dominant role in the cocoa supply chain is a cause of uncertainty and inefficiency. Though
often referred to as “free inputs,” the cost of the inputs supplied by COCOBOD is reflected in the
price farmers receive for their cocoa. Moreover, input distribution is often erratic and while all
farmers effectively pay for cocoa inputs, only selected farmers actually receive them, and in some
cases COCOBOD inputs have been illegally exported to neighboring countries.
3.13 Cocoa marketing costs in Ghana are high by international standards. Total marketing
costs are estimated at between 25 and 30 percent of the FOB price. This includes direct marketing
27
costs of about 17 percentage points, plus an estimated 8-10 percentage points to offset
COCOBOD’s costs. COCOBOD’s “industry costs” estimate varies significantly from year to year,
but on average they amount to approximately 15 percent of the FOB price. Direct marketing costs
are also high due to poor road infrastructure, inefficient port handling, and costs associated with
quality control.
3.14 COCOBOD’s pricing mechanism also limits competition in the cocoa subsector. The
fixed price that LBCs pay farmers based on minimum quality standards effectively eliminates the
possibility of price competition or product differentiation, and it discourages farmers from
investing in quality beyond the minimum standard required. Moreover, prices are uniform across
the country and do not reflect regional differences in production costs or local environmental and
social impacts. However, even in the absence of meaningful price competition among buyers,
farmers have benefited from a marked decrease in the collusion that characterized contract
negotiations in the past when the state was the sole buyer.
4. Key Constraints affecting agricultural sector growth and competitiveness
Ghana’s Public Expenditure in Agriculture
4.1 Public spending on agricultural development in Ghana is low both by regional and
international standards, and spending levels have declined in recent years. While Ghana
currently lacks an institutional mechanism to systematically collect, process, and publish
agricultural expenditure data,30 spending on the sector appears to have comprised just 5.2 percent
of total spending between 2001 and 2014 (Error! Reference source not found.). Moreover,
agricultural spending began to decline in 2007, and this trend accelerated in 2011. Nominal
spending fell from GH¢ 576 million in 2011 to an estimated GH¢ 400 million in 2014, while the
sector’s share in total spending dropped from 4.2 to just 1.2 percent. Agricultural spending has
also declined sharply relative to sectoral output, and by 2014 it equaled just 1.3 percent, far below
the rates of regional comparators, such as Burkina Faso (8 percent), Ethiopia (6 percent), Uganda
(5 percent), and Kenya (4 percent) - see also Figure 10.
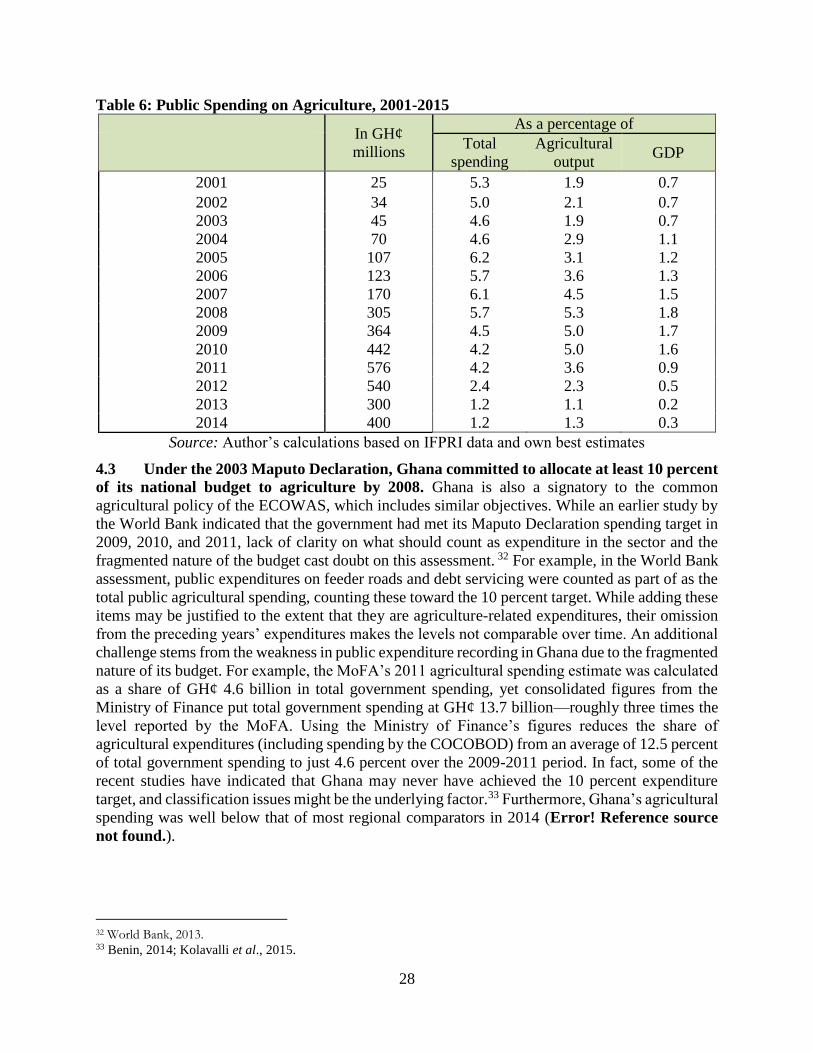
4.2 A large share of agricultural spending is devoted to the cocoa subsector. According to
African Union directives, spending by COCOBOD should be excluded when calculating public
agricultural spending. Excluding the cocoa subsector has a major impact on the estimated size of
agricultural spending in Ghana, as COCOBOD’s expenditures are very high relative to the value
of cocoa production. For example, between 2006 and 2011, the share of public agricultural
spending devoted to the cocoa subsector averaged three times the subsector’s share in total
agricultural output.31 Removing COCOBOD from the equation cuts agricultural spending as a
share of total spending in half, from an average of 5.2 percent to an average of just 2.6 percent
over the period.
30 The agricultural expenditure analysis presented in this chapter is based on data compiled by the MoFA in collaboration with Ghana’s development partners. See: World Bank (2013); Benin (2014); and Kolavalli et al. (2015). 31 See World Bank (2013).
28
Table 6: Public Spending on Agriculture, 2001-2015
In GH¢
millions
As a percentage of
Total
spending
Agricultural
output GDP
2001 25 5.3 1.9 0.7
2002 34 5.0 2.1 0.7
2003 45 4.6 1.9 0.7
2004 70 4.6 2.9 1.1
2005 107 6.2 3.1 1.2
2006 123 5.7 3.6 1.3
2007 170 6.1 4.5 1.5
2008 305 5.7 5.3 1.8
2009 364 4.5 5.0 1.7
2010 442 4.2 5.0 1.6
2011 576 4.2 3.6 0.9
2012 540 2.4 2.3 0.5
2013 300 1.2 1.1 0.2
2014 400 1.2 1.3 0.3
Source: Author’s calculations based on IFPRI data and own best estimates
4.3 Under the 2003 Maputo Declaration, Ghana committed to allocate at least 10 percent
of its national budget to agriculture by 2008. Ghana is also a signatory to the common
agricultural policy of the ECOWAS, which includes similar objectives. While an earlier study by
the World Bank indicated that the government had met its Maputo Declaration spending target in
2009, 2010, and 2011, lack of clarity on what should count as expenditure in the sector and the
fragmented nature of the budget cast doubt on this assessment. 32 For example, in the World Bank
assessment, public expenditures on feeder roads and debt servicing were counted as part of as the
total public agricultural spending, counting these toward the 10 percent target. While adding these
items may be justified to the extent that they are agriculture-related expenditures, their omission
from the preceding years’ expenditures makes the levels not comparable over time. An additional
challenge stems from the weakness in public expenditure recording in Ghana due to the fragmented
nature of its budget. For example, the MoFA’s 2011 agricultural spending estimate was calculated
as a share of GH¢ 4.6 billion in total government spending, yet consolidated figures from the
Ministry of Finance put total government spending at GH¢ 13.7 billion—roughly three times the
level reported by the MoFA. Using the Ministry of Finance’s figures reduces the share of
agricultural expenditures (including spending by the COCOBOD) from an average of 12.5 percent
of total government spending to just 4.6 percent over the 2009-2011 period. In fact, some of the
recent studies have indicated that Ghana may never have achieved the 10 percent expenditure
target, and classification issues might be the underlying factor.33 Furthermore, Ghana’s agricultural
spending was well below that of most regional comparators in 2014 (Error! Reference source
not found.).
32 World Bank, 2013. 33 Benin, 2014; Kolavalli et al., 2015.
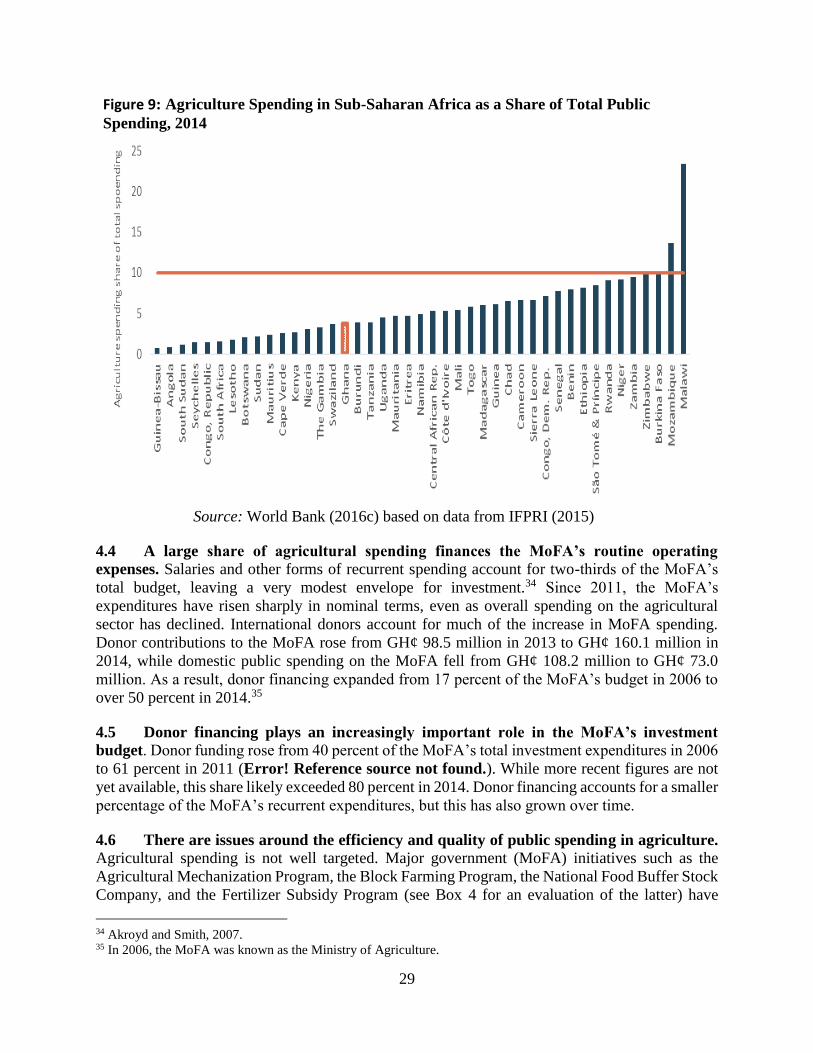
29
4.4 A large share of agricultural spending finances the MoFA’s routine operating
expenses. Salaries and other forms of recurrent spending account for two-thirds of the MoFA’s
total budget, leaving a very modest envelope for investment.34 Since 2011, the MoFA’s
expenditures have risen sharply in nominal terms, even as overall spending on the agricultural
sector has declined. International donors account for much of the increase in MoFA spending.
Donor contributions to the MoFA rose from GH¢ 98.5 million in 2013 to GH¢ 160.1 million in
2014, while domestic public spending on the MoFA fell from GH¢ 108.2 million to GH¢ 73.0
million. As a result, donor financing expanded from 17 percent of the MoFA’s budget in 2006 to
over 50 percent in 2014.35
4.5 Donor financing plays an increasingly important role in the MoFA’s investment
budget. Donor funding rose from 40 percent of the MoFA’s total investment expenditures in 2006
to 61 percent in 2011 (Error! Reference source not found.). While more recent figures are not
yet available, this share likely exceeded 80 percent in 2014. Donor financing accounts for a smaller
percentage of the MoFA’s recurrent expenditures, but this has also grown over time.
4.6 There are issues around the efficiency and quality of public spending in agriculture.
Agricultural spending is not well targeted. Major government (MoFA) initiatives such as the
Agricultural Mechanization Program, the Block Farming Program, the National Food Buffer Stock
Company, and the Fertilizer Subsidy Program (see Box 4 for an evaluation of the latter) have
34 Akroyd and Smith, 2007. 35 In 2006, the MoFA was known as the Ministry of Agriculture.
Figure 9: Agriculture Spending in Sub-Saharan Africa as a Share of Total Public
Spending, 2014
Source: World Bank (2016c) based on data from IFPRI (2015)

30
produced mixed results. Moreover, these programs tend to crowd out investment in proven
strategies for promoting sustainable long-term productivity growth, such as encouraging the use
of improved seeds and fertilizers, expanding irrigation networks. Investment in irrigation
development is especially low at about 3 percent of agricultural spending. The Ghana Irrigation
Development Authority (GIDA) receives no investment budget from the government, which
provides financing for salaries only.36
Table 7: Ministry of Food and Agriculture, Financing Composition and Expenditure
Breakdown, 2006-2011
Gov.
Spending
Donor
Spending
Total
Spending
Invest
ment
Current
Spending Donors Contributions
(millions of 2001 GH¢) (%)
Total Capital
Spending
Operational
Spending
2005 101 37.3 138.3 46.1 92.2 27 49.7 15.7
2006 134.5 27.4 161.9 54.0 107.9 16.9 40.4 5.2
2007 163.7 44 207.7 69.2 138.5 21.1 45.7 8.8
2008 186.5 78.5 265 88.3 176.7 29.6 39.8 24.5
2009 156.1 97.9 254 84.7 169.3 38.5 64.7 25.4
2010 169.1 98.9 268 89.3 178.7 36.9 57.6 26.6
2011 190.3 112.4 302.7 100.9 201.8 37.3 61.2 25.4
Note: Investment is assumed to represent one-third of total spending.
Source: Data in red are authors’ calculations, other data are from Kolavalli (2015).
4.7 In a context of chronic agricultural underinvestment, enhancing the efficiency and
quality of sectoral spending could generate substantial gains in productivity, employment,
and rural poverty reduction without compromising the government’s ongoing fiscal
consolidation.37 From 2008 to 2014, real public spending on agriculture was negatively correlated
with agricultural output growth (-0.39), suggesting an inefficient allocation of expenditures. Public
spending on the livestock, fisheries, and forestry subsectors is significantly higher than their
respective shares in agricultural output. Spending on cocoa exceeds its share in agricultural output
by a factor of three; however, a recent study by the International Food Policy Research Institute
(IFPRI)38 concluded that the rate of return to public spending in the non-cocoa sector is
significantly higher than in the cocoa sector.
4.8 The international experience reveals how better expenditure targeting can drive
agricultural growth. Between the 1980s and 2000s, investment in agricultural research and
development and the expansion of irrigation networks generated significant productivity growth
and sustained increases in rural incomes throughout much of the developing world. In India, the
government played a key role in creating a vibrant maize industry by deregulating seed imports,
developing improved seed varieties, attracting private investment, and tightening linkages with
36 Ghana currently has less than 20,000 hectares under irrigation, and most irrigation systems are inadequately
maintained. Under the World Bank-financed Ghana Commercial Agriculture Project, most irrigation schemes are
being rehabilitated, and the institutions that govern the irrigation subsector are being reformed. 37 Younger, 2015. 38 Benin, 2016.
31
consumer markets.39 In Kenya, the robust growth of the horticultural subsector was spurred by the
government’s efforts to liberalize the foreign-exchange market, facilitate seed and fertilizer
imports, eliminate constraints on the airfreight market, streamline customs processes and
phytosanitary certification procedures, enforce intellectual property rights, and promote
collaborative trade and investment strategies between the public and private sectors.40
4.9 Tight expenditure oversight and regular data collection are necessary to measure the
effectiveness of public spending, but the MoFA suffers from critical deficiencies in both
areas. The available data are not sufficient to enable a reliable analysis of the returns to different
types of expenditures, and no information on agricultural investment by region is currently
available. Ideally, MoFA should produce spatially disaggregated time-series data showing
spending on agricultural subsectors, functions, and activities in each region. Increasing investment
in systematic data collection should be a priority objective of a government-wide effort to enhance
information management and improve public expenditure targeting. MoFA is currently seeking
assistance from Ghana’s development partners to strengthen its data-collection capacity.
4.10 It is also critical to highlight that challenges on agricultural statistics stem from
ineffective decentralization. The experience with fiscal decentralization in Ghana, Nigeria and
Sudan is interpreted as autonomy of decentralized governments, such that the central government
provides funds to decentralized governments (regions and districts) and these decentralized
governments use the fiscal transfers according to their own plans with no reporting mechanisms
back to the central government. This leads to a situation where MOFA is unable to track how much
is spent on the sector by the decentralized governments, and whether such spending is consistent
with sector plans and priorities, as contained in the FASDEP and METASIP. and FASDEP II. It
is therefore important for the country to learn from countries which are on track towards a better
approach for fiscal decentralization e.g. Rwanda among others, in order to improve its own system.
Achieving Agriculture’s Growth Potential
4.11 For decades, Ghana’s agricultural growth has been driven by the expansion of
cultivated areas rather than by increased productivity. Ghana lags many other West African
countries in terms of per hectare yields for most crops.41 Actual yields remain far below their
potential, and per-hectare productivity has been largely stagnant over time. Production surveys
carried out by the International Food Policy Research Institute and the US Agency for International
Development have found even lower yields than the official MoFA figures, suggesting that the
MoFA may be significantly underestimating yield gaps. A study undertaken by Benin et.al. 201642
indicates that the extent to which a country could achieve higher and sustained rates of productivity
growth depends on the utilization of the productivity-enhancing inputs (improved seed, fertilizer)
and this is influenced by the relative abundance/scarcity of land, labour and capital and their
relative prices. Technical know-how, skills and education and availability of extension workers
also determines the extent of technology adoption and diffusion. Agro-ecological factors and other
39 Naik, 2006. 40 Whitaker and Kolavalli, 2006. 41 FAOSTAT, 2016. 42 Benin, S., (Ed), 2016. Agricultural productivity in Africa: Trends, Patterns and Determinants. International Food
Policy Research Institute (IFPRI), Washington, D.C
32
natural factors, which often determine the level of perceived risks among farmers also affect
technology adoption and diffusion. The analysis further shows that due to relatively higher
population density in Ghana compared to other countries in the sub-region, productivity growth
will have to derive from intensifying the use of productivity enhancing inputs, particularly high
quality seed and fertilizer.
4.12 Despite the economic importance of cocoa, and the large share of agricultural
spending devoted to it, Ghana’s average cocoa yield per hectare is among the lowest in the
world. The cocoa yield gap is estimated at more than 100 percent, meaning that the existing area
of cultivated land could produce twice as much cocoa as it does currently. Productivity growth is
constrained by the slow adoption of new technologies and limited access to inputs, especially
improved seed and fertilizer. In addition to the same productivity issues that affect other crops,
cocoa output is also inhibited by unnecessarily distortive interventions of the public sector.
4.13 Better expenditure targeting could enable policymakers to address key bottlenecks to
agricultural productivity and competitiveness. These include: (i) inadequate research and
extension services; (ii) financial constraints, especially among smallholder farmers; (iii) obstacles
to accessing domestic and international markets; (iv) limited irrigation development, particularly
in Ghana’s semi-arid northern regions; and (v) insecure land tenure. Shifting financial and
administrative resources to these five priority areas could greatly enhance the efficiency of
agricultural spending.
4.14 Linking farmers to markets is essential to agricultural development and rural poverty
reduction. Integrating smallholder farmers into value chains boosts income levels, encourages
technology transfer, supports diversification, and facilitates agribusiness investments. The Ghana
Commercial Agriculture Project (GCAP) attempts to leverage the benefits of integration by
supporting the commercialization of smallholder farming through Public-Private Partnership
(PPP)-type arrangements with large agricultural investors. The project also helps to improve
smallholder productivity and tighten market linkages via the nucleus farmer-outgrower model,
while building the government’s investment-promotion capacity, strengthening land tenure,
promoting sustainable land-access arrangements, supporting private investors through matching
grants, expanding and rehabilitating irrigation networks, and promoting institutional reform in the
irrigation subsector.
4.15 Adoption of smart-subsidies for promoting smallholder farmer’s uptake of improved
quality seed and fertilizer should only be implemented when there is identified market
failure. There is there is need to ensure adherence to the principles of smart subsidies, which
include, but not limited to: (a) targeting farmers that need to learn about proper use of fertilizers;
(b) targeting farmers that could use fertilizers profitably but are not able to do so due to working
capital constraints; and (c) delivering the subsidy through the private sector by using modern
voucher systems. This will help to reduce inefficiencies associated with most subsidy programs
(see Box 3).
33
Box 3: Ghana’s fertilizer subsidy program
Fertilizer subsidies: Average fertilizer use in Ghana is about 8 kg/ha – which is low even for African
standards. The National Fertilizer Subsidy Program is one of Government of Ghana's major agricultural
interventions instituted in 2008 as a direct response to increased global fertilizer and food prices with the
goal of increasing fertilizer use among smallholder farmers and to prevent a decline in crop production
below 2007 output levels. Even though the food crisis has long subsided, the fertilizer subsidy program
continues until today. During 2008-2009, a coupon system was used that basically involved a 50%
subsidy. In 2010 the coupon system made way for a waybill system in an effort to reduce the cost of
administering the program and stem diversion of fertilizers from intended target beneficiaries. Under
the waybill system fertilizer companies get reimbursed for the difference between the purchasing price
as stipulated in the contract with the government, and the price at which the companies’ agents (or
district offices of MoFA where there are no agents present) sell the fertilizer to farmers (which is also
part of the contract). The difference is supposed to reflect average transportation and handling costs
between the port and the final destination, as well as agents’ commission and margins. In 2013 some
changes were made in the fertilizer (and seed) subsidy program, including improved targeting (focus on
smallholders in the north), limiting the quantity per farmer and, most importantly, reducing the subsidy
element for fertilizer to less than 30%.
The goal of the subsidy program was to increase fertilizer use rate to at least 50 kg/ha as recommended in the
Medium Term Agricultural Sector Investment Plan (METASIP). One of the stated objectives of the Fertilizer
Subsidy Program is to raise the profitability of farm production. However, subsidies alone are not sufficient
to reach optimal levels of fertilizer use, let alone to increase the profitability of farming. While evaluations
carried out under controlled conditions at research stations suggest a substantial yield response from higher
levels of fertilizer use, research by IFPRI (in collaboration with the Crops Research Institute (CRI) and the
Savannah Agricultural Research Institute (SARI)) has determined that yield response (and therefore
profitability) of fertilizer under actual farmer’ conditions - where other factors that determine yield may not
be available at optimal levels – is much lower.
It is also important to note a number of other important pitfalls of the fertilizer subsidy program in Ghana.
The first concerns the timeliness of the program – both farmers and retailers complain about subsidized
fertilizer arriving late, especially in the south where the growing season starts earliest. Second, fertilizer
distributors feel that procedures associated with the waybill system remain cumbersome including a lack of
clarity of the procedures on all aspects of the operations.
Finally, the available evidence regarding the impact of the program is largely limited to an IFPRI-led study
for maize and suggests that for open pollinated varieties under actual farmer conditions, fertilizer is
profitable only at relatively low levels of usage. However, as shown by e.g. Wienco in its large outgrowers
scheme in northern Ghana (which involves more than 10,000 maize farmers under its Masara N’arziki
Farmers Association), a different picture emerges once hybrid varieties are introduced and improved
agronomic practices are adhered to. Combined these substantially raise the level of fertilizer use that can be
economically justified – even without subsidies.
4.16 The other critical, but often neglected factor is that Ghana’s largely traditional land-
tenure system is not conducive to agricultural investment. Formal land registration processes
remain highly inefficient, and landowners often lack enforceable titles, especially in rural areas.
The World Bank is supporting a series of land administration projects designed to strengthen
ownership rights by creating an up-to-date inventory of land resources and introducing a modern
land-registration framework. Greater tenure security will facilitate access to land, promote
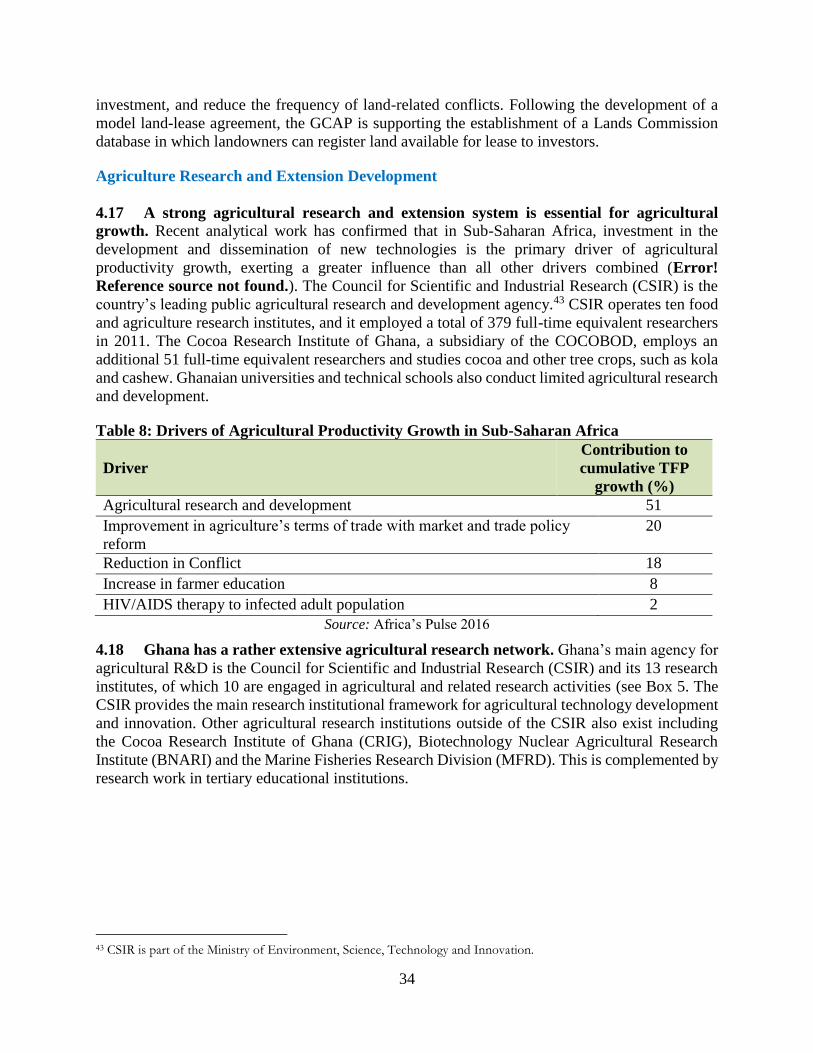
34
investment, and reduce the frequency of land-related conflicts. Following the development of a
model land-lease agreement, the GCAP is supporting the establishment of a Lands Commission
database in which landowners can register land available for lease to investors.
Agriculture Research and Extension Development
4.17 A strong agricultural research and extension system is essential for agricultural
growth. Recent analytical work has confirmed that in Sub-Saharan Africa, investment in the
development and dissemination of new technologies is the primary driver of agricultural
productivity growth, exerting a greater influence than all other drivers combined (Error!
Reference source not found.). The Council for Scientific and Industrial Research (CSIR) is the
country’s leading public agricultural research and development agency.43 CSIR operates ten food
and agriculture research institutes, and it employed a total of 379 full-time equivalent researchers
in 2011. The Cocoa Research Institute of Ghana, a subsidiary of the COCOBOD, employs an
additional 51 full-time equivalent researchers and studies cocoa and other tree crops, such as kola
and cashew. Ghanaian universities and technical schools also conduct limited agricultural research
and development.
Table 8: Drivers of Agricultural Productivity Growth in Sub-Saharan Africa
Driver
Contribution to
cumulative TFP
growth (%)
Agricultural research and development 51
Improvement in agriculture’s terms of trade with market and trade policy
reform
20
Reduction in Conflict 18
Increase in farmer education 8
HIV/AIDS therapy to infected adult population 2
Source: Africa’s Pulse 2016
4.18 Ghana has a rather extensive agricultural research network. Ghana’s main agency for
agricultural R&D is the Council for Scientific and Industrial Research (CSIR) and its 13 research
institutes, of which 10 are engaged in agricultural and related research activities (see Box 5. The
CSIR provides the main research institutional framework for agricultural technology development
and innovation. Other agricultural research institutions outside of the CSIR also exist including
the Cocoa Research Institute of Ghana (CRIG), Biotechnology Nuclear Agricultural Research
Institute (BNARI) and the Marine Fisheries Research Division (MFRD). This is complemented by
research work in tertiary educational institutions.
43 CSIR is part of the Ministry of Environment, Science, Technology and Innovation.
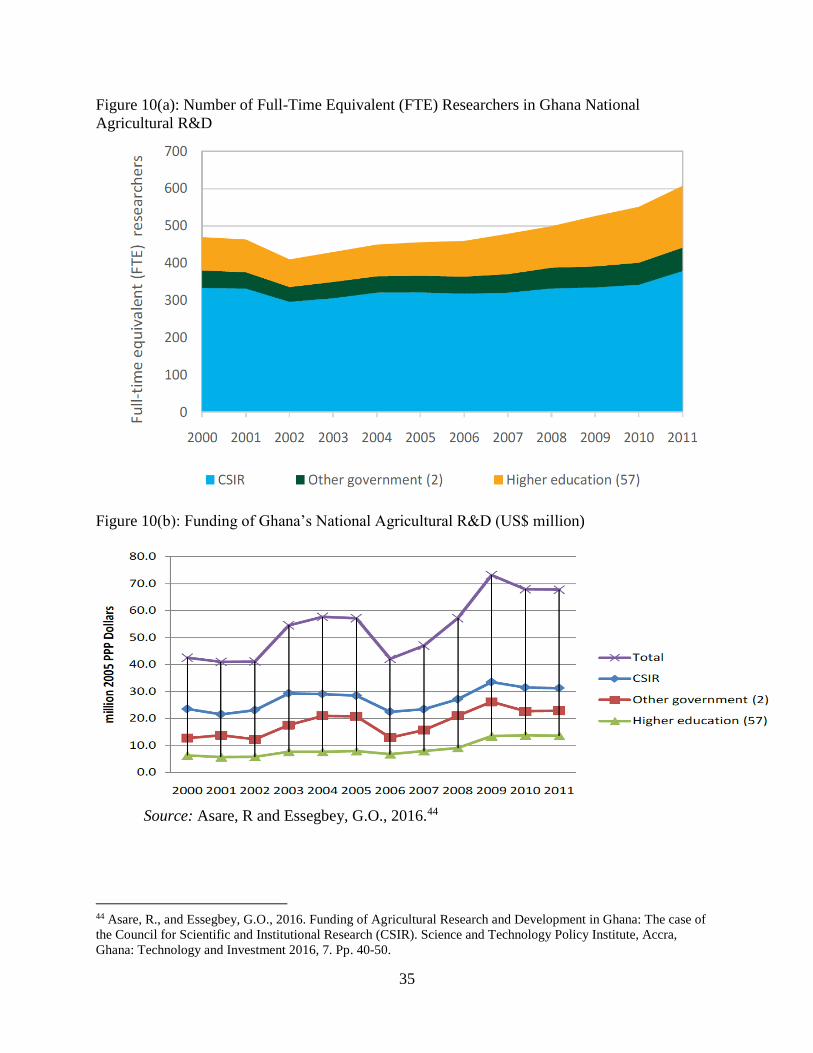
35
Figure 10(a): Number of Full-Time Equivalent (FTE) Researchers in Ghana National
Agricultural R&D
Figure 10(b): Funding of Ghana’s National Agricultural R&D (US$ million)
Source: Asare, R and Essegbey, G.O., 2016.44
44 Asare, R., and Essegbey, G.O., 2016. Funding of Agricultural Research and Development in Ghana: The case of
the Council for Scientific and Institutional Research (CSIR). Science and Technology Policy Institute, Accra,
Ghana: Technology and Investment 2016, 7. Pp. 40-50.
36
4.19 The main constraint facing the sustainability of Ghana’s agricultural research
network is the declining public funding and the likely effects this has on its core mandate. A
recent analysis (Asare and Essegbey, 2016) shows that while the number of Full-Time Researchers
(FTE) increased from 470 in 2000 to 607 in 2011, the trend in public R&D expenditure levelled
off by 2011 (Figures 10(a) and 10(b). Furthermore, given the increasing trend in FTE, the structure
of the R&D expenditure is dominated by staff emoluments. On average, staff salaries account for
78 per cent of the total agricultural R&D expenditure in CSIR, while operating and program cost
and capital investments account for 20 per cent and 2 per cent, respectively. Over time, there has
been a drastic decline in capital investments from 6.7 per cent of total R&D expenditure in 2000
to 0.1 per cent in 2011. Government budget accounts for over 85 percent of the R&D funding and
there has been an increasing gap between budgeted and actual expenditure. As such available
funding has largely been used to pay researchers without the provision of requisite financial
resources for the necessary R&D infrastructure. Maintenance, rehabilitation and operation of
infrastructure such as laboratories, offices and equipment for research and development have also
become a major challenge.
4.20 Agricultural research tends to be highly fragmented among many small, externally
financed projects with limited coordination and minimal private sector involvement. There
is little contact between researchers and extension agents, and technological-adoption studies are
rare.45 Research spending accounts for about 0.7 percent of agricultural output (excluding cocoa46),
above the SSA average of 0.5 percent, but below the rates of regional leaders, such as Kenya (1.4
percent) and South Africa (2 percent), as well as the African Union target of 1 percent. Moreover,
many research projects are not geared towards solving the most urgent constraints faced by
farmers. In addition, human-resource constraints are serious and growing. Nearly 40 percent of
agricultural researchers in Ghana are over 50 years old, and only about one-third hold doctoral
degrees. Salaries consume 80 percent of the research budget, leaving few resources for investment
in physical infrastructure, equipment, staff development, and information systems. It is estimated
that less than 4 percent of the CSIR budget is available to finance new operations. As a result,
researchers are almost totally dependent on donor funding, which is unpredictable and allocated
according to donor objectives that are not necessary consistent with those of the government or
with the interests of farmers.
4.21 Filling existing and anticipated staffing gaps at CSIR’s institutes will require the
creation of detailed human-resource development plans, including training schedules and
career tracks. CSIR should prioritize doctoral-level training and mentoring programs for junior
scientists. In addition, CSIR’s management will need to create a more conducive work
environment by developing opportunities for scientific achievement and career advancement. For
example, promotion should be based on scientific merit rather than seniority. Meanwhile, raising
the retirement age to 65 would slow the impending loss of senior researchers in the short-to-
medium term.
4.22 There is almost no private sector participation in agricultural research in Ghana. Private firms import hybrid seeds, fertilizers, pesticides, and new livestock breeds, but Ghana lacks
the strong biosafety and regulatory framework necessary to take full advantage of biotechnology
45 The latest adoption study on maize dates from 1997, and no similar studies have been done for rice or cassava. 46 Beintema et al., 2014.
37
and transgenics. Conducting timely evaluations of emerging genetic traits would enable them to
be rapidly approved and inserted into existing commercial crop varieties. Currently, private firms
that import sophisticated productive technologies tend to focus on export-oriented cash crops, such
as oil palm, while technological uptake among smallholders who produce cereals, tubers, and other
food crops remains limited. Adopting more stringent labelling rules would help to improve quality
control along the seed supply chain, and authorities should facilitate joint ventures between
multinationals and local seed companies. Furthermore, easing of regulations related to importation
of foundation seed, and easing of restrictions related to intellectual property rights would help to
develop a more competitive seed domestic sector, capable of supplying quality seed which is
critical for productivity growth.47
4.23 The challenges affecting the R&D system are also reflected in the seed system which
is largely public-sector driven, with a legal and regulatory framework that imposes some
restrictions on the participation of the private sector. Ghana’s seed sector has undergone some
significant changes in the past few years, with approval of the new seed law and regulations (Plant
Breeders Law of 2013), the appointment of the National Seed Council, and the emergence of a
more diversified commercial seed sector. However, while the new legal framework promises new
incentives to spur the seed industry, the direction of the seed system development is determined
by the agronomic and economic considerations and that there are several important issues that
policymakers need to address if Ghana’s commercial seed sector is to progress. Three of these are
related to the implementation and enforcement of regulations (for variety release, seed
certification, and consumer protection) that come under the responsibility of the National Seed
Council. Other issues concern the management of CSIR’s agricultural research institutes (breeder
seed supply and information provision), and the other issue is seed price (Tripp, R and Mensah-
Bonsu, A, 2013). All these issues have implications on the development of the seed systems and
the associated productivity which determines the rate of return (ROR) of R&D system.
4.24 Promoting technology transfer is often the most cost-effective way to boost
agricultural productivity, yet Ghana has made little progress in encouraging the adoption of
improved technologies. Many agricultural innovations remain underutilized despite their proven
productivity benefits, such as the improved cassava varieties developed with support from the
World Bank-financed West Africa Agricultural Productivity Project (WAAPP). Overcoming this
apparent “last mile” problem by encouraging farmers to adopt existing technologies will require
more effective extension services. However, these services are inherently expensive, and
expanding public agricultural extension may be infeasible in the context of the ongoing fiscal
consolidation. The government should therefore explore innovative strategies for encouraging
private sector engagement in agricultural extension and forge new PPPs in the agricultural sector.
4.25 To expand access to private extension services, the government should develop a new
framework for collaborating with agricultural input companies, distributors and dealers,
transport and logistics providers, food processors and retailers, and telecom operators. Whereas public extension services are typically focused on the supply side, private services are
usually driven by the quality and scale demands of agro-processors, wholesalers, and exporters.
Under a fully private extension system, the costs of extension services are financed by the
efficiency improvements they generate. As farmers adopt new technologies, marginal yields
47 Enabling the Business of Agriculture (2016)
38
increase, output quality improves, economies of scale develop, and new opportunities for value-
addition arise. If these efforts are successful, improved farmer productivity and the elaboration of
agricultural value chains will more than offset the cost of providing extension services.
4.26 While they offer significant advantages, private extension services are not always a
perfect substitute for public services, even within a single geographic area. In certain cases,
PPPs may provide a superior alternative to wholly public or private systems.48 Under one common
PPP framework the government provides vouchers to farmers, who then redeem them for private
training services. Subsidizing outgrower schemes in which nucleus farms transfer knowledge to
smallholders is another promising option, one that is currently being pursued as part of the World
Bank-financed Ghana Commercial Agriculture Project (GCAP).
4.27 Beyond marginal productivity, strengthening the resiliency of agricultural
production should be a top policy priority. This includes mitigating the impact of short-term
weather-related fluctuations on agricultural output and coping with the complex long-term effects
of climate change. A recently completed World Bank risk assessment concluded that farming
households in Ghana’s northern regions are most susceptible to production and price shocks,
including those caused by seasonal droughts and flooding as well as persistent increases in
temperature, and that climate change is intensifying all of these risks.49
4.28 Promoting the adoption of drought-tolerant and fast-maturing crop varieties and
improving water-management systems will enable farmers to better adapt their production
methods to an increasingly unpredictable climate. The World Bank-supported Sustainable
Land and Water Management Project and the West Africa Regional Fisheries Program both focus
on promoting the sustainable management of land, water, and other natural resources through
accelerated technology transfer. In addition, the GCAP is promoting improved rain-fed rice
cultivation in the Savannah Accelerated Development Authority (SADA) zone50 by providing
matching investment grants to rice producers.
4.29 In addition to technology transfer, infrastructure investment is crucial to agricultural
resilience and long-term productivity growth. Improved transportation and storage
infrastructure can help reduce post-harvest losses and mitigate price volatility, and more efficient
and extensive irrigation systems will be vital to increase crop yields and reduce vulnerability to
weather-related shocks. However, irrigation investment currently represents just 3 percent of total
public spending on agriculture. Expanding irrigation access will require not only rehabilitating and
modernizing public irrigation and drainage systems, but also reforming the institutions that oversee
them. With support from the GCAP, the government has begun a reform program targeting the
Ghana Irrigation Development Authority and the Irrigation Company of the Upper Region,
accompanied by investments in the rehabilitation of existing irrigation infrastructure. Once the
rehabilitation process is complete, management responsibilities will be handed over to private
48 Zhou and Baby, 2015. 49 Choudhary et al., 2015. 50 The SADA zone includes the Northern Region, Upper East Region, Upper West Region and bordering districts of
the Brong Ahafo Region and Volta Region. The SADA zone covers about 54 percent of Ghana’s land area but is home
to only 5 million people, less than 20 percent of Ghana’s population. Most of the SADA zone is semi-arid. According
to a 2015 World Bank Poverty Assessment, the SADA zone has a poverty rate of over 40 percent, roughly double the
national average of 21.4 percent.
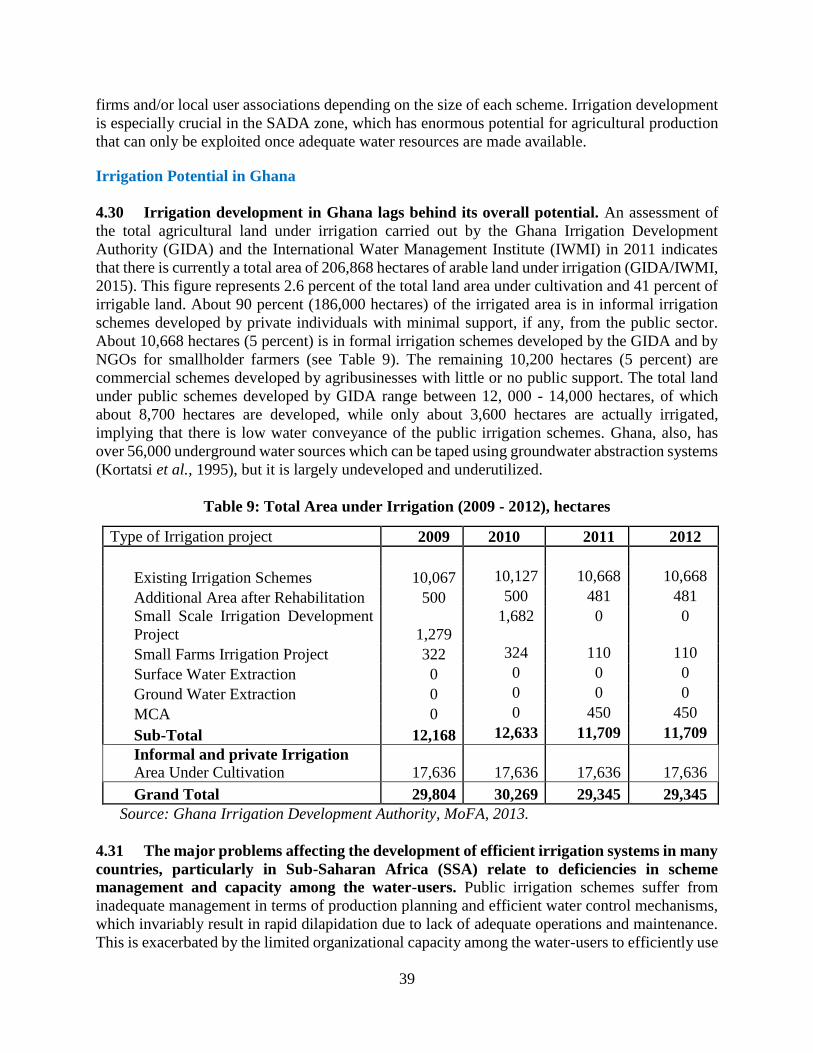
39
firms and/or local user associations depending on the size of each scheme. Irrigation development
is especially crucial in the SADA zone, which has enormous potential for agricultural production
that can only be exploited once adequate water resources are made available.
Irrigation Potential in Ghana
4.30 Irrigation development in Ghana lags behind its overall potential. An assessment of
the total agricultural land under irrigation carried out by the Ghana Irrigation Development
Authority (GIDA) and the International Water Management Institute (IWMI) in 2011 indicates
that there is currently a total area of 206,868 hectares of arable land under irrigation (GIDA/IWMI,
2015). This figure represents 2.6 percent of the total land area under cultivation and 41 percent of
irrigable land. About 90 percent (186,000 hectares) of the irrigated area is in informal irrigation
schemes developed by private individuals with minimal support, if any, from the public sector.
About 10,668 hectares (5 percent) is in formal irrigation schemes developed by the GIDA and by
NGOs for smallholder farmers (see Table 9). The remaining 10,200 hectares (5 percent) are
commercial schemes developed by agribusinesses with little or no public support. The total land
under public schemes developed by GIDA range between 12, 000 - 14,000 hectares, of which
about 8,700 hectares are developed, while only about 3,600 hectares are actually irrigated,
implying that there is low water conveyance of the public irrigation schemes. Ghana, also, has
over 56,000 underground water sources which can be taped using groundwater abstraction systems
(Kortatsi et al., 1995), but it is largely undeveloped and underutilized.
Table 9: Total Area under Irrigation (2009 - 2012), hectares
Type of Irrigation project 2009 2010 2011 2012
Existing Irrigation Schemes 10,067 10,127 10,668 10,668
Additional Area after Rehabilitation 500 500 481 481
Small Scale Irrigation Development
Project 1,279
1,682 0 0
Small Farms Irrigation Project 322 324 110 110
Surface Water Extraction 0 0 0 0
Ground Water Extraction 0 0 0 0
MCA 0 0 450 450
Sub-Total 12,168 12,633 11,709 11,709
Informal and private Irrigation
Area Under Cultivation 17,636 17,636 17,636 17,636
Grand Total 29,804 30,269 29,345 29,345
Source: Ghana Irrigation Development Authority, MoFA, 2013.
4.31 The major problems affecting the development of efficient irrigation systems in many
countries, particularly in Sub-Saharan Africa (SSA) relate to deficiencies in scheme
management and capacity among the water-users. Public irrigation schemes suffer from
inadequate management in terms of production planning and efficient water control mechanisms,
which invariably result in rapid dilapidation due to lack of adequate operations and maintenance.
This is exacerbated by the limited organizational capacity among the water-users to efficiently use
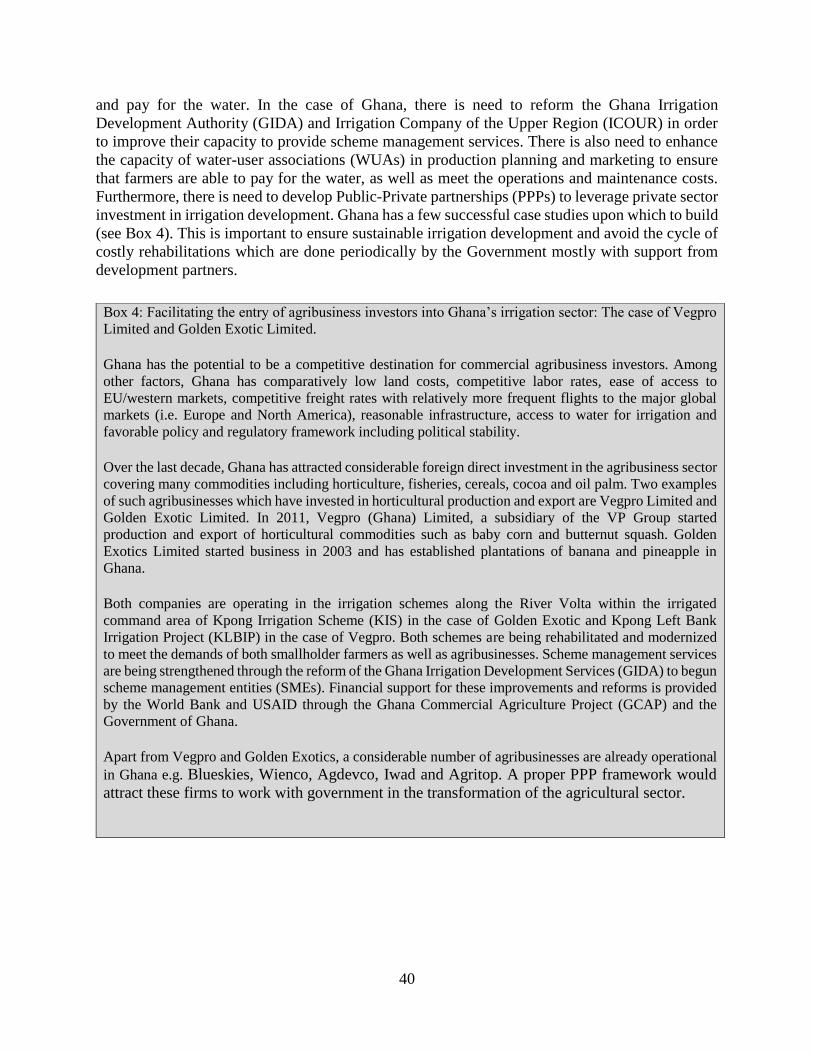
40
and pay for the water. In the case of Ghana, there is need to reform the Ghana Irrigation
Development Authority (GIDA) and Irrigation Company of the Upper Region (ICOUR) in order
to improve their capacity to provide scheme management services. There is also need to enhance
the capacity of water-user associations (WUAs) in production planning and marketing to ensure
that farmers are able to pay for the water, as well as meet the operations and maintenance costs.
Furthermore, there is need to develop Public-Private partnerships (PPPs) to leverage private sector
investment in irrigation development. Ghana has a few successful case studies upon which to build
(see Box 4). This is important to ensure sustainable irrigation development and avoid the cycle of
costly rehabilitations which are done periodically by the Government mostly with support from
development partners.
Box 4: Facilitating the entry of agribusiness investors into Ghana’s irrigation sector: The case of Vegpro
Limited and Golden Exotic Limited.
Ghana has the potential to be a competitive destination for commercial agribusiness investors. Among
other factors, Ghana has comparatively low land costs, competitive labor rates, ease of access to
EU/western markets, competitive freight rates with relatively more frequent flights to the major global
markets (i.e. Europe and North America), reasonable infrastructure, access to water for irrigation and
favorable policy and regulatory framework including political stability.
Over the last decade, Ghana has attracted considerable foreign direct investment in the agribusiness sector
covering many commodities including horticulture, fisheries, cereals, cocoa and oil palm. Two examples
of such agribusinesses which have invested in horticultural production and export are Vegpro Limited and
Golden Exotic Limited. In 2011, Vegpro (Ghana) Limited, a subsidiary of the VP Group started
production and export of horticultural commodities such as baby corn and butternut squash. Golden
Exotics Limited started business in 2003 and has established plantations of banana and pineapple in
Ghana.
Both companies are operating in the irrigation schemes along the River Volta within the irrigated
command area of Kpong Irrigation Scheme (KIS) in the case of Golden Exotic and Kpong Left Bank
Irrigation Project (KLBIP) in the case of Vegpro. Both schemes are being rehabilitated and modernized
to meet the demands of both smallholder farmers as well as agribusinesses. Scheme management services
are being strengthened through the reform of the Ghana Irrigation Development Services (GIDA) to begun
scheme management entities (SMEs). Financial support for these improvements and reforms is provided
by the World Bank and USAID through the Ghana Commercial Agriculture Project (GCAP) and the
Government of Ghana.
Apart from Vegpro and Golden Exotics, a considerable number of agribusinesses are already operational
in Ghana e.g. Blueskies, Wienco, Agdevco, Iwad and Agritop. A proper PPP framework would
attract these firms to work with government in the transformation of the agricultural sector.
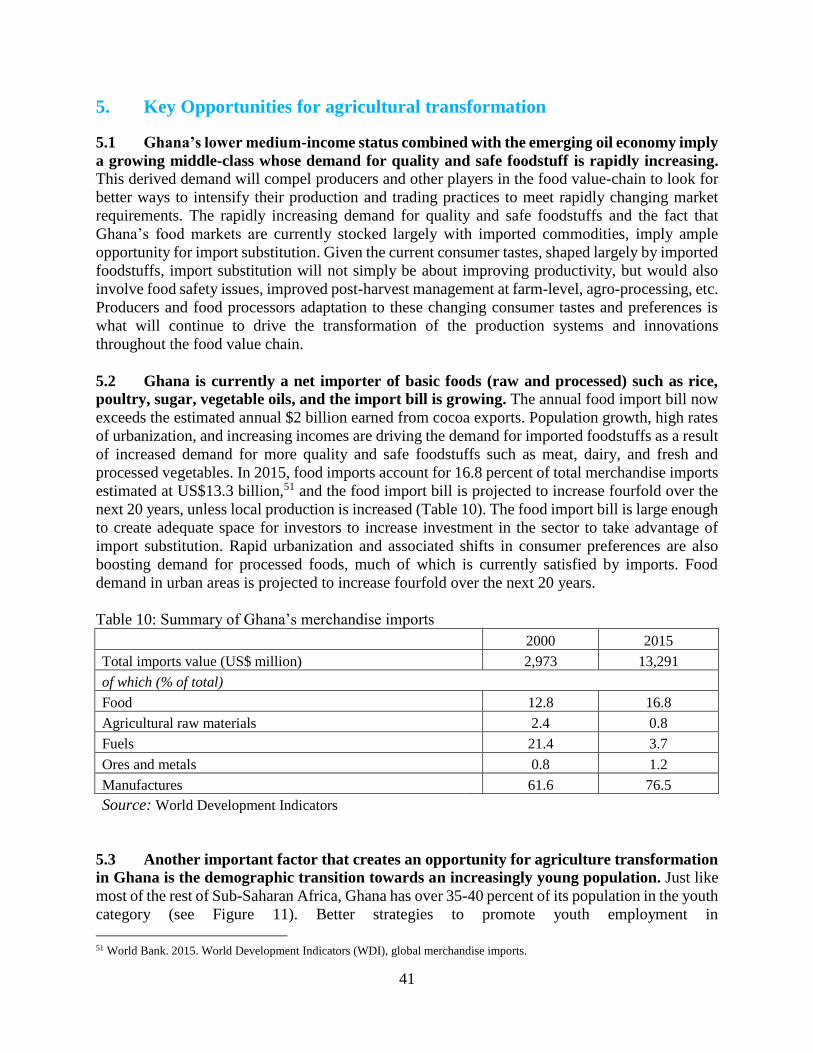
41
5. Key Opportunities for agricultural transformation
5.1 Ghana’s lower medium-income status combined with the emerging oil economy imply
a growing middle-class whose demand for quality and safe foodstuff is rapidly increasing. This derived demand will compel producers and other players in the food value-chain to look for
better ways to intensify their production and trading practices to meet rapidly changing market
requirements. The rapidly increasing demand for quality and safe foodstuffs and the fact that
Ghana’s food markets are currently stocked largely with imported commodities, imply ample
opportunity for import substitution. Given the current consumer tastes, shaped largely by imported
foodstuffs, import substitution will not simply be about improving productivity, but would also
involve food safety issues, improved post-harvest management at farm-level, agro-processing, etc.
Producers and food processors adaptation to these changing consumer tastes and preferences is
what will continue to drive the transformation of the production systems and innovations
throughout the food value chain.
5.2 Ghana is currently a net importer of basic foods (raw and processed) such as rice,
poultry, sugar, vegetable oils, and the import bill is growing. The annual food import bill now
exceeds the estimated annual $2 billion earned from cocoa exports. Population growth, high rates
of urbanization, and increasing incomes are driving the demand for imported foodstuffs as a result
of increased demand for more quality and safe foodstuffs such as meat, dairy, and fresh and
processed vegetables. In 2015, food imports account for 16.8 percent of total merchandise imports
estimated at US$13.3 billion,51 and the food import bill is projected to increase fourfold over the
next 20 years, unless local production is increased (Table 10). The food import bill is large enough
to create adequate space for investors to increase investment in the sector to take advantage of
import substitution. Rapid urbanization and associated shifts in consumer preferences are also
boosting demand for processed foods, much of which is currently satisfied by imports. Food
demand in urban areas is projected to increase fourfold over the next 20 years.
Table 10: Summary of Ghana’s merchandise imports
2000 2015
Total imports value (US$ million) 2,973 13,291
of which (% of total)
Food 12.8 16.8
Agricultural raw materials 2.4 0.8
Fuels 21.4 3.7
Ores and metals 0.8 1.2
Manufactures 61.6 76.5
Source: World Development Indicators
5.3 Another important factor that creates an opportunity for agriculture transformation
in Ghana is the demographic transition towards an increasingly young population. Just like
most of the rest of Sub-Saharan Africa, Ghana has over 35-40 percent of its population in the youth
category (see Figure 11). Better strategies to promote youth employment in
51 World Bank. 2015. World Development Indicators (WDI), global merchandise imports.
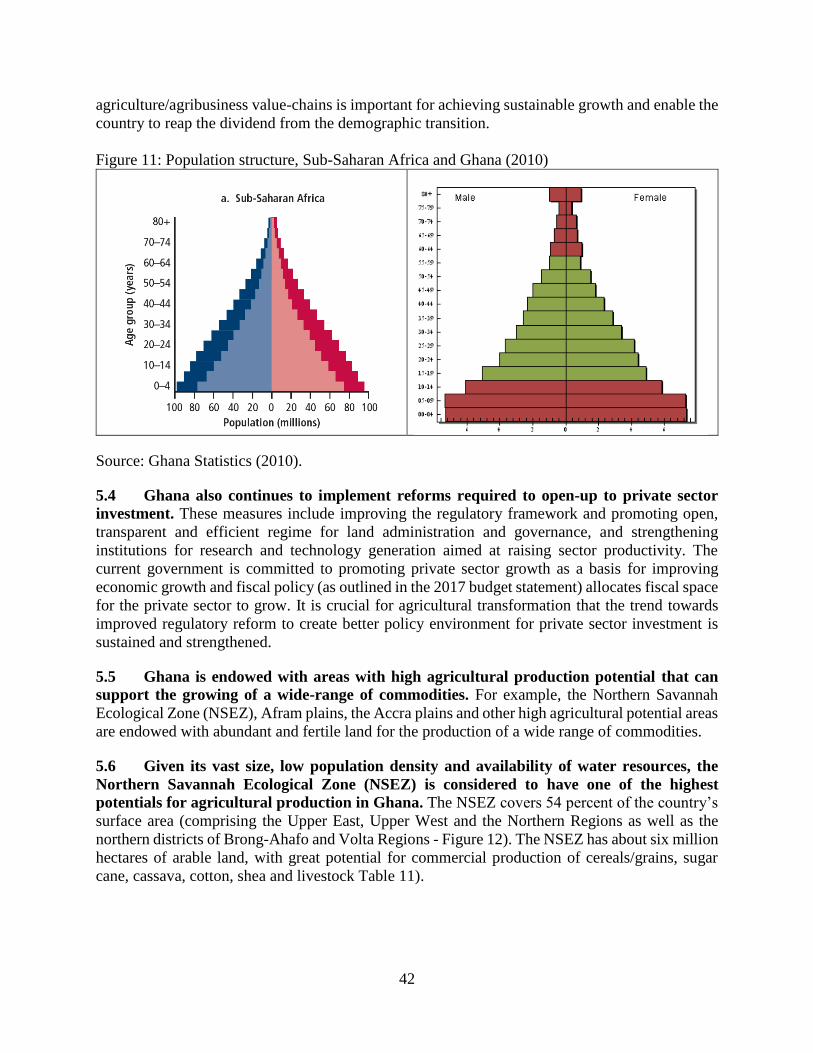
42
agriculture/agribusiness value-chains is important for achieving sustainable growth and enable the
country to reap the dividend from the demographic transition.
Figure 11: Population structure, Sub-Saharan Africa and Ghana (2010)
Source: Ghana Statistics (2010).
5.4 Ghana also continues to implement reforms required to open-up to private sector
investment. These measures include improving the regulatory framework and promoting open,
transparent and efficient regime for land administration and governance, and strengthening
institutions for research and technology generation aimed at raising sector productivity. The
current government is committed to promoting private sector growth as a basis for improving
economic growth and fiscal policy (as outlined in the 2017 budget statement) allocates fiscal space
for the private sector to grow. It is crucial for agricultural transformation that the trend towards
improved regulatory reform to create better policy environment for private sector investment is
sustained and strengthened.
5.5 Ghana is endowed with areas with high agricultural production potential that can
support the growing of a wide-range of commodities. For example, the Northern Savannah
Ecological Zone (NSEZ), Afram plains, the Accra plains and other high agricultural potential areas
are endowed with abundant and fertile land for the production of a wide range of commodities.
5.6 Given its vast size, low population density and availability of water resources, the
Northern Savannah Ecological Zone (NSEZ) is considered to have one of the highest
potentials for agricultural production in Ghana. The NSEZ covers 54 percent of the country’s
surface area (comprising the Upper East, Upper West and the Northern Regions as well as the
northern districts of Brong-Ahafo and Volta Regions - Figure 12). The NSEZ has about six million
hectares of arable land, with great potential for commercial production of cereals/grains, sugar
cane, cassava, cotton, shea and livestock Table 11).
43
5.7 According to the Masterplan for the “Inclusive Agriculture-led Economic
Transformation of the NSEZ”, the area is endowed with key features that are associated with
significant agricultural growth potential. These include:
Large tracts of land available for agricultural expansion: More than 6 million hectares of
arable land which is suitable for a wide range of crops, livestock, forestry and aquaculture
production
Significant irrigation potential: The NSEZ has 23 large and medium sized dam sites which
can be developed for multiple uses such as hydropower generation, irrigation development,
flood control, aquaculture; some of these dams are estimated to be able to command
209,000 to 547,000 hectares of irrigable land; there are also an estimated 104 small dam
sites across 95 catchment areas with potential to harness over 104,000 hectares under
irrigation.
5.8 The existing agricultural potential of the NSEZ is estimated to attract between US$
1.9 – 2.3 billion of private investment in agriculture, down-stream processing and irrigation
infrastructure development. This could also create over 400,000 permanent jobs along the targeted
value-chains.
5.9 However, despite its potential, the NSEZ remains the poorest region in the country.
According to the Ghana Living Standards Survey (GLSS), the northern regions collectively are
home to more than one-third of all poor households in the country. Social indicators such
education, health, access to safe water as well as maternal and child health are among the lowest
in the country. Furthermore, the generally poor state of infrastructure means that the vast
agricultural and other productive potentials that the region possesses remain largely unexploited,
resulting in low per capita incomes and a relatively low contribution to Ghana’s Gross Domestic
Product (GDP). While Ghana is a lower middle income country, the northern regions, with over
40 per cent of Ghana’s land area and 30 per cent of its population, remain the least developed.
Whilst Ghana as a whole has achieved the extreme poverty reduction goal (as per the Millennium
Development Goals), the northern regions have consistently lagged behind.
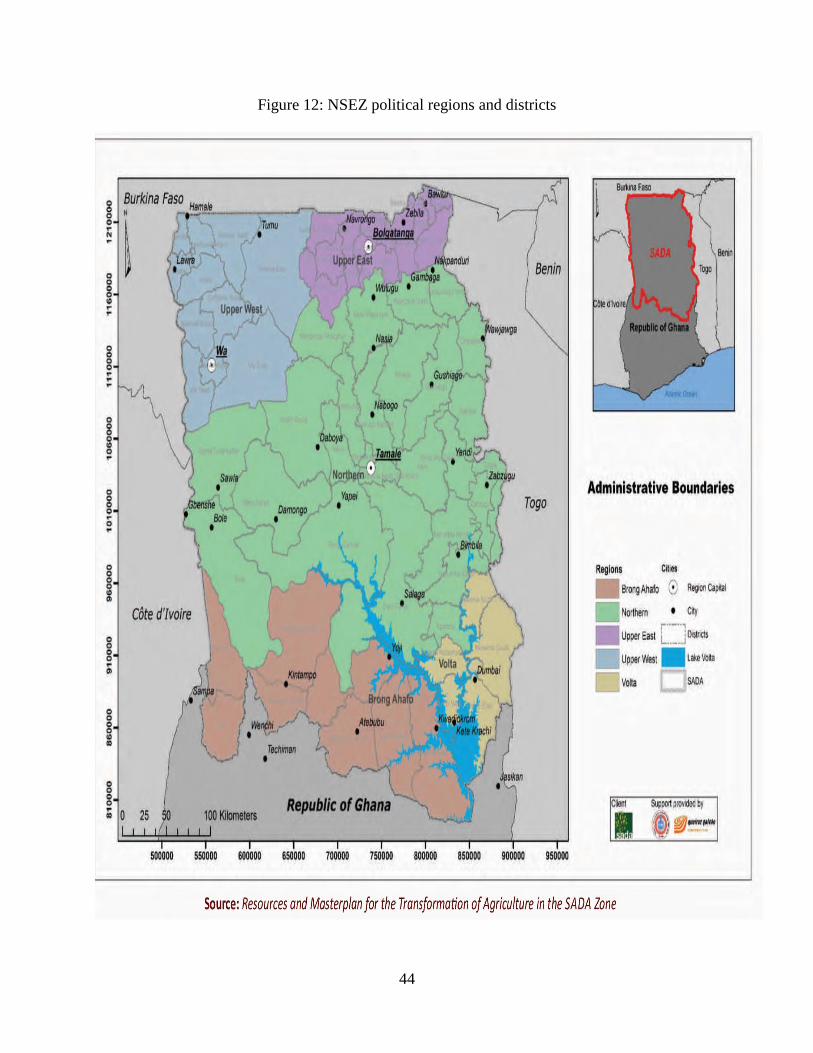
44
Figure 12: NSEZ political regions and districts
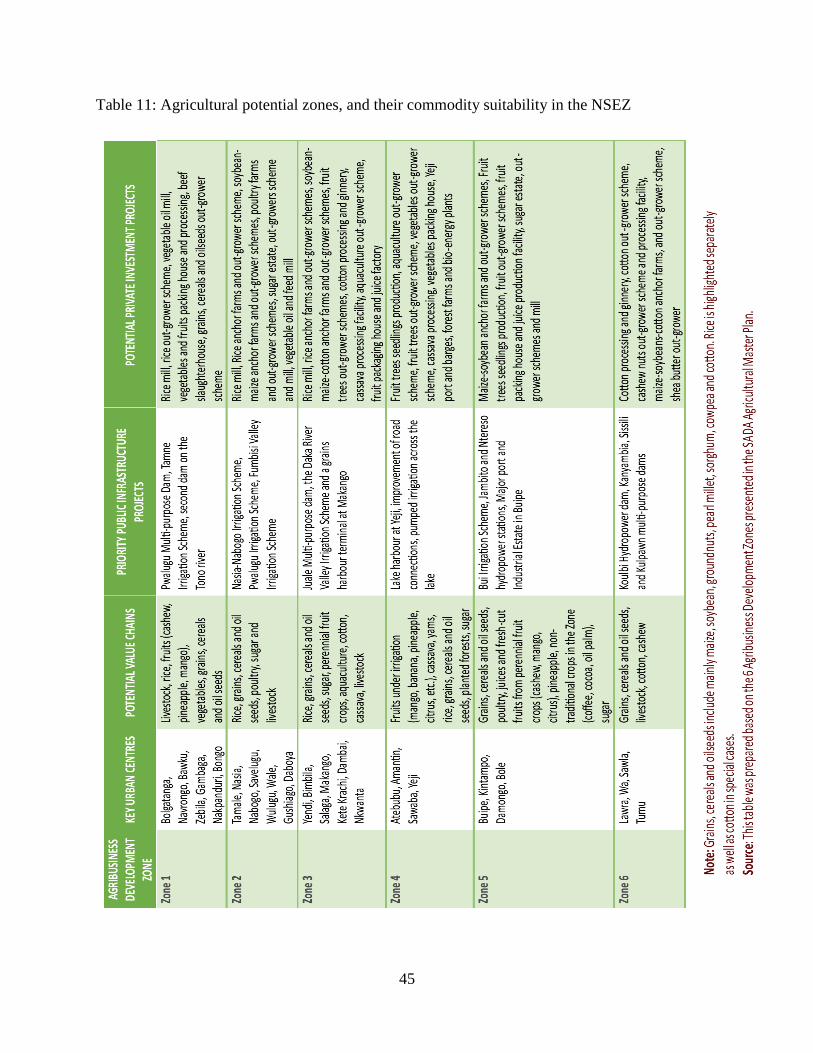
45
Table 11: Agricultural potential zones, and their commodity suitability in the NSEZ
46
5.10 Like other savannah zones in the world, while the potential is huge for the NSEZ to
transform itself into a major bread-basket for Ghana, there are also many risks that may
affect investment in the zone. One of the major risks to agricultural development, particularly for
fragile ecosystems such as those in the NSEZ is climate change. The effects of climate change tend
to be felt strongest in fragile agro-ecological zones, including the savannah zone with low rainfall
and high susceptibility to environmental degradation. The NSEZ also experiences low productivity
due to a multiplicity of factors including low intensity and poorly distributed rainfall, inadequate
infrastructure, limited access to markets, and the high cost of doing business which invariably
affects competitiveness.
5.11 However, experience from other countries which have zones with similar conditions
shows that these constraints can be overcome. A typical fairly recent example is the Guinea
savannah of which the NSEZ is part. Also the Cerrado of Brazil (see details in World Bank, 2009)52
was a lagging region which went through a period of agricultural-led transformation. The
transformation achieved in each of these international experiences came about due to: (i) large-
scale investment in productive and social infrastructure; (ii) strengthening of institutions; (iii)
adjusting the policies and incentives in a manner that promotes commercial agriculture and larger
farms while also supporting smaller farms to improve productivity and integrate better in markets.
The New Flagship Program: The Planting for Food and Jobs
5.12 Another opportunity to spur agricultural transformation could emanate from better
design and implementation of a sector strategy in line with the new flagship program, i.e. the
Planting for Food and Jobs. MoFA recently launched the Planting for Food and Jobs program
which aims to rapidly increase food production to achieve food self-sufficiency and create jobs.
The program focuses on five key staple crops: maize, rice, soybean, sorghum and vegetables. Its
implementation is anchored on five pillars: (i) provision of improved seeds; (ii) supply of
fertilizers; (iii) provision of extension services; (iv) marketing arrangements and reduction of post-
harvest losses; and (v) an electronic platform to capture and monitor program implementation. The
program aims at raising output and creating 750,000 jobs within the agricultural value-chain. It
targets 200,000 farmers in all 216 districts of Ghana. For more details, see Box 4.
Box 4: Key elements of the Planting for Food and Jobs Program
The planting for food and jobs is a national campaign unveiled by the new government for the rapid growth in the
production of key staple crops (mainly maize, rice, soybean, sorghum and vegetables). The campaign, which was
launched by the State President of Ghana on April 19, 2017, aims at promoting growth in food production and
creating jobs, particularly for the youth across the country. The campaign’s key pillars of support to over 200,000
farmers covering all the 216 districts include: improved seed, fertilizer, extension services, marketing and e-
agriculture.
The program’s target for 2017 are 1 million metric tons of additional food output and creation of over 750,000
jobs. The program cost is estimated at GHC560 million (about US$140 million) and the estimated incremental
production is valued at over GHC1.3 billion (about US$420 million). Although this is a public-sector driven
program, the delivery of the key inputs will be done through the private sector.
52 World Bank, 2009. Awakening African Sleeping Giant: Prospects for Commercial Agriculture in the Guinea
Savannah Zone and beyond. World Bank, Washington DC.
47
5.13 However, there is need to refine its design, align its implementation arrangements
with private sector delivery systems while the government creates the policy space, and
promote its capacity for quality monitoring. There has been a lot of expediency in the
development and launching of the program. As such, the linkages between the proposed program
and the sector policy (FASDEP) and investment framework (METASIP) remain rather unclear
which may disrupt medium to long-term sector development planning. The Planting for Food and
Jobs program should be embedded in the revised/updated sector policy and investment framework
for the next 4-5 years. This will help sustain the existing medium-term sector development
planning while also providing the framework for further sector support by most DPs whose
capacity to mobilize resources for the 2017 program is limited.
5.14 Furthermore, as a result of the expediency, the Results Framework, results indicators
and targets, as well as the M&E strategy require significant strengthening. It is not clear how
the results indicator targets were estimated, and how the monitoring for results will be undertaken
to ensure that the outcome targets are achieved. The targets for 2017 seem too ambitious and
without a proper system of monitoring for the results, it is unlikely that the program will achieve
its objectives. It is critical that the results indicators be clearly defined, the related targets be
realistic and their measurement be clearly highlighted. The electronic monitoring is a good idea if
there is already a well-tested e-monitoring platform which can easily be customized to the needs
of the program. However, first a proper baseline should be established against which to measure
the results. Furthermore, it is important to put in place a performance assessment strategy which
should cascade the targets from those responsible for overseeing implementation at the local,
regional and national level – and linked to a clear and transparent performance assessment system
with appropriate rewards and sanctions.
5.15 The risk assessment of the program should be further strengthened. Given the many
stakeholders involved in implementation of the program, a number of risks may surface including:
(i) risk of coordination failure; (ii) risk of elite capture; (iii) risk of free-riders/opportunists.
Normally programs that are driven by the public sector face many risks related to moral hazard.
These risks, if not properly mitigated may affect the achievement of the program targets. It is
important to ensure extensive consultation with key stakeholders in order to identify these risks
and put in place appropriate mitigation plans with well-established implementation and monitoring
arrangements.
5.16 The program’ targeting strategy, focusing on already existing farmers who are
expected to work closely with out-growers, needs to be better elaborated. While the
description of the program’s targeting strategy focusing on already established farmers seems well
thought-through, it may be challenging to implement in practice leading to significant exclusion
and inclusion errors. Given the very short-term planning, with the season about to start, there is
need to build enough capacity for those who will implement the targeting strategy on the ground.
Detailed criteria for identifying target farmers need to be established. Otherwise, with significant
targeting errors, achieving the outcome targets as well as recovery will be challenging. Given that
2017 season is meant to be a pilot, it is important to pay particular attention to these issues.
Furthermore, there are existing programs (e.g. Ghana Commercial Agriculture Project) which are
implemented using a similar approach and have generated valuable experiences from which
lessons can be drawn to inform the refinement of the program design in the subsequent years.
48
5.17 The program’s governance arrangements should be more aligned to existing
arrangements to avoid creating another layer of bureaucracy which may affect
implementation. The program’s proposed governance arrangements include a number of layers
of committees at the national, regional and local levels. There is a risk that these bureaucratic
layers might create delays in decision making and may therefore affect implementation if not well
coordinated. Furthermore, running of all these layers of committees may entail significant program
costs. The program secretariat should weigh the costs and benefits of such committees, and where
possible have one main Steering Committee which will have the key decision making
responsibility with oversight and coordination functions put elsewhere.
5.18 For sustainability, the program’s delivery mechanisms under the program should
crowd-in rather than crowd-out private sector supply systems. Given that the delivery of the
program inputs as well as off-take of program outputs will primarily be undertaken by the private
sector while the government’s role will be limited to facilitation, it is important to ensure that the
private sector is sensitized early enough in order to re-adjust their investment plans. The private
sector (in particular aggregators and other commodity off-takers) should not be brought in only at
a later stage. Furthermore, there is need to prioritize the planning for output marketing since it is
critical to ensure that production decisions are in tandem and/or influenced by the market.
5.19 Given the weaknesses of the current public extension system, there is need to enhance
extension delivery through the promotion of e-extension. Scaling-up the use of the e-extension
platform (established through WAAPP) will be critical to ensure that all farmers that will benefit
under the program should have adequate and timely extension advisory services.
5.20 To ensure that farmers have access to good quality seed and fertilizer, there is a need
to develop the capacity for monitoring and regulatory compliance. The seed system should
ensure that the necessary testing protocols are undertaken to ensure that quality seeds are delivered
by the private sector to farmers. Also, MoFA should ensure that spot checks are done to ensure
that the right quantities and quality of fertilizers are delivered to the farmers. Without quality seed
and fertilizer, yield and output targets will not be achieved. Furthermore, the program should
define the expected environmental and social issues that may result from its implementation to
develop adequate safeguard mechanisms to mitigate against any adverse outcomes.
5.21 There is need to strike a balance between food and nutrition security and employment
creation objectives. Given its focus on staple crops and vegetables, the program has the potential
to achieve both employment creation as well as enhance food security and nutrition. However,
there is also need in the subsequent years to shift the focus towards high value agriculture,
including commodities such as horticulture which is typically at least 3 times as labour-intensive
as cereals and has higher post-harvest value addition potential.

49
6. Key policy recommendations
This section summarizes the key recommendations in light of the key sector issues and challenges
discussed in the previous sections of this Policy Note.
6.1 While the government is engaged in an important process of fiscal consolidation, and
its resource envelope is limited, there is need to focus on improving the quality and efficiency
of public spending in order to achieve the government’s development policy goals. Research
has shown that a one percent increase in public spending on agriculture is associated with a 0.15
percent increase in Ghana’s agricultural labor productivity,53 yet agricultural spending in Ghana
as a share of the total budget is one of the lowest in Africa. Given agriculture’s pivotal importance
to employment, income growth, and poverty reduction, the government should reverse these trends
if it is to achieve its sectoral and national development objectives, and the Medium-Term
Expenditure Framework should include a strategy for sustainably increasing public spending into
the agricultural sector. In order to improve the quality and efficiency of public expenditure in
agriculture, there is need for better expenditure prioritization and targeting areas that can generate
important efficiency gains and returns. The budgetary dominance of recurrent over development
spending is a major source of inefficiency. Policymakers should re-evaluate the size of the current
MoFA workforce and strive to strike a better balance between operational and investment spending
in the agriculture sector. The most cost-effective investments are likely to be in core infrastructure,
especially roads and irrigation networks, as well as technology generation, dissemination,
education and skills development.54
6.3 Combined with increased funding for agricultural research, regulatory reform could
facilitate the adoption of new technologies.55 Eliminating unnecessary requirements,
burdensome procedures, and other administrative barriers to testing and registering new crop
varieties and improved agricultural inputs would foster private investment in agricultural research
and promote the commercialization of technological innovations. In addition, clarifying and
reinforcing intellectual property rights, strengthening quality assurance in seed markets, and
rigorously enforcing seed-labelling rules would further support private investment in agricultural
technology and the elaboration of the input value chain.
6.4 A combination of public and private investment in irrigation systems would increase
cropping intensity and bolster the agricultural sector’s resilience to weather-related shocks.
Climate change is increasing the unpredictability of rainfall in Ghana. Limited access to irrigation,
low rates of technological uptake, and the limited use of modern production methods exacerbate
output volatility and contribute to food insecurity. These trends will only intensify the vulnerability
of the agricultural sector unless measures are taken to mitigate these risks, including investment in
irrigation, the development and introduction of drought-tolerant and shorter-duration crop
varieties—especially staple grains such as maize and rice—and improved water management
techniques on rain-fed farmland. There is need for the country to deepen the implementation of
the National Climate Change Policy (NCCP) by adopting the already developed implementation
53 Benin et al., 2009. 54 World Bank, 2009; Seek, 2013. 55 Asare and Essegbey, 2016.
50
plan prepared by MoFA.56 It is also important to ensure that a set of principles for climate-smart
agriculture are adhered in the implementation of the plan. These include: (i) sustainable increase
in agricultural productivity and incomes; (ii) adapt and build resilience to climate change; (iii)
reduce and/or remove greenhouse gas (GHG) emissions, where possible; (iv) climate-risk
management such as crop insurance; and (v) re-orienting agricultural research and development
towards climate resilient technologies and management practices.57
6.5 The government’s overarching agricultural investment strategy should focus on
reducing unit production costs and narrowing yield gaps by increasing per-hectare
productivity. In order to leverage a limited investment envelope, the authorities should continue
to provide conditional support to private agricultural investors through methods such as the GCAP
matching grants already in use to spur linkages between agribusinesses and smallholder farmers.
Similarly, establishing Public-Private-Partnerships (PPPs) to provide extension services can help
to maximize the productivity impact of public spending. However, the government should avoid
efforts to directly organize agricultural production or to subsidize input procurement, especially in
cases where public involvement crowds-out private sector activity.
6.6 When public investment targets a specific value chain, it should complement—rather
than supplant—the ongoing development of the private sector. Agricultural investment should
be part of a coherent investment strategy with clearly defined and widely supported objectives. For
example, the Masara-N’Arziki maize outgrower scheme provides a positive example of how
public-private collaboration can be used to foster a holistic approach to input supply, storage, and
processing. However, similar initiatives in the rice subsector have been less successful, which may
be due to the fact that rice is primarily grown in government-managed irrigation systems. These
systems are slated for privatization, and this process could shift incentives in favor of demand-
driven investment and offer new opportunities for public-private collaboration.
6.7 Refocusing the regional distribution of agricultural spending on the Northern
Savannah Ecological Zone (NSEZ) and other areas with high agricultural potential could
accelerate gains in output growth, poverty reduction, and rural income generation. The
NSEZ, Afram plains, the Accra plains and other high agricultural potential areas are among the
country’s poorest regions, yet they have considerable untapped agricultural potential. Unlocking
this potential will require infrastructure investments, especially improvements to the road network,
which are beyond the scope of the MoFA or Ghana’s other agricultural agencies. The government
and its development partners should formulate a comprehensive strategy for promoting agricultural
development in these zones that leverages complementarities between investments in different
sectors.
56 Ghana has a National Climate-Smart Agriculture and Food Security Action Plan (NCSAFSAP) (2015) prepared by the Ministry of
Food and Agriculture to operationalize the NCCP in order to effectively integrate Climate Change into Food and Agriculture sector
development policies and programs. The Policy areas of NCCP that the National Climate-Smart Agriculture Action Plan focuses
include: (i) Agriculture and food security – emphasizing climate resilient agriculture and food systems; (ii) Disaster preparedness and
response – climate resilient infrastructure; (iii) Resources Management – carbon sinks and resilient ecosystems; (iv) Equitable social
Development; and (v) Appropriate Energy and infrastructure development – minimize greenhouse emission. 57 These set of principles are also in line with Ghana’s Intended Nationally Determined Contributions (INDC) towards climate-
change mitigation, developed in 2015 which commits the country to an emission reduction goal of lowering its GHG emissions
by 15 percent relative to a business-as-usual (BAU) scenario emission of 73.95MtCO2e2 by 2030.
51
6.8 Land-tenure reform will be crucial to bolster private investment in Ghana’s
agricultural sector, and major progress in strengthening land and property rights can be
achieved at a modest fiscal cost. Insecure property rights are a major obstacle to private
investment in agriculture, as the difficulty of enforcing land titles discourages both the purchase
of large commercial estates and private investment in physical improvements, such as irrigation
networks and storage facilities. Moreover, the inability of farmers to borrow against equity is a
major credit constraint.58 While strengthening property rights is not within the immediate purview
of the MoFA, the agricultural agencies can serve as important advocates for tenure reform within
the public sector. There is need to work with the Ministry of Lands and Natural Resources (MLNR)
to speed-up the finalization and approval of the National Land Bill aimed at improving land tenure
governance
6.9 There is an urgent need to modernize the cocoa value chain in order to boost
productivity and hedge against exogenous economic and climate-related shocks. Phasing-out
inefficient public input-supply programs could reduce fiscal costs and create space for greater
private sector participation in the cocoa value chain. Moreover, mapping cocoa farms and
collecting more extensive farm-level productivity data could enhance the targeting of public sector
support and help private investors identify emerging opportunities. Enhanced environmental
policies and production standards would boost productivity and support the sustainability of the
cocoa industry.
6.10 The COCOBOD’s impact on the cocoa subsector is mixed, and reforms to its
institutional arrangements and policy framework could greatly increase cocoa output with a
minimal budgetary impact. The Board’s accounting and management information systems
should be upgraded to identify inefficiencies in its operations and resolve weaknesses in the
targeting of its interventions. To support long-term planning and investment at the farm level, the
COCOBOD should reorient its forward-sales mechanism to guarantee minimum producer prices.
The COCOBOD should also leverage PPPs to expand the provision of semi-public goods, such as
extension services, technology transfer, and disease and pest control.
6.11 Greater transparency in the management of the cocoa subsector, combined with
further market liberalization, will be crucial to enhance the efficiency of cocoa production
and ensure the long-term competitiveness of cocoa exports. The COCOBOD should be required
to publish detailed information on how its price margin is calculated. Over time, the board should
scale back its involvement in both the input and output sides of the supply chain. On the output
side, the COCOBOD should focus on regulating a competitive purchasing process and ensuring
that no single buyer exerts excessive market power. On the input side, it should cease to provide
inputs directly and instead concentrate on establishing a stable and hospitable environment for
private input providers. The board should periodically estimate marketing costs for cocoa,
including domestic transportation, quality control and other costs, and recommend measures to
lower them. Finally, the COCOBOD should coordinate the numerous programs and projects being
implemented under Ghana’s recently finalized Second Cocoa Sector Development Strategy.
6.12. Modernization of the cocoa value chain, reform of COCOBOD’s institutional
arrangements including greater transparency, and improvements in the policy framework
58 Institute of Statistical, Social and Economic Research, 2015.
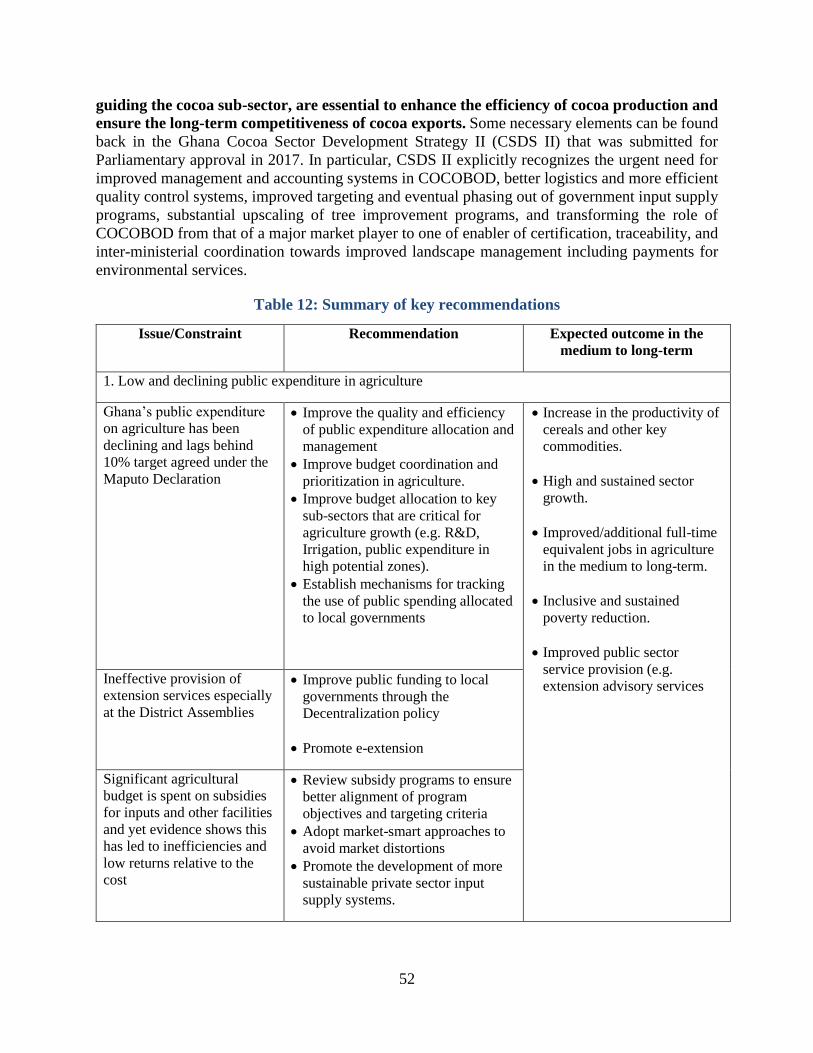
52
guiding the cocoa sub-sector, are essential to enhance the efficiency of cocoa production and
ensure the long-term competitiveness of cocoa exports. Some necessary elements can be found
back in the Ghana Cocoa Sector Development Strategy II (CSDS II) that was submitted for
Parliamentary approval in 2017. In particular, CSDS II explicitly recognizes the urgent need for
improved management and accounting systems in COCOBOD, better logistics and more efficient
quality control systems, improved targeting and eventual phasing out of government input supply
programs, substantial upscaling of tree improvement programs, and transforming the role of
COCOBOD from that of a major market player to one of enabler of certification, traceability, and
inter-ministerial coordination towards improved landscape management including payments for
environmental services.
Table 12: Summary of key recommendations
Issue/Constraint Recommendation Expected outcome in the
medium to long-term
1. Low and declining public expenditure in agriculture
Ghana’s public expenditure
on agriculture has been
declining and lags behind
10% target agreed under the
Maputo Declaration
Improve the quality and efficiency
of public expenditure allocation and
management
Improve budget coordination and
prioritization in agriculture.
Improve budget allocation to key
sub-sectors that are critical for
agriculture growth (e.g. R&D,
Irrigation, public expenditure in
high potential zones).
Establish mechanisms for tracking
the use of public spending allocated
to local governments
Increase in the productivity of
cereals and other key
commodities.
High and sustained sector
growth.
Improved/additional full-time
equivalent jobs in agriculture
in the medium to long-term.
Inclusive and sustained
poverty reduction.
Improved public sector
service provision (e.g.
extension advisory services Ineffective provision of
extension services especially
at the District Assemblies
Improve public funding to local
governments through the
Decentralization policy
Promote e-extension
Significant agricultural
budget is spent on subsidies
for inputs and other facilities
and yet evidence shows this
has led to inefficiencies and
low returns relative to the
cost
Review subsidy programs to ensure
better alignment of program
objectives and targeting criteria
Adopt market-smart approaches to
avoid market distortions
Promote the development of more
sustainable private sector input
supply systems.
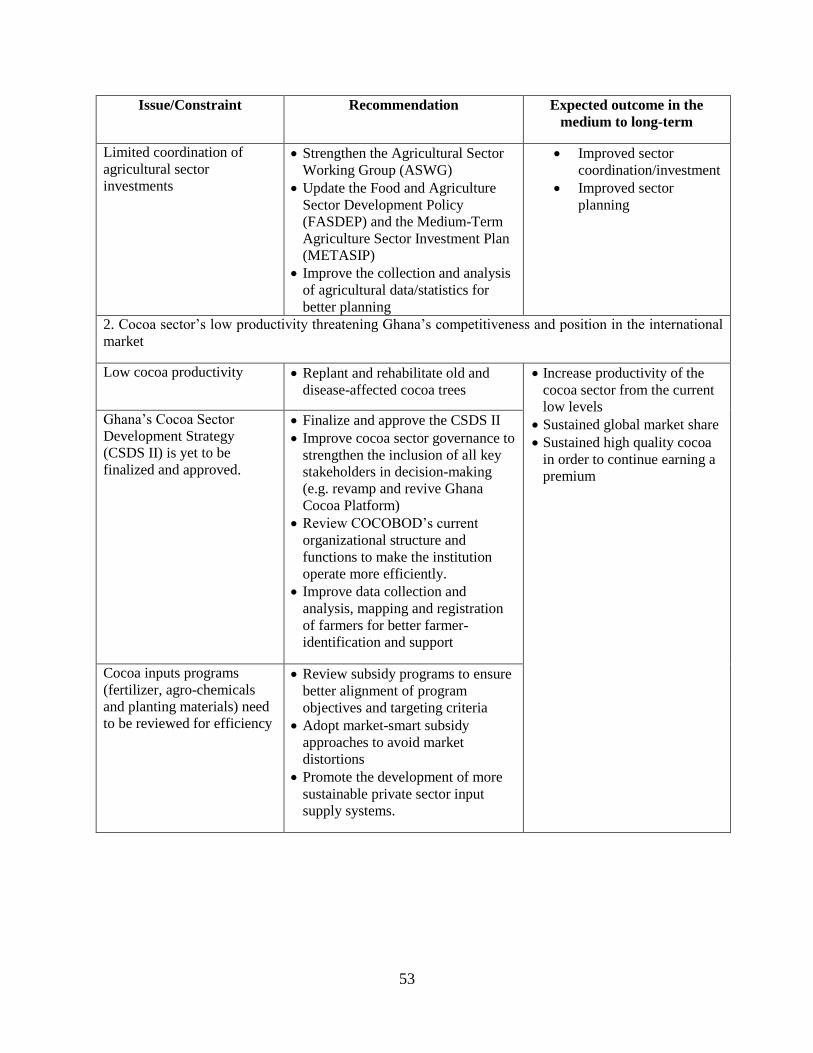
53
Issue/Constraint Recommendation Expected outcome in the
medium to long-term
Limited coordination of
agricultural sector
investments
Strengthen the Agricultural Sector
Working Group (ASWG)
Update the Food and Agriculture
Sector Development Policy
(FASDEP) and the Medium-Term
Agriculture Sector Investment Plan
(METASIP)
Improve the collection and analysis
of agricultural data/statistics for
better planning
Improved sector
coordination/investment
Improved sector
planning
2. Cocoa sector’s low productivity threatening Ghana’s competitiveness and position in the international
market
Low cocoa productivity Replant and rehabilitate old and
disease-affected cocoa trees
Increase productivity of the
cocoa sector from the current
low levels
Sustained global market share
Sustained high quality cocoa
in order to continue earning a
premium
Ghana’s Cocoa Sector
Development Strategy
(CSDS II) is yet to be
finalized and approved.
Finalize and approve the CSDS II
Improve cocoa sector governance to
strengthen the inclusion of all key
stakeholders in decision-making
(e.g. revamp and revive Ghana
Cocoa Platform)
Review COCOBOD’s current
organizational structure and
functions to make the institution
operate more efficiently.
Improve data collection and
analysis, mapping and registration
of farmers for better farmer-
identification and support
Cocoa inputs programs
(fertilizer, agro-chemicals
and planting materials) need
to be reviewed for efficiency
Review subsidy programs to ensure
better alignment of program
objectives and targeting criteria
Adopt market-smart subsidy
approaches to avoid market
distortions
Promote the development of more
sustainable private sector input
supply systems.
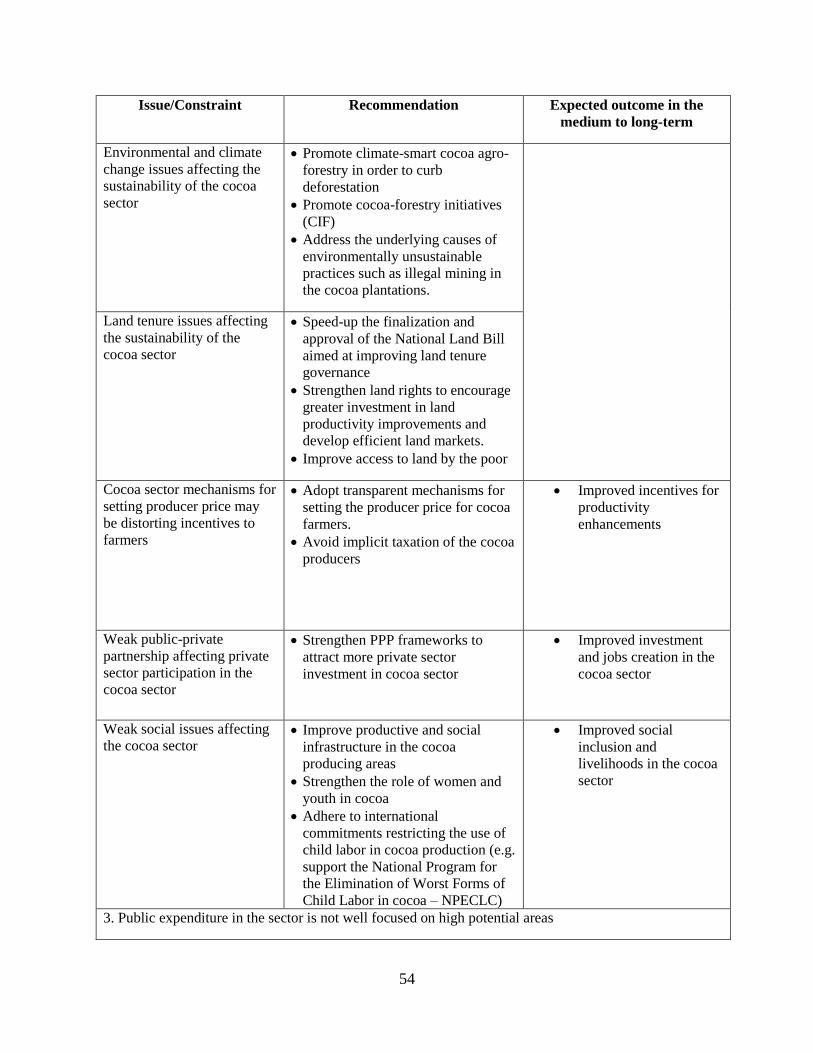
54
Issue/Constraint Recommendation Expected outcome in the
medium to long-term
Environmental and climate
change issues affecting the
sustainability of the cocoa
sector
Promote climate-smart cocoa agro-
forestry in order to curb
deforestation
Promote cocoa-forestry initiatives
(CIF)
Address the underlying causes of
environmentally unsustainable
practices such as illegal mining in
the cocoa plantations.
Land tenure issues affecting
the sustainability of the
cocoa sector
Speed-up the finalization and
approval of the National Land Bill
aimed at improving land tenure
governance
Strengthen land rights to encourage
greater investment in land
productivity improvements and
develop efficient land markets.
Improve access to land by the poor
Cocoa sector mechanisms for
setting producer price may
be distorting incentives to
farmers
Adopt transparent mechanisms for
setting the producer price for cocoa
farmers.
Avoid implicit taxation of the cocoa
producers
Improved incentives for
productivity
enhancements
Weak public-private
partnership affecting private
sector participation in the
cocoa sector
Strengthen PPP frameworks to
attract more private sector
investment in cocoa sector
Improved investment
and jobs creation in the
cocoa sector
Weak social issues affecting
the cocoa sector Improve productive and social
infrastructure in the cocoa
producing areas
Strengthen the role of women and
youth in cocoa
Adhere to international
commitments restricting the use of
child labor in cocoa production (e.g.
support the National Program for
the Elimination of Worst Forms of
Child Labor in cocoa – NPECLC)
Improved social
inclusion and
livelihoods in the cocoa
sector
3. Public expenditure in the sector is not well focused on high potential areas
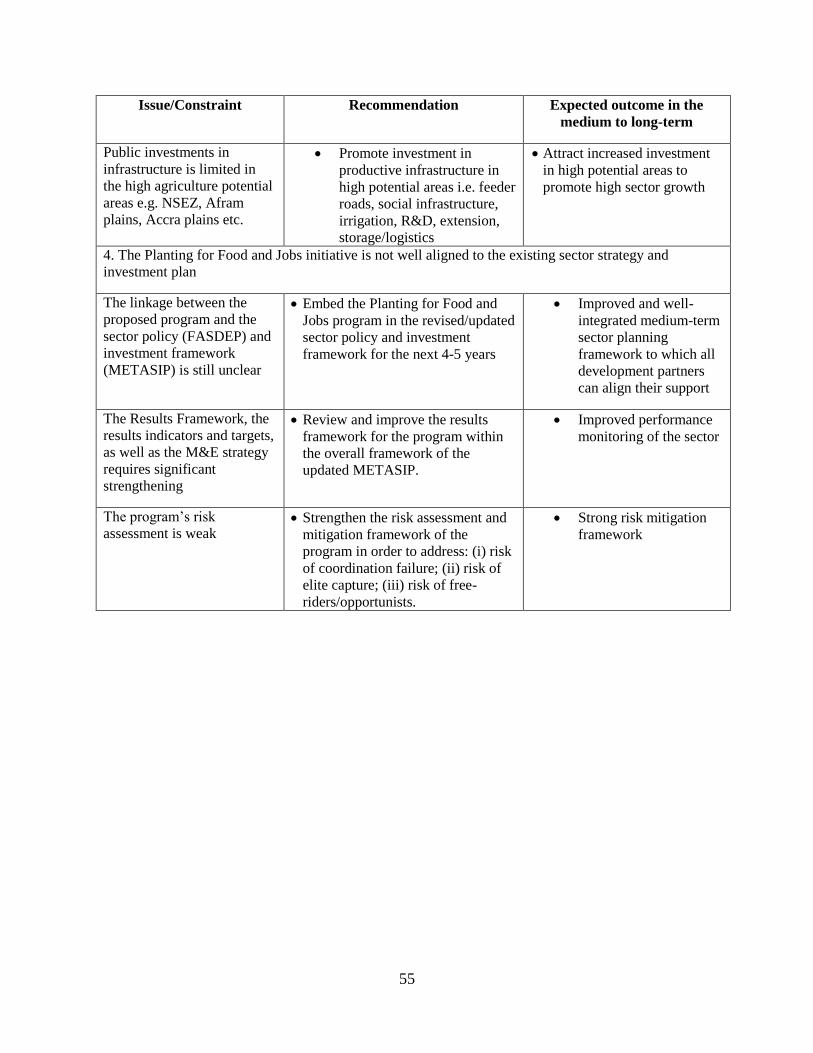
55
Issue/Constraint Recommendation Expected outcome in the
medium to long-term
Public investments in
infrastructure is limited in
the high agriculture potential
areas e.g. NSEZ, Afram
plains, Accra plains etc.
Promote investment in
productive infrastructure in
high potential areas i.e. feeder
roads, social infrastructure,
irrigation, R&D, extension,
storage/logistics
Attract increased investment
in high potential areas to
promote high sector growth
4. The Planting for Food and Jobs initiative is not well aligned to the existing sector strategy and
investment plan
The linkage between the
proposed program and the
sector policy (FASDEP) and
investment framework
(METASIP) is still unclear
Embed the Planting for Food and
Jobs program in the revised/updated
sector policy and investment
framework for the next 4-5 years
Improved and well-
integrated medium-term
sector planning
framework to which all
development partners
can align their support
The Results Framework, the
results indicators and targets,
as well as the M&E strategy
requires significant
strengthening
Review and improve the results
framework for the program within
the overall framework of the
updated METASIP.
Improved performance
monitoring of the sector
The program’s risk
assessment is weak Strengthen the risk assessment and
mitigation framework of the
program in order to address: (i) risk
of coordination failure; (ii) risk of
elite capture; (iii) risk of free-
riders/opportunists.
Strong risk mitigation
framework
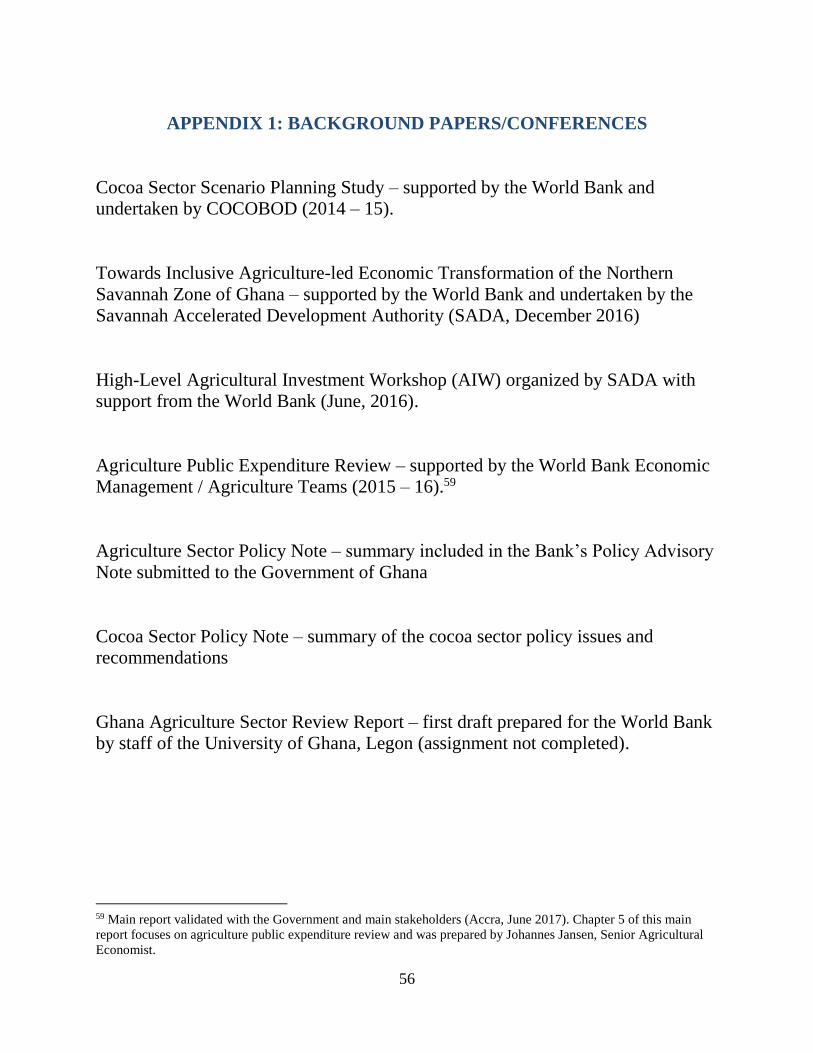
56
APPENDIX 1: BACKGROUND PAPERS/CONFERENCES
Cocoa Sector Scenario Planning Study – supported by the World Bank and
undertaken by COCOBOD (2014 – 15).
Towards Inclusive Agriculture-led Economic Transformation of the Northern
Savannah Zone of Ghana – supported by the World Bank and undertaken by the
Savannah Accelerated Development Authority (SADA, December 2016)
High-Level Agricultural Investment Workshop (AIW) organized by SADA with
support from the World Bank (June, 2016).
Agriculture Public Expenditure Review – supported by the World Bank Economic
Management / Agriculture Teams (2015 – 16).59
Agriculture Sector Policy Note – summary included in the Bank’s Policy Advisory
Note submitted to the Government of Ghana
Cocoa Sector Policy Note – summary of the cocoa sector policy issues and
recommendations
Ghana Agriculture Sector Review Report – first draft prepared for the World Bank
by staff of the University of Ghana, Legon (assignment not completed).
59 Main report validated with the Government and main stakeholders (Accra, June 2017). Chapter 5 of this main
report focuses on agriculture public expenditure review and was prepared by Johannes Jansen, Senior Agricultural
Economist.
57
References
Akroyd and Smith, 2007. Review of public spending in agriculture. Study by Oxford Policy
Management for World Bank and Department for International Development.
Apergisa et al. (2011). “Dutch Disease Effect of Oil Rents on Agriculture Value Added in
Middle East and North African Countries.”
Asare, R., and Essegbey, G.O., 2016. Funding of Agricultural Research and Development in
Ghana: The case of the Council for Scientific and Institutional Research (CSIR). Science and
Technology Policy Institute, Accra, Ghana: Technology and Investment 2016, 7. Pp40-50.
Benin, S. 2016. Returns to agricultural public spending in Ghana – cocoa versus non-cocoa
subsector” Discussion Paper # 01503, International Food Policy Research Institute, Washington
D.C., USA.
Benin, S. 2014. Identifying agricultural expenditures within the public financial accounts and
coding system in Ghana: Is the 10 percent government agriculture expenditure overestimated?
IFPRI Discussion Paper # 1365. Washington DC.
Benin et al. (2009). “Public Expenditures and Agricultural Productivity Growth in Ghana.”
International Food Policy Research Institute.
Benin (2014). “Identifying Agricultural Expenditures within the Public Financial Accounts and
Coding System in Ghana.” IFPRI Discussion Paper 1365. Washington DC.
Beintema et al. (2014). “Agricultural R&D indicators factsheet – Ghana” Agricultural science
and technology indicators. IFPRI.
Choudhary, Vikas; D'Alessandro, Stephen. 2015. Ghana Agricultural Sector Risk Assessment:
Risk Prioritization. World Bank, Washington, DC. Report No. 94228.
https://openknowledge.worldbank.org/handle/10986/22498 License: CC BY 3.0 IGO.
Christiansen et al. (2013). “Africa’s Growth, Poverty and Inequality Nexus: Fostering Shared
Prosperity.” Washington, DC: The World Bank
Christiansen and Kaminski (2015). “Structural Change, Economic Growth and Poverty
Reduction, Micro Evidence from Uganda.” Washington, DC: The World Bank.
Institute of Statistical, Social and Economic Research (2015). “Public Policy and Enterprise
Development in Ghana” Policy Brief No. 2, University of Ghana, August.
Jansen, Johannes (2017). Revitalizing Agriculture Growth through Enhanced Expenditure
Targeting. Chapter 5 in: Fiscal Consolidation to Accelerate Growth and Support Inclusive
Development. World Bank, Washington DC (forthcoming).
58
Kolavalli et al. (2015). “After the Ten Percent: Moving Agriculture in Ghana” Policy Note #7,
Ghana Strategy Support Program
Ghana Cocoa Board. 2015. The future of Ghana’s cocoa sector. “Building in robustness and
resilience to What IF? Scenario Planning Report. Accra, Ghana.
Gockowski, James; and Sonwa, Denis, 2007. Cocoa Intensification Scenarios and Their
Predicted Impact on CO2 Emissions, Biodiversity Conservation and Rural Livelihoods in the
Rainforest of West Africa. Environmental Management, November 2010.
Houssou, Nazaire; Kolavalli, Shashidhara; Silver, Jed. 2016. Agricultural intensification,
technology adoption, and institutions in Ghana. Washington DC: IFPRI. 2016
Kolavalli S et al (2015), “After the ten percent: moving agriculture in Ghana”, Policy Note #7,
Ghana Strategy Support Program and
MoFA, 2015. Agriculture in Ghana – Facts and Figures (2014)” Statistics, Research and
Information Directorate (SRID).
Nienke Beintema, Gert-Jan Stads, Keith Fuglie, and Paul Heisey, 2012. Global assessment of
agricultural R&D spending. Agricultural Science and Technology Indicators (ASTI) and
International Food Policy Research Institute (IFPRI).
Naik (2006). “Closing the yield gap: maize in India.” In “Technology, adaptation and exports:
how some countries got it right” Vandana Chandra (ed.) World Bank.
Rasiah (2006). “Explaining Malaysia’s export expansion in palm oil and related products” In
“Technology, adaptation and exports: how some countries got it right” Vandana Chandra (ed.)
World Bank.
Seek (2013). “Repackaging Agricultural Research for Greater Impact on Agricultural Growth in
Africa” Journal of Food Security, 1, 30-41.
SSRID (2014). “Agriculture in Ghana – Facts and Figures.” Accra: Government of Ghana
Vostroknutova et al. (2010). “Dealing with Dutch Disease”
Whitaker and Kolavalli (2006). “Floriculture in Kenya”. In “Technology, adaptation and exports:
how some countries got it right” Vandana Chandra (ed.) World Bank.
Obiri, D.B., Geoff, A.B., Morag, A.M., Anglaare, L.C.N. and Cobbina, J. 2007. Financial
Analysis of Shaded Cocoa in Ghana. Agroforestry Systems 71:139-149.
OECD/FAO, 2016. Agriculture in Sub-Saharan Africa: Prospects and challenges, for the next
decade. Rome, Italy.
59
Trip, Robert and Akwasi Mensah-Bonsu, 2013. Ghana’s commercial seed sector: New incentives
or continued complacency. Ghana Strategy Support Program. International Food Policy Research
Institute Working Paper 32.
Quiñones, Esteban J.; Muñoz, Juan and Ngeleza, Guyslain. 2011. A Strategy for Agricultural
Statistics in Ghana. Ghana Strategy Support Program. International Food Policy Research
Institute, Washington D.C., USA. Working Paper # 32.
World Cocoa Foundation (WCF), 2016. Cocoa Swollen Shoot Virus Disease: A holistic
approach to control the disease in West Africa.
World Bank. 2015. World Development Indicators (WDI), global merchandise imports.
World Bank, 2013. Basic agricultural public expenditure diagnostic review. Final Report –
Ghana’s Ministry of Food and Agriculture.
World Development Indicators (WDI). 2016. World Bank, Washington DC, United States of
America.
World Bank. 2015. World Development Indicators (WDI), global merchandise imports.
World Bank (2009). “Economy-Wide Impact of Oil Discovery in Ghana.” Africa Region World
Bank Report No. 47321.
World Bank (2013). “Final Report: Basic Agricultural Public Expenditure Diagnostic Review –
Ghana’s Ministry of Food and Agriculture.” Washington, DC: The World Bank
World Bank (2016a) “Expanding Job Opportunities in Ghana.” Washington DC: The World
Bank
World Bank (2016b) “Ghana Economic Update” June. Washington DC: The World Bank
World Bank (2016c) Africa’s Pulse. Washington DC: The World Bank
Younger (2015). “Is there fiscal space for CAADP in Ghana?”, Policy Note #8, IFPRI.
Zhou and Baby (2015). “Knowledge driven development – private extension and global lessons.”
Elsevier Academic Press.

60
Agriculture Global Practice, Africa Region