
G.H. Raisoni College of Engineering, Nagpur. Department of...
23
G.H. Raisoni College of Engineering, Nagpur. Department of Information Technology Seventh Semester Digital Signal Processing
Transcript of G.H. Raisoni College of Engineering, Nagpur. Department of...

G.H. Raisoni College of Engineering, Nagpur.
Department of Information Technology
Seventh Semester Digital Signal Processing

G.H. Raisoni College of Engineering, Nagpur.
Department of Information Technology
Seventh Semester Digital Signal Processing
Experiment No: 1
Aim: Generation of various signals( sin , cosine & Expo. )
Theory:
Sine Wave: Sine-waves are the purest type of waveform, composed of a single frequency. This first
section introduces some notation and very basic relationships and identities.
y(t) = sin(wt)
Maths equation for a basic sine-wave with angular frequency w (angular frequency measured
in radians/second).
y(t) = sin(2πft)
Maths equation for a basic sine-wave with frequency f (frequency measured Hertz, i.e.
cycles/second).
yi = sin(2π·i·f / fs)
DSP equation for discrete sampling-points, i, of a sine-wave with frequency f (in Hertz), in a
buffer sampled at a frequency fs samples/second.
In physics and electronics we tend to use the phrase 'sine wave' to describe the waveform of a
single, pure, frequency without being unduly concerned with its phase. Phase is important in
maths and DSP, so we will use 'sin' and 'cos' carefully.
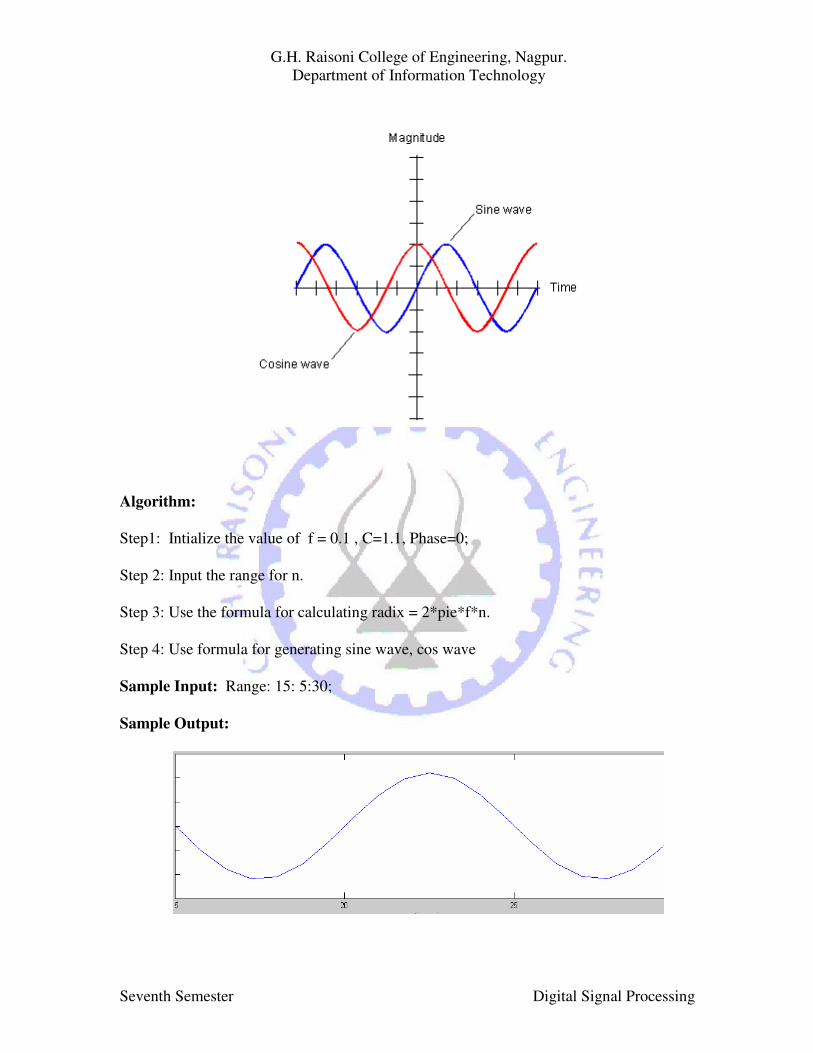
Cosine Wave :
A cosine wave is a signal waveform with a shape identical to that of a sine wave, except each
point on the cosine wave occurs exactly 1/4 cycle earlier than the corresponding point on the
sine wave. A cosine wave and its corresponding sine wave have the same frequency, but the
cosine wave leads the sine wave by 90 degrees of phase.
G.H. Raisoni College of Engineering, Nagpur.
Department of Information Technology
Seventh Semester Digital Signal Processing
Algorithm:
Step1: Intialize the value of f = 0.1 , C=1.1, Phase=0;
Step 2: Input the range for n.
Step 3: Use the formula for calculating radix = 2*pie*f*n.
Step 4: Use formula for generating sine wave, cos wave
Sample Input: Range: 15: 5:30;
Sample Output:

G.H. Raisoni College of Engineering, Nagpur.
Department of Information Technology
Seventh Semester Digital Signal Processing
Viva voice:
1. What is mathematical equation for generating sine Wave.
2. What is the Mat lab function for generating sine wave.
3. What is the Mat lab function for generating Cosine wave.
G.H. Raisoni College of Engineering, Nagpur.
Department of Information Technology
Seventh Semester Digital Signal Processing
Experiment No: 2
Aim: Generation of discrete time Signals.
Theory:
Under the standard test signals we have following signals:
1. Unit sample Signal
2. Unit step Signal
3. Unit ramp Signal
4. Exponential Signal
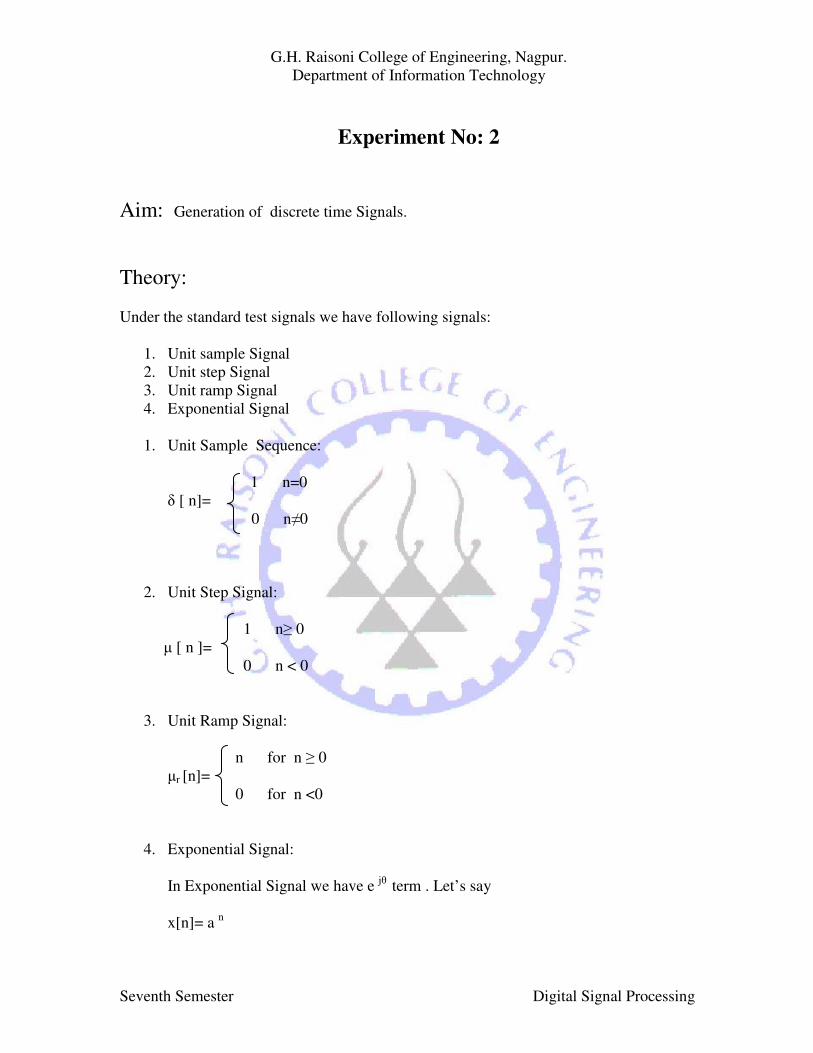
1. Unit Sample Sequence:
1 n=0
δ [ n]=
0 n≠0
2. Unit Step Signal:
1 n≥ 0
µ [ n ]=
0 n < 0
3. Unit Ramp Signal:
n for n ≥ 0
µr [n]=
0 for n <0
4. Exponential Signal:
In Exponential Signal we have e jθ
term . Let’s say
x[n]= a n

G.H. Raisoni College of Engineering, Nagpur.
Department of Information Technology
Seventh Semester Digital Signal Processing
Algorithm:
Step1: Intialize the value of t as per the requirement for signals.
Step 2: Input the range for n.
Step 3: Use the formula for ploting different signal.
Sample Output:
Viva Voice:
1. What are the different discrete time signals.
2. What is the functional representation for unit sample sequence.
3. What is the functional representation for Unit Step Signal
4. What is the functional representation for Unit Ramp Signal.
5. What is the functional representation for Exponential Signal.
6. What do you mean by impulse response

G.H. Raisoni College of Engineering, Nagpur.
Department of Information Technology
Seventh Semester Digital Signal Processing
Experiment No: 3
Aim: To write a program to study the time domain sampling process.
Theory:
From a signal processing perspective, the theorem describes two processes; a sampling
process, in which a continuous time signal is converted to a discrete time signal, and a
reconstruction process, in which the continuous signal is recovered from the discrete signal.
The continuous signal varies over time (or space as in a digitized image or another
independent variable in some other application) and the sampling process is done by simply
measuring the continuous signal's value every T units of time (or space), which is called the
sampling interval. In practice, for signals that are a function of time, the sampling interval is
typically quite small, on the order of milliseconds or microseconds or less. This results in a
sequence of numbers, called samples, which is to represent the original signal. Each sample
is associated to the specific point in time where it was measured. The reciprocal of the
sampling interval, 1/T is the sampling frequency, fs, and measured in samples per unit time. If
T is expressed in seconds then fs is expressed in Hz.
The reconstruction process is an interpolation process that mathematically defines a
continuous-time signal, x(t), from the discrete samples x[n] and at times in between the
sample instants, nT.
G.H. Raisoni College of Engineering, Nagpur.
Department of Information Technology
Seventh Semester Digital Signal Processing
Algorithm:
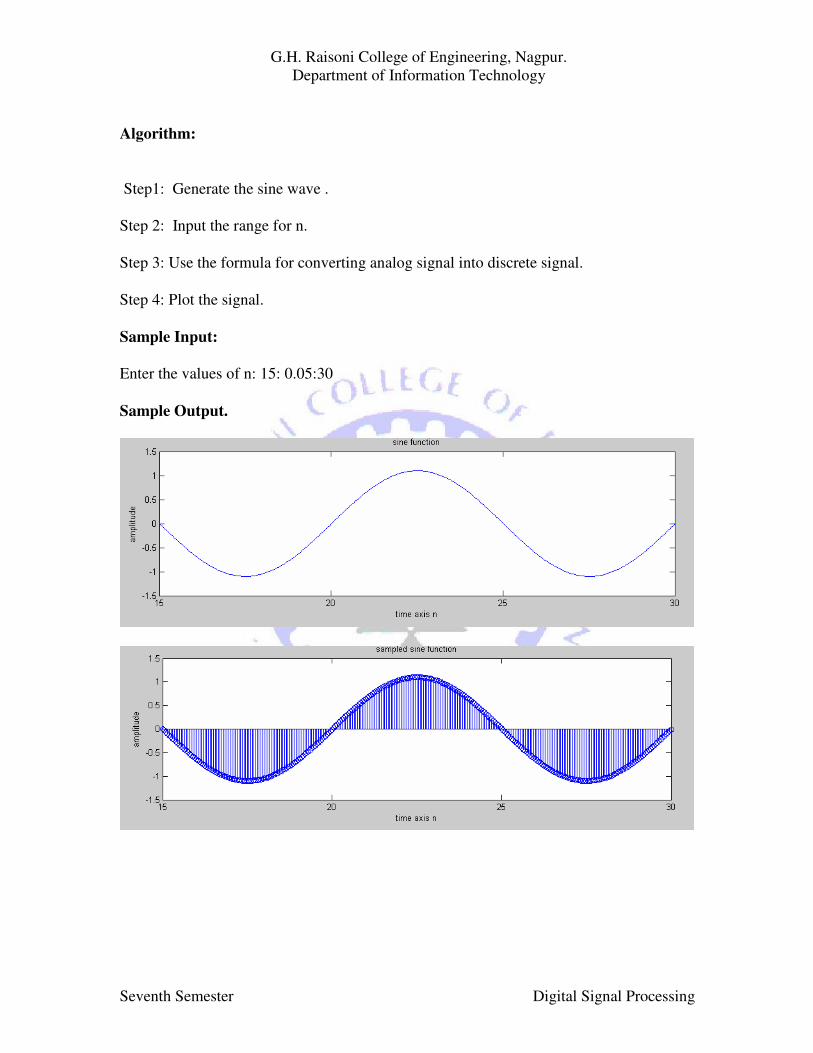
Step1: Generate the sine wave .
Step 2: Input the range for n.
Step 3: Use the formula for converting analog signal into discrete signal.
Step 4: Plot the signal.
Sample Input:
Enter the values of n: 15: 0.05:30
Sample Output.

G.H. Raisoni College of Engineering, Nagpur.
Department of Information Technology
Seventh Semester Digital Signal Processing
Viva Voice:
1. What is Sampling theorm.
2. What is time domain sampling process.
3. What is quantization.
4. What will be the sampling rate for avoiding the aliasing.

G.H. Raisoni College of Engineering, Nagpur.
Department of Information Technology
Seventh Semester Digital Signal Processing
Experiment No: 4
Aim: To write a program to get linear Convolution sum of two input signal.
Theory:
G.H. Raisoni College of Engineering, Nagpur.
Department of Information Technology
Seventh Semester Digital Signal Processing
Algorithm:
Step1: Decompose given input signal into sum of elementary signal .
Step 2: After decomposing input signal ,apply time shifted impulses to a system. Find out
corresponding output for given impulses .
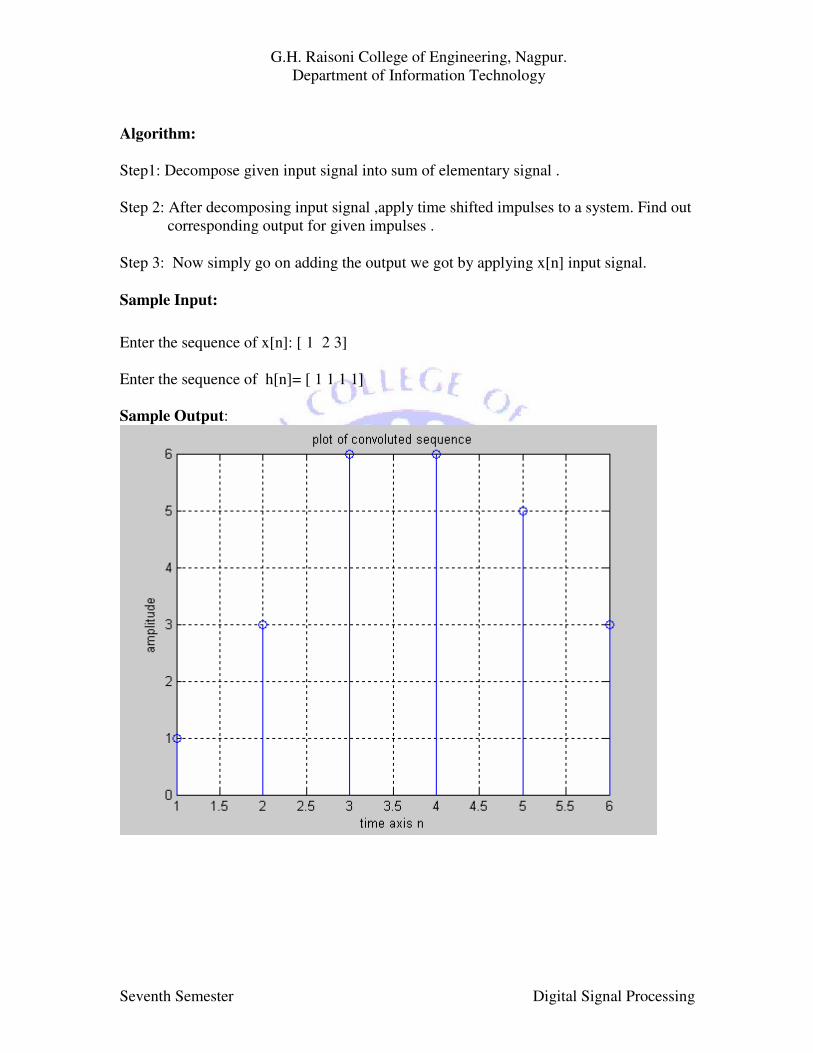
Step 3: Now simply go on adding the output we got by applying x[n] input signal.
Sample Input:
Enter the sequence of x[n]: [ 1 2 3]
Enter the sequence of h[n]= [ 1 1 1 1]
Sample Output:
G.H. Raisoni College of Engineering, Nagpur.
Department of Information Technology
Seventh Semester Digital Signal Processing
Viva Voice:
1. What is Convolution sum?
2. What is the real time application of convolution sum.
3. Why we apply convolution theorem on signal?
4. What is the formual for calculating convolution sum.

G.H. Raisoni College of Engineering, Nagpur.
Department of Information Technology
Seventh Semester Digital Signal Processing
Experiment No: 5
Aim: To write a program on Circulation Convolution between x1[n] and x2[n] .
Theory:

G.H. Raisoni College of Engineering, Nagpur.
Department of Information Technology
Seventh Semester Digital Signal Processing
Algorithm
• Step 1: Calculate the DFT of f[n] which yields F[k] and calculate the DFT of
h[n] which yields H[k] .
• Step 2: Point wise multiply Y[k] =F[k] H[k]
G.H. Raisoni College of Engineering, Nagpur.
Department of Information Technology
Seventh Semester Digital Signal Processing
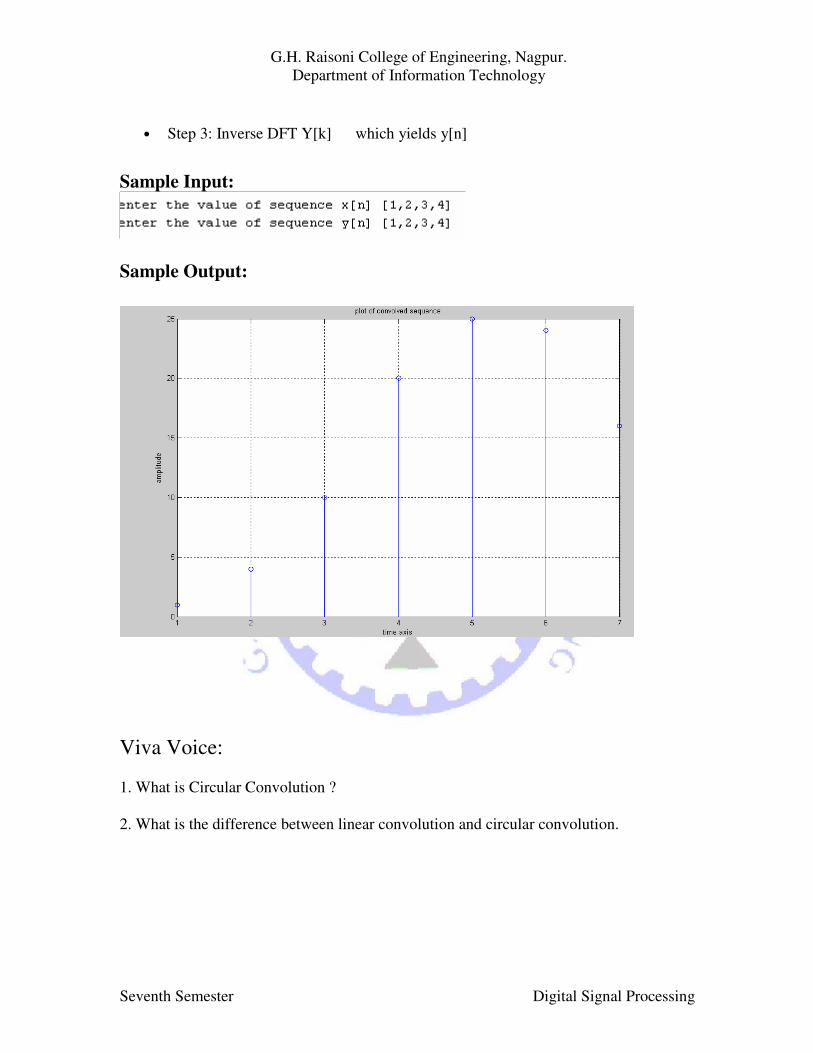
• Step 3: Inverse DFT Y[k] which yields y[n]
Sample Input:
Sample Output:
Viva Voice:
1. What is Circular Convolution ?
2. What is the difference between linear convolution and circular convolution.

G.H. Raisoni College of Engineering, Nagpur.
Department of Information Technology
Seventh Semester Digital Signal Processing
Experiment No: 6
Aim: To write a program to find poles and express H[z] in factored form.
Theory:
Once the Z-transform of a system has been determined , one can use information contained in
functions polynomials to graphically represent function and easily observe many defining
characteristics. The Z-transform will have the below structure.
P[z]
X[z] =
Q[z]
The two polynomials p[z] and Q[z] will allow us to find poles and zeros of the Z-transform.
Zeros and poles
From the fundamental theorem of algebra the numerator has M roots (called zeros) and the
denominator has N roots (called poles). Rewriting the transfer function in terms of poles and
zeros
Where is the zero and is the pole. The zeros and poles are commonly
complex and when plotted on the complex plane (z-plane) it is called the pole-zero plot.
In simple words, zeros are the solutions to the equation obtained by setting the numerator
equal to zero, while poles are the solutions to the equation obtained by setting the
denominator equal to zero.
In addition, there may also exist zeros and poles at z = 0 and . If we take these poles
and zeros as well as multiple-order zeros and poles into consideration, the number of zeros
and poles are always equal.
By factoring the denominator, partial fraction decomposition can be used, which can then be
transformed back to the time domain. Doing so would result in the impulse response and the
linear constant coefficient difference equation of the system.
G.H. Raisoni College of Engineering, Nagpur.
Department of Information Technology
Seventh Semester Digital Signal Processing
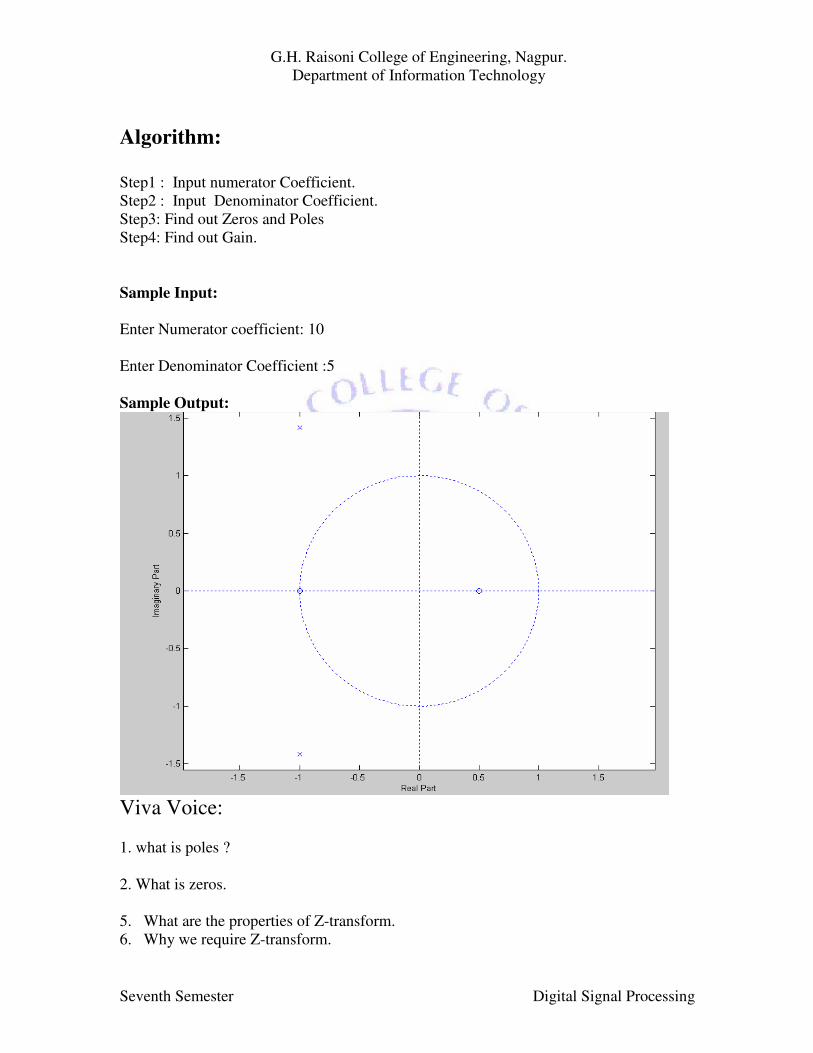
Algorithm:
Step1 : Input numerator Coefficient.
Step2 : Input Denominator Coefficient.
Step3: Find out Zeros and Poles
Step4: Find out Gain.
Sample Input:
Enter Numerator coefficient: 10
Enter Denominator Coefficient :5
Sample Output:
Viva Voice:
1. what is poles ?
2. What is zeros.
5. What are the properties of Z-transform.
6. Why we require Z-transform.
G.H. Raisoni College of Engineering, Nagpur.
Department of Information Technology
Seventh Semester Digital Signal Processing
Experiment No: 7
Aim: Study of FFT.
Theory:
The fast Fourier transform (FFT) is a discrete Fourier transform algorithm which reduces the
number of computations needed for points from to , where lg is the base-2
logarithm. If the function to be transformed is not harmonically related to the sampling
frequency, the response of an FFT looks like a sine function (although the integrated power is
still correct). Aliasing (leakage) can be reduced by atomization using a tapering function.
However, aliasing reduction is at the expense of broadening the spectral response.
FFTs were first discussed by Cooley and Tukey (1965), although Gauss had actually
described the critical factorization step as early as 1805 (Bergland 1969, Strang 1993). A
discrete Fourier transform can be computed using an FFT by means of the Danielson-
Lanczos lemma if the number of points is a power of two. If the number of points is not a
power of two, a transform can be performed on sets of points corresponding to the prime
factors of which is slightly degraded in speed. An efficient real Fourier transform algorithm
or a fast Hartley transform (Bracewell 1999) gives a further increase in speed by
approximately a factor of two. Base-4 and base-8 fast Fourier transforms use optimized code,
and can be 20-30% faster than base-2 fast Fourier transforms. prime factorization is slow
when the factors are large, but discrete Fourier transforms can be made fast for , 3, 4, 5,
7, 8, 11, 13, and 16 using the Winograd transform algorithm (Press et al. 1992, pp. 412-413,
Arndt).
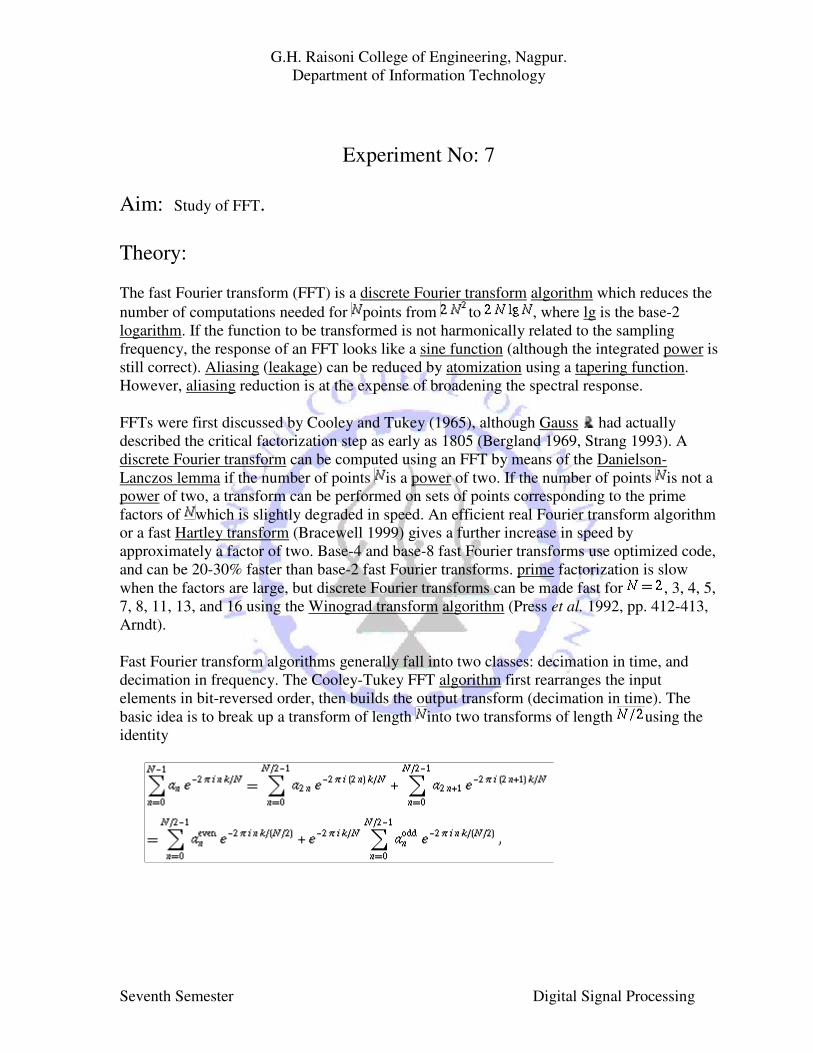
Fast Fourier transform algorithms generally fall into two classes: decimation in time, and
decimation in frequency. The Cooley-Tukey FFT algorithm first rearranges the input
elements in bit-reversed order, then builds the output transform (decimation in time). The
basic idea is to break up a transform of length into two transforms of length using the
identity
G.H. Raisoni College of Engineering, Nagpur.
Department of Information Technology
Seventh Semester Digital Signal Processing
Viva Voice:
1.What is FFT.
2. Can FFT's be done on prime sizes?
3. What are "twiddle factors"?
4. What is "bit reversal"?
5. What is "decimation in time" versus "decimation in frequency"?

G.H. Raisoni College of Engineering, Nagpur.
Department of Information Technology
Seventh Semester Digital Signal Processing
Experiment No: 8
Aim: To Study FIR filters using Windowing Techniques.
Theory:
It is much easier to approach the problem of calculating filter coefficients if we simplify the
filter equation so that we only have to deal with previous inputs (that is, we exclude the
possibility of feedback). The filter equation is then simplified:
If such a filter is subjected to an impulse (a signal consisting of one value followed by
zeroes) then its output must necessarily become zero after the impulse has run through the
summation. So the impulse response of such a filter must necessarily be finite in duration.
Such a filter is called a Finite Impulse Response filter or FIR filter.
can be calculated by taking the inverse Fourier transform of the desired frequency response
and throwing away the small values:
• pretend we don't mind lots of filter coefficients
• specify the desired frequency response using lots of samples
• calculate the inverse Fourier transform
• this gives us a lot of filter coefficients
• so truncate the filter coefficients to give us less
• then calculate the Fourier transform of the truncated set of coefficients to see if it still
matches our requirement
BUT...
Truncating the filter coefficients means we have a truncated signal. And a truncated signal
has a broad frequency spectrum:
G.H. Raisoni College of Engineering, Nagpur.
Department of Information Technology
Seventh Semester Digital Signal Processing
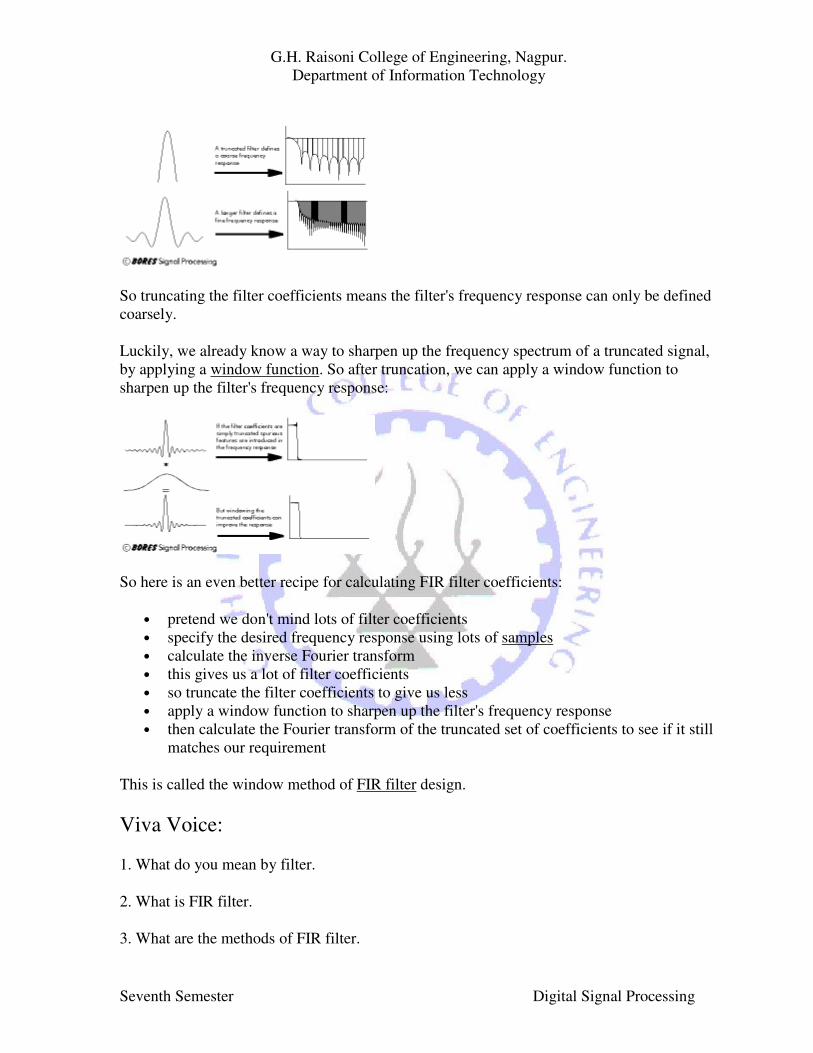
So truncating the filter coefficients means the filter's frequency response can only be defined
coarsely.
Luckily, we already know a way to sharpen up the frequency spectrum of a truncated signal,
by applying a window function. So after truncation, we can apply a window function to
sharpen up the filter's frequency response:
So here is an even better recipe for calculating FIR filter coefficients:
• pretend we don't mind lots of filter coefficients
• specify the desired frequency response using lots of samples
• calculate the inverse Fourier transform
• this gives us a lot of filter coefficients
• so truncate the filter coefficients to give us less
• apply a window function to sharpen up the filter's frequency response
• then calculate the Fourier transform of the truncated set of coefficients to see if it still
matches our requirement
This is called the window method of FIR filter design.
Viva Voice:
1. What do you mean by filter.
2. What is FIR filter.
3. What are the methods of FIR filter.

G.H. Raisoni College of Engineering, Nagpur.
Department of Information Technology
Seventh Semester Digital Signal Processing
Experiment No: 9
Aim: To Study IIR filters from analog filter.
Theory:
Output from a digital filter is made up from previous inputs and previous outputs, using the
operation of convolution:
Two convolutions are involved: one with the previous inputs, and one with the previous
outputs. In each case the convolving function is called the filter coefficients.
If such a filter is subjected to an impulse (a signal consisting of one value followed by
zeroes) then its output need not necessarily become zero after the impulse has run through
the summation. So the impulse response of such a filter can be infinite in duration. Such a
filter is called an Infinite Impulse Response filter or IIR filter.
Note that the impulse response need not necessarily be infinite: if it were, the filter would be
unstable. In fact for most practical filters, the impulse response will die away to a negligibly
small level. One might argue that mathematically the response can go on for ever, getting
smaller and smaller: but in a digital world once a level gets below one bit it might as well be
zero. The Infinite Impulse Response refers to the ability of the filter to have an infinite
impulse response and does not imply that it necessarily will have one: it serves as a warning
that this type of filter is prone to feedback and instability.
G.H. Raisoni College of Engineering, Nagpur.
Department of Information Technology
Seventh Semester Digital Signal Processing
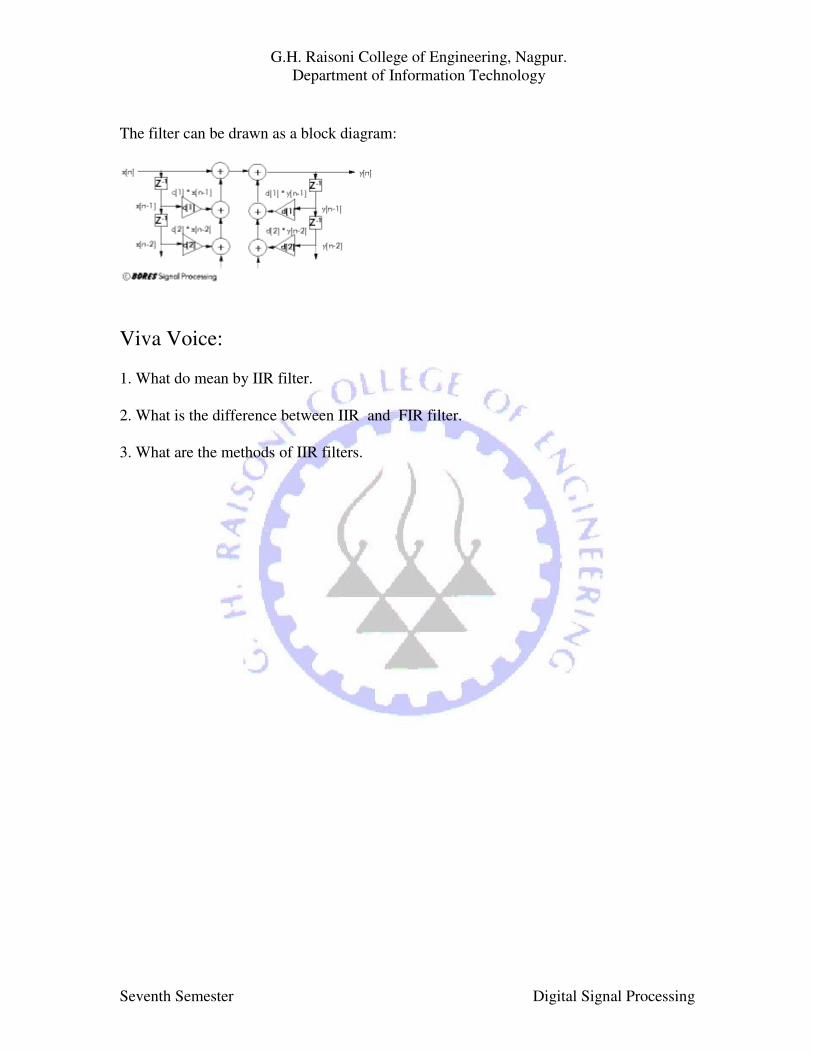
The filter can be drawn as a block diagram:
Viva Voice:
1. What do mean by IIR filter.
2. What is the difference between IIR and FIR filter.
3. What are the methods of IIR filters.


![Faculty Bio-Data 1] Prof. Dr. B. V. Pawar biodata.pdf · in Engineering and Technology (ICETET-08), Organized by IEEE Computer Society, USA & G.H. Raisoni College of Engineering and](https://static.fdocuments.in/doc/165x107/5d0324ad88c99388628d8155/faculty-bio-data-1-prof-dr-b-v-biodatapdf-in-engineering-and-technology.jpg)


![G.H. RAISONI COLLEGE OF ENGINEERING UGC Act, CPF Digdo …ghrce.raisoni.net/ac/3rd.pdfG.H. RAISONI COLLEGE OF ENGINEERING [An Autonomous Institute under UGC Act, 1956] CPF Gab No.3,](https://static.fdocuments.in/doc/165x107/5e679358236a97190b18a8d6/gh-raisoni-college-of-engineering-ugc-act-cpf-digdo-ghrce-gh-raisoni-college.jpg)
![Index [ghrcem.raisoni.net]...F.Y. B. Tech Department of First Year B.Tech of G.H. Raisoni College of Engineering and Management organized a 5th Board of studies Meeting to discuss](https://static.fdocuments.in/doc/165x107/5f030a8e7e708231d4073e8e/index-fy-b-tech-department-of-first-year-btech-of-gh-raisoni-college.jpg)
