GGN IPGA KHARIF PULSES CROP SURVEY PRESENTATION 2014.
64
GGN IPGA KHARIF PULSES CROP SURVEY PRESENTATION 2014
Transcript of GGN IPGA KHARIF PULSES CROP SURVEY PRESENTATION 2014.

GGN IPGA KHARIF PULSES CROP
SURVEY PRESENTATION 2014
1. Madhya Pradesh Vidisha Ashoknagar Sagar Tikamgarh
Chhatarpur Panna Satna Damoh
2. Uttar Pradesh Lalitpur
Jhansi Mahoba Hamirpur
3. Maharashtra Nanded OsmanabadLatur Beed Parbhani Jalna Jalgaon Buldhana Washim
Akola Amrawati Yavatmal Hingoli
4. Rajasthan Ajmer Bhilwara Pali Jalore Barmer Jodhpur Nagaur Jaipur Tonk
5. Karnataka Bidar
Bijapur Gulbarga
6. Andhra Pradesh Medak Nalgonda Mehboobnagar
IndexState & Districts covered under crop survey

WEATHER ANALYSIS
Rains could not reach in most of the pulses growing areas and there was moisture shortages and early sowing cannot commence.

Rains begins to improve from mid July and improve the soil moisture status and sowing occurred.

Follow up showers occurred but not sufficient. So there was moisture deficiency in most of the pulses growing areas. However no areas were critically dry.

Rainfall continued till mid Sept but becomes extinct after that leaving most of the crop in the need of one or two rains to complete favorably.

Good harvest & maturation was in west & central India whereas rains occurred in southern area which cause quality deterioration.

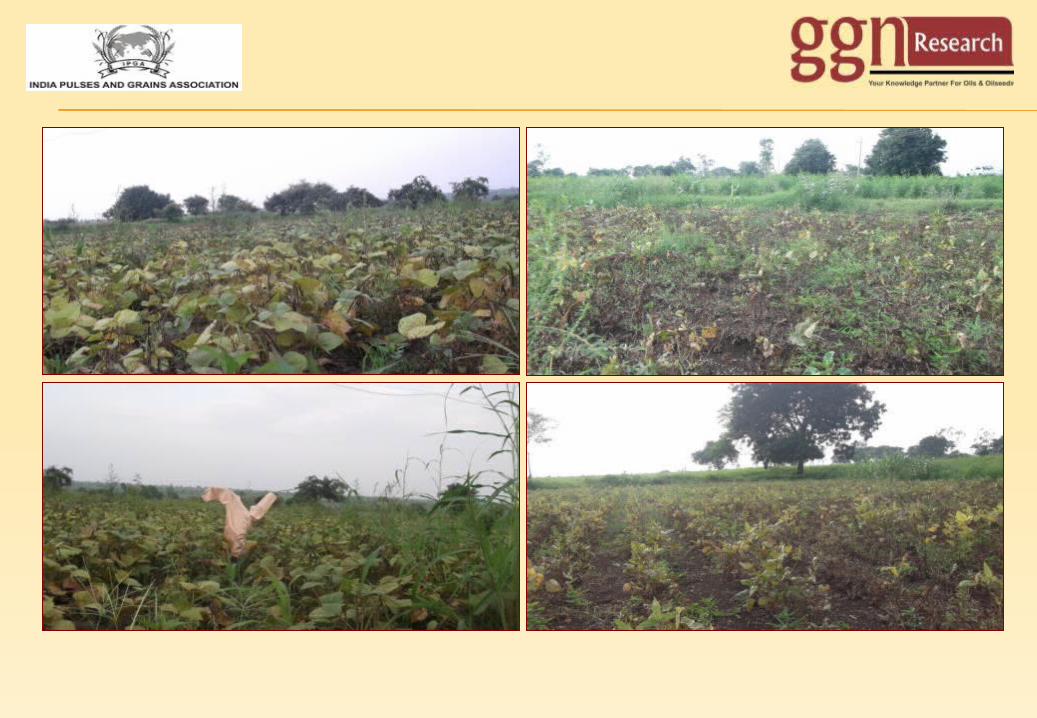
URAD CROP SURVEY
CROP ANALYSIS

Madhya Pradesh
CROP ANALYSIS


MADHYA PRADESH
Observations:
1- This season Urad crop sowing was late due to late arrival of monsoonal rains.
2-This year urad acreage has increased in almost all the districts of Madhya Pradesh and total acreage has increased by 35% over last year.
3- Yields are higher in all the districts of Madhya Pradesh. This season Madhya Pradesh yield is higher by 49% over last year as last year there were very huge losses due to excessive rains.
4- This year Urad production in Madhya Pradesh has Jumped 101% over last year on account of increased acreage & higher yields.
5- Urad crop quality is better than last year.
URAD

Madhya Pradesh•Total area under Urad crop in M.P. for the year 2014 is 862 Thousand hectares. It has increased by 35% as compared to previous year. •Average yield for the year 2014 is 410 kg/hectare as against 275 kg/hectare during the year 2013, it has increased by 49% in comparison with the last year.•Estimated total production of Urad crop for M.P. for the year 2014 is 353.4 Thousand tones, it has increased by 101% as compared to previous year.
URAD
DISTRICT
STATEWISE AREA,PRODUCTION & YIELD OF UradAREA:-000'HECTARE ,PRODUCTION:-000'TONNES, YIELD:-KG./HECTARE
Area Chg.(%)
Yield Chg.(%)
Production Chg.(%)2013 2014 2013 2014 2013 2014
TIKAMGARH 78.8 106.4 35% 250 375 50% 19.7 39.9 103%ASHOKNAGAR 58.4 78.8 35% 375 525 40% 21.9 41.4 89%CHHATARPUR 60.0 81.0 35% 250 400 60% 15.0 32.4 116%ALIRAJPUR 55.5 74.9 35% 250 430 72% 13.9 32.2 132%VIDISHA 49.0 66.2 35% 250 400 60% 12.3 26.5 116%SAGAR 29.2 40.3 38% 250 400 60% 7.3 16.1 121%DAMOH 23.1 31.2 35% 275 415 51% 6.4 12.9 104%JABALPUR 22.0 29.7 35% 300 450 50% 6.6 13.4 103%SHIVPURI 25.6 33.8 32% 275 425 55% 7.0 14.4 104%SATNA 24.4 32.9 35% 275 350 27% 6.7 11.5 72%PANNA 9.6 13.0 35% 250 325 30% 2.4 4.2 76%MANDSAUR 14.6 19.7 35% 250 375 50% 3.7 7.4 103%REWA 9.1 12.3 35% 250 350 40% 2.3 4.3 89%NARSINGHPUR 9.9 12.9 30% 250 400 60% 2.5 5.1 108%BALAGHAT 1.5 2.0 30% 275 425 55% 0.4 0.8 101%CHHINDWARA 10.6 14.3 35% 275 400 45% 2.9 5.7 96%SINGROLI 7.0 9.5 35% 275 400 45% 1.9 3.8 96%JHABUA 8.5 11.5 35% 275 400 45% 2.3 4.6 96%BARWANI 6.9 9.3 35% 275 400 45% 1.9 3.7 96%BETUL 5.0 6.8 35% 275 400 45% 1.4 2.7 96%KATNI 4.5 6.1 35% 275 400 45% 1.2 2.4 96%SEONI 6.4 8.6 35% 275 400 45% 1.8 3.5 96%Othersh 120.4 161.0 34% 285 400 40% 34.3 64.4 88%Total 640.0 862.0 35% 275 410 49% 175.7 353.4 101%

Uttar Pradesh


UTTAR PRADESH
Observations:
1- This season Urad crop sowing was late due to late arrival of monsoonal rains.
2-This year urad acreage has decreased by 3% over last year. Mahaba & Hamirpur districts are showing a big decline in acreage. Whereas Lalitpur, & Jhasi districts are showing a good increase in acreage.
3- Yields are generally showing a decline in almost all the districts of uttar Pradesh. Lalitpur is the only district which is showing improvement in yield. Overall Uttar Pradesh is showing a decline of 10% yields of Urad crop.
4- This year Urad production in Uttar Pradesh has reduced by 12% over last year on account of reduced acreage & lower yields.
5- Urad crop quality is better than last year.
URAD

Uttar Pradesh•Total area under Urad crop in U.P. for the year 2014 is 561 Thousand hectares. It has decreased by -3% as compared to previous year.
•Average yield for the year 2014 is 360 kg/hectare as against 400 kg/hectare during the year 2013, it has decreased by 10% in comparison with the last year.
•Estimated total production of Urad crop for U.P. for the year 2014 is 201.96 Thousand tones, it has decreased by 12% as compared to previous year.
DISTRICT
STATEWISE AREA,PRODUCTION & YIELD OF UradAREA:-000'HECTARE ,PRODUCTION:-000'TONNES, YIELD:-KG./HECTARE
Area Chg.(%)
Yield Chg.(%)
Production Chg.(%)2013 2014 2013 2014 2013 2014
LALITPUR 182.33 233.38 28% 350 430 23% 63.82 100.36 57%
MAHOBA 55.39 40.99 -26% 470 325 -31% 26.03 13.32 -49%
JHANSI 39.24 43.16 10% 425 400 -6% 16.68 17.26 4%
HARDOI 27.70 22.71 -18% 350 300 -14% 9.69 6.81 -30%
UNNAO 27.70 23.54 -15% 350 320 -9% 9.70 7.53 -22%
BADAUN 23.66 20.11 -15% 400 300 -25% 9.46 6.04 -36%
HAMIRPUR 33.47 25.10 -25% 400 200 -50% 13.39 5.03 -62%
MORADABAD 22.42 19.19 -14% 400 300 -25% 8.98 5.76 -36%
RAEBARELI 12.20 10.49 -14% 410 300 -27% 5.01 3.15 -37%
Others 152.91 122.32 -20% 445 300 -33% 68.04 36.70 -46%
Total 577.00 561.00 -3% 400 360 -10% 230.80 201.96 -12%
URAD

Maharashtra


MAHARASHTRA
Observations:
1- This season Urad crop sowing was late due to late arrival of monsoonal rains.
2-This year urad acreage has drastically reduced by 22% over last year. Almost all the disctricts acreage has reduced as acreage has shifted towards soybean due to late arrival of monsoonal rains.
3- Yields are generally showing a marginal decline of 5% as compared to last year.
4- This year Urad production in Maharashtra has reduced by 26% over last year on account of reduced acreage & lower yields.
5- Urad crop quality is better than last year.
URAD

Maharastra
•Total area under Urad crop in Maharashtra for the year 2014 is 256 Thousand hectares. It has decreased by 22% as compared to previous year. •Average yield for the year 2014 is 540 kg/hectare as against 566 kg/hectare during the year 2013, it has decreased by 5% in comparison with the last year.•Estimated total production of Urad crop for Maharashtra for the year 2014 is 138.24 Thousand tones, it has decreased by 26% as compared to previous year.
DISTRICT
DISTRICTWISE AREA,PRODUCTION & YIELD OF UradAREA:-000'HECTARE ,PRODUCTION:-000'TONNES, YIELD:-KG./HECTARE
Area Chg.(%)
Yield Chg.(%)
Production Chg.(%)2013 2014 2013 2014 2013 2014
Nanded 45.2 30.7 -32% 660 600 -9% 29.8 18.4 -38%Jalgaon 42.0 29.4 -30% 600 600 0% 25.2 17.6 -30%Buldhana 41.2 27.6 -33% 580 550 -5% 23.9 15.2 -36%Osmanabad 35.2 26.4 -25% 550 550 0% 19.4 14.5 -25%Washim 30.2 24.2 -20% 550 550 0% 16.6 13.3 -20%Nasik 15.0 14.3 -5% 600 550 -8% 9.0 7.8 -13%Latur 13.2 9.5 -28% 575 575 0% 7.6 5.5 -28%Parbhani 11.0 9.4 -15% 510 500 -2% 5.6 4.7 -17%Jalna 10.0 8.2 -18% 550 525 -5% 5.5 4.3 -22%Beed 10.0 8.5 -15% 500 475 -5% 5.0 4.0 -19%Nandurbar 13.0 12.4 -5% 580 500 -14% 7.5 6.2 -18%Akola 11.8 8.9 -25% 450 400 -11% 5.3 3.5 -33%Amravati 5.3 4.1 -22% 450 400 -11% 2.4 1.7 -31%Ahmednagar 5.0 4.8 -5% 500 500 0% 2.5 2.4 -5%Aurangabad 1.4 1.2 -15% 525 525 0% 0.7 0.6 -15%Hingoli 7.0 6.0 -15% 525 525 0% 3.7 3.1 -15%Yavatmal 6.9 5.9 -15% 525 500 -5% 3.6 2.9 -19%Wardha 0.4 0.4 -12% 550 500 -9% 0.2 0.2 -20%Others 26.2 24.5 -7% 500 500 0% 13.1 12.2 -7%Total 330.0 256.0 -22% 566 540 -5% 186.7 138.24 -26%
URAD

Rajasthan


RAJASTHAN
Observations:
1- This season Urad crop sowing was late due to late arrival of monsoonal rains.
2-This year urad acreage has increased by 14% over last year. Almost all the districts acreage has grown up.
3- Yields are generally showing a decline of 11% as compared to last year. As sowing was late and below average rainfall.
4- This year Urad production in Rajasthan has slightly increased by 1% over last year.
5- Urad crop quality is better than last year.
URAD

Rajasthan
•Total area under Urad crop in Rajasthan for the year 2014 is 179 Thousand hectares. It has increased by 14% as compared to previous year.
•Average yield for the year 2014 is 400 kg/hectare as against 450 kg/hectare during the year 2013, it has decreased by 11% in comparison with the last year.
•Estimated total production of Urad crop for Rajasthan for the year 2014 is 71.6 Thousand tones, it has increased by 1% as compared to previous year.
URAD
DISTRICT
DISTRICTWISE AREA,PRODUCTION & YIELD OF Urad
AREA:-000'HECTARE ,PRODUCTION:-000'TONNES, YIELD:-KG./HECTAREArea Chg.
(%)Yield Chg.
(%)Production Chg.
(%)2013 2014 2013 2014 2013 2014
Bhilwara 45.0 53.1 18% 510 425 -17% 23.0 22.6 -2%
Bundi 20.0 23.0 15% 500 400 -20% 10.0 9.2 -8%
Tonk 20.0 22.8 14% 500 350 -30% 10.0 8.0 -20%
Ajmer 18.0 20.0 11% 320 340 6% 5.8 6.8 18%
Banswara 10.0 11.2 12% 550 450 -18% 5.5 5.0 -8%
Dungarpur 12.0 13.4 12% 400 425 6% 4.8 5.7 19%
Chittore 4.0 4.4 10% 375 425 13% 1.5 1.9 25%
Jhalawar 5.0 5.5 10% 400 425 6% 2.0 2.3 17%
Udaipur 6.0 6.6 10% 375 420 12% 2.3 2.8 23%
Baran 5.0 5.5 10% 370 400 8% 1.9 2.2 19%
S. Madhopur 4.0 4.4 10% 400 400 0% 1.6 1.8 10%
Others 8.0 9.1 14% 300 375 25% 2.4 3.4 43%
Total 157.0 179.0 14% 450 400 -11% 70.6 71.6 1%

Cropping PatternMajor cropping pattern is single cropping.
Factors Affecting Yield Apart from the rainfall, usage of irrigation facility, usage of chemical and organic fertilizers, disease and pest attack, usage of pesticides, weather and timely harvesting are the major factors affecting the productivity of the Urad Crop.
1.1 Sowing Time –
Jun 2nd Week
Jun 3rd Week
Jun 4th Week
July 1st Week
July 2nd Week
July 3rd Week
July 4th Week
0%10%20%30%40%50%60%70%
Initiated Sowing
2013 2014
URAD
This season sowing was delayed by 2-3 weeks as arrival of monsoonal rains was late.

1.2 Sowing Status 1.3– Crop Condition
28%
72%
Timely Late
URAD
Major sowing was late but the crop status is better than last year as last year there was big losses due to excessive rains.
Normal Good Bad
47%
3%
50%
70%
10%
20%
Crop Condition
2013 2014

Sep 2nd
Week
Sep 3rd
Week
Sep 4th
Week
Oct 1st
Week
Oct 2nd
Week
Oct 3rd
Week
Oct 4th
Week
0%
5%
10%
15%
20%
25%
30%
35%
2013 2014
1.4 Variety Sown 1.5-Expected harvesting: The harvest this year is delayed by 1 to 2 weeks.
URAD
Harvesting is delayed by 1 to 2 weeks.
77%
7%
16%
Desi Nirmal Others

2400-2600
2600-2800
2800-3000
3000-3200
3200-3400
3400-3600
3600-3800
3800-4000
4000 n above
2%4%
54%
16%
5%7%
5%3% 4%
3200-3400
3400-3600
3600-3800
3800-4000
4000-4200
4200-4400
4400-4600
4600 n above
3%
29%
16%
28%
4%
8%6% 6%
1.6 Last Year Price 1.7- Expected Prices
URAD
Most of the small farmers sell their crop as soon as harvested and others medium farmers sell their crop as accordance to their financial requirements, while big farmers hold their crops in anticipation of higher prices.

Urad Crop
28%
72%
Yes No
2013 2014
90%95%
10%5%
Low Normal
1.8-Storage: . 1.9- Pest Attack
URAD
Storage intentions are very few as most of the farmers sell their crops for their financial needs. Pest attack was low this season.

ALL INDIAObservations:
1-This season all India Urad crop sowing was late as arrival of monsoonal rains was delayed by 2-3 weeks.
2- There is big jump of 35% over previous year in acreage of Madhya Pradesh as most of the first or early sowing of soybean failed and there was shortages of soybean seed for replanting or resowing so farmers has to shift towards Urad.
3- All India Urad acreage is showing a marginal gain of 5% over last year as rest of state acreage is generally showing decline.
4- All India yields are marginally higher by 3%. Madhya Pradesh yield are showing big improvement of 49% over last year whereas rest other states are generally showing a decline.
5- The quality of Urad crop in slightly deteriorated in southern states as there were rains in late Sept & early Oct.
6- Quality of Urad crop in M.P., Maharashtra, U.P. and other states are better than last year.
7- This year all India Urad production is higher by 8% over last year. The game changer is Madhya Pradesh which contributes around 35% of all India crop. This year M.P. production has jumped 101% over last year while other sates are generally showing a decline in production.
URAD

ALL INDIA
Percentage Change in Area, Yield and ProductionThis is the main finding of the survey as our scientific method gives us results in variation on percentage basis from previous year.
•Total area under Urad crop in India for the year 2014 has increased by 5% as compared to previous year.
•Average yield for the year 2014 has increased by 3%.
Estimated total production of Urad crop for India for the year 2014 has increased by 8% as compared to previous year.
State
STATEWISE AREA,PRODUCTION & YIELD OF UradAREA:-000'HECTARE ,PRODUCTION:-000'TONNES, YIELD:-KG./HECTARE
AREA2013
AREA2014
Changein (%)
YIELD2013
YIELD2014
Changein (%)
PROD.2013
PROD.2014
Changein (%)
Madhya Pradesh 640.00 862.00 35% 275 410 49% 176.00 353.42 101% Uttar Pradesh 577.00 561.00 -3% 400 360 -10% 230.80 201.96 -12% Maharastra 330.00 256.00 -22% 566 540 -5% 186.78 138.24 -26% Rajasthan 157.00 179.00 14% 450 400 -11% 70.65 71.60 1% Karnataka 84.00 60.00 -29% 450 425 -6% 37.80 25.50 -33% Gujarat 88.00 68.00 -23% 450 425 -6% 39.60 28.90 -27% A.P. & Telangana 38.00 29.00 -24% 425 400 -6% 16.15 11.60 -28% Others 473.00 485.00 3% 400 400 0% 189.20 194.00 3%
Total 2387.00 2500.00 5% 397 410 3% 946.98 1025.22 8%
URAD

MOONG CROP SURVEY
CROP ANALYSIS

Madhya Pradesh
CROP ANALYSIS


MADHYA PRADESH
Observations:
1- This season Moong crop sowing was late due to late arrival of monsoonal rains.
2-This year Moong acreage has increased in almost all the districts of Madhya Pradesh and total acreage has increased by 46% over last year. However Madhya Pradesh contributes smaller or only 7% of all India crop.
3- Yields are higher in all the districts of Madhya Pradesh. This season Madhya Pradesh yield is higher by 45% over last year as last year there were very huge losses due to excessive rains.
4- This year Moong production in Madhya Pradesh has Jumped 111% over last year on account of increased acreage & higher yields.
5- Moong crop quality is better than last year.
MOONG

Madhya Pradesh•Total area under Moong crop in M.P. for the year 2014 is 163 Thousand hectares. It has increased by 46% as compared to previous year. •Average yield for the year 2014 is 435 kg/hectare as against 300 kg/hectare during the year 2013, it has increased by 45% in comparison with the last year.•Estimated total production of Moong crop for M.P. for the year 2014 is 70.9 Thousand tones, it has increased by 111% as compared to previous year.
MOONG
DISTRICT
STATEWISE AREA,PRODUCTION & YIELD OF MoongAREA:-000'HECTARE ,PRODUCTION:-000'TONNES, YIELD:-KG./HECTARE
Area Chg.(%)
Yield Chg.(%)
Production Chg.(%)2013 2014 2013 2014 2013 2014
KHARGONE 7.5 10.1 35% 300 425 42% 2.3 4.3 91% SAGAR 6.5 9.4 45% 300 425 42% 2.0 4.0 105% CHHATARPUR 7.5 10.9 45% 300 450 50% 2.3 4.9 118% BARWANI 5.9 8.0 35% 280 450 61% 1.7 3.6 117% TIKAMGARH 6.6 9.6 45% 280 400 43% 1.8 3.8 107% DHAR 7.0 9.5 35% 325 400 23% 2.3 3.8 66% REWA 4.2 6.1 45% 300 375 25% 1.3 2.3 81% SHIVPURI 4.9 7.4 50% 350 455 30% 1.7 3.3 95% SATNA 4.3 6.2 45% 275 375 36% 1.2 2.3 98% PANNA 2.2 3.2 45% 375 375 0% 0.8 1.2 45% NARSINGHPUR 2.0 3.2 60% 275 550 100% 0.6 1.8 220% KHANDWA 2.9 3.9 35% 300 425 42% 0.9 1.7 91% JABALPUR 1.8 2.5 40% 300 500 67% 0.5 1.3 133% CHHINDWARA 2.8 3.8 35% 300 500 67% 0.8 1.9 125% SIDHI 1.6 2.3 45% 300 425 42% 0.5 1.0 105% ALIRAJPUR 2.0 2.7 35% 275 500 82% 0.6 1.4 145% BHIND 2.5 3.8 50% 300 430 43% 0.8 1.6 115% ASHOKNAGAR 2.5 3.9 55% 300 550 83% 0.8 2.1 184% DATIA 4.2 6.5 55% 300 455 52% 1.3 3.0 135% RAISEN 2.7 4.1 50% 300 450 50% 0.8 1.8 125% VIDISHA 1.5 2.3 50% 275 425 55% 0.4 1.0 132% RAJGARH 1.6 2.4 50% 275 450 64% 0.4 1.1 145% HARDA 1.5 2.3 55% 275 500 82% 0.4 1.2 182% BETUL 1.3 2.0 55% 275 450 64% 0.4 0.9 154% Others 24.5 37.1 51% 300 425 42% 7.4 15.8 115% Total 112.0 163.0 46% 300 435 45% 33.6 70.9 111%

Maharashtra


MAHARASHTRA
Observations:
1- This season Moong crop sowing was late due to late arrival of monsoonal rains.
2-This year Moong acreage has drastically reduced by 29% over last year. Almost all the districts acreage has reduced as acreage has shifted towards soybean due to late arrival of monsoonal rains.
3- Yields are generally showing a marginal decline of 4% as compared to last year.
4- This year Moong production in Maharashtra has drastically reduced by 32% over last year on account of reduced acreage & lower yields.
5- Moong crop quality is average & same as last year.
MOONG

Maharastra
•Total area under Moong Crop in Maharashtra for the year 2014 is 319 Thousand hectares. It has decreased by 29% as compared to previous year. •Average yield for the year 2014 is 580 kg/hectare as against 605 kg/hectare during the year 2013, it has decreased by 4% in comparison with the last year.•Estimated total production of Moong Crop for Maharashtra for the year 2014 is 185 Thousand tones, it has decreased by 32% as compared to previous year.
DISTRICT
DISTRICTWISE AREA,PRODUCTION & YIELD OF MoongAREA:-000'HECTARE ,PRODUCTION:-000'TONNES, YIELD:-KG./HECTARE
Area Chg.(%)
Yield Chg.(%)
Production Chg.(%)2013 2014 2013 2014 2013 2014
Amravati 50.8 33.5 -34% 600 550 -8% 30.5 18.4 -40%Akola 47.0 30.6 -35% 600 575 -4% 28.2 17.6 -38%Buldhana 40.9 28.6 -30% 625 600 -4% 25.6 17.2 -33%Washim 37.7 24.9 -34% 650 625 -4% 24.5 15.6 -37%Jalgaon 36.9 28.8 -22% 675 675 0% 24.9 19.4 -22%Parbhani 35.1 23.2 -34% 600 575 -4% 21.1 13.3 -37%Nanded 28.2 19.7 -30% 650 600 -8% 18.3 11.8 -35%Jalna 23.5 15.7 -33% 560 525 -6% 13.2 8.3 -37%Hingoli 22.9 16.0 -30% 550 525 -5% 12.6 8.4 -33%Dhule 18.0 14.4 -20% 550 550 0% 9.9 7.9 -20%Latur 15.8 11.1 -30% 650 650 0% 10.3 7.2 -30%Osmanabad 14.6 10.2 -30% 625 625 0% 9.1 6.4 -30%Nandurbar 14.0 11.2 -20% 600 550 -8% 8.4 6.2 -27%Nasik 12.5 10.0 -20% 610 550 -10% 7.6 5.5 -28%Yavatmal 11.1 7.2 -35% 555 550 -1% 6.2 4.0 -36%Aurangabad 3.2 2.4 -25% 550 550 0% 1.8 1.3 -25%Beed 3.1 2.2 -30% 550 525 -5% 1.7 1.1 -33%Wardha 1.0 0.9 -12% 585 525 -10% 0.6 0.5 -21%Nagpur 1.7 1.4 -15% 525 525 0% 0.9 0.8 -15%Others 30.0 27.0 -10% 525 525 0% 15.8 14.2 -10%Total 448.0 319.0 -29% 605 580 -4% 271.0 185.0 -32%
MOONG

Rajasthan


RAJASTHAN
Observations:
1- This season Moong crop sowing was late due to late arrival of monsoonal rains.
2-This year Moong acreage has decreased by 8% over last year. As due to late arrival of monsoonal rains sowing could not be fully completed.
3- Yields are generally showing a decline of 15% as compared to last year. As sowing was late and below average rainfall.
4- This year Moong production in Rajasthan has decreased by 22% over last year on account of lower acreage & reduced yield.
MOONG

Rajasthan
•Total area under Moong crop in Rajasthan for the year 2014 is 850.03 Thousand hectares. It has decreased by 8% as compared to previous year.
•Average yield for the year 2014 is 440 kg/hectare as against 551 kg/hectare during the year 2013, it has decreased by 20% in comparison with the last year.
•Estimated total production of Moong crop for Rajasthan for the year 2014 is 374 Thousand tones, it has decreased by 27% as compared to previous year.
MOONG
DISTRICT
DISTRICTWISE AREA,PRODUCTION & YIELD OF MoongAREA:-000'HECTARE ,PRODUCTION:-000'TONNES, YIELD:-KG./HECTARE
Area Chg.(%)
Yield Chg.(%)
Production Chg.(%)2013 2014 2013 2014 2013 2014
Nagaur 276.4 236.3 -15% 550 450 -18% 152.0 106.3 -30%Jodpur 103.4 103.4 0% 600 475 -21% 62.0 49.1 -21%Jalore 79.7 79.7 0% 600 475 -21% 47.8 37.9 -21%Pali 90.0 82.8 -8% 475 400 -16% 42.8 33.1 -23%Jaipur 80.0 68.0 -15% 475 350 -26% 38.0 23.8 -37%Ajmer 70.0 66.5 -5% 575 450 -22% 40.3 29.9 -26%Bhilwara 10.0 10.0 0% 575 450 -22% 5.8 4.5 -22%Barmer 50.0 47.5 -5% 600 475 -21% 30.0 22.6 -25%Tonk 40.0 35.6 -11% 550 350 -36% 22.0 12.5 -43%Sikar 17.8 17.2 -3% 475 400 -16% 8.5 6.9 -19%Ganganagar 13.7 13.0 -5% 575 500 -13% 7.9 6.5 -17%Hanumangarh 75.0 71.0 -5% 575 470 -18% 43.1 33.4 -23%Others 20.0 19.0 -5% 510 400 -22% 10.2 7.6 -25%Total 926.00 850.03 -8% 551 440 -20% 510.3 374.0 -27%

Karnataka


KARNATAKA
Observations:
1- This season Moong crop sowing was late due to late arrival of monsoonal rains.
2-This year Moong acreage has drastically reduced by 18% over last year. Almost all the districts acreage has reduced due to poor rains while sowing time therefore could not complete the sowing intentions due to moisture deficits.
3- Yields are generally showing a decline of 9% as compared to last year as sowing was late & below average rainfall.
4- This year Moong production in Karnataka has reduced drastically by 25% over last year on account of reduced acreage & lower yields.
5- Moong crop quality has deteriorated due of rainfall at harvesting period.
MOONG

Karnataka
•Total area under Moong crop in Karnataka for the year 2014 is 244 Thousand hectares. It has decreased by 18% as compared to previous year.
•Average yield for the year 2014 is 425 kg/hectare as against 475 kg/hectare during the year 2013, it has decreased by 9% in comparison with the last year.
•Estimated total production of Moong crop for Karnataka for the year 2014 is 128.10 Thousand tones, it has decreased by 25% as compared to previous year.
MOONG
DISTRICT
STATEWISE AREA,PRODUCTION & YIELD OF MoongAREA:-000'HECTARE ,PRODUCTION:-000'TONNES, YIELD:-KG./HECTARE
Area Chg.(%)
Yield Chg.(%)
Production Chg.(%)2013 2014 2013 2014 2013 2014
Gulbarga 81.06 63.22 -22% 575 525 -9% 46.61 33.19 -29%Bidar 37.85 28.38 -25% 625 575 -8% 23.65 16.32 -31%Bijapur 21.46 17.83 -17% 650 600 -8% 13.95 10.70 -23%Gadag 67.35 57.92 -14% 555 510 -8% 37.38 29.56 -21%Dharwad 25.63 21.68 -15% 550 500 -9% 14.10 10.84 -23%Belgaum 22.65 19.25 -15% 555 500 -10% 12.57 9.63 -23%Koppal 9.24 7.85 -15% 550 500 -9% 5.08 3.93 -23%Others 32.78 27.86 -15% 550 500 -9% 18.03 13.93 -23%
Total 298.00 244.00 -18% 575 525 -9% 171.36 128.10 -25%

Uttar Pradesh•Total area under Moong crop in U.P. for the year 2014 is 64 Thousand hectares. It has decreased by 15% as compared to previous year.
•Average yield for the year 2014 is 400 kg/hectare as against 450 kg/hectare during the year 2013, it has decreased by 11% in comparison with the last year.
•Estimated total production of Moong crop for U.P. for the year 2014 is 25.57 Thousand tones, it has decreased by 24% as compared to previous year.
MOONG
DISTRICT
STATEWISE AREA,PRODUCTION & YIELD OF MoongAREA:-000'HECTARE ,PRODUCTION:-000'TONNES, YIELD:-KG./HECTARE
Area Chg.(%)
Yield Chg.(%)
Production Chg.(%)2013 2014 2013 2014 2013 2014
MAHOBA 14.63 10.53 -28% 480 350 -27% 7.02 3.69 -48%LALITPUR 10.73 11.37 6% 425 475 12% 4.56 5.40 18%JHANSI 9.30 9.86 6% 400 400 0% 3.72 3.94 6%UNNAO 7.95 6.76 -15% 470 400 -15% 3.74 2.70 -28%HAMIRPUR 7.35 5.15 -30% 470 350 -26% 3.45 1.80 -48%BANDA 7.20 5.62 -22% 450 375 -17% 3.24 2.11 -35%CHITRAKUT 2.78 2.36 -15% 450 380 -16% 1.25 0.90 -28%RAEBARELI 2.40 2.04 -15% 450 425 -6% 1.08 0.87 -20%ALIGARH 1.95 1.66 -15% 450 425 -6% 0.88 0.70 -20%JALAUN 1.80 1.53 -15% 450 400 -11% 0.81 0.61 -24%Others 8.93 7.14 -20% 450 400 -11% 4.02 2.86 -29%Total 75.00 64.00 -15% 450 400 -11% 33.76 25.57 -24%

A.P. & Telangana
•Total area under Moong crop in A.P. & Telangana for the year 2014 is 90 Thousand hectares. It has decreased by 36% as compared to previous year.
•Average yield for the year 2014 is 475 kg/hectare as against 500 kg/hectare during the year 2013, it has decreased by 5% in comparison with the last year.
•Estimated total production of Moong crop for A.P. & Telangana for the year 2014 is 42.76 Thousand tones, it has decreased by 39% as compared to previous year.
MOONG
DISTRICT
STATEWISE AREA,PRODUCTION & YIELD OF MoongAREA:-000'HECTARE ,PRODUCTION:-000'TONNES, YIELD:-KG./HECTARE
Area Chg.(%)
Yield Chg.(%)
Production Chg.(%)2013 2014 2013 2014 2013 2014
Medak 31.16 20.255 -35% 525 500 -5% 16.36 10.13 -38%Nalgonda 22.42 14.572 -35% 515 475 -8% 11.55 6.92 -40%Warangal 18.19 11.823 -35% 500 465 -7% 9.09 5.50 -40%Mahaboobnagar 15.65 10.956 -30% 500 475 -5% 7.83 5.20 -34%Nizamabad 12.41 7.693 -38% 500 500 0% 6.20 3.85 -38%Adilabad 6.49 3.892 -40% 500 480 -4% 3.24 1.87 -42%Krishna 6.49 3.898 -40% 500 470 -6% 3.24 1.83 -44%Karimnagar 6.06 3.638 -40% 450 425 -6% 2.73 1.55 -43%Rangareddy 6.20 3.735 -40% 425 425 0% 2.64 1.59 -40%Khammam 4.23 2.585 -39% 500 470 -6% 2.12 1.21 -43%Prakasam 2.96 1.714 -42% 450 440 -2% 1.33 0.75 -43%Others 8.74 5.245 -40% 475 450 -5% 4.15 2.36 -43%Total 141.00 90.00 -36% 500 475 -5% 70.50 42.76 -39%

Cropping PatternMajor cropping pattern is single cropping.
Factors Affecting Yield Apart from the rainfall, usage of irrigation facility, usage of chemical and organic fertilizers, disease and pest attack, usage of pesticides, weather and timely harvesting are the major factors affecting the productivity of the Moong crop.
2.1 Sowing Time –
Jun 2nd Week
Jun 3rd Week
Jun 4th Week
July 1st Week
July 2nd Week
July 3rd Week
July 4th Week
0%
10%
20%
30%
40%
50%
60%
2013 2014
MOONG
This season sowing was delayed by 2-3 weeks as arrival of monsoonal rains was late.

2.2 Sowing Status 2.3– Crop Condition
20%
80%
Timely Late
Normal Good Bad
41%
19%
40%
60%
5%
35%
2013 2014
MOONG
This year percentage of good crop was only 5% down 14% over previous year Most of the crop was normal to poor.

2.4 Variety Sown 2.5-Expected harvesting: The harvest this year is delayed by 1 to 2 weeks.
Sep 2nd Week
Sep 3rd Week
Sep 4th Week
Oct 1st Week
Oct 2nd Week
Oct 3rd Week
0%
5%
10%
15%
20%
25%
30%
35%
40%
2013 2014
MOONG
The harvesting is delayed by 1-2 weeks.
85%
5%
10%
Desi Nirmal Others

2.8-Storage 2.9- Pest Attack
29%
71%
Yes No
2013 2014
88%83%
12%17%
Low Normal
MOONG
The storage intention is very few as most of the farmers sell their crop for their financial needs.

ALL INDIA
Observations:MOONG
1- This season all India Moong crop sowing was late as arrival of monsoonal rains was delayed by 2-3 weeks.
2- All India Moong crop acreage is down by 13% over last year as due to late arrival of monsoonal rains sowing intentions was unable to meet and the percentage of vacant land increased. Only exception in M.P. which is showing a jump of 46% over last year but M.P. contributed only 7% of all India crop.
3- Yields are generally showing a decline of 12% over last year as due to late sowing and below average rainfall.
4- Quality of Moong crop is generally average to good this year but some quality deterioration occurred in southern states due to rains during harvesting period.
5- This year All India Moong crop is reduced by 23% over last year due to double blow of acreage & yield.
MOONG

Percentage Change in Area, Yield and ProductionThis is the main finding of the survey as our scientific method gives us results in variation on percentage basis from previous year.
•Total area under Moong crop in India for the year 2014 has Decreased by 13% as compared to previous year.
•Average yield for the year 2014 has Decreased by 12%.
• Estimated total production of Moong crop for India for the year 2014 has Decreased by 23% as compared to previous year.
State
STATEWISE AREA,PRODUCTION & YIELD OF Moong
AREA:-000'HECTARE ,PRODUCTION:-000'TONNES, YIELD:-KG./HECTARE
AREA2013
AREA2014
Changein (%)
YIELD2013
YIELD2014
Changein (%)
PROD.2013
PROD.2014
Changein (%)
Rajasthan926.00 850.00 -8% 551 440 -20% 510.23 374.00 -27%
Maharastra448.00 319.00 -29% 605 580 -4% 271.04 185.02 -32%
Karnataka298.00 244.00 -18% 575 525 -9% 171.35 128.10 -25%
Madhya Pradesh112.00 163.00 46% 300 435 45% 33.60 70.91 111%
A.P. & Telangana141.00 90.00 -36% 500 475 -5% 70.50 42.75 -39%
Gujarat129.00 80.00 -38% 500 475 -5% 64.50 38.00 -41%
Uttar Pradesh75.00 64.00 -15% 450 400 -11% 33.75 25.60 -24%
Others271.00 275.00 1% 400 375 -6% 108.40 103.13 -5%
Total 2400.00 2085.00 -13% 526 464 -12% 1263.37 967.50 -23%
MOONGAll India

THANKS
www.ggnresearch.com
Indore Office:401, Princess Empire, 12, Racecorse Road, Indore (M.P.)- 452001.Phone:- +91-731-4015050Mob:- +91-95892-33888Email: [email protected]
Rajkot Office:422, Shivam Complex, Sarveshwar Chowk, Dr. Yagnik Road, Rajkot- 360001, Gujarat, India.Phone:- +91-281-6621200Mob:- +91-94269-00726Email: [email protected]