GGD-99-19 Tax Administration: IRS' Audit and Criminal ...
44
TAX ADMINISTRATION IRS’ Audit and Criminal Enforcement Rates for Individual Taxpayers Across the Country United States General Accounting Office GAO Report to the Honorable Harold E. Ford, Jr. and the Honorable Henry A. Waxman, House of Representatives December 1998 GAO/GGD-99-19
Transcript of GGD-99-19 Tax Administration: IRS' Audit and Criminal ...

TAXADMINISTRATION
IRS’ Audit andCriminal EnforcementRates for IndividualTaxpayers Across theCountry
United States General Accounting Office
GAO Report to the Honorable Harold E. Ford,Jr. and the Honorable Henry A. Waxman,House of Representatives
December 1998
GAO/GGD-99-19


United States
General Accounting Office
Washington, D.C. 20548
General Government Division
B-280369
Page 1 GAO/GGD-99-19 Audit and Criminal Enforcement Rates
GAO
December 23, 1998
The Honorable Harold E. Ford, Jr.House of Representatives
The Honorable Henry A. WaxmanHouse of Representatives
Recently, some observers have raised questions about whether the InternalRevenue Service (IRS) disproportionately audits or pursues criminalinvestigations of taxpayers in some locations compared to other locations.An April 1997 study1 concluded that enforcement of the tax laws occurredat higher rates among taxpayers living in the South compared toenforcement in the rest of the country. Moreover, congressional hearingsin 1998 pointed to concerns about whether IRS’ audits and criminalinvestigations were always justified.
Given concerns about alleged disproportionate treatment, at your requestthis report provides information about (1) factors that might explain whyIRS’ audit, criminal investigation initiation, and prosecution referral ratesfor individual taxpayers differ across the country; (2) rates at whichindividual taxpayers were audited in IRS’ Tennessee-Kentucky district andthe South2 during fiscal years 1992 through 1997 compared to the nationalaverage rates; (3) rates at which individual taxpayers were investigated foralleged criminal tax and nontax violations and referred for prosecution inIRS’ Tennessee-Kentucky district and the South during fiscal years 1992through 1997 compared to the national average rates; and (4) controls thatIRS has established for its audits, criminal investigations, and prosecutionreferrals for individual taxpayers and whether these controls were used.3
IRS’ 33 districts and 10 service centers audit tax returns to determinewhether taxpayers have complied with tax laws and paid the correct taxes.The Criminal Investigation Division (CID) through district and regional 1The Transactional Records Access Clearinghouse (TRAC)—a data-gathering and research organizationassociated with Syracuse University—did the study. The study focused on criminal prosecutions,convictions, and sentencings. It did not draw the same conclusions about IRS data on its audits,criminal investigations, or prosecution referrals.
2IRS’ Southeast Region includes the districts for Tennessee, Kentucky, Alabama, Florida, Georgia,Louisiana, Mississippi, North Carolina, South Carolina, Virginia, West Virginia, Indiana, Maryland, andDelaware. We included all but three of these districts in our analyses of the South. We excludedIndiana, Maryland and Delaware because they are generally not considered part of the South.
3As agreed with your offices, we did not test the effectiveness of IRS’ controls over audits, criminalinvestigations, and prosecution referrals.

B-280369
Page 2 GAO/GGD-99-19 Audit and Criminal Enforcement Rates
offices investigates alleged criminal tax violations and makes referrals toU.S. Attorneys for prosecution. IRS has four regional offices to overseethese and other activities in the field.
IRS officials identified several factors to explain variation across thecountry in audit, criminal investigation initiation, and prosecution referralrates for individual taxpayers. The main factor was that the rates for civiland criminal tax noncompliance vary geographically. That is, neither thetypes of taxpayers nor their tax behaviors are homogeneous acrossdistricts. IRS officials also identified other factors that might affectgeographic variation, such as the location of available audit and criminalinvestigation staff.
Because a variety of factors can affect the geographic variations in IRSaudit, criminal investigation initiation, and prosecution referral rates,comparisons of these rates must be interpreted with caution. Some factorsfall outside IRS’ direct control, such as the location of taxpayers’noncompliant behaviors. Other factors are more subject to IRS’ control,such as how many auditors and criminal investigators it assigns to alocation. We were not able to adjust for all such factors in comparingaudit, criminal investigation initiation, and prosecution referral ratesacross locations. Had we been able to make these adjustments, the resultsof our comparisons of rates across locations could have been different.
For the years 1992 through 1997 combined, the unadjusted audit rate forthe Tennessee-Kentucky district was below the national average rate, andthe South’s rate was approximately at the national average. The annualrates for the Tennessee-Kentucky district were approximately at or belowthe national average, and the South’s annual rate was approximately at thenational average.
The 6-year combined criminal investigation initiation and prosecutionreferral rates for the Tennessee-Kentucky district were below the nationalaverages, and the South’s rates were approximately at the nationalaverages. Although not every annual rate for the Tennessee-Kentuckydistrict or the South was at or below the national average, the ratesgenerally were.
IRS has established controls for its audits, criminal investigations, andprosecution referrals. These controls generally consist of standards toguide audit and investigation behavior, such as how auditors are to gatherand document evidence and how criminal investigators are to conduct
Results in Brief

B-280369
Page 3 GAO/GGD-99-19 Audit and Criminal Enforcement Rates
investigations of alleged criminal tax and nontax violations. The controlsalso include a series of reviews to check adherence to the standards.
We could not determine the extent to which IRS has used most of itscontrols over audits, criminal investigations, and prosecution referrals.Statistics on how often the controls were used are not maintained in anydatabase except for the reviews done at the close of audits to measureadherence to the audit standards. However, both Examination and CIDofficials said that they believe that the controls to initiate audits andcriminal investigations are always used.
IRS believes that taxpayers are more likely to voluntarily comply with thetax laws if they believe that their returns may be audited and unpaid taxesidentified. IRS audits 1 to 2 percent of the more than 100 million incometax returns filed annually by individuals to check for voluntary compliancein reporting income, deductions, and other tax issues as well as in payingthe correct tax liability. IRS relies on the taxpayer to providedocumentation about the issues being audited. In turn, IRS auditors are toexamine the documentation to determine the correct tax liability.
IRS does two types of face-to-face audits in its district offices to examineindividual taxpayers’ documentation: (1) field audits in which an IRSrevenue agent visits an individual who has business income or a verycomplex return and (2) office audits in which an individual who has a lesscomplex return visits a tax auditor at an IRS office. At IRS’ service centers,IRS uses correspondence audits in which tax examiners correspond withtaxpayers about potential discrepancies on their returns. Unlike thedistrict audits, these audits usually involve only one tax issue, such asdependent exemptions.
Regardless of the type of audit, IRS auditors must decide, when closing it,whether to recommend changes to the audited tax issues and to thereported tax. If an auditor recommends a tax change, the taxpayer has theright to agree with or appeal this tax change. Depending on the outcome ofany taxpayer appeal, the recommended additional taxes may or may not beassessed and collected.
CID carries out IRS’ criminal law enforcement responsibilities under threeprincipal statutes. Under title 26 U.S. Code, IRS has the authority toinvestigate alleged criminal tax violations, such as tax evasion and filing afalse tax return. Under title 18 U.S. Code, IRS has the authority toinvestigate a broad range of fraudulent activities, such as false claimsagainst the government and money laundering. Under title 31 U.S. Code,
Background

B-280369
Page 4 GAO/GGD-99-19 Audit and Criminal Enforcement Rates
IRS is responsible for enforcing certain recordkeeping and reportingrequirements of large currency transactions, such as cash bank deposits ofmore than $10,000. In fulfilling these responsibilities, CID coordinates asnecessary with IRS’ District Counsel, the Criminal Tax Division in DOJ,and the U.S. Attorney to prosecute violators of the statutes.
CID special agents4 are responsible for conducting investigations todetermine if criminal tax fraud or nontax financial crimes might haveoccurred. Investigations usually start on the basis of information providedby (1) IRS’ Examination or Collection Divisions, (2) CID projects, (3) thepublic and other government agencies, or (4) reports of currencytransactions. Investigators are to gather the evidence to determine if acriminal violation has occurred. In fiscal year 1997, CID initiated 5,335investigations and referred 3,817 investigations for prosecution.5
To identify factors that might explain differences in the audit, criminalinvestigation initiation, and prosecution referral rates for individualsacross the country, we interviewed Examination Division and CID officialsin IRS’ National Office to obtain explanations of the differences. We werenot able to adjust for all of the factors IRS identified when we analyzed theextent to which rates differed across locations.
To compare IRS’ unadjusted audit, criminal investigation initiation, andprosecution referral rates across locations during fiscal years 1992 through1997, we first defined the South as those states included in IRS’ Southeastregion, except for three states—Indiana, Maryland, and Delaware. Weexcluded these states on the basis of discussions with your offices andbecause these states generally are not considered to be part of the South.As a result, this report defines the South as 7 IRS districts that cover 11states—Alabama, Florida, Georgia, Kentucky, Louisiana, Mississippi, NorthCarolina, South Carolina, Tennessee, Virginia, and West Virginia. Weshifted IRS’ Indiana district to the Midstates region and the Maryland-Delaware district to the Northeast region. We made no other changes toIRS’ regional boundaries.6
4CID special agents are federal criminal investigators whose specialty is financial investigations. Theirtraining includes accounting and federal law enforcement procedures.
5Due to their lengths, investigations usually start in one year and end with any referrals in another year.
6If we had not shifted the three states from the Southeast region, our analyses would have resulted inslightly lower audit, investigation, and referral rates—between 1 percent and 5 percent lower—than wereport for the South.
Scope andMethodology

B-280369
Page 5 GAO/GGD-99-19 Audit and Criminal Enforcement Rates
We collected and analyzed data on IRS audit rates—the percentage ofindividual tax returns that IRS audited compared to the number of filers ofindividual tax returns. We computed audit rates for districts, servicecenters, and regions for each of the 6 years as well as an average rate forall 6 years. We then ranked (from highest to lowest) the rates for all 6years and for all locations. We also compared the annual audit rates in theTennessee-Kentucky district and the districts for the South with thenational average. Appendix I shows these annual audit rates by district,service center, and region.
We also collected and analyzed IRS data on criminal investigationinitiation and prosecution referral rates. We computed these rates bydividing the number of initiations and referrals by the number of filers. Forease of comparison, we computed the rates for every 100,000 filers in alocation. As with audit rates, we analyzed criminal investigation initiationand referral rates across locations through (1) rankings of the averagerates for all 6 years and (2) comparisons of the rate at a specific location ineach of the 6 years with the national average rate. Appendix II shows theinvestigation and referral rates by district and region.
We also analyzed the number of audits, criminal investigation initiations,and prosecution referrals by geographic location. Appendix III presentsthis analysis and its results, which were similar to those for our analysis ofrates.
The audit data used in our analyses came from IRS’ Audit InformationManagement System (AIMS) and our prior work on audit rates for somefiscal years.7 We used data from the Criminal Investigation ManagementInformation System (CIMIS) on criminal investigations and prosecutionreferrals for both tax and nontax issues. We did not test the reliability ofthe AIMS and CIMIS data, but we did talk to Examination and CID officialsabout their data and concluded that we could use the data for ouranalyses.
Because of TRAC’s study on alleged data discrepancies between CID andother agencies,8 we collected information and interviewed officials at theseagencies about the reasons for any discrepancies. We interviewed TRACofficials about the same issue. Rather than reconciling the data, our goal
7Tax Administration: Audit Trends and Results for Individual Taxpayers (GAO/GGD-96-91, April 26,1996).
8These other agencies include DOJ’s Criminal Tax Division, the Executive Office for U.S. Attorneys(EOUSA), and the Administrative Office of the U.S. Courts (AOUSC).

B-280369
Page 6 GAO/GGD-99-19 Audit and Criminal Enforcement Rates
was to determine whether we could use CID data on criminalinvestigations and prosecution referrals. We concluded that we could usethe data because TRAC’s reported discrepancies did not focus on theinitiation of criminal investigations and referrals for prosecution.
To identify IRS’ controls over audits, criminal investigations, andprosecution referrals, we interviewed Examination and CID officials in theNational Office. We collected and reviewed relevant IRS documents onaudit standards as well as criminal investigation and prosecution standardsand policies. To determine whether IRS used the controls, we soughtavailable documentation. We interviewed responsible IRS officials on theuse of the controls, and we reported data from our work9 on the use ofcertain audit controls.
We did our work at IRS’ National Office, DOJ’s Criminal Tax Division,EOUSA, and AOUSC in Washington, D.C., between May and September1998 in accordance with generally accepted government auditingstandards. We requested comments from the Commissioner of InternalRevenue on a draft of this report, and these comments are discussed at theend of the report.
IRS officials said that variation across the country in the audit, criminalinvestigation initiation, and prosecution referral rates for individualtaxpayers should be expected due to several factors. The main factor isthat the rates for civil and criminal tax noncompliance vary geographically.Because the types of taxpayers are not homogeneous from district todistrict, the noncompliant behaviors of some are not uniformly distributedin each district.
In linking this geographic variation in noncompliance with audit rates,Examination officials also pointed out that audit rates vary with how manyauditors are allocated to specific locations. The officials stated thatallocation of auditors is based primarily on statistically valid research data,which shows that some locations have more filed returns with a higherpotential for noncompliance than other locations. IRS said it considers thisfact when determining how many auditors to assign to a location.
Beyond the number of auditors, IRS Examination officials said that theaudit rates can vary across locations on the basis of how the auditors are 9Tax Administration: More Criteria Needed on IRS’ Use of Financial Status Audit Techniques(GAO/GGD-98-38, Dec. 30, 1997); Tax Administration: IRS’ Use of Information Gathering Projects(GAO/GGD-98-39, Feb. 5, 1998); and IRS Audits: Workpapers Lack Documentation of SupervisoryReview (GAO/GGD-98-98, Apr. 15, 1998).
IRS ExpectsVariations inEnforcement RatesAcross the Country

B-280369
Page 7 GAO/GGD-99-19 Audit and Criminal Enforcement Rates
used. For example, more auditors might be available to do audits when anIRS location uses fewer auditors for nonaudit efforts, such as taxpayereducation and outreach to improve compliance. These officials explainedthat because the need for such services can vary across IRS locations, theassignment of some auditors to nonaudit efforts also will vary.
IRS Examination officials also identified several other factors that mightaffect geographic variations in audit rates. According to the officials,variability in the audit rates can be attributed to the use of projects thatfocus on known compliance issues in specific locations.10 The officials saidthat audit rates might be higher if a location has more tax returns fromcertain types of taxpayers who have proven to be more noncompliant,such as certain self-employed taxpayers operating cash businesses.Further, some variation from year to year could be expected depending onthe changing number of returns that are filed by taxpayers at specificlocations.
CID officials also pointed to these factors. In addition, they attributedvariability in the criminal investigation and prosecution referral rates to arecent shift towards investigating certain types of tax fraud and narcoticcrimes and identifying major types of new tax fraud issues. Moreover, theysaid that investigations are resource intensive. If many investigationshappen to take more time than usual, the start of new investigations wouldbe delayed. If investigations take longer in certain locations compared toothers, differences in the investigation rates would arise, which also couldaffect future referral rates.
Finally, CID officials said some variability in rates might be due to difficult-to-quantify factors, such as differences in the experience and skill of theinvestigators. More skilled investigators may be assigned more complexand time-intensive investigations. On the other hand, their skills mightallow them to do investigations more quickly. Further, the officials statedthat some variation could be expected depending on the number andlocation of assistant U.S. Attorneys and judges in the judicial system.
Because many factors affect geographic variations in the audit, criminalinvestigation initiation, and prosecution referral rates, comparisons ofthese rates must be interpreted with caution. Some factors fall outside IRS’direct control. For example, IRS does not control whether taxpayers
10IRS staff can propose audit projects on the basis of past audits or studies that have shownnoncompliance for selected taxpayer populations, such as those in a particular occupation, industry,geographic area, or economic activity.

B-280369
Page 8 GAO/GGD-99-19 Audit and Criminal Enforcement Rates
engage in civil and criminal tax noncompliance at higher rates in somelocations than in others. Nor does IRS control the actions of outsideparties that influence the initiation of many investigations, such as thoseinvolving grand juries.11 Other factors are more subject to IRS’ control,such as how many auditors or investigators it assigns to a location.
We were not able to adjust for all such factors in comparing audit, criminalinvestigation initiation, and prosecution referral rates across locations.Had we been able to make these adjustments, the results of our ratecomparisons could have been different.
Without adjusting for external factors that can affect the geographicvariation of IRS audit rates, we found that IRS did not appear to haveaudited individual taxpayers at a higher rate in the Tennessee-Kentuckydistrict and the South compared to the national average during fiscal years1992 through 1997.
For all 6 years, the Tennessee-Kentucky district’s audit rate averaged 0.52percent, which was below the national average, and ranked 21st of 33districts. The Memphis Service Center ranked 9th in the audit rate among10 service centers. The South’s audit rate averaged 0.65 percent, placing itclose to the national average of 0.67 percent and second among the fourregions. However, the average rate for the South was similar to the ratesranked third and fourth, which averaged 0.63 and 0.46 percent,respectively.
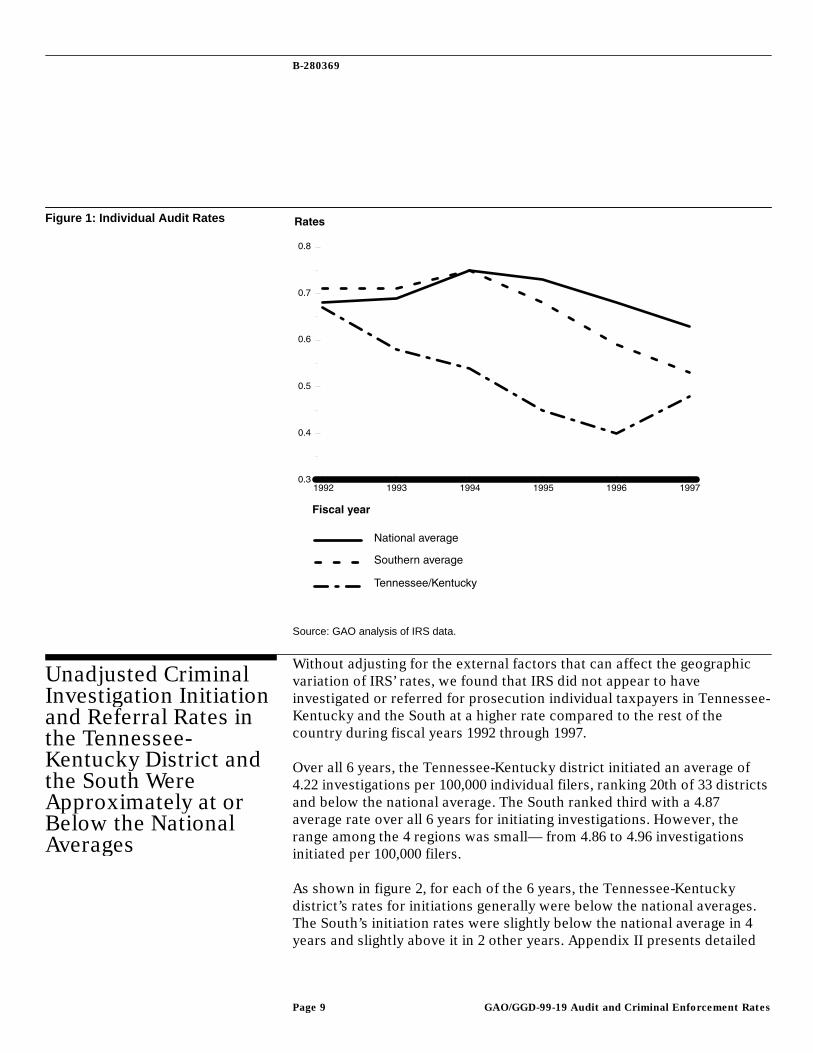
On an annual basis, audit rates in the Tennessee-Kentucky district and theSouth were generally at or below the national average. The Tennessee-Kentucky district rates almost always fell below the national averages eachfiscal year, 1992 through 1997. Annual audit rates in the South were morelikely to be below than above the national averages. Figure 1 shows thetrends in these rates for the Tennessee-Kentucky district, the South, andthe national average over the 1992 through 1997 period. Appendix Ipresents detailed information on audit rates by location for 1992 through1997.
11CID officials stated that grand jury investigations account for 66 percent of the criminal casesinitiated by CID.
Unadjusted AuditRates in the Tennessee-Kentucky District andthe South WereGenerally at or Belowthe National Averages
B-280369
Page 9 GAO/GGD-99-19 Audit and Criminal Enforcement Rates
Source: GAO analysis of IRS data.
Without adjusting for the external factors that can affect the geographicvariation of IRS’ rates, we found that IRS did not appear to haveinvestigated or referred for prosecution individual taxpayers in Tennessee-Kentucky and the South at a higher rate compared to the rest of thecountry during fiscal years 1992 through 1997.
Over all 6 years, the Tennessee-Kentucky district initiated an average of4.22 investigations per 100,000 individual filers, ranking 20th of 33 districtsand below the national average. The South ranked third with a 4.87average rate over all 6 years for initiating investigations. However, therange among the 4 regions was small— from 4.86 to 4.96 investigationsinitiated per 100,000 filers.
As shown in figure 2, for each of the 6 years, the Tennessee-Kentuckydistrict’s rates for initiations generally were below the national averages.The South’s initiation rates were slightly below the national average in 4years and slightly above it in 2 other years. Appendix II presents detailed
Figure 1: Individual Audit Rates
Unadjusted CriminalInvestigation Initiationand Referral Rates inthe Tennessee-Kentucky District andthe South WereApproximately at orBelow the NationalAverages

B-280369
Page 10 GAO/GGD-99-19 Audit and Criminal Enforcement Rates
information on the investigations initiated and prosecutions referred per100,000 individual filers by location for 1992 through 1997.
Source: GAO analysis of IRS data.
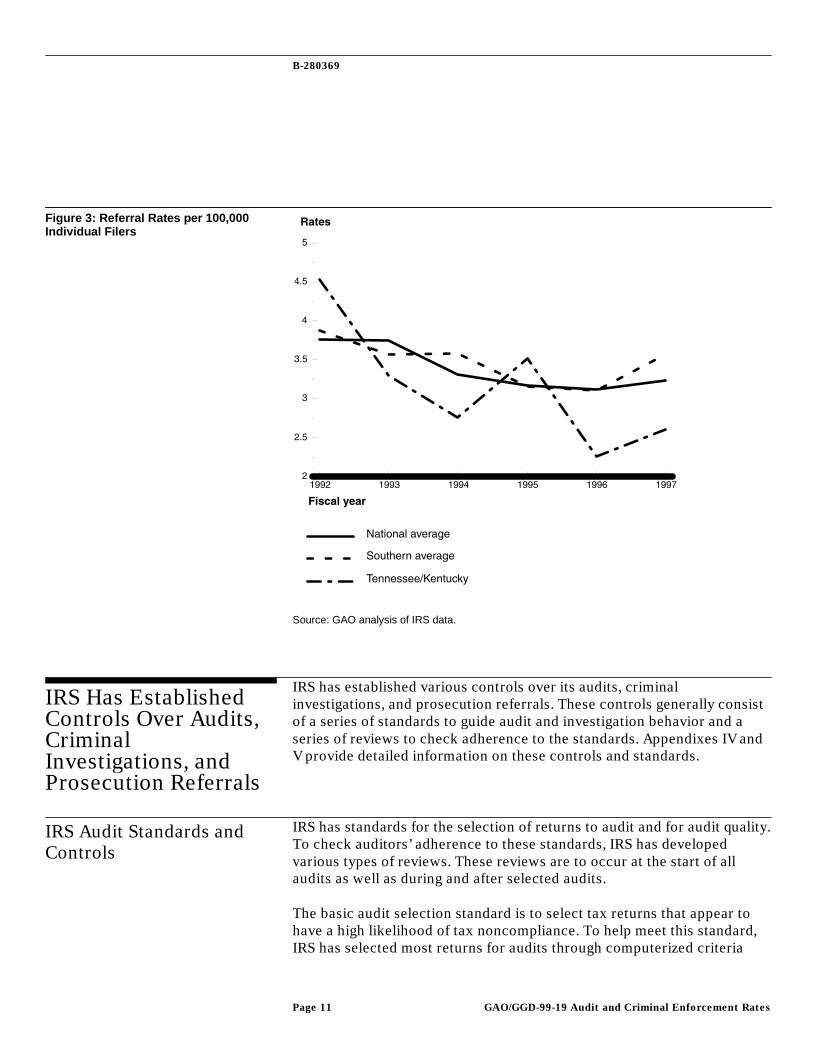
In terms of prosecution referral rates, the Tennessee-Kentucky districtranked 16th and below the national average—with an average of 3.15referrals per 100,000 individual filers for all 6 years. The South ranked firstin these rates. However, the differences among the four regions were smallover the period. The South’s 6-year average rate was 3.48 per 100,000individual filers compared to 3.46, 3.40, and 3.19 in the other 3 regions.
Figure 3 shows that except for 1992 and 1995, the Tennessee-Kentuckydistrict fell below the annual national averages in referrals per 100,000individual filers. The South’s referral rates were below the national averagein 3 years and above it in 3 other years.
Figure 2: Criminal InvestigationInitiation Rates per 100,000 IndividualFilers
B-280369
Page 11 GAO/GGD-99-19 Audit and Criminal Enforcement Rates
Source: GAO analysis of IRS data.
IRS has established various controls over its audits, criminalinvestigations, and prosecution referrals. These controls generally consistof a series of standards to guide audit and investigation behavior and aseries of reviews to check adherence to the standards. Appendixes IV andV provide detailed information on these controls and standards.
IRS has standards for the selection of returns to audit and for audit quality.To check auditors’ adherence to these standards, IRS has developedvarious types of reviews. These reviews are to occur at the start of allaudits as well as during and after selected audits.
The basic audit selection standard is to select tax returns that appear tohave a high likelihood of tax noncompliance. To help meet this standard,IRS has selected most returns for audits through computerized criteria
Figure 3: Referral Rates per 100,000Individual Filers
IRS Has EstablishedControls Over Audits,CriminalInvestigations, andProsecution Referrals
IRS Audit Standards andControls
B-280369
Page 12 GAO/GGD-99-19 Audit and Criminal Enforcement Rates
designed to identify potential noncompliance. IRS also has selectedreturns for audit through many other sources, such as through projectsthat focus on known compliance issues within a specific location or aselect group of taxpayers. Regardless of how the returns are selected, IRSgenerally requires various levels of IRS managers and staff to check,among other things, for adherence to the audit selection standard. For theaudit projects, IRS districts also require authorization by a district directoror higher level management official before audits can begin.
To guide auditors’ behaviors during audits, IRS has established qualitystandards in such areas as developing evidence, considering the potentialfor fraud, and documenting audit results. IRS audit supervisors are toperiodically review audits to determine conformity with the standards. IRSsupervisors also are to separately review whether auditors are handlingtaxpayer inquiries and issues responsively.
After an audit, IRS district office employees and service center employeesare to review a sample of audits closed in their offices. IRS Examinationofficials said that they believe the sample is statistically valid. IRSemployees conduct these post-audit reviews to measure the quality of theaudits against the standards.12
IRS did not have statistics available in a database on how often it usesaudit controls through managerial and supervisory reviews at the start ofaudits and during audits. In prior reports,13 we found evidence thatsupervisors reviewed about 6 percent of the workpapers during certaintypes of audits that closed during fiscal years 1995 and 1996. In noting thatIRS did not require supervisors to document these reviews during audits,we recommended that IRS establish such a requirement, which IRS agreedto do.
IRS did have automated statistics on its use of post-audit reviews. Thesestatistics showed that Examination staff in the districts reviewedadherence to quality standards in 12,170 of about 800,000 audits closed bydistrict auditors during fiscal year 1996. 14 Our analysis did not evaluate 12The audit quality measure is also to become part of the quality measurement across IRS. According toIRS officials, implementation of IRS’ new measures on customer satisfaction, employee satisfaction,quantity, and quality for various IRS activities is scheduled for January 1999.
13GAO/GGD-98-38 and GAO/GGD-98-98.
14In December 1998, IRS Examination officials said that the fiscal year 1998 sample size for post-auditreviews in the district offices was approximately 11,900. These officials said that in fiscal year 1999,this sample size will be increased to about 46,900 in order to provide greater statistical validity andaccountability at the managerial level in the district offices.

B-280369
Page 13 GAO/GGD-99-19 Audit and Criminal Enforcement Rates
IRS’ sample selection or quality review processes, or whether IRS used theresults of the reviews to improve quality.
Apart from these post-audit reviews, IRS Examination officials said thatthey do periodic operational and peer reviews. According to the officials,the reviews are intended to oversee the use of the controls as well as theentire audit process.
We are currently studying some of these audit selection controls at districtoffices and audit quality controls at service centers, and we expect toreport results in 1999.
IRS has established standards governing the criminal investigation andprosecution referral processes. CID also relies on multiple levels of reviewand approval to check adherence to the standards. If IRS refers a case forprosecution, outside offices are to review, in succession, whetherprosecution was justified.
A major standard for initiating a criminal tax investigation involvesprosecution potential. As a control for this standard, IRS requires the CIDchief to approve investigations. During an investigation, the CID specialagent is to gather evidence on whether a criminal violation of tax ornontax issues occurred and, if so, whether prosecution is justified. Tocheck adherence to this and other evidence standards, CID managers areto periodically review the agent’s work and evidence. The investigation isto continue until (1) during the course of gathering information theinvestigator determines a criminal case is not warranted; (2) sufficientevidence has been collected to justify a referral for successful prosecution;or (3) limited resources, cases with higher potential, or othercircumstances warrant discontinuation.
If a special agent determines that the evidence pointed to criminalviolations, the agent is to write a detailed report on violations that meritprosecution. The report is to be reviewed by the group manager, branchchief, and division chief to check the adequacy of the investigation,sufficiency of evidence, and conformance to legal requirements forprosecution.
If the division chief approves, the prosecution referral is to move to thenext levels of review—IRS District Counsel, DOJ’s Criminal Tax Division,and the U.S. Attorney. The ultimate responsibility for criminalprosecutions lies with the U.S. Attorney. The U.S. Attorney is to considertwo standards in deciding whether to prosecute:
CID Standards and Controlsfor the CriminalInvestigation and ReferralProcesses

B-280369
Page 14 GAO/GGD-99-19 Audit and Criminal Enforcement Rates
(1) sufficient evidence to establish guilt beyond a reasonable doubt, and(2) reasonable probability of conviction.
CID did not have automated statistics on how often it used its controlsover the investigation and referral processes. However, CID officials saidthat they believe that the controls to initiate and refer criminalinvestigations are always used. For example, CID officials stated thatduring fiscal years 1992 through 1997, 66 percent of the investigationsinitiated were grand jury investigations, which are opened only with theapproval and control of DOJ. Further, the officials said that DOJ and theU.S. Attorney accept most of the referrals for prosecution, which cannotbe done without the Chief of CID and the District Counsel’s approval of thereferral.
In addition, CID officials said that they do quarterly and biannual reviewsas well as peer reviews of their operations. The officials said that thesereviews are intended to address such things as workload, documentation,and the selection and management of investigations.
We requested comments on a draft of this report from the Commissionerof Internal Revenue. Officials representing the Assistant Commissionersfor the Examination Division and Criminal Investigation Division, as wellas a representative from the Commissioner’s Office of Legislative Affairs,provided IRS’ comments in a December 3, 1998, meeting. IRS also providedwritten comments, which are reprinted in appendix VI.
IRS’ comments were technical in nature to clarify specific sections of thedraft report that described (1) frequency of the use of controls over audits,criminal investigations, and referrals; (2) peer review and other periodicoperational reviews; and (3) differences between the Examination andCriminal Investigation Divisions, including those factors that aresomewhat outside their control but can affect audit, investigationinitiation, and referral rates. We have incorporated these comments intothe report where appropriate.
Copies of this report are being sent to the Chairman and the RankingMinority Member, Senate Committee on Finance; the Chairman and theRanking Minority Member, Senate Committee on Governmental Affairs;and the Chairman and the Ranking Minority member, House Committee onWays and Means. We will also send copies to the Director of the Office ofManagement and Budget; the Secretary of the Treasury; the Commissionerof the Internal Revenue Service; and officials at the Department of Justice,
Agency Comments andOur Evaluation

B-280369
Page 15 GAO/GGD-99-19 Audit and Criminal Enforcement Rates
Executive Office for U.S. Attorneys, and Administrative Office of the U.S.Courts. We will also make copies available to others upon request.
Major contributors to this report are listed in appendix VII. Please contactme on (202) 512-9110 if you or your staff have any questions about thisreport.
James R. WhiteDirector, Tax Policy and
Administration Issues

Page 16
Contents
1Letter
20Appendix IIRS’ Individual AuditRates for Districts,Regions, and ServiceCenters, Fiscal Years1992 Through 1997
22Appendix IIIRS’ CriminalInvestigation Initiationand ProsecutionReferral Rates forDistricts and Regions,Fiscal Years 1992Through 1997
25Appendix IIITotal Number of IRSAudits, CriminalInvestigationInitiations, andProsecution Referralsfor Fiscal Years 1992-1997
30Appendix IVAudit, CriminalInvestigation, andProsecution Standards
Audit Standards 30

Contents
Page 17
Criminal Investigation and Prosecution Standards 30
32Controls Over the Audit Process 32Controls Over the Criminal Investigation and Referral
Processes33
Appendix VIRS’ Controls forAudit, CriminalInvestigation, andProsecution ReferralProcesses
36Appendix VIComments From theInternal RevenueService
38Appendix VIIMajor Contributors toThis Report
Table I.1: Individual Audit Rates by District and Ranked,FYs 1992 Through 1997
20
Table I.2: Individual Audit Rates by Region and Ranked,FYs 1992 Through 1997
21
Table I.3: Individual Audit Rates by Service Center andRanked, FYs 1992 Through 1997
21
Table II.1: Criminal Investigation Initiation Rates per100,000 Individual Filers by District and Ranked, FYs1992 Through 1997
22
Table II.2: Criminal Investigation Initiation Rates per100,000 Individual Filers by Region and Ranked, FYs1992 Through 1997
23
Table II.3: Criminal Investigation Prosecution ReferralRates per 100,000 Individual Filers by District andRanked, FYs 1992 Through 1997
23
Table II.4: Criminal Investigation Prosecution ReferralRates per 100,000 Individual Filers by Region andRanked, FYs 1992 Through 1997
24
Tables
Table III.1: Total Number of Audits by District andRanked, FYs 1992 Through 1997
25
Contents
Page 18
Table III.2: Total Number of Audits by Region andRanked, FYs 1992 Through 1997
26
Table III.3: Total Number of Audits by Service Centerand Ranked, FYs 1992 Through 1997
26
Table III.4: Total Number of Criminal InvestigationsInitiated by District and Ranked, FYs 1992 Through1997
27
Table III.5: Total Number of Criminal InvestigationsInitiated by Region and Ranked, FYs 1992 Through1997
28
Table III.6: Total Number of Criminal InvestigationsReferred for Prosecution by District and Ranked, FYs1992 Through 1997
28
Table III.7: Total Number of Criminal InvestigationsReferred for Prosecution by Region and Ranked, FYs1992 Through 1997
29
Table IV.1: Description of IRS’ Audit Standards 30Table IV.2: Criminal Investigation Standards for Fraud
Cases31
Figure 1: Individual Audit Rates 9Figure 2: Criminal Investigation Initiation Rates per
100,000 Individual Filers10
Figure 3: Referral Rates per 100,000 Individual Filers 11
Figures

Contents
Page 19
Abbreviations
AIMS Audit Information Management System
AOUSC Administrative Office of the United States Courts
CIMIS Criminal Investigation Management Information System
DOJ Department of Justice
EOUSA Executive Office for United States Attorneys
IRS Internal Revenue Service
TRAC Transactional Records Access Clearinghouse

Appendix I
IRS’ Individual Audit Rates for Districts,Regions, and Service Centers, Fiscal Years1992 Through 1997
Page 20 GAO/GGD-99-19 Audit and Criminal Enforcement Rates
Audit rates
District 1992 1993 1994 1995 1996 1997FYs 92-97
Average RankLos Angeles 1.37 1.39 1.32 1.34 1.59 1.54 1.43 1Southern California 1.10 1.28 1.15 1.57 1.62 1.34 1.34 2Northern California 1.04 1.16 1.15 1.17 1.24 1.34 1.18 3Southwest 1.00 1.01 1.23 0.98 0.80 0.81 0.97 4Georgia 0.92 1.07 1.11 1.13 0.78 0.64 0.94 5Central California 0.93 0.86 0.74 0.92 1.17 0.91 0.92 6North Texas 0.80 0.82 0.90 1.03 0.96 0.82 0.89 7Arkansas-Oklahoma 0.95 0.96 1.01 0.85 0.72 0.63 0.85 8Gulf Coast 0.88 0.80 0.90 0.89 0.83 0.74 0.84 9Manhattan 0.78 0.62 0.77 1.07 0.75 0.77 0.79 10Rocky Mountain 0.79 0.80 0.87 0.86 0.73 0.67 0.78 11South Florida 0.84 0.83 0.87 0.68 0.71 0.68 0.77 12Houston 0.75 0.81 0.86 0.79 0.76 0.64 0.76 13Connecticut-RhodeIsland 0.69 0.69 0.82 0.83 0.60 0.45 0.68 14North Central 0.58 0.58 0.83 0.61 0.68 0.76 0.67 15National average 0.66 0.66 0.72 0.70 0.66 0.61 0.67Pacific-Northwest 0.71 0.69 0.73 0.68 0.63 0.51 0.66 16South Texas 0.67 0.71 0.72 0.73 0.55 0.50 0.64 17North Florida 0.69 0.67 0.70 0.57 0.52 0.45 0.60 18Kansas-Missouri 0.46 0.71 0.77 0.55 0.51 0.45 0.57 19Indiana 0.53 0.51 0.63 0.61 0.51 0.43 0.54 20Tennessee-Kentucky 0.67 0.58 0.54 0.45 0.40 0.48 0.52 21Brooklyn 0.48 0.42 0.47 0.59 0.58 0.56 0.52 22Illinois 0.39 0.39 0.69 0.51 0.47 0.53 0.50 23North-South Carolina 0.50 0.53 0.55 0.56 0.48 0.34 0.49 24Delaware-Maryland 0.47 0.42 0.50 0.47 0.53 0.53 0.49 25New England 0.48 0.46 0.57 0.53 0.46 0.37 0.48 26Virginia-West Virginia 0.49 0.47 0.60 0.46 0.39 0.39 0.46 27Midwest 0.34 0.35 0.48 0.49 0.53 0.52 0.45 28Michigan 0.45 0.40 0.54 0.47 0.44 0.36 0.44 29Upstate New York 0.44 0.46 0.48 0.43 0.36 0.37 0.42 30New Jersey 0.39 0.42 0.39 0.39 0.42 0.39 0.40 31Pennsylvania 0.36 0.37 0.44 0.40 0.36 0.41 0.39 32Ohio 0.49 0.38 0.34 0.33 0.34 0.32 0.37 33
Source: GAO analysis of IRS data.
Table I.1: Individual Audit Rates by District and Ranked, FYs 1992 Through 1997

Appendix I
IRS’ Individual Audit Rates for Districts, Regions, and Service Centers, Fiscal Years 1992
Through 1997
Page 21 GAO/GGD-99-19 Audit and Criminal Enforcement Rates
Audit rates
Region 1992 1993 1994 1995 1996 1997FYs 92-97
Average RankWestern 0.99 1.02 1.02 1.07 1.09 0.99 1.03 1National average 0.66 0.66 0.72 0.70 0.66 0.61 0.67South 0.70 0.69 0.74 0.67 0.58 0.52 0.65 2Midstates 0.56 0.60 0.74 0.66 0.61 0.58 0.63 3Northeast 0.48 0.44 0.50 0.50 0.45 0.42 0.46 4
Source: GAO analysis of IRS data.
Audit rates
Service center 1992 1993 1994 1995 1996 1997FY 92-97Average Rank
Fresno 0.92 0.36 1.08 3.48 3.15 2.01 1.81 1Brookhaven 0.47 0.39 0.40 1.34 1.18 1.04 0.80 2Austin 0.31 0.44 0.46 0.88 1.25 0.45 0.64 3National average 0.40 0.26 0.37 0.98 1.02 0.68 0.62Ogden 0.33 0.20 0.25 0.78 0.86 0.74 0.53 4Philadelphia 0.26 0.15 0.28 1.01 0.83 0.45 0.49 5Atlanta 0.48 0.24 0.33 0.61 0.80 0.41 0.48 6Andover 0.33 0.26 0.29 0.55 0.58 0.63 0.44 7Kansas City 0.32 0.21 0.20 0.61 0.68 0.41 0.40 8Memphis 0.32 0.22 0.17 0.41 0.60 0.47 0.37 9Cincinnati 0.31 0.23 0.24 0.42 0.42 0.43 0.34 10
Source: GAO analysis of IRS data.
Table I.2: Individual Audit Rates by Region and Ranked, FYs 1992 Through 1997
Table I.3: Individual Audit Rates by Service Center and Ranked, FYs 1992 Through 1997

Appendix II
IRS’ Criminal Investigation Initiation andProsecution Referral Rates for Districts andRegions, Fiscal Years 1992 Through 1997
Page 22 GAO/GGD-99-19 Audit and Criminal Enforcement Rates
Initiation rates per 100,000 Individual filers
District 1992 1993 1994 1995 1996 1997FYs 92-97
Average RankManhattan 12.22 17.44 17.12 11.23 12.75 9.89 13.44 1South Texas 10.47 8.43 10.26 5.40 8.04 9.02 8.57 2South Florida 7.32 7.75 8.39 7.34 8.54 7.76 7.86 3North Texas 11.10 6.98 6.68 5.65 5.64 5.97 6.98 4Arkansas-Oklahoma 7.44 8.23 6.73 5.12 7.51 6.45 6.91 5Brooklyn 7.45 7.72 5.92 5.67 6.42 6.66 6.64 6Houston 7.60 7.29 5.38 6.39 6.50 6.11 6.53 7Southwest 6.73 6.72 5.31 4.98 6.05 6.97 6.13 8Rocky Mountain 8.00 5.98 5.82 5.61 6.18 5.13 6.09 9Virginia-West Virginia 7.35 5.75 5.93 4.07 4.26 7.15 5.75 10Delaware-Maryland 6.09 6.10 4.35 5.36 4.61 6.61 5.52 11Georgia 6.80 5.54 5.54 4.86 3.87 3.96 5.06 12Northern California 5.64 4.66 4.66 3.72 6.49 4.44 4.94 13New Jersey 4.81 5.15 5.66 5.37 3.81 4.66 4.91 14National average 5.78 5.39 4.73 4.39 4.61 4.53 4.90North Florida 6.48 6.16 3.52 3.79 4.17 4.78 4.81 15Pacific-Northwest 5.19 5.46 4.60 5.47 4.59 3.46 4.78 16Connecticut-Rhode Island 5.48 5.00 5.17 2.90 5.15 4.56 4.72 17Los Angeles 6.84 4.44 4.70 4.43 3.63 3.22 4.58 18Pennsylvania 4.86 5.10 4.48 5.19 3.51 3.63 4.46 19Tennessee-Kentucky 5.36 4.67 3.54 4.34 3.65 3.76 4.22 20Illinois 5.43 4.29 2.97 3.73 4.35 4.49 4.21 21Michigan 5.71 5.10 4.59 2.41 4.08 2.57 4.08 22Indiana 4.13 6.67 3.85 3.37 3.19 3.24 4.06 23Kansas-Missouri 3.81 4.55 4.43 4.07 3.20 4.04 4.02 24Southern California 3.64 4.74 3.21 4.73 3.63 4.13 4.01 25Ohio 5.80 4.62 3.61 3.35 3.12 2.97 3.91 26Gulf Coast 5.47 4.03 2.65 3.56 4.27 3.35 3.89 27North-South Carolina 4.61 4.41 3.49 3.29 3.54 3.48 3.79 28Upstate New York 3.54 3.27 3.77 3.23 3.60 3.12 3.42 29Central California 4.01 3.62 3.25 2,26 3.07 4.19 3.40 30North Central 3.16 3.08 3.49 3.19 3.72 3.42 3.34 31New England 3.25 4.21 2.94 2.66 3.83 3.06 3.33 32Midwest 3.43 2.44 2.53 3.36 2.64 2.34 2.79 33
Source: GAO analysis of IRS data.
Table II.1: Criminal Investigation Initiation Rates per 100,000 Individual Filers by District and Ranked, FYs 1992 Through 199 7
Appendix II
IRS’ Criminal Investigation Initiation and Prosecution Referral Rates for Districts and
Regions, Fiscal Years 1992 Through 1997
Page 23 GAO/GGD-99-19 Audit and Criminal Enforcement Rates
Initiation rates
Region 1992 1993 1994 1995 1996 1997FYs 92-97
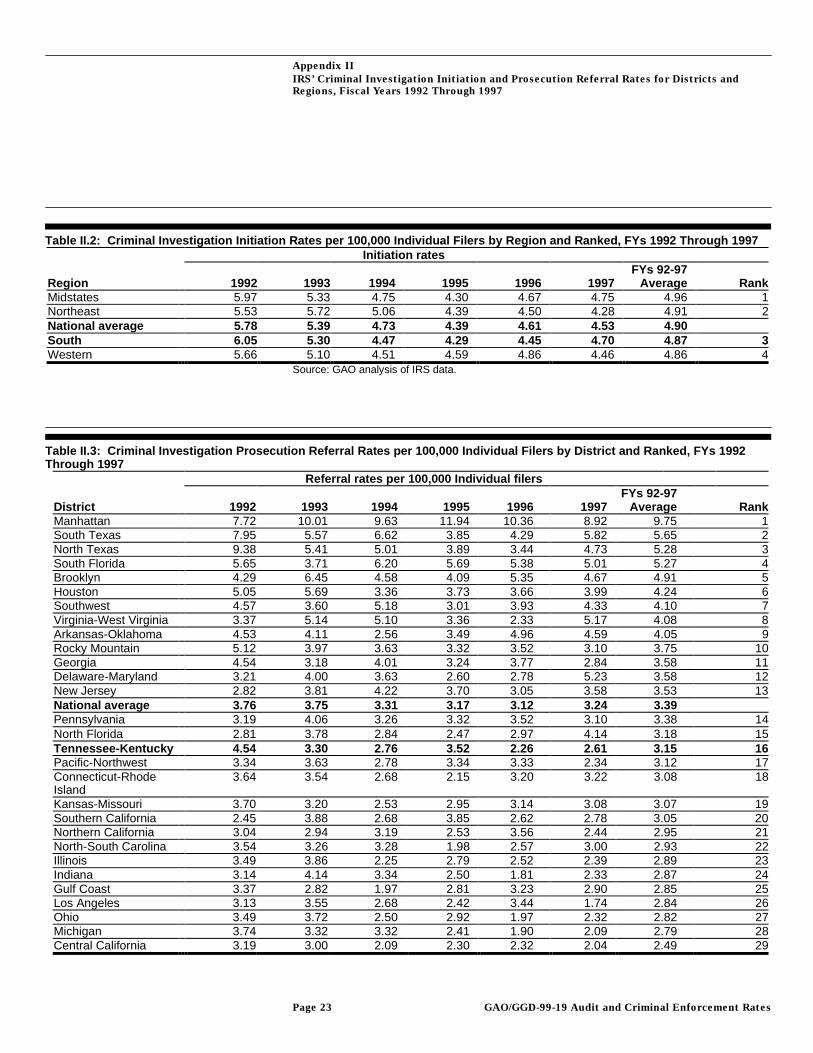
Average RankMidstates 5.97 5.33 4.75 4.30 4.67 4.75 4.96 1Northeast 5.53 5.72 5.06 4.39 4.50 4.28 4.91 2National average 5.78 5.39 4.73 4.39 4.61 4.53 4.90South 6.05 5.30 4.47 4.29 4.45 4.70 4.87 3Western 5.66 5.10 4.51 4.59 4.86 4.46 4.86 4
Source: GAO analysis of IRS data.
Referral rates per 100,000 Individual filers
District 1992 1993 1994 1995 1996 1997FYs 92-97
Average RankManhattan 7.72 10.01 9.63 11.94 10.36 8.92 9.75 1South Texas 7.95 5.57 6.62 3.85 4.29 5.82 5.65 2North Texas 9.38 5.41 5.01 3.89 3.44 4.73 5.28 3South Florida 5.65 3.71 6.20 5.69 5.38 5.01 5.27 4Brooklyn 4.29 6.45 4.58 4.09 5.35 4.67 4.91 5Houston 5.05 5.69 3.36 3.73 3.66 3.99 4.24 6Southwest 4.57 3.60 5.18 3.01 3.93 4.33 4.10 7Virginia-West Virginia 3.37 5.14 5.10 3.36 2.33 5.17 4.08 8Arkansas-Oklahoma 4.53 4.11 2.56 3.49 4.96 4.59 4.05 9Rocky Mountain 5.12 3.97 3.63 3.32 3.52 3.10 3.75 10Georgia 4.54 3.18 4.01 3.24 3.77 2.84 3.58 11Delaware-Maryland 3.21 4.00 3.63 2.60 2.78 5.23 3.58 12New Jersey 2.82 3.81 4.22 3.70 3.05 3.58 3.53 13National average 3.76 3.75 3.31 3.17 3.12 3.24 3.39Pennsylvania 3.19 4.06 3.26 3.32 3.52 3.10 3.38 14North Florida 2.81 3.78 2.84 2.47 2.97 4.14 3.18 15Tennessee-Kentucky 4.54 3.30 2.76 3.52 2.26 2.61 3.15 16Pacific-Northwest 3.34 3.63 2.78 3.34 3.33 2.34 3.12 17Connecticut-RhodeIsland
3.64 3.54 2.68 2.15 3.20 3.22 3.08 18
Kansas-Missouri 3.70 3.20 2.53 2.95 3.14 3.08 3.07 19Southern California 2.45 3.88 2.68 3.85 2.62 2.78 3.05 20Northern California 3.04 2.94 3.19 2.53 3.56 2.44 2.95 21North-South Carolina 3.54 3.26 3.28 1.98 2.57 3.00 2.93 22Illinois 3.49 3.86 2.25 2.79 2.52 2.39 2.89 23Indiana 3.14 4.14 3.34 2.50 1.81 2.33 2.87 24Gulf Coast 3.37 2.82 1.97 2.81 3.23 2.90 2.85 25Los Angeles 3.13 3.55 2.68 2.42 3.44 1.74 2.84 26Ohio 3.49 3.72 2.50 2.92 1.97 2.32 2.82 27Michigan 3.74 3.32 3.32 2.41 1.90 2.09 2.79 28Central California 3.19 3.00 2.09 2.30 2.32 2.04 2.49 29
Table II.2: Criminal Investigation Initiation Rates per 100,000 Individual Filers by Region and Ranked, FYs 1992 Through 1997
Table II.3: Criminal Investigation Prosecution Referral Rates per 100,000 Individual Filers by District and Ranked, FYs 1992Through 1997

Appendix II
IRS’ Criminal Investigation Initiation and Prosecution Referral Rates for Districts and
Regions, Fiscal Years 1992 Through 1997
Page 24 GAO/GGD-99-19 Audit and Criminal Enforcement Rates
Referral rates per 100,000 Individual filers
District 1992 1993 1994 1995 1996 1997FYs 92-97
Average RankUpstate New York 2.30 1.86 2.26 2.17 3.14 2.30 2.34 30New England 1.91 2.01 1.63 2.23 2.27 2.59 2.11 31Midwest 2.21 2.19 1.69 2.77 1.63 1.64 2.02 32North Central 1.92 2.20 2.01 1.65 1.62 2.60 2.00 33
Source: GAO analysis of IRS data.
Referral Rates per 100,000 Individual filers
Region 1992 1993 1994 1995 1996 1997FYs 92-97
Average RankSouth 3.88 3.57 3.58 3.16 3.11 3.57 3.48 1Northeast 3.39 3.95 3.42 3.40 3.26 3.37 3.46 2Midstates 4.38 3.84 3.07 3.02 2.85 3.25 3.40 3National average 3.76 3.75 3.31 3.17 3.12 3.24 3.39Western 3.48 3.53 3.15 3.03 3.26 2.69 3.19 4
Source: GAO analysis of IRS data.
Table II.4: Criminal Investigation Prosecution Referral Rates per 100,000 Individual Filers by Region and Ranked, FYs 1992Through 1997

Appendix III
Total Number of IRS Audits, CriminalInvestigation Initiations, and ProsecutionReferrals for Fiscal Years 1992-1997
Page 25 GAO/GGD-99-19 Audit and Criminal Enforcement Rates
Tables III.1 to III.3 show how the Tennessee-Kentucky district, MemphisService Center, and the South ranked in total number of audits closedduring fiscal years 1992 through 1997. During this period, IRS’ Tennessee-Kentucky District audited 118,545 individual returns. The district ranked18th of 33 districts and averaged about 20,000 audits annually. TheMemphis Service Center ranked 10th among the 10 service centers,averaging about 40,000 audits annually over the 6 years. The South ranked3rd among 4 regions, averaging about 168,000 audits annually over the 6years.
Returns auditedDistrict 1992 1993 1994 1995 1996 1997 Total RankSouthern California 44,432 52,306 45,755 62,034 63,962 53,991 322,480 1Los Angeles 46,970 47,069 43,439 42,551 49,590 48,877 278,496 2Northern California 37,241 41,670 40,586 41,152 43,880 48,363 252,892 3Gulf Coast 38,511 35,557 39,943 40,386 37,961 34,547 226,905 4Pacific-Northwest 31,543 31,806 33,738 31,899 29,693 24,500 183,179 5Southwest 28,773 29,728 36,549 30,261 25,773 26,888 177,972 6North Texas 25,072 26,113 28,510 33,437 31,397 27,625 172,154 7Georgia 26,253 31,156 32,773 34,230 24,328 20,575 169,315 8Rocky Mountain 25,537 26,523 29,529 29,915 26,386 24,717 162,907 9Illinois 20,952 20,807 36,385 27,314 25,345 28,719 159,522 10Central California 23,961 22,224 19,130 23,659 29,706 23,649 142,329 11North-South Carolina 22,737 24,621 25,423 26,346 23,097 17,039 139,263 12National average 22,463 22,825 24,795 24,106 23,036 21,638 138,863South Florida 23,208 23,197 24,364 19,382 20,327 20,047 130,525 13Pennsylvania 20,100 20,134 23,718 21,378 19,685 22,298 127,313 14North Florida 23,069 22,984 23,559 19,533 18,304 16,052 123,501 15New England 20,483 19,013 23,638 22,109 19,252 15,631 120,126 16Arkansas-Oklahoma 21,640 22,246 23,271 19,839 16,943 15,237 119,176 17Tennessee-Kentucky 24,731 21,721 20,211 17,148 15,637 19,097 118,545 18Midwest 14,657 15,053 20,686 21,025 23,171 22,903 117,495 19Kansas-Missouri 15,544 23,774 26,022 18,627 17,693 15,813 117,473 20Ohio 24,678 19,631 17,171 16,723 17,774 16,866 112,843 21Michigan 18,769 16,740 21,943 19,319 18,605 15,607 110,983 22North Central 14,984 15,179 21,741 16,352 18,585 21,147 107,988 23Virginia - West Virginia 17,397 17,061 21,418 16,585 15,452 14,433 102,346 24South Texas 15,564 17,118 17,565 18,343 14,176 13,346 96,112 25Brooklyn 14,957 12,884 14,136 17,515 17,322 16,885 93,699 26New Jersey 15,029 16,017 14,587 14,677 15,813 14,639 90,762 27Houston 14,109 15,587 16,584 15,414 14,875 12,910 89,479 28Manhattan 14,684 11,605 14,139 19,481 13,734 14,287 87,930 29Delaware-Maryland 13,863 12,379 14,643 13,735 15,735 15,726 86,081 30Connecticut-Rhode Island 14,687 14,137 16,512 16,629 11,930 8,994 82,889 31Indiana 13,285 12,873 15,931 15,402 13,284 11,449 82,224 32Upstate New York 13,849 14,299 14,625 13,108 10,782 11,198 77,861 33
Source: GAO analysis of IRS data.
Table III.1: Total Number of Audits by District and Ranked, FYs 1992 Through 1997

Appendix III
Total Number of IRS Audits, Criminal Investigation Initiations, and Prosecution Referrals
for Fiscal Years 1992-1997
Page 26 GAO/GGD-99-19 Audit and Criminal Enforcement Rates
Returns auditedRegion 1992 1993 1994 1995 1996 1997 Total RankWestern 238,457 251,326 248,726 261,471 268,990 250,985 1,519,955 1National average 185,317 188,303 204,556 198,877 190,049 178,514 1,145,616Midstates 155,807 168,750 206,695 185,753 175,469 169,149 1,061,623 2South 175,906 176,297 187,691 173,610 155,106 141,790 1,010,400 3Northeast 171,099 156,839 175,112 174,674 160,632 152,131 990,487 4
Source: GAO analysis of IRS data.
Returns auditedService Center 1992 1993 1994 1995 1996 1997 Total RankFresno 109,296 43,658 127,146 385,278 361,378 234,514 1,261,270 1Ogden 42,451 25,976 32,602 105,074 119,695 105,097 430,895 2National average 45,921 30,272 41,548 112,195 117,970 80,363 428,268Austin 32,689 46,808 48,496 95,977 137,371 50,804 412,145 3Brookhaven 41,371 34,037 34,170 115,044 101,246 79,837 405,705 4Philadelphia 31,048 17,835 33,073 121,002 99,000 54,980 356,938 5Kansas City 41,569 27,858 25,967 80,048 91,168 55,507 322,117 6Atlanta 50,280 25,997 35,011 66,379 88,949 47,022 313,638 7Cincinnati 42,570 32,556 33,358 58,674 60,724 63,404 291,286 8Andover 33,871 24,504 27,007 50,020 53,407 58,652 247,461 9Memphis 34,068 23,486 18,645 44,456 66,758 53,811 241,224 10
Source: GAO analysis of IRS data.
Tables III.4 to III.7 show how the Tennessee-Kentucky district and theSouth ranked in total number of criminal investigations and prosecutionreferrals during fiscal years 1992 through 1997, compared to the rest of thecountry.
During this period, the Tennessee-Kentucky district initiated 960investigations, ranking 22nd among 33 districts. Also, the South initiated7,588 investigations, ranking 3rd of 4 regions. As for prosecution referralsduring this period, the Tennessee-Kentucky district made 719 referrals,ranking 17th of 33 districts and averaging 120 referrals for all 6 years. Thedistrict ranked higher in 2 years—sixth in 1992 and ninth in 1995. Theaverage number of prosecution referrals in the South for all 6 years rankedthird of four regions.
Table III.2: Total Number of Audits by Region and Ranked, FYs 1992 Through 1997
Table III.3: Total Number of Audits by Service Center and Ranked, FYs 1992 Through 1997

Appendix III
Total Number of IRS Audits, Criminal Investigation Initiations, and Prosecution Referrals
for Fiscal Years 1992-1997
Page 27 GAO/GGD-99-19 Audit and Criminal Enforcement Rates
Investigations initiatedDistrict 1992 1993 1994 1995 1996 1997 Total RankManhattan 231 326 313 205 234 184 1,493 1Pennsylvania 268 280 242 279 190 198 1,457 2North Texas 349 222 212 183 185 201 1,352 3Illinois 289 230 157 198 233 244 1,351 4South Florida 202 217 234 209 246 229 1,337 5Pacific-Northwest 231 250 212 255 218 167 1,333 6South Texas 245 203 251 136 208 240 1,283 7Rocky Mountain 258 199 197 196 223 190 1,263 8Virginia-West Virginia 262 207 213 148 157 267 1,254 9Brooklyn 231 237 177 169 192 201 1,207 10Ohio 294 236 183 171 162 157 1,203 11Southwest 193 198 158 154 194 232 1,129 12New Jersey 184 196 212 202 144 177 1,115 13North-South Carolina 211 204 162 156 171 173 1,077 14Northern California 202 168 165 131 230 160 1,056 15Gulf Coast 240 180 118 161 196 157 1,052 16National average 198 186 162 152 161 162 1,021Michigan 237 212 188 100 172 111 1,020 17North Florida 217 210 119 130 146 172 994 18Delaware-Maryland 180 180 127 157 136 197 977 19Arkansas-Oklahoma 169 190 155 119 177 156 966 20Southern California 147 194 128 187 143 166 965 21Tennessee-Kentucky 197 174 132 165 142 150 960 22Georgia 195 162 163 147 120 127 914 23Los Angeles 234 150 154 141 113 102 894 24New England 138 176 121 110 160 130 835 25Kansas-Missouri 129 152 149 138 110 142 820 26Houston 143 141 104 125 128 124 765 27Midwest 146 105 108 144 115 104 722 28Upstate New York 111 102 115 98 109 95 630 29Indiana 104 169 97 85 83 86 624 30Connecticut-Rhode Island 116 103 104 58 103 92 576 31North Central 82 81 92 85 101 95 536 32Central California 103 94 84 58 78 109 526 33
Source: GAO analysis of IRS data.
Table III.4: Total Number of Criminal Investigations Initiated by District and Ranked, FYs 1992 Through 1997

Appendix III
Total Number of IRS Audits, Criminal Investigation Initiations, and Prosecution Referrals
for Fiscal Years 1992-1997
Page 28 GAO/GGD-99-19 Audit and Criminal Enforcement Rates
Investigations initiatedRegion 1992 1993 1994 1995 1996 1997 Total RankNortheast 1,990 2,048 1,782 1,549 1,602 1,542 10,513 1National average 1,635 1,537 1,337 1,250 1,330 1,334 8,422Midstates 1,656 1,493 1,325 1.213 1,340 1,392 8,419 2South 1,524 1,354 1,141 1,116 1,178 1,275 7,588 3Western 1,368 1,253 1,098 1,122 1,199 1,126 7,166 4
Source: GAO analysis of IRS data.
Prosecution referralsDistrict 1992 1993 1994 1995 1996 1997 Total RankPennsylvania 176 223 176 195 175 159 1,104 1Manhattan 146 187 176 218 190 166 1,083 2North Texas 295 172 159 126 113 159 1,024 3Illinois 186 207 119 148 135 130 925 4South Florida 156 104 173 162 155 148 898 5Brooklyn 133 198 137 122 160 141 891 6Virginia-West Virginia 120 185 183 122 86 193 889 7Pacific-Northwest 149 166 128 156 158 113 870 8Ohio 177 190 127 149 102 123 868 9South Texas 186 134 162 97 111 155 845 10North-South Carolina 162 151 152 94 124 149 832 11New Jersey 108 145 158 139 115 136 801 12Rocky Mountain 165 132 123 116 127 115 778 13Gulf Coast 148 126 88 127 148 136 773 14Southwest 131 106 154 93 126 144 754 15Southern California 99 159 107 152 103 112 732 16Tennessee-Kentucky 167 123 103 134 88 104 719 17National average 129 129 113 110 109 116 706Michigan 155 138 136 100 80 90 699 18North Florida 94 129 96 85 104 149 657 19Georgia 130 93 118 98 117 91 647 20Delaware-Maryland 95 118 106 76 82 156 633 21Northern California 109 106 113 89 126 88 631 22Kansas-Missouri 125 101 85 100 108 108 627 23Arkansas-Oklahoma 103 95 59 81 117 111 566 24Los Angeles 107 120 88 77 107 55 554 25New England 81 84 67 92 95 110 529 26Midwest 94 94 72 119 71 73 523 27Houston 95 110 65 73 72 81 496 28Indiana 79 105 84 63 47 62 440 29Upstate New York 72 58 69 66 95 70 430 30Central California 82 78 54 59 59 53 385 31Connecticut-Rhode Island 77 73 54 43 64 65 376 32North Central 50 58 53 44 44 72 321 33
Source: GAO analysis of IRS data.
Table III.5: Total Number of Criminal Investigations Initiated by Region and Ranked, FYs 1992 Through 1997
Table III.6: Total Number of Criminal Investigations Referred for Prosecution by District and Ranked, FYs 1992 Through 1997

Appendix III
Total Number of IRS Audits, Criminal Investigation Initiations, and Prosecution Referrals
for Fiscal Years 1992-1997
Page 29 GAO/GGD-99-19 Audit and Criminal Enforcement Rates
Prosecution referralsRegion 1992 1993 1994 1995 1996 1997 Total RankNortheast 1,220 1,414 1,206 1,200 1,158 1,216 7,414 1National average 1,063 1,067 936 904 901 954 5,825Midstates 1,213 1,076 858 851 818 951 5,767 2South 977 911 913 822 822 970 5,415 3Western 842 867 767 742 806 680 4,704 4
Source: GAO analysis of IRS data.
Table III.7: Total Number of Criminal Investigations Referred for Prosecution by Region and Ranked, FYs 1992 Through 1997
Appendix IV
Audit, Criminal Investigation, and ProsecutionStandards
Page 30 GAO/GGD-99-19 Audit and Criminal Enforcement Rates
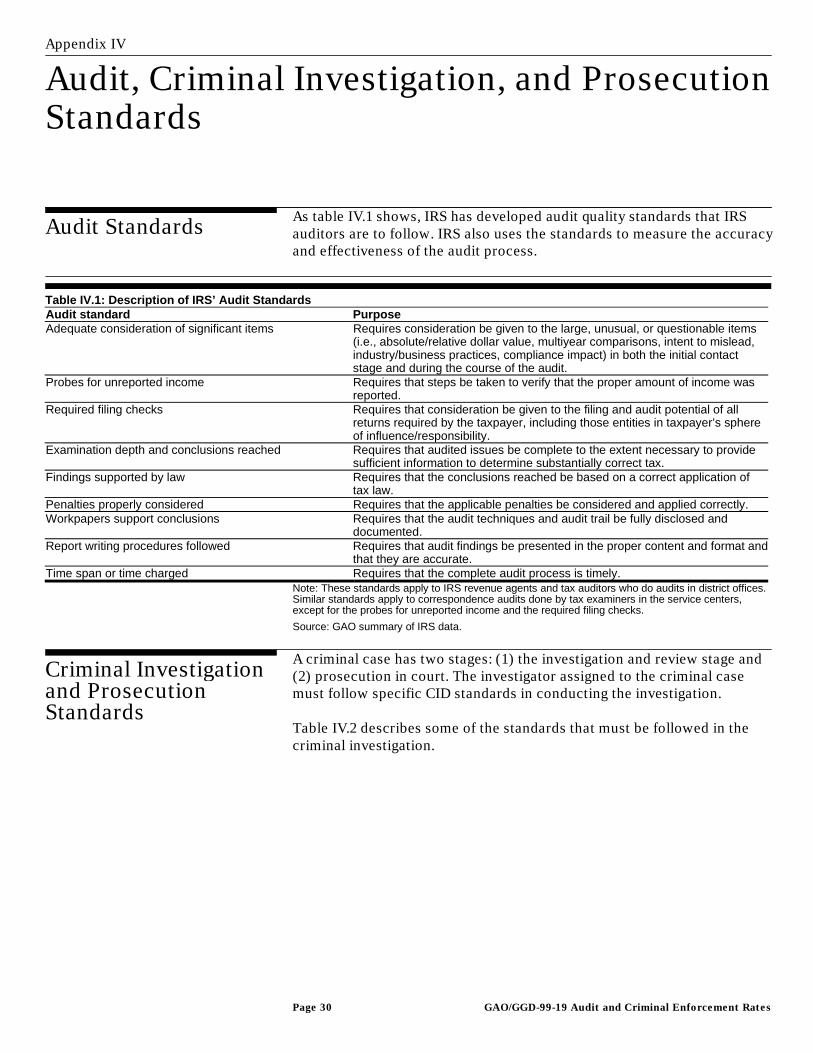
As table IV.1 shows, IRS has developed audit quality standards that IRSauditors are to follow. IRS also uses the standards to measure the accuracyand effectiveness of the audit process.
Audit standard PurposeAdequate consideration of significant items Requires consideration be given to the large, unusual, or questionable items
(i.e., absolute/relative dollar value, multiyear comparisons, intent to mislead,industry/business practices, compliance impact) in both the initial contactstage and during the course of the audit.
Probes for unreported income Requires that steps be taken to verify that the proper amount of income wasreported.
Required filing checks Requires that consideration be given to the filing and audit potential of allreturns required by the taxpayer, including those entities in taxpayer’s sphereof influence/responsibility.
Examination depth and conclusions reached Requires that audited issues be complete to the extent necessary to providesufficient information to determine substantially correct tax.
Findings supported by law Requires that the conclusions reached be based on a correct application oftax law.
Penalties properly considered Requires that the applicable penalties be considered and applied correctly.Workpapers support conclusions Requires that the audit techniques and audit trail be fully disclosed and
documented.Report writing procedures followed Requires that audit findings be presented in the proper content and format and
that they are accurate.Time span or time charged Requires that the complete audit process is timely.
Note: These standards apply to IRS revenue agents and tax auditors who do audits in district offices.Similar standards apply to correspondence audits done by tax examiners in the service centers,except for the probes for unreported income and the required filing checks.
Source: GAO summary of IRS data.
A criminal case has two stages: (1) the investigation and review stage and(2) prosecution in court. The investigator assigned to the criminal casemust follow specific CID standards in conducting the investigation.
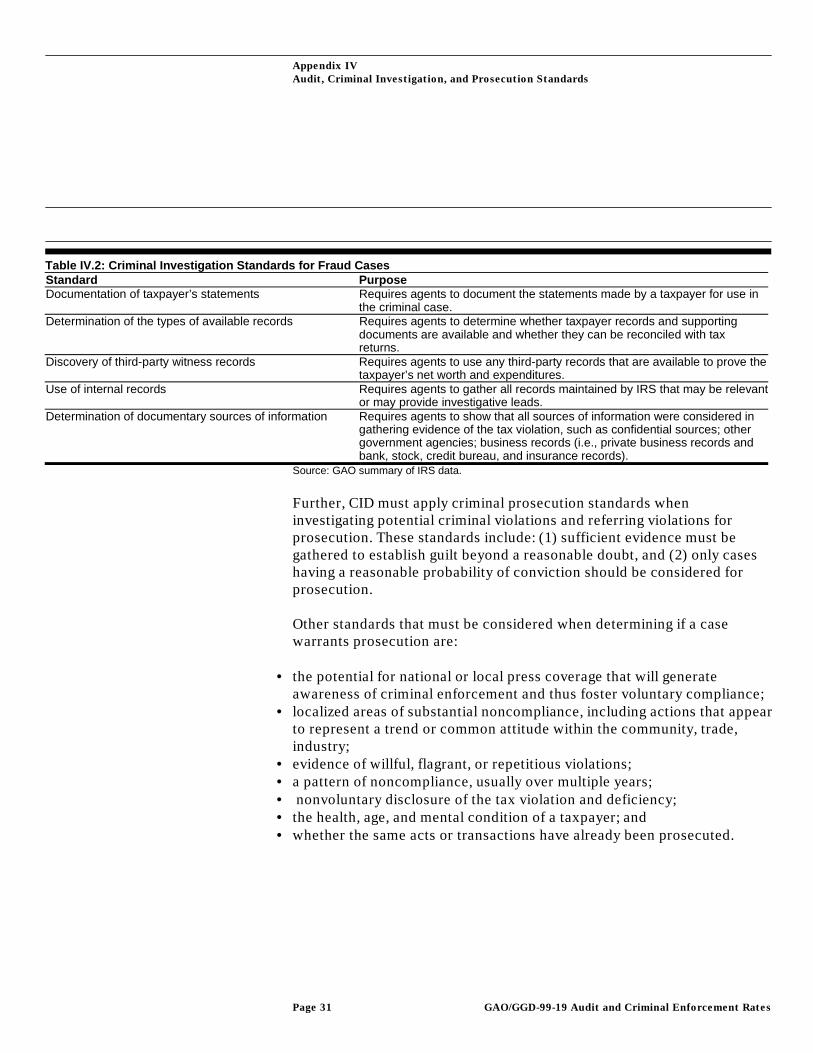
Table IV.2 describes some of the standards that must be followed in thecriminal investigation.
Audit Standards
Table IV.1: Description of IRS’ Audit Standards
Criminal Investigationand ProsecutionStandards
Appendix IV
Audit, Criminal Investigation, and Prosecution Standards
Page 31 GAO/GGD-99-19 Audit and Criminal Enforcement Rates
Standard PurposeDocumentation of taxpayer’s statements Requires agents to document the statements made by a taxpayer for use in
the criminal case.Determination of the types of available records Requires agents to determine whether taxpayer records and supporting
documents are available and whether they can be reconciled with taxreturns.
Discovery of third-party witness records Requires agents to use any third-party records that are available to prove thetaxpayer’s net worth and expenditures.
Use of internal records Requires agents to gather all records maintained by IRS that may be relevantor may provide investigative leads.
Determination of documentary sources of information Requires agents to show that all sources of information were considered ingathering evidence of the tax violation, such as confidential sources; othergovernment agencies; business records (i.e., private business records andbank, stock, credit bureau, and insurance records).
Source: GAO summary of IRS data.
Further, CID must apply criminal prosecution standards wheninvestigating potential criminal violations and referring violations forprosecution. These standards include: (1) sufficient evidence must begathered to establish guilt beyond a reasonable doubt, and (2) only caseshaving a reasonable probability of conviction should be considered forprosecution.
Other standards that must be considered when determining if a casewarrants prosecution are:
• the potential for national or local press coverage that will generateawareness of criminal enforcement and thus foster voluntary compliance;
• localized areas of substantial noncompliance, including actions that appearto represent a trend or common attitude within the community, trade,industry;
• evidence of willful, flagrant, or repetitious violations;• a pattern of noncompliance, usually over multiple years;• nonvoluntary disclosure of the tax violation and deficiency;• the health, age, and mental condition of a taxpayer; and• whether the same acts or transactions have already been prosecuted.
Table IV.2: Criminal Investigation Standards for Fraud Cases
Appendix V
IRS’ Controls for Audit, CriminalInvestigation, and Prosecution ReferralProcesses
Page 32 GAO/GGD-99-19 Audit and Criminal Enforcement Rates
For years IRS has had various controls and procedures for conductingaudits, criminal investigations, and prosecution referrals. These controlsand procedures are designed to guard against any improprieties andmisuse of audits and criminal investigations, as well as to better ensureproductive use of resources. The following describes what these controlshave included.
The controls over the audit process occur at three major stages of theaudit: (1) selection of the return to audit, (2) supervisory review during theaudit, and (3) quality review and measurement upon completion of theaudit.
The selection of most audited returns relies on IRS’ audit sources. IRS hasabout 40 audit sources (i.e., programs and techniques used to selectpotentially noncompliant returns for audit) for identifying returns thatneed to be audited on the basis of known or suspected noncompliance.The major source for identifying returns for audit is DIF--a computer-generated score designed to predict returns that, if audited, would be mostlikely to result in changes to the reported tax.1
Regardless of the selection method, IRS generally requires various levels ofIRS managers and staff to check, among other things, for adherence to theaudit selection standard. For the audit projects, IRS district offices alsorequire authorization by a district director or higher level managementofficial before audits can begin. Prior to that authorization, returns shouldalso undergo review at multiple managerial and staff office levels in thedistrict to help ensure an appropriate basis for selecting the return foraudit. After selecting returns for audit, IRS requires manual review orclassification of the returns. The purpose of classification is to decidewhether to accept the return as filed by the taxpayer or to identify all taxissues on the return that should be audited.
During an audit, IRS auditors have a responsibility to do quality audits on atimely basis. IRS has established audit standards to guide auditors’behavior in such areas as probing for unreported income, checkingtaxpayer claims, developing evidence, considering the potential for fraud,and documenting the audit results. IRS audit supervisors are required toperiodically review the audit workload to determine conformity with auditstandards as well as the technical accuracy of the audits. In addition, IRS 1Besides DIF, the other sources prompt audits for a variety of reasons. These reasons include taxpayeractions (such as a claim for refund), referrals from either outside or inside IRS, information providedby a third party, indications of fraud or noncompliance through another audits, and special complianceproblems identified through projects.
Controls Over theAudit Process

Appendix V
IRS’ Controls for Audit, Criminal Investigation, and Prosecution Referral Processes
Page 33 GAO/GGD-99-19 Audit and Criminal Enforcement Rates
supervisors also are to do reviews to determine whether auditors areresponsive to taxpayers in dealing with taxpayer inquiries and issues.These reviews cover such aspects as professionalism, timeliness, languageused, and adequacy of IRS’ responses.
During the audit, auditors may ask to expand the audit to include other taxyears and related returns of the same taxpayer if, in their professionaljudgement, either the same or a related compliance problem exists. Anauditor is not authorized to audit any tax return that does not meet thiscriterion. These requests to audit the other returns should be approved bythe auditor’s supervisor.
After an audit, IRS attempts to measure the quality of the audits against theaudit standards.2 IRS staff across the country review a sample of auditsclosed through the district offices. This sample usually totals less than15,000 returns. Similar to the practice at district offices, service centerstaff are to review a small sample of all closed audits.
Controls over the criminal investigation and referral processes consistmainly of multiple levels of review within the Criminal InvestigationDivision, as well as successive levels of review and approval by the IRSDistrict Counsel, DOJ, and U.S. Attorney. The controls have been put inplace to ensure that investigators adhere to the criminal prosecutionstandards and policies.
In addition, CID officials conduct quarterly reviews, biannual reviews, andpeer reviews of their operations. These reviews are intended to addresssuch things as workload, documentation, and the selection andmanagement of criminal investigations.
A criminal tax investigation begins after an investigator determines that acase has prosecution potential. If a case lacks potential, an investigationshould not be started. However, if started, the investigation is done togather evidence that would prove a criminal tax violation. Once theinvestigation has started, investigators are to continue until (1) during thecourse of gathering information the investigator determines a criminalcase is not warranted; (2) sufficient evidence has been collected to justifya referral for a successful prosecution; or (3) limited resources, cases withhigher potential, or other circumstances warrant discontinuation.
2 The audit quality measure will also become part of the quality measurement across IRS.
Controls Over theCriminal Investigationand Referral Processes

Appendix V
IRS’ Controls for Audit, Criminal Investigation, and Prosecution Referral Processes
Page 34 GAO/GGD-99-19 Audit and Criminal Enforcement Rates
The CID chief is to approve the opening of an investigation. Once aninvestigation is opened, investigators (CID special agents) are to beginefforts to gather and analyze financial data, conduct interviews, and searchpublic records. The primary function is to gather evidence that documentsthe movement of money for use in the criminal prosecution. CID managersreview all ongoing investigations quarterly to insure that the evidencegathered meets established standards. Referrals for prosecution requirereview and approval by the CID manager, branch chief, and chief prior toreview by District counsel and DOJ.
If the evidence cannot be obtained in any other way, IRS criminalinvestigators can request search warrants to authorize the search ofproperty and possible seizure of evidence related to the alleged criminalactivity. The request for use of a search warrant is to be approved by theCID chief and District counsel, if tax related, before going through the DOJapproval process prior to presentation before a magistrate.
Throughout the process of gathering evidence, the investigator continuallyanalyzes and assesses the information to determine if the evidencesubstantiates criminal activity. If not, the investigator discontinues thecase. Upon completion of data gathering, the criminal investigatorprepares a written report detailing findings of violations of the tax law andrefers the case for prosecution. The report is to be reviewed by the CIDmanager, branch chief, and chief for the adequacy of the factualinvestigation, sufficiency of the evidence, and conformance of the reportto the legal requirements for prosecution. The CID manager, branch chief,or chief may determine that the evidence does not substantiate criminalactivity and the case should not be prosecuted. In such instances, the casemay be sent to the IRS Collection or Examination divisions for civil action.
If the referral is approved in CID, it moves to the IRS District counsel. Ifthe District counsel approves the case, a criminal reference letter isprepared, and the case file is sent to DOJ’s Criminal Tax Division. Whenprosecution is recommended by a Criminal Tax Division attorney andauthorized by the Chief and Assistant Attorney General of the TaxDivision, the case file is forwarded to the office of the U.S. Attorney in thejudicial district where criminal proceedings will be carried out. The casefile is sent with instructions to either obtain an indictment--formalaccusation or charge for a tax-related crime or other offense--or use agrand jury to obtain further information bearing on the decision toprosecute.

Appendix V
IRS’ Controls for Audit, Criminal Investigation, and Prosecution Referral Processes
Page 35 GAO/GGD-99-19 Audit and Criminal Enforcement Rates
By the time a case file reaches the U.S. Attorney’s Office, the case shouldhave been reviewed and approved at all levels, including CID, the IRSDistrict counsel, and DOJ’s Criminal Tax Division, to ensure thatestablished policies and standards have been met. However, upon a finalreview of the case file by the U.S. Attorney, a decision can also be madenot to prosecute the case.
The U.S. Attorney leads the prosecution of individuals charged withviolations of federal criminal law. The U.S. Attorney usually relies on therecommendation of the criminal tax specialists in DOJ’s Criminal TaxDivision on whether to proceed with the prosecution. However, theultimate responsibility for carrying out the prosecution of a criminal taxcase lies with the U.S. Attorney.3 Generally speaking, the U.S. Attorneyexercises a large degree of independence and discretion in handling casesas well as in determining which cases to prosecute.
3The path described is that of a general criminal tax case. However, exceptions include cases that canbe directly referred from CID to (1) DOJ and then to the U.S. Attorney, (2) IRS’ District Counsel andthen to the U.S. Attorney, and (3) the U.S. Attorney.

Appendix VI
Comments From the Internal Revenue Service
Page 36 GAO/GGD-99-19 Audit and Criminal Enforcement Rates

Appendix VI
Comments From the Internal Revenue Service
Page 37 GAO/GGD-99-19 Audit and Criminal Enforcement Rates

Appendix VII
Major Contributors to This Report
Page 38 GAO/GGD-99-19 Audit and Criminal Enforcement Rates
Thomas D. Short, Assistant Director
Michelle E. Bowsky, Evaluator-in-ChargeMark Abraham, Evaluator
General GovernmentDivision, Washington,D.C.
Atlanta Field Office

Page 39 GAO/GGD-99-19 Audit and Criminal Enforcement Rates

Page 40 GAO/GGD-99-19 Audit and Criminal Enforcement Rates
Ordering Information
The first copy of each GAO report and testimony is free. Additional
copies are $2 each. Orders should be sent to the following address,
accompanied by a check or money order made out to the
Superintendent of Documents, when necessary. VISA and
MasterCard credit cards are accepted, also. Orders for 100 or more
copies to be mailed to a single address are discounted 25 percent.
Order by mail:
U.S. General Accounting Office
P.O. Box 37050
Washington, DC 20013
or visit:
Room 1100
700 4th St. NW (corner of 4
th and G Sts. NW)
U.S. General Accounting Office
Washington, DC
Orders may also be placed by calling (202) 512-6000 or by using fax
number (301) 258-4066, or TDD (301) 413-0006.
Each day, GAO issues a list of newly available reports and testimony.
To receive facsimile copies of the daily list or any list from the past
30 days, please call (202) 512-6000 using a touch-tone phone. A
recorded menu will provide information on how to obtain these
lists.
For information on how to access GAO reports on the INTERNET,
send e-mail message with “info” in the body to:
or visit GAO’s World Wide Web Home Page at:
http://www.gao.gov

United StatesGeneral Accounting OfficeWashington, D.C. 20548-0001
Official BusinessPenalty for Private Use $300
Address Correction Requested
Bulk RatePostage & Fees Paid
GAOPermit No. G100
(268855)