GFR Decay Heat Removal 2 - Brookhaven National Laboratory
33
BNL-78165-2007 managed by Brookhaven Science Associates for the U.S. Department of Energy Combined Active/Passive Decay Heat Removal Approach for the 2400MWt Gas-Cooled Fast Reactor Lap-Yan Cheng Hans Ludewig June 2007 Energy Sciences and Technology Department Brookhaven National Laboratory P.O. Box 5000 Upton, NY 11973-5000 www.bnl.gov Notice: This manuscript has been authored by employees of Brookhaven Science Associates, LLC under Contract No. DE-AC02-98CH10886 with the U.S. Department of Energy. The publisher by accepting the manuscript for publication acknowledges that the United States Government retains a non-exclusive, paid-up, irrevocable, world-wide license to publish or reproduce the published form of this manuscript, or allow others to do so, for United States Government purposes.
Transcript of GFR Decay Heat Removal 2 - Brookhaven National Laboratory

BNL-78165-2007
managed by Brookhaven Science Associates for the U.S. Department of Energy
Combined Active/Passive Decay Heat Removal Approach for the 2400MWt Gas-Cooled Fast Reactor
Lap-Yan Cheng
Hans Ludewig
June 2007
Energy Sciences and Technology Department
Brookhaven National Laboratory P.O. Box 5000
Upton, NY 11973-5000 www.bnl.gov
Notice: This manuscript has been authored by employees of Brookhaven Science Associates, LLC under Contract No. DE-AC02-98CH10886 with the U.S. Department of Energy. The publisher by accepting the manuscript for publication acknowledges that the United States Government retains a non-exclusive, paid-up, irrevocable, world-wide license to publish or reproduce the published form of this manuscript, or allow others to do so, for United States Government purposes.

ii
DISCLAIMER
This report was prepared as an account of work sponsored by an agency of the United States Government. Neither the United States Government nor any agency thereof, nor any of their employees, nor any of their contractors, subcontractors, or their employees, makes any warranty, express or implied, or assumes any legal liability or responsibility for the accuracy, completeness, or any third party’s use or the results of such use of any information, apparatus, product, or process disclosed, or represents that its use would not infringe privately owned rights. Reference herein to any specific commercial product, process, or service by trade name, trademark, manufacturer, or otherwise, does not necessarily constitute or imply its endorsement, recommendation, or favoring by the United States Government or any agency thereof or its contractors or subcontractors. The views and opinions of authors expressed herein do not necessarily state or reflect those of the United States Government or any agency thereof.

iii
Table of Contents
1.0 INTRODUCTION.......................................................................................................................... 1 2.0 RELAP5 MODEL DESCRIPTION.............................................................................................. 2 3.0 GT-MHR POWER CONVERSION UNIT.................................................................................. 5 4.0 SPACER LOSS COEFFICIENT.................................................................................................. 8 5.0 ACCIDENT SEQUENCE.............................................................................................................. 9 6.0 DISCUSSION OF RESULTS...................................................................................................... 14
6.1 HEAT REMOVAL RATE OF THE EMERGENCY COOLING SYSTEM ........................................... 15 6.2 REACTOR AND GUARD CONTAINMENT PRESSURES ................................................................ 15 6.3 GUARD CONTAINMENT GAS TEMPERATURE........................................................................... 18 6.4 PEAK FUEL TEMPERATURE...................................................................................................... 19 6.5 CORE OUTLET TEMPERATURE ................................................................................................ 20 6.6 CORE INLET TEMPERATURE .................................................................................................... 21 6.7 HELIUM FLOW .......................................................................................................................... 22 6.8 BLOWER POWER....................................................................................................................... 25
7.0 CONCLUSIONS .......................................................................................................................... 26 8.0 REFERENCES............................................................................................................................. 28

iv
List of Figures
Figure 1 – GFR System with Emergency Cooling Loop………………………….........3 Figure 2 – Reactor Vessel and Power Conversion Unit Volume Arrangement………...3 . Figure 3 – Schematic of Emergency Cooling System………………………………......4 Figure 4 – Heat Structures for Radiative Heat Transfer………………………………...4 Figure 5 – Reactor Vessel and Guard Containment Heat Structures…………………...5 Figure 6 – Compressor Performance Curves (from INL)…………………………..…..6 Figure 7 – Plate-Fin Heat Transfer Surfaces in the Recouperator……………………...7 Figure 8 – Finned Tubes in the Precooler and Intercooler………………………….......7 Figure 9 – Form Loss Coefficients for Laminar and Turbulent Flow………………......8 Figure 10 – Rotational Speed of the Shaft………………………………………….......11
Figure 11 – Reactor and Guard Containment Pressures………………………………..11 Figure 12 – Flow through PCU and the ECS Heat Exchanger………………………....12 Figure 13 – Helium Flow at Core Inlet and Outlet…………………………………..…12 Figure 14 – Helium Temperature at Core Inlet and Outlet……………………………..13 Figure 15a – Reactor Power and Emergency Heat Exchanger Heat Removal Rate…...16 Figure 15b – Reactor Power and Emergency Heat Exchanger Heat Removal Rate…...16 Figure 16a – Reactor and Guard Containment Pressures (Case 17)…………………....17 Figure 16b – Reactor and Guard Containment Pressures (Case 26)…………………....17 Figure 16c – Reactor and Guard Containment Pressures (Case 32)……………….…...18 Figure 17 – Gas Temperature Inside the Guard Containment……………………….....19

v
List of Figures(Cont’d)
Figure 18 – Peak Fuel Temperature Core-wide………………………………………...20 Figure 19 – Core Outlet Temperature…………………………………………………..21 Figure 20 – Core Inlet Temperature…………………………………………………….22 Figure 21 – Helium Flow through the ECS Heat Exchanger…………………………...23 Figure 22 – Helium Flow at Core Outlet………………………………………………..24 Figure 23 – Blower Power………………………………………………………………25
List of Tables Table 1 – Timeline for Case 17……………………………………………………....... 10 Table 2 – Case Definitions………………………………………………………..….....14 Table 3 – Case 23 Key Flows……………………………………………………….......24

1
1.0 INTRODUCTION Decay heat removal at depressurized shutdown conditions has been regarded as one of the key areas where significant improvement in passive response was targeted for the GEN IV GFR over the GCFR designs of thirty years ago. It has been recognized that the poor heat transfer characteristics of gas coolant at lower pressures needed to be accommodated in the GEN IV design. The design envelope has therefore been extended to include a station blackout sequence simultaneous with a small break/leak. After an exploratory phase of scoping analysis in this project, together with CEA of France [1], it was decided that natural convection would be selected as the passive decay heat removal approach of preference. Furthermore, a double vessel/containment option, similar to the double vessel/guard vessel approach of the SFR, was selected as the means of design implementation to reduce the PRA risks of the depressurization accident. However additional calculations in conjunction with CEA showed that there was an economic penalty in terms of decay heat removal system heat exchanger size, elevation heights for thermal centers, and most of all in guard containment back pressure for complete reliance on natural convection only. The back pressure ranges complicated the design requirements for the guard containment. Recognizing that the definition of a loss-of-coolant-accident in the GFR is a misnomer, since gas coolant will always be present, and the availability of some driven blower would reduce fuel temperature transients significantly; it was decided instead to aim for a hybrid active/passive combination approach to the selected BDBA. Complete natural convection only would still be relied on for decay heat removal but only after the first twenty four hours after the initiation of the accident. During the first twenty four hour period an actively powered blower would be relied on to provide the emergency decay power removal. However the power requirements of the active blower/circulators would be kept low by maintaining a pressurized system coolant back pressure of ~7-8 bars through the design of the guard containment for such a design pressure. This approach is termed the medium pressure approach by both CEA and the US. Such a containment design pressure is in the range of the LWR experience, both PWRs and BWRs. Both metal containments and concrete guard containments are possible in this pressure range. This approach is then a time-at-risk approach as the power requirements should be low enough that battery/fuel cell banks without diesel generator start-up failure rate issues should be capable of providing the necessary power. Compressed gas sources are another possibility. A companion PRA study is being conducted [2] to survey the reliability of such systems. The decay heat calculations documented in this report are the first analyses for the US GEN IV GFR design to confirm the efficacy of the proposed hybrid active/passive combination for the GEN IV GFR shutdown decay heat removal events under the BDBA conditions. Decay heat removal by a combination of active and passive means has been analyzed for a 2400 MWt direct-cycle gas cooled fast reactor (GCFR). Previously, transient calculations [3, 4] of passive decay heat removal by natural circulation cooling in a depressurization accident were done with a simplified representation of the power conversion unit (PCU). In the simplified model the coast down of the PCU flow was prescribed as boundary conditions and all the components of the PCU were modeled as

2
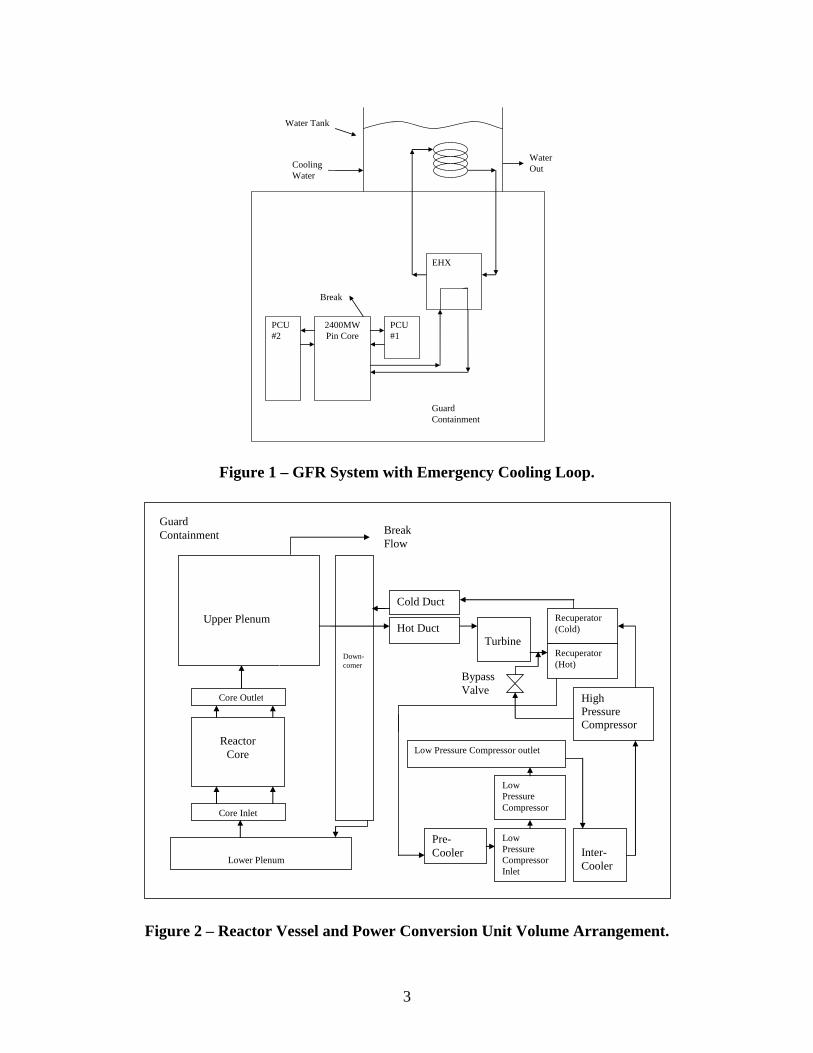
simple hydraulic volumes. This topical report presents an updated RELAP5 model of the GFR plant system and discusses results of a study that considered decay heat removal by both active and passive means. One of the significant updates is the addition of active components (rotating machines and heat exchangers) to the PCU model. Results of the new analyses confirm that the coast down of the turbomachine of the PCU plays an important role in the early response of the reactor system following a breach in the pressure boundary. Another modification to the model is the implementation of Reynolds number dependent loss coefficient for the spacers in the pin core. This change has proved to have negative impact on decay heat removal by natural circulation because of increased form loss in the core under reduced flow conditions. Natural circulation cooling is shown to be sufficient to removal decay heat 24 hours after reactor shutdown when the guard containment pressure is maintained at 800kPa. In addition to these promising results for the base case and the reference DHR design, additional parametric analyses have been performed to examine the phenomenology of the natural convection flow through the core, the PCU and the primary system. In particular, insightful results have been obtained on the topic of core bypass flow. The need for check valves, better understanding of thermal centers, particularly in the PCU, have all been explored. These insights will be used in the future effort to optimize the role of the PCU in the transition to natural convection removal of decay heat. 2.0 RELAP5 MODEL DESCRIPTION A RELAP5 model of the reactor system has been constructed to address different parametric effects that influence the steady state and transient behavior of a 2400 MWt pin core in a depressurization accident [3, 4]. Details of the model can be found in the references and only salient features will be highlighted here. The model, as shown schematically in Figure 1, consists of the reactor, two power conversion system loops, an emergency heat exchanger loop with its heat sink, and a guard containment surrounding the primary system. The two power conversion system loops consists of one and three PCU’s respectively with each PCU rated at 600MW.This two-loop arrangement is to facilitate analysis of potential asymmetric effects during a transient. The RELAP5 representations of the primary system and the power conversion unit (PCU) by hydraulic volumes are shown in Figure 2. The core has three regions representing the fueled section (multiple channels with different power), the reflector and shield regions. The emergency cooling system (ECS) is sized to handle 2% decay heat removal by natural convection in a 4x50% configuration, i.e. four separate loops of 1% power capacity. In the RELAP5 model the emergency heat removal system is represented by a single loop with a 2x50% capacity and one heat exchanger, which is sized to handle 2% of full power. A battery powered blower downstream of the heat exchanger is sized to provide sufficient forced flow cooling during the first 24 hours after a reactor shutdown. Details of the volume representation of the ECS are shown in Figure 3.
3
Figure 1 – GFR System with Emergency Cooling Loop.
Figure 2 – Reactor Vessel and Power Conversion Unit Volume Arrangement.
Reactor
Core
Core Inlet
Lower Plenum
Core Outlet
Down- comer
Upper Plenum
Pre-Cooler
High Pressure Compressor
Inter- Cooler
Low Pressure Compressor Inlet
Low Pressure Compressor
Low Pressure Compressor outlet
Cold Duct
Turbine
Recuperator (Cold)
Recuperator (Hot)
Hot Duct
Break Flow
Bypass Valve
Guard Containment
Guard Containment
PCU #2
2400MW Pin Core
PCU #1
EHX
Break
Water Tank
Cooling Water
Water Out

4
Figure 3 – Schematic of Emergency Cooling System. After 24 hours the blower will be turned off and natural circulation kicks in to remove decay heat. Radiative heat transfer is incorporated in the RELAP5 model of the GFR system. Shown in Figure 4 is the conceptual arrangement of heat structures involved in the heat transfer by radiation.
Figure 4 – Heat Structures for Radiative Heat Transfer.

5
The RELAP5 model also includes the reactor cavity cooling system (RCCS), an active system that absorbs radiant heat from the reactor vessel and removes heat from the guard containment atmosphere by natural convection. The general arrangement of heat structures as modeled in RELAP5 is shown in Figure 5.
Figure 5 – Reactor Vessel and Guard Containment Heat Structures. 3.0 GT-MHR POWER CONVERSION UNIT The RELAP5 model of the power conversion unit (PCU) is based on a design that is being developed by General Atomics (GA) and its Russian partner for a 600 MWt Gas Turbine-Modular Helium Reactor (GT-MHR). Conceptual design of the GT-MHR was done by GA [5] and further development is being carried out in Russia with support from the US government [6]. A PCU has two major parts, the turbomachine and the heat exchangers. A node diagram showing the gas volumes in a PCU is shown in Figure 2.
The components of a PCU are housed in a vertical vessel that is placed near the reactor. The PCU and the reactor are connected by a short cross vessel that is made up of an inner hot duct and a concentric outer cold duct. Components of the turbomachine, namely, the generator, turbine, low and high pressure compressors, are all on one shaft. The heat exchangers consist of recuperator, precooler, and intercooler. A bypass valve that connects the high and low pressure side of the PCU is used for the over-speed protection of the turbine. Details of the RELAP5 model of the PCU are given in Reference [7].
6
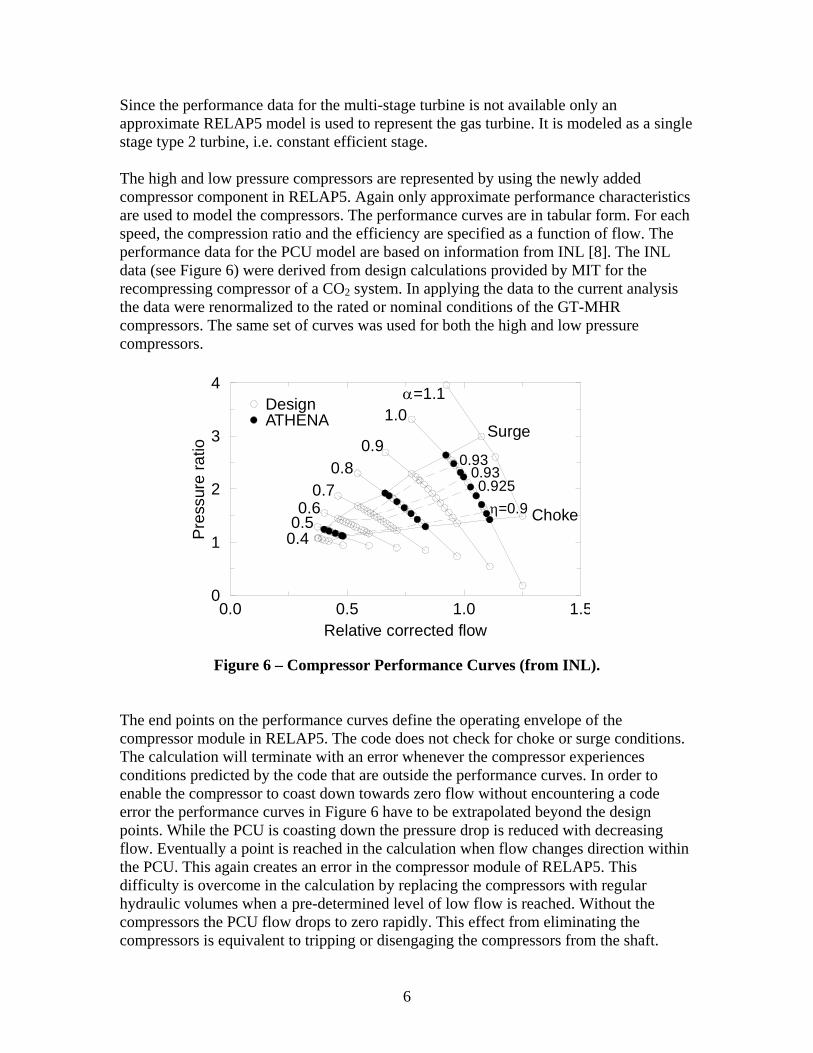
Since the performance data for the multi-stage turbine is not available only an approximate RELAP5 model is used to represent the gas turbine. It is modeled as a single stage type 2 turbine, i.e. constant efficient stage. The high and low pressure compressors are represented by using the newly added compressor component in RELAP5. Again only approximate performance characteristics are used to model the compressors. The performance curves are in tabular form. For each speed, the compression ratio and the efficiency are specified as a function of flow. The performance data for the PCU model are based on information from INL [8]. The INL data (see Figure 6) were derived from design calculations provided by MIT for the recompressing compressor of a CO2 system. In applying the data to the current analysis the data were renormalized to the rated or nominal conditions of the GT-MHR compressors. The same set of curves was used for both the high and low pressure compressors.
Figure 6 – Compressor Performance Curves (from INL). The end points on the performance curves define the operating envelope of the compressor module in RELAP5. The code does not check for choke or surge conditions. The calculation will terminate with an error whenever the compressor experiences conditions predicted by the code that are outside the performance curves. In order to enable the compressor to coast down towards zero flow without encountering a code error the performance curves in Figure 6 have to be extrapolated beyond the design points. While the PCU is coasting down the pressure drop is reduced with decreasing flow. Eventually a point is reached in the calculation when flow changes direction within the PCU. This again creates an error in the compressor module of RELAP5. This difficulty is overcome in the calculation by replacing the compressors with regular hydraulic volumes when a pre-determined level of low flow is reached. Without the compressors the PCU flow drops to zero rapidly. This effect from eliminating the compressors is equivalent to tripping or disengaging the compressors from the shaft.
0.0 0.5 1.0 1.5Relative corrected flow
0
1
2
3
4
Pre
ssur
e ra
tio
α=1.11.0
0.90.8
0.70.6
0.50.4
η=0.90.925
0.930.93
Surge
Choke
DesignATHENA
7
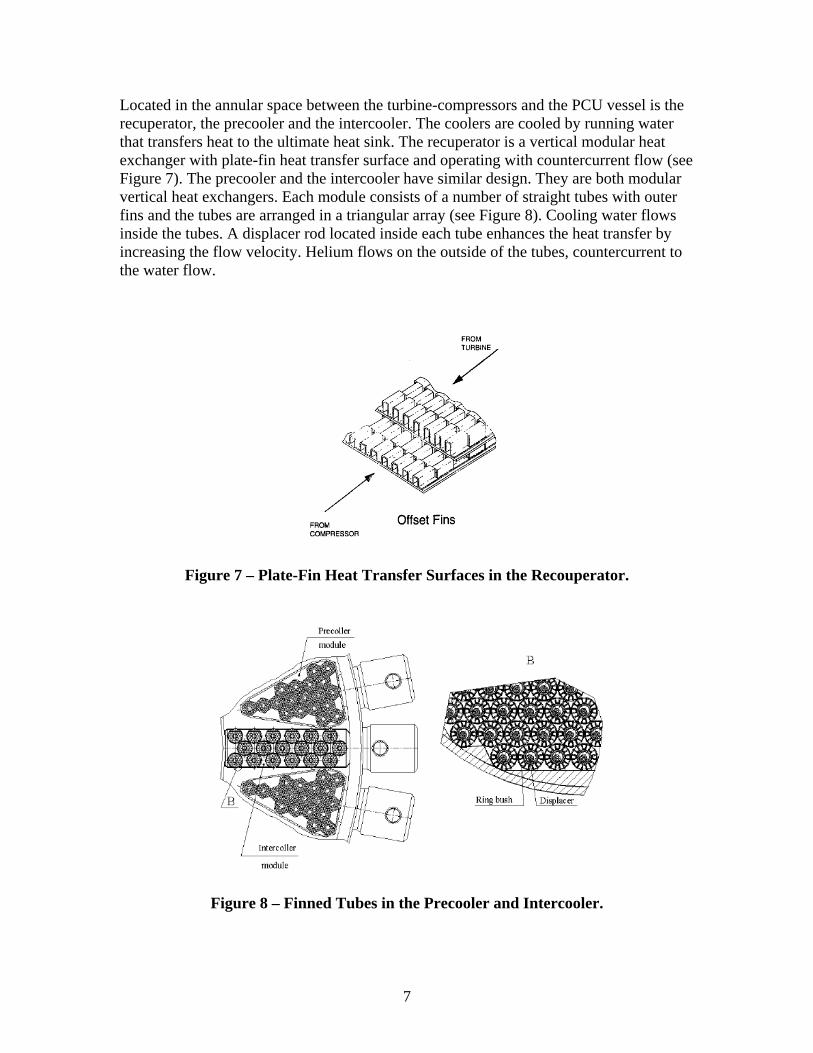
Located in the annular space between the turbine-compressors and the PCU vessel is the recuperator, the precooler and the intercooler. The coolers are cooled by running water that transfers heat to the ultimate heat sink. The recuperator is a vertical modular heat exchanger with plate-fin heat transfer surface and operating with countercurrent flow (see Figure 7). The precooler and the intercooler have similar design. They are both modular vertical heat exchangers. Each module consists of a number of straight tubes with outer fins and the tubes are arranged in a triangular array (see Figure 8). Cooling water flows inside the tubes. A displacer rod located inside each tube enhances the heat transfer by increasing the flow velocity. Helium flows on the outside of the tubes, countercurrent to the water flow.
Figure 7 – Plate-Fin Heat Transfer Surfaces in the Recouperator.
Figure 8 – Finned Tubes in the Precooler and Intercooler.

8
4.0 SPACER LOSS COEFFICIENT The helium flow through the core enters the laminar flow regime when natural circulation is established subsequent to the stoppage of the battery powered blower. It is important to recognize in the calculation that form losses of the grid spacer can become significant for the pin core design when the flow is laminar. In the updated model of the GFR core the implementation of the dependence of spacer form losses on Reynolds number is based on an evaluation performed by Hejzlar [9]. It is noted in Figure 9 that for Reynolds number (RN) above 1x10⁴, both the laminar (Cl) and turbulent (Ct) form of the correlation provide almost the same value for the form loss coefficient. At the rated core flow, the Reynolds number in the core region is in the range of 4-6x10⁴. As a simplification for the calculation, the laminar form of the form loss correlation is assumed to apply for the full range of Reynolds numbers.
10 100 1 .103 1 .104 1 .105 1 .1061
10
100
1 .103
1 .104
1 .105
1.604 104×
6.005
C t RNn( )C l RNn( )
1 106×10 RNn
Figure 9 – Form Loss Coefficients for Laminar and Turbulent Flow.
The following spacer loss coefficients are used in the calculation and the velocity (v) and the Reynolds number (Re) are based on the free flow area of the channel (i.e. without the spacers). K = 0.59 + 2850/Re (for the fueled region)
9
K = 0.74 + 3570/Re (for the reflector and shield regions) where the pressure drop due to form loss is calculated by, ∆p = K ρ v2 / 2 At rated flow condition the above two form loss coefficients approach the previously assumed constant values of 0.65 and 0.80 for the fueled and reflector/shield regions respectively. The effects of the increased form loss on natural circulation flow will be discussed later in relation to the results of the transient analysis. 5.0 ACCIDENT SEQUENCE A series of RELAP5 transient calculations has been performed to analyze the decay heat removal capability of the GFR design in a depressurization accident. The transients are analyzed by using RELAP5-3D, version 2.4.1.1a. The latest input model of the GFR includes four modifications: integration of the PCU to the reactor system, Reynolds number dependent spacer grid loss, addition of heat structures to represent piping of the Emergency Cooling System, and the addition of a time-dependent junction to represent the blower in the ECS loop. The significant influence of stored energy in heat structures on the temperature of helium after reactor shutdown has been demonstrated by Hejzlar [10]. Heat structures for the hot and cold ducts of the PCU are based on the model described in reference [10]. The power, Wb, required to run the blower is estimated by calculating the rate of work done on the helium flow. Wb = (∆Pb) . Ab . Vb
where (∆Pb) is the pressure differential across the blower junction,; Ab is the blower junction flow area; Vb is the blower flow velocity , a specified boundary condition for the time-dependent junction representing the blower. Vb is zero when the blower is off. A separate flow path parallel with the blower junction is used to simulate the condition of a non-running blower. This flow path is equipped with a trip valve that is open only when the blower is not running and a local loss is specified to represent the flow resistance from a stopped blower. The depressurization accident is initiated by a break in the reactor pressure boundary (assumed at the high point of the reactor vessel) followed by a scram on low system pressure. One of the initial observations from the results of the new RELAP5 model is that the compressors are able to slow down the depressurization and delay the reactor scram on pressure. Since the main interest of the analysis is to assess the decay heat removal capability a 10 sq. inch break is used instead of the previous 1 sq. inch to shorten the time between break initiation and reactor scram. The timeline for one of the cases (Case 17) is shown in Table 1 below to illustrate the accident scenario.

10
Table 1 – Timeline for Case 17 0 s 10 sq. in. break initiated. 148.08 s Reactor tripped on low pressure. Generator tripped off line and turbine
bypass is opened. 215.65 s Turbine bypass re-closed when PCU flow dropped below 20% of rated
value. 390.48 s Compressors replaced by dummy volumes when PCU flow again dropped
below 20% of rated value. 420 s Blower turned on with a flow velocity of 3.5 m/s. 9000 s Case restarted by defining reactor power as a function of time in the form
of a table. Reactor power decayed linearly from 26.2407MW at t=9000s to 13.9748 MW at t=15000s. The later power level is equivalent to the decay power 24 hours after a shutdown.
9010 s Trip valve located at the junction between the PCU outlet and the reactor downcomer was closed. This was used to simulate the action of a check valve that would have prevented flow from entering the PCU via the reactor downcomer.
15000 s Blower speed reduced to zero in 5 seconds. Reactor power was maintained constant at the 24-hour decay heat level.
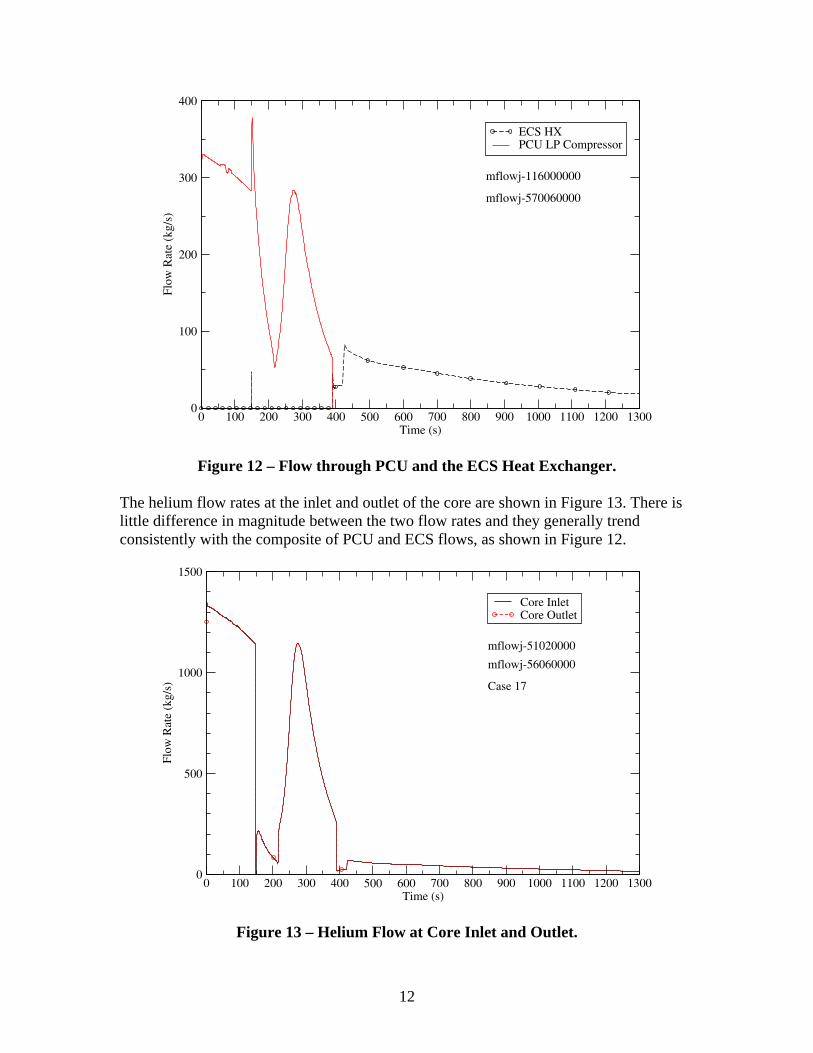
25000 s Case ended. Simultaneous with the scram the accident scenario assumes a generator trip and the opening of the PCU turbine bypass valve. With a sudden loss of load (generator trip) the excess mechanical energy will drive the shaft of the turbomachine to very high rotational speed. Over-speed protection is provided by the opening of turbine bypass valves that are assumed to fully open in 1 second in the current analysis. The rotational speed of the shaft is shown in Figure 10. The rate of the decay in the shaft speed is a function of the frictional torque and the value is assumed in the calculation to result in a coast down time of about 800s. With the bypass valve open most of the helium flow inside the PCU just re-circulates between the high and low pressure compressors. The sudden drop in reactor pressure, as shown in Figure 11, at t=~150s corresponds with the bypass valve action. The flow through a single PCU is illustrated in Figure12. The spike in flow at about 150s is due to the spinning up of the shaft when the generator is tripped off line. As a way to restore full turbine output, the bypass valve is re-closed at t=~220s. Both the pressure and flow respond positively. The effect of replacing the compressors with regular hydraulic volumes is quite obvious in Figure 12 where the PCU flow drops to zero rapidly. It is also of interest to point out that the wiggles in the flow in Figure 12 at about 50s are due to the transition from one compressor performance curve to another. The transitions may not be continuous because part of the operating envelope is based on extrapolations.

11
According to Figure 12 natural circulation flow through the ECS heat exchanger is established when the PCU flow ceases at about 390s. At t=420s a blower with a gas velocity of 3.5m/s is turned on resulting in a mass flow rate that is more than twice the natural circulation flow. Over time as the density of the helium decreases with decreasing pressure, the blower flow rate also decreases.
Figure 10 – Rotational Speed of the Shaft.
0 100 200 300 400 500 600 700 800 900 1000 1100 1200 1300Time (s)
0
1e+06
2e+06
3e+06
4e+06
5e+06
6e+06
7e+06
8e+06
Pres
sure
(Pa
)
ReactorGuard Containment
p-58040000
p-70010000
Case 17
Figure 11 – Reactor and Guard Containment Pressures.
12
0 100 200 300 400 500 600 700 800 900 1000 1100 1200 1300Time (s)
0
100
200
300
400
Flow
Rat
e (k
g/s)
ECS HXPCU LP Compressor
mflowj-116000000
mflowj-570060000
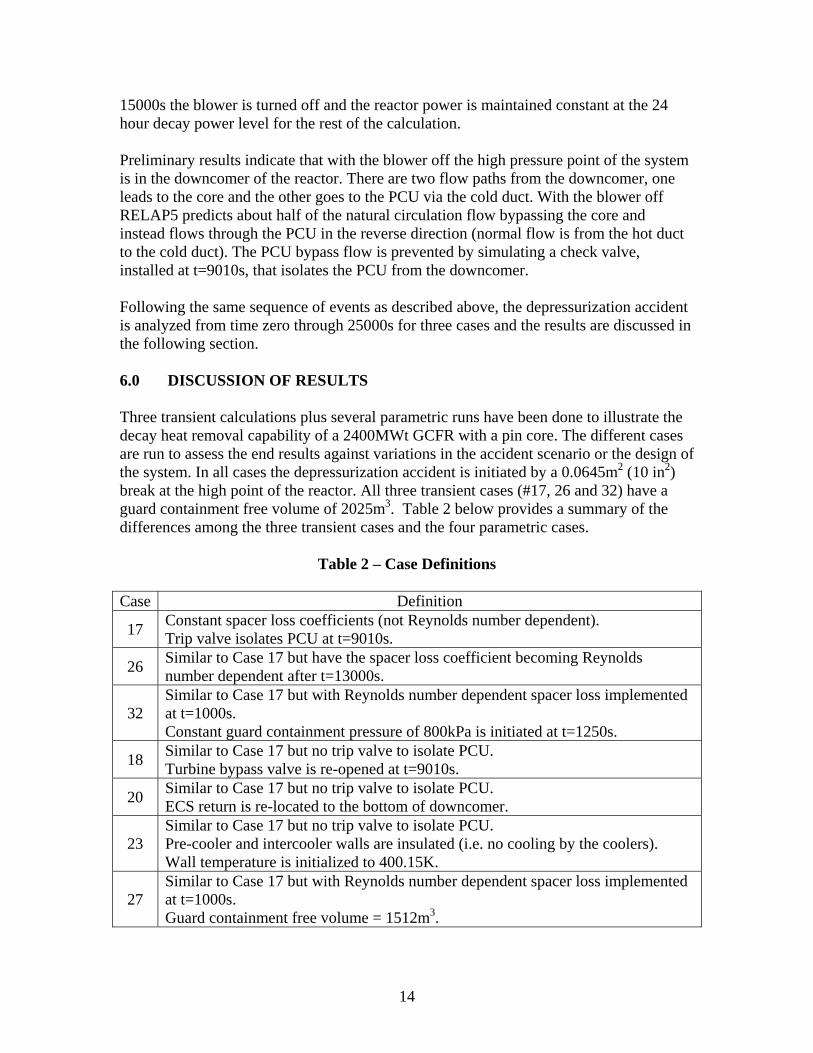
Figure 12 – Flow through PCU and the ECS Heat Exchanger. The helium flow rates at the inlet and outlet of the core are shown in Figure 13. There is little difference in magnitude between the two flow rates and they generally trend consistently with the composite of PCU and ECS flows, as shown in Figure 12.
0 100 200 300 400 500 600 700 800 900 1000 1100 1200 1300Time (s)
0
500
1000
1500
Flow
Rat
e (k
g/s)
Core InletCore Outlet
mflowj-51020000
mflowj-56060000
Case 17
Figure 13 – Helium Flow at Core Inlet and Outlet.

13
An important safety parameter of interest is the core outlet temperature. This is illustrated in Figure 14 together with the core inlet temperature. Unlike the core flow there is significant difference between the core inlet and outlet temperature responses during the depressurization accident. As the reactor pressure drops by about 2.5MPa at t=150s, the core inlet sees a corresponding drop in temperature by more than 300 degrees K. This behavior is consistent with the response expected of a compressible fluid. The core outlet on the other hand shows much less perturbation in its temperature. This is because the drop in temperature due to expansion is somewhat counter-balanced by a rise in temperature due to a decrease in core flow. When the reactor pressure recovers after the re-closing of the turbine bypass valve at t=215s, the compression causes an accompanying rise in core inlet temperature. The corresponding temperature at the core outlet however shows a continuing decline and the reason is due to a surge in core flow from the closure of the turbine bypass valve. There is another drop in core outlet temperature at approximately t=400s and this coincides with the initiation of natural circulation through the ECS and the arrival of cooled helium from the ECS heat exchanger. The rising trend of the core outlet temperature is consistent with the decay power exceeding the cooling power of the ECS heat exchanger during the early phase of the transient.
0 100 200 300 400 500 600 700 800 900 1000 1100 1200 1300Time (s)
0
500
1000
1500
Vol
ume
Vap
or T
empe
ratu
re (
K)
Core InletCore Outlet
tempg-52010000
tempg-56010000
Case 17
Figure 14 – Helium Temperature at Core Inlet and Outlet. It is shown in the next section of the report that the core is adequately cooled when the blower is running. It is then not necessary to simulate every second of the first 24 hours while the blower is in operation. A fast forward in time in simulation is done by linearly decreasing the reactor power from 26.2407MW at t=9000s to 13.9748MW at t=15000s. The later power level is equivalent to the decay power 24 hours after a shutdown. At
14
15000s the blower is turned off and the reactor power is maintained constant at the 24 hour decay power level for the rest of the calculation. Preliminary results indicate that with the blower off the high pressure point of the system is in the downcomer of the reactor. There are two flow paths from the downcomer, one leads to the core and the other goes to the PCU via the cold duct. With the blower off RELAP5 predicts about half of the natural circulation flow bypassing the core and instead flows through the PCU in the reverse direction (normal flow is from the hot duct to the cold duct). The PCU bypass flow is prevented by simulating a check valve, installed at t=9010s, that isolates the PCU from the downcomer. Following the same sequence of events as described above, the depressurization accident is analyzed from time zero through 25000s for three cases and the results are discussed in the following section. 6.0 DISCUSSION OF RESULTS Three transient calculations plus several parametric runs have been done to illustrate the decay heat removal capability of a 2400MWt GCFR with a pin core. The different cases are run to assess the end results against variations in the accident scenario or the design of the system. In all cases the depressurization accident is initiated by a 0.0645m2 (10 in2) break at the high point of the reactor. All three transient cases (#17, 26 and 32) have a guard containment free volume of 2025m3. Table 2 below provides a summary of the differences among the three transient cases and the four parametric cases.
Table 2 – Case Definitions Case Definition
17 Constant spacer loss coefficients (not Reynolds number dependent). Trip valve isolates PCU at t=9010s.
26 Similar to Case 17 but have the spacer loss coefficient becoming Reynolds number dependent after t=13000s.
32 Similar to Case 17 but with Reynolds number dependent spacer loss implemented at t=1000s. Constant guard containment pressure of 800kPa is initiated at t=1250s.
18 Similar to Case 17 but no trip valve to isolate PCU. Turbine bypass valve is re-opened at t=9010s.
20 Similar to Case 17 but no trip valve to isolate PCU. ECS return is re-located to the bottom of downcomer.
23 Similar to Case 17 but no trip valve to isolate PCU. Pre-cooler and intercooler walls are insulated (i.e. no cooling by the coolers). Wall temperature is initialized to 400.15K.
27 Similar to Case 17 but with Reynolds number dependent spacer loss implemented at t=1000s. Guard containment free volume = 1512m3.

15
The success criteria for the transients are:
1. Maximum fuel temperature less than 1600C (1873K) 2. Maximum core outlet temperature (helium) less than 850C (1123K)
Both Case 26 and 32 are restart cases. So they share the same result as for Case 17 up to the point of the restart, t=1300s for Case 26 and t=1000s for Case 32. Case 17 is a success case meeting both success criteria at the end of the calculation at t=25000s. Case 26 with the realistic spacer losses (Reynolds number dependent) results in reduced natural circulation (as compared to Case 17) and the core outlet temperature exceeding the success criterion. At the end of the calculation at t= 25000s the maximum fuel temperature has reached about 1400K and is still increasing. One of the ways to increase the natural circulation flow is by increasing the back pressure of the guard containment. In Case 32 this increase in back pressure is instituted by connecting a constant pressure time-dependent volume to the guard containment. The time-dependent volume, simulating a gas accumulator, maintains the back pressure at 800kPa (8 bars) by injecting helium gas at 20C when necessary. At the end of the calculation at t=25000s, the core outlet temperature is about 1000K and the maximum fuel temperature is about 1100K. Both have reached a quasi-steady state value and are within the success criteria. Case 32 demonstrates that it is possible to rely on natural circulation flow alone to remove decay power 24 hours after shutdown. The following sections discuss the thermal-hydraulic response of some of the more important system parameters for the three cases during the depressurization transient. 6.1 Heat Removal Rate of the Emergency Cooling System Plotted in Figures 15a and 15b is the rate of heat transfer into the water side of the HEATRIC heat exchanger in the emergency cooling system. The reactor power also is shown in the figures for comparison. Except for a period before t=2000s the ECS heat exchanger is able to remove all the decay power while the blower is running (before t=15000s). For the two success cases (#17 and 32) the energy removed by the ECS heat exchanger under natural circulation (for t > 15000s) is seen to approach the decay power towards the end of the simulation. 6.2 Reactor and Guard Containment Pressures The pressures in the upper plenum of the reactor and the guard containment are shown in Figures 16a-c for the three transient cases. The early response (t < 500s) of the reactor

16
0 1000 2000 3000 4000 5000 6000 7000 8000 9000Time (s)
0
5e+07
1e+08
1.5e+08
2e+08
Pow
er (
W)
Reactor PowerECS HX - Case 17ECS HX - Case 26ECS HX - Case 32
rktpow-0
cntrlvar-4
Figure 15a – Reactor Power and Emergency Heat Exchanger Heat Removal Rate.
0 5000 10000 15000 20000 25000Time (s)
0
1e+07
2e+07
3e+07
4e+07
5e+07
6e+07
7e+07
Pow
er (
W)
Reactor Power (Table)ECS HX - Case 17ECS HX - Case 26ECS HX - Case 32
tableout-111
cntrlvar-4
Figure 15b – Reactor Power and Emergency Heat Exchanger Heat Removal Rate.

17
0 5000 10000 15000 20000 25000Time (s)
0
1e+06
2e+06
3e+06
4e+06
5e+06
6e+06
7e+06
8e+06
Pres
sure
(Pa
)
ReactorGuard Containment
p-58040000
p-70010000
Case 17
Figure 16a – Reactor and Guard Containment Pressures (Case 17).
0 5000 10000 15000 20000 25000Time (s)
0
1e+06
2e+06
3e+06
4e+06
5e+06
6e+06
7e+06
8e+06
Pres
sure
(Pa
)
ReactorGuard Containment
p-58040000
p-70010000
Case 26
Figure 16b – Reactor and Guard Containment Pressures (Case 26).

18
0 5000 10000 15000 20000 25000Time (s)
0
1e+06
2e+06
3e+06
4e+06
5e+06
6e+06
7e+06
8e+06
Pres
sure
(Pa
)
ReactorGuard Containment
p-58040000
p-70010000
Case 32
Figure 16c – Reactor and Guard Containment Pressures (Case 32). pressure has been discussed previously in relation to Figure 12. During the early phase of the depressurization transient the helium flow through the break is choked and thus all three cases have similar reactor pressure until the point at which the reactor pressure equalizes with the guard containment pressure. The pressure equalization point occurs at a pressure of ~800kPa and at t=~1250s. The guard containment, owing to heat loss, is losing pressure slowly in time for transient Cases 17 and 26. At the end of the calculation, the difference in pressure between these two cases and the case of constant pressure boundary, Case 32, is ~140kPa. In a sensitivity case, Case 27 (similar to Case 26), the guard containment volume is reduced by 25.33% to 1512m3 at t=1000s. The change has negligible effect on the cross-over pressure (the point at which reactor and guard containment pressure equalizes). The only appreciable effect is a slowing down of the guard containment depressurization after reaching the cross-over pressure. 6.3 Guard Containment Gas Temperature The gas temperature inside the guard containment increases rapidly after the initiation of the depressurization accident because of the relatively low heat capacity of the gaseous atmosphere. The rate of temperature increase and the magnitude of the peak temperature depend directly on the rate and duration of energy addition to the guard containment. Thus the size of the break and the pressure of the reactor all play a role in the response of the guard containment gas temperature.
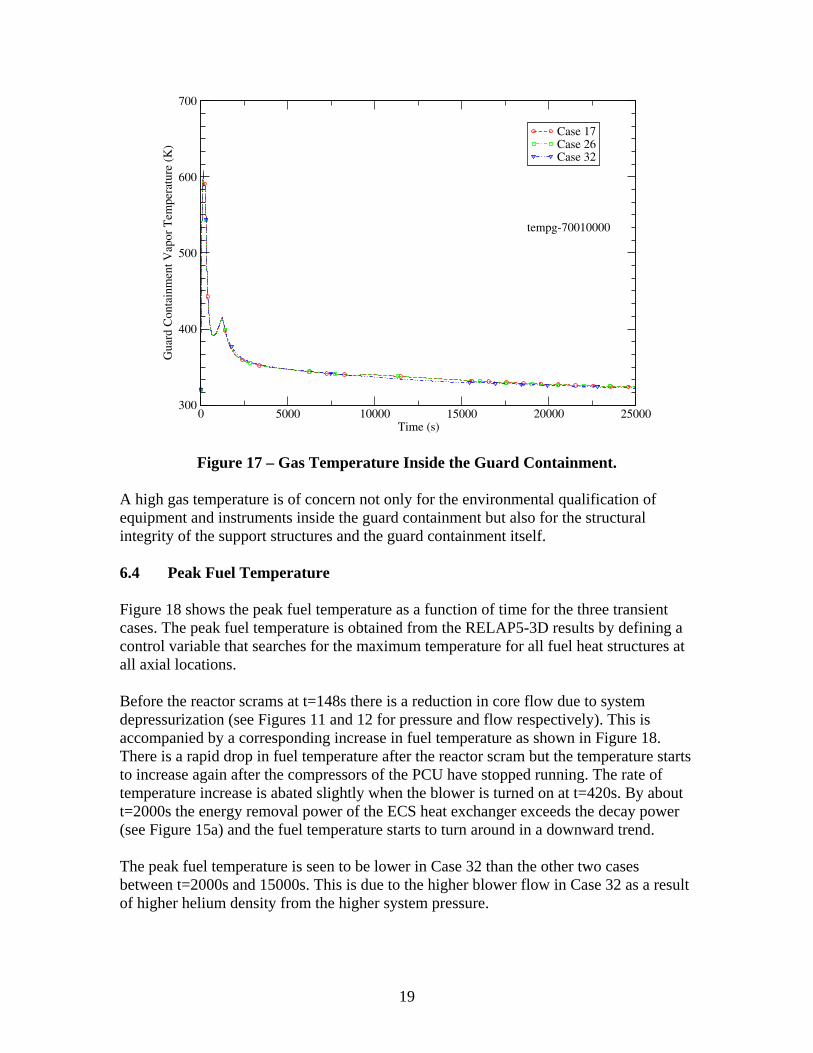
19
0 5000 10000 15000 20000 25000Time (s)
300
400
500
600
700
Gua
rd C
onta
inm
ent V
apor
Tem
pera
ture
(K
)
Case 17Case 26Case 32
tempg-70010000
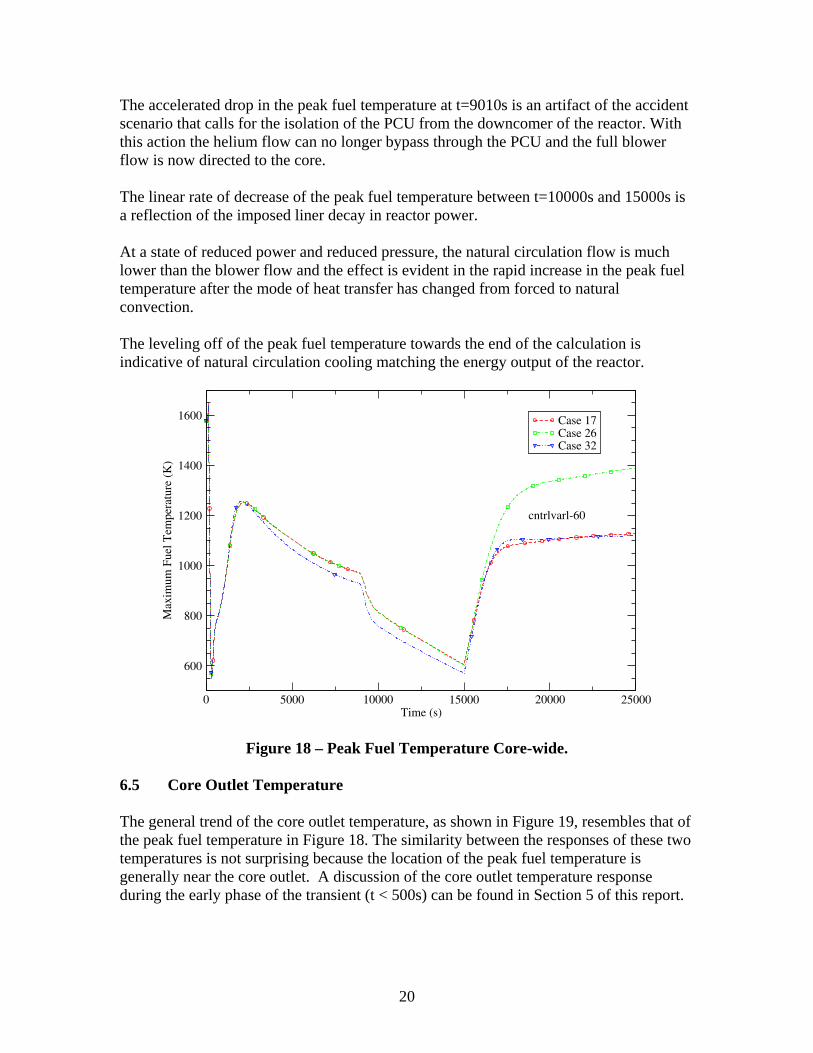
Figure 17 – Gas Temperature Inside the Guard Containment. A high gas temperature is of concern not only for the environmental qualification of equipment and instruments inside the guard containment but also for the structural integrity of the support structures and the guard containment itself. 6.4 Peak Fuel Temperature Figure 18 shows the peak fuel temperature as a function of time for the three transient cases. The peak fuel temperature is obtained from the RELAP5-3D results by defining a control variable that searches for the maximum temperature for all fuel heat structures at all axial locations. Before the reactor scrams at t=148s there is a reduction in core flow due to system depressurization (see Figures 11 and 12 for pressure and flow respectively). This is accompanied by a corresponding increase in fuel temperature as shown in Figure 18. There is a rapid drop in fuel temperature after the reactor scram but the temperature starts to increase again after the compressors of the PCU have stopped running. The rate of temperature increase is abated slightly when the blower is turned on at t=420s. By about t=2000s the energy removal power of the ECS heat exchanger exceeds the decay power (see Figure 15a) and the fuel temperature starts to turn around in a downward trend. The peak fuel temperature is seen to be lower in Case 32 than the other two cases between t=2000s and 15000s. This is due to the higher blower flow in Case 32 as a result of higher helium density from the higher system pressure.
20
The accelerated drop in the peak fuel temperature at t=9010s is an artifact of the accident scenario that calls for the isolation of the PCU from the downcomer of the reactor. With this action the helium flow can no longer bypass through the PCU and the full blower flow is now directed to the core. The linear rate of decrease of the peak fuel temperature between t=10000s and 15000s is a reflection of the imposed liner decay in reactor power. At a state of reduced power and reduced pressure, the natural circulation flow is much lower than the blower flow and the effect is evident in the rapid increase in the peak fuel temperature after the mode of heat transfer has changed from forced to natural convection. The leveling off of the peak fuel temperature towards the end of the calculation is indicative of natural circulation cooling matching the energy output of the reactor.
0 5000 10000 15000 20000 25000Time (s)
600
800
1000
1200
1400
1600
Max
imum
Fue
l Tem
pera
ture
(K
)
Case 17Case 26Case 32
cntrlvarl-60
Figure 18 – Peak Fuel Temperature Core-wide. 6.5 Core Outlet Temperature The general trend of the core outlet temperature, as shown in Figure 19, resembles that of the peak fuel temperature in Figure 18. The similarity between the responses of these two temperatures is not surprising because the location of the peak fuel temperature is generally near the core outlet. A discussion of the core outlet temperature response during the early phase of the transient (t < 500s) can be found in Section 5 of this report.

21
0 5000 10000 15000 20000 25000Time (s)
500
600
700
800
900
1000
1100
1200
1300
1400
1500
Cor
e O
utle
t Tem
pera
ture
(K
)
Case 17Case 26Case 32
tempg-56010000
Figure 19 – Core Outlet Temperature. 6.6 Core Inlet Temperature During the early phase of the depressurization transient (t < 500s) the core inlet temperature response is driven mainly by depressurization and re-pressurization of the vessel. A discussion of the early phase response (see Figure 14) has been given earlier in Section 5 of the report. From about t=2000s through t=15000s while the blower is running the heat removal rate of the ECS heat exchanger exceeds the decay power (see Figure 15a) and the core inlet temperature, as shown in Figure 20, is decreasing with time. The rate of temperature decrease becomes a little steeper at t=9000s when the shutdown power for the RELAP5 calculation is specified by input with a rate of decrease that is faster than the normal decay power. At t=15000s the blower is turned off resulting in a sudden decrease in core flow followed by a transition to natural circulation (see Figure 22). The transition from forced to natural circulation flow causes a sudden jump in the core inlet temperature (due to reduced core cooling) followed by a gradual decrease as natural circulation flow cooling is established in the reactor.

22
0 5000 10000 15000 20000 25000Time (s)
300
400
500
600
700
800
900
Cor
e In
let T
empe
ratu
re (
K)
Case 17Case 26Case 32
tempg-52010000
Figure 20 – Core Inlet Temperature. 6.7 Helium Flow The flow of helium in the PCU and the core during the early phase of the transient (t < 500s) has been discussed and shown earlier in Figures 12 and 13 respectively. Figures 21 and 22 illustrate the flow through the ECS heat exchanger and at the core outlet respectively from start to finish. The blower is running between t=420s and t=15000s. During this period of forced flow the blower flow velocity is kept constant at 3.5 m/s (an input value) and the mass flow rate is a function of the helium density which in turn depends on the pressure. As the system pressure decreases the helium flow rate also decreases. The flow rate for Case 32 is higher than the other two cases because the constant guard containment pressure condition specified for Case 32 makes its system pressure higher than the other two cases. At t=9010s a trip valve is activated to isolate the cold duct of the PCU from the downcomer of the reactor. This action is intended to prevent helium flow from bypassing the core through the PCU and the trip valve is used to simulate the function of a check valve. With the PCU isolated there is an increase in core flow of 5 to 6 kg/s (see Figure 22). Transition to natural circulation flow occurs at t=15000s when the blower is turned off. The effects of guard containment pressure and Reynolds number dependent spacer loss coefficient are evident in the natural circulation flow rate which has reached a quasi-steady state value by the end of the calculation at t=25000s. It is noted here that the

23
reactor power is kept constant at 13.9748MW from t=15000s onward. This level of power is equivalent to the decay power 24 hours after shutdown. The flow rates at core exit at t=25000s are: Case 17: 4.20 kg/s (constant spacer loss coefficient) Case 26: 2.77 kg/s (Reynolds number dependent spacer loss coefficient) Case 32: 4.25 kg/s (Reynolds number dependent spacer loss coefficient and guard
containment pressure set constant at 800kPa after t=1250s)
0 5000 10000 15000 20000 25000Time (s)
0
10
20
30
40
50
60
70
80
90
Hel
ium
Flo
w R
ate
(kg/
s)
Case 17Case 26Case 32
mflowj-116000000
Figure 21 – Helium Flow through the ECS Heat Exchanger. Several parametric cases have been run to better understand the cause(s) behind the core bypass flow. They include making changes to flow paths inside the PCU and leading to the PCU, and modifying conditions of the coolers inside the PCU. All parametric cases are restarted from the transient run that created Case 17. In Case 18 instead of actuating a trip valve to isolate the PCU, as in Case 17, at t=9010s the turbine bypass valve in the PCU is reopened. The net effect is the creation of an additional flow path between the cold duct side and the hot duct side of the PCU, bypassing the coolers. There is little change in the core bypass flow when the turbine bypass line is reopened. This parametric case shows that with no compressor running the turbine bypass has little effect in reducing PCU flow. In Case 20 at t=9000s the cold duct of the ECS is relocated to the bottom of the downcomer, making the return of the cold helium closer to the core inlet. For this parametric case the PCU remains connected to the downcomer. There is again little

24
change in the flow to the PCU after the ECS return has been relocated. The calculation shows that the helium flows upward in the downcomer to reach the PCU.
0 5000 10000 15000 20000 25000Time (s)
0
5
10
15
20
25
30C
ore
Out
let F
low
Rat
e (k
g/s)
Case 17Case 26Case 32
mflowj-56060000
Figure 22 – Helium Flow at Core Outlet. It is noted that the core bypass flow that goes to the PCU is on the order of a few kg/s (forced flow by the blower). When this bypass flow passes through the precooler and intercooler sections of the PCU the helium gas is essentially cooled down to the temperature of the cooling water (293K). In order to evaluate the effect of the cold centers on the bypass flow a parametric case is created with changes made to the thermal boundary conditions of the heat structures that represent the walls of the coolers. In Case 23 an adiabatic boundary condition is imposed on the cooler walls, i.e. the coolers are insulated from the cooling water. In addition, the cooler wall temperature is re-initialized to 400.15K, a temperature representative of the helium gas before reaching the coolers. The changes are made at t=11000s and the blower is turned off at t=15000s to initiate transition to natural circulation. The transient calculation terminated at t=19841.4s when the maximum fuel temperature reached the threshold of 1600°C. The flow rates through the core and the PCU are summarized in the following table.
Table 3 – Case 23 Key Flows
Time PCU Core (Inlet)
15000s (Blower running) 4.5 kg/s 13.6 kg/s
19841s (Natural Circulation) 4.06 kg/s 1.04 kg/s

25
Results of Case 23 indicate the helium gas attains the cooler wall temperature (~400k) when it passes through the cooler sections. Changes made to the cooler boundary conditions however have apparently no effect on the core bypass flow and the magnitude of the core bypass flow (PCU flow) remains about the same before and after the blower is off. This parametric case demonstrates the detrimental effect of the core bypass flow, namely diverting cooling flow away from the core. One of the ways to prevent the core bypass flow is to use an isolation device such as a check valve to block off flow in the undesirable direction. 6.8 Blower Power Blower power is another parameter aside from natural circulation flow rate that reflects directly the effect of the Reynolds dependent spacer loss coefficient. Figure 23 shows a higher power requirement for higher pressure losses. Higher pressure losses can be from higher flows, e.g. the situation of increased core flow at t=9010 when the PCU is isolated. Higher pressure loss can also be from the higher spacer loss coefficients, e.g. the implementation of Reynolds dependent spacer loss coefficient at t=1000s for Case 32 and at t=13000s for Case 26. The blower power requirement is on the order of 10 to 20kW when the system has reached a quasi-steady pressure of 600 to 800kPa. If the blower flow velocity is assumed a fixed value, the power requirement will increase with pressure because of higher gas density leading to higher pressure drop across the blower.
0 5000 10000 15000 20000 25000Time (s)
0
10000
20000
30000
40000
50000
Blo
wer
Pow
er (
W)
Case 17Case 26Case 32
cntrlvar-732
Figure 23 – Blower Power.
26
7.0 CONCLUSIONS The system transient analyses reported here confirm the efficacy of the proposed hybrid active/passive combination approach to the GEN IV GFR shutdown decay heat removal event under the BDBA conditions. The accident sequence considered is a station blackout simultaneous with a small break/leak (10 sq. inch/0.0645m2) in the reactor vessel. The system consists of the reactor, the power conversion unit, the emergency cooling system, and the guard containment. System responses to the accident are simulated by using a new pre-release version of RELAP5-3D (2.4.1.1a) that has a component model for compressors. The cooling of the reactor can be divided into three time phases during the depressurization accident. The first two phases are forced flow cooling with the circulating flow provided by the PCU during coast down in the first phase and the blower in the second phase. The final phase is passive cooling provide by natural circulation. The RELAP5 calculations show that prior to reactor scram on low system pressure, and the time to scram could be prolonged for a small leak, the PCUs continue to provide adequate forced flow cooling of the core after the initiation of the break. The model also includes a turbine bypass line whose timely actuation and sufficient capacity are crucial in protecting the shaft of the PCU from over-speeding once the generator is tripped offline due to the reactor scram. Incomplete performance data for the PCU compressors prevents the calculation of the PCU coast down to proceed below a certain low flow value. In order to continue to the next phase of the calculation, the operation of the blower, the compressors are removed from the model when the coast down flow drops below 20% of the rated flow. This approximation is acceptable because forced flow cooling is restored momentarily once the blower is started. With an assumed blower flow velocity of 3.5m/s adequate core cooling is achieved for the first 24 hours after shutdown. The active power required to run the blower is a function of the flow velocity, flow resistance, and the system pressure. The calculation shows a power requirement of 10 to 20kW. This is quite small compared to designs for other reactor types. It can be provided by batteries and does not require generator startup. Compressed gas sources may be a possibility. Since all process parameters are evolving in a quasi-steady manner during the period of forced flow cooling by the blower it is possible to approach the next phase of the calculation at a faster pace. This is done by linearly decreasing the decay power down to the 24 hour level analytically when the calculation time reaches 15000s. The final phase of decay heat removal commences when the stopping of the blower initiates the transition to natural circulation cooling. The magnitude of the natural circulation flow is a function of the buoyancy head between the hot and cold thermal centers, flow resistance, and system pressure.

27
The spacer form loss in the laminar flow range has proven to have a negative impact on the natural circulation flow. The reduction in flow is about 34% when laminar form loss is considered (comparing Case 17 and Case 26). A guard containment back pressure of 800kPa has been shown to be able to sustain sufficient natural circulation cooling to keep the fuel and core outlet temperatures in check. The increase in natural circulation flow is about 53% when the back pressure is increased from 660kPa to 800kPa (comparing Case 26 and Case 32). The constant back pressure condition assumed in Case 32 can be implemented by the use of a gas accumulator or a reduction in guard containment heat losses. A parametric calculation has been done to evaluate the effect of reducing the guard containment free volume on the response of the back pressure (Case 27). The result indicates a 25% reduction in the free volume has negligible effect on the cross-over pressure (the point at which reactor and guard containment pressure equalizes). The only appreciable effect is a slowing down of the guard containment depressurization after reaching the cross-over pressure. Core bypass flow has been shown to be a concern when substantial fractions of the natural circulation flow are diverted to the PCU. An isolation device such as a check valve can be installed to mitigate the bypass flow to the PCU. The cause of the core bypass flow is traced to the fact that under natural circulation the location of maximum pressure inside the reactor is in the downcomer region. There are two paths emerging from the downcomer, one going to the core and the other leading to the PCU via the cold duct. The latter path is the preferred passage for the natural circulation flow because of higher flow resistance in the core. Several parametric cases have been constructed to modify the thermal and hydraulic conditions of the bypass flow path to assess their impact on the bypass flow through the PCU. These include the re-opening of the turbine bypass valve (Case 18), re-location of the ECS return to the bottom of the downcomer (Case 20), and insulating the pre-cooler and intercooler (Case 23). The parametric cases all fail to have any real impact on the core bypass flow. The first integrated analysis (reactor and PCU as a coupled system) presented in this report has confirmed the viability of the hybrid approach using a combination of active and passive components to removal decay heat from a depressurized reactor. There remain some aspects of the design that need further investigation to reduce the uncertainty of the hybrid approach and they are summarized in the following bullets: • Create a blower model using the RELAP5 compressor component. • Implement a more comprehensive heat structure model for the reactor vessel and
internals. • Update PCU component design data to better represent their thermal and
hydraulic characteristics, in particular the performance data for compressors at high and low flow ranges.
• Evaluate flow resistances in the PCU when flow is opposite to the normal direction.
28
• Evaluate different break/leak sizes and locations. 8.0 REFERENCES [1] “System Design Report – Development of Generation IV Advanced Gas-Cooled
Reactor with Hardened/Fast Neutron,” INERI #2001-002F report, GFR023, February 2005.
[2] Pagani, L., Apostolakis, G. and Hejzlar, P., “The Impact of Uncertainties on the
Performance of Passive Systems,” Nuclear Technology, VOL. 149, February 2005.
[3] Cheng, L., Ludewig, H. and Jo, J., “Passive Decay Heat Removal for a 2400 MW
Pin Core by Natural Circulation,” BNL report submitted to the DOE GEN-IV Program, January 2005.
[4] Cheng, L. and Ludewig, H., “Analysis Of Depressurization Accident for a 2400
MW Gas Cooled Reactor – Effects of the Reactor Cavity Cooling System,” BNL report submitted to the DOE GEN-IV Program, April 15 2005.
[5] “Gas Turbine-Modular Helium Reactor (GT-MHR) Conceptual Design
Description Report,” General Atomics Report 910720 Revision 1, GA Project No. 7658, July 1996.
[6] Kiryushin, A.I., et. al., “Project of the GT-MHR High-Temperature Helium
Reactor with Gas Turbine,” Nuclear Engineering and Design 173, p. 119-129, 1997.
[7] Cheng, L. and Ludewig, H.., “Modeling of the Power Conversion Unit (PCU),”
BNL report submitted to the DOE GEN-IV Program, July 15 2005. [8] Davis, C., Personal communication with L. Cheng (Electronic files related to
major improvements made to the RELAP5-3D/ATHENA computer code for analysis of the GFR as part of an annual report (2004) for an INL LDRD), April 7, 2005.
[9] Hejzlar, Pavel, “Memo to GFR Design Team; Subject: Large dependence of form
losses on Reynolds number at laminar flow typical of the helium cooled GFR under post-LOCA natural convection decay heat removal,” July 16, 2003.
[10] Hejzlar, Pavel and Kim, Sung Joong, “The Steady State and Transient
ATHENA/RELAP-3D Calculations for the 600MWt Plate-Type Helium GFR,” MIT report, April 25, 2005.