
GETTING TO WHERE YOU WANT TO GO - USC Dana...
73
July 2013 Prepared by: Manuel Pastor, Jennifer Ito, Jared P. Sanchez, Madeline Wander, and Anthony Perez GETTING TO WHERE YOU WANT TO GO: DEMOGRAPHY, ECONOMY, AND THE REGION
Transcript of GETTING TO WHERE YOU WANT TO GO - USC Dana...
July 2013 Prepared by: Manuel Pastor, Jennifer Ito, Jared P.
Sanchez, Madeline Wander, and Anthony Perez
GETTING TO WHERE YOU WANT TO GO:
DEMOGRAPHY, ECONOMY, AND THE REGION

SOUTH KERN
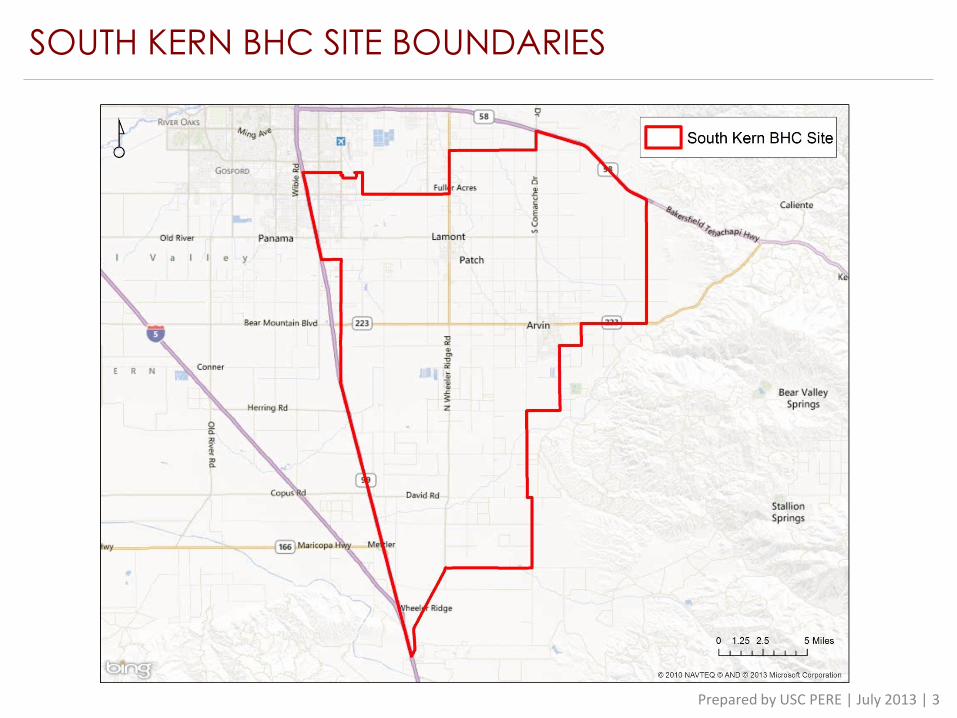
SOUTH KERN BHC SITE BOUNDARIES
Prepared by USC PERE | July 2013 | 3
Changing Demographics

42%
21%
14%
63%
49%
42%
57%
47% 43%
53%
70%
79%
28%
38%
46%
25%
32%
36%
2% 3% 2% 3%
3% 4% 9%
11% 12%
3% 3% 5% 6% 6%
7% 6% 6%
3% 3% 4% 3% 5%
0%
20%
40%
60%
80%
100%
1990 2000 2005-09 1990 2000 2005-09 1990 2000 2005-09
South Kern BHC Site Kern County California
% o
f P
op
ula
tio
n
Population by Race/Ethnicity
1990 to 2005-2009
Other
American Indian
or Alaska Native
African American
or Black
Asian or Pacific
Islander
Latino
White
Source: PERE analysis of 1990 and 200 Census data and 2005-2009 ACS data, at the block group level.
Prepared by USC PERE | July 2013 | 5

13.9%
41.8% 42.5%
78.9%
46.1%
36.1%
2.5%
3.7%
12.5%
3.1% 5.6% 6.0%
2.9% 4.4% 4.9%
0%
20%
40%
60%
80%
100%
South Kern BHC Site Kern County California
% o
f P
op
ula
tio
n
Population by Race/Ethnicity
2005-2009
Other
American Indian or
Alaska Native
African American or
Black
Asian or Pacific
Islander
Latino
White
Source: PERE analysis of 2005-2009 ACS data, at the block group level.
Prepared by USC PERE | July 2013 | 6
0%
20%
40%
60%
80%
100%
1990 2000 2005-09
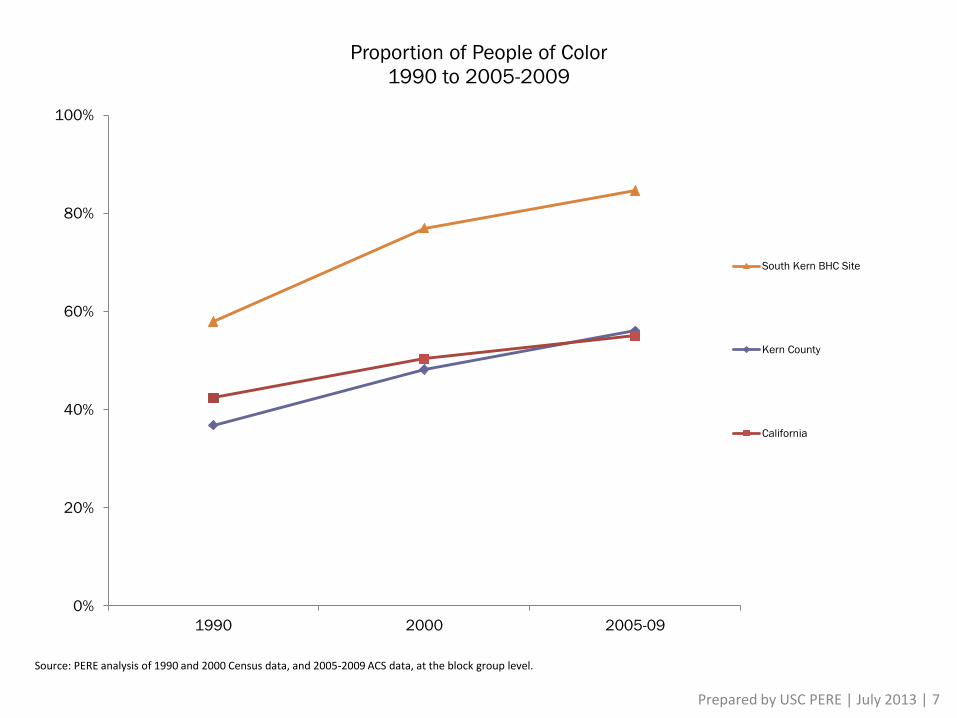
Proportion of People of Color
1990 to 2005-2009
South Kern BHC Site
Kern County
California
Source: PERE analysis of 1990 and 2000 Census data, and 2005-2009 ACS data, at the block group level.
Prepared by USC PERE | July 2013 | 7

53%
38%
26%
75%
67% 61%
70%
62% 60%
43%
58%
70%
20%
28% 33% 17%
22% 24%
2% 1% 1% 2% 2% 3%
6% 9% 9%
2% 3% 3% 3% 3% 6% 7% 7%
0%
20%
40%
60%
80%
100%
1990 2000 2005-09 1990 2000 2005-09 1990 2000 2005-09
South Kern BHC Site Kern County California
Household Language
1990 to 2005-2009
Other language only
Asian language only
Spanish language
only
English Only
Source: PERE analysis of 1990 and 200 Census data and 2005-2009 ACS data
Prepared by USC PERE | July 2013 | 8

17%
21%
27%
6%
8%
10%
8%
10% 11%
0%
10%
20%
30%
1990 2000 2005-09 1990 2000 2005-09 1990 2000 2005-09
South Kern BHC Site Kern County California
% o
f LI H
ou
se
ho
lds
Percent of Households that are Linguistically Isolated
1990 to 2005-2009
*Linguistically isolated households are those that in which no one age 14 years and over speaks English only or speaks English "very well" (if they speak a non-English language).
Source: PERE analysis of 1990 and 2000 Census data, and 2005-2009 ACS data, at the block group level.
Prepared by USC PERE | July 2013 | 9

Immigrant Integration

39.0%
19.8%
26.8%
61.0%
80.2% 73.2%
0%
20%
40%
60%
80%
100%
South Kern BHC Site Kern County California
% o
f P
op
ula
tio
n
Population by Immigration Status
2005-2009
Non-foreign born
Foreign born
Source: PERE analysis of 2005-2009 ACS data, at the tract level.
Prepared by USC PERE | July 2013 | 11
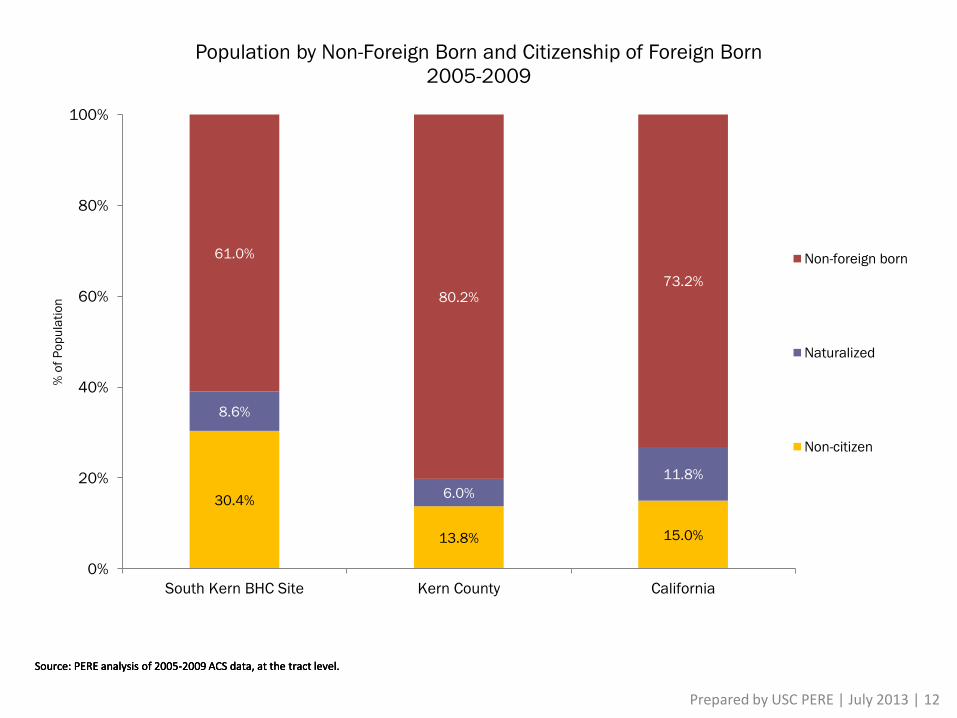
30.4%
13.8% 15.0%
8.6%
6.0%
11.8%
61.0%
80.2% 73.2%
0%
20%
40%
60%
80%
100%
South Kern BHC Site Kern County California
% o
f P
op
ula
tio
n
Population by Non-Foreign Born and Citizenship of Foreign Born
2005-2009
Non-foreign born
Naturalized
Non-citizen
Source: PERE analysis of 2005-2009 ACS data, at the tract level. Source: PERE analysis of 2005-2009 ACS data, at the tract level. Source: PERE analysis of 2005-2009 ACS data, at the tract level.
Prepared by USC PERE | July 2013 | 12
0%
10%
20%
30%
40%
50%
60%
1990 2000 2005-09
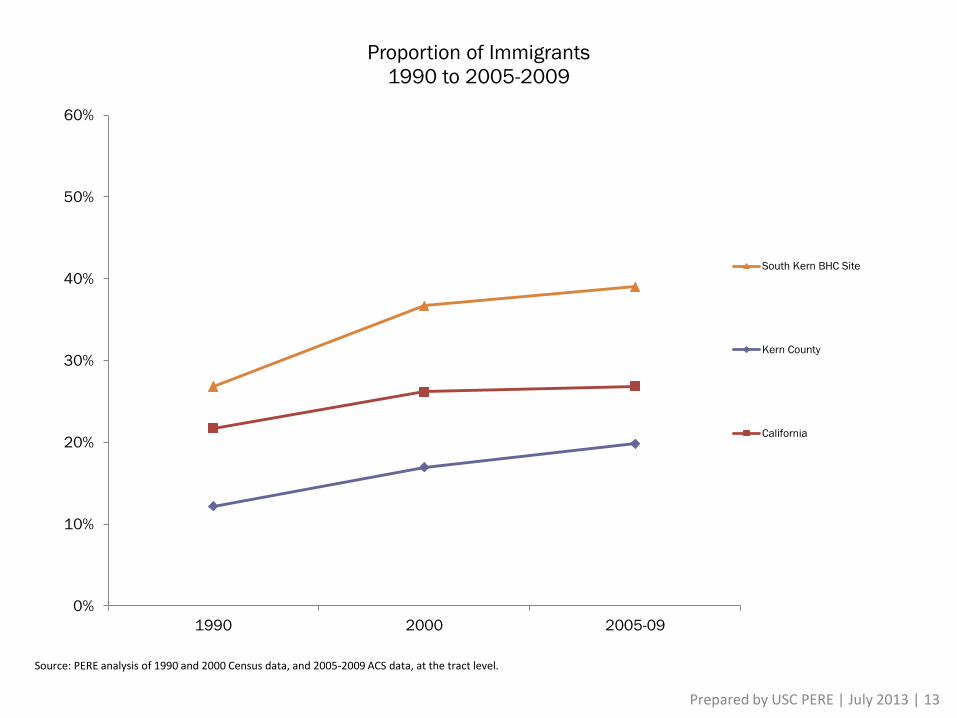
Proportion of Immigrants
1990 to 2005-2009
South Kern BHC Site
Kern County
California
Source: PERE analysis of 1990 and 2000 Census data, and 2005-2009 ACS data, at the tract level.
Prepared by USC PERE | July 2013 | 13
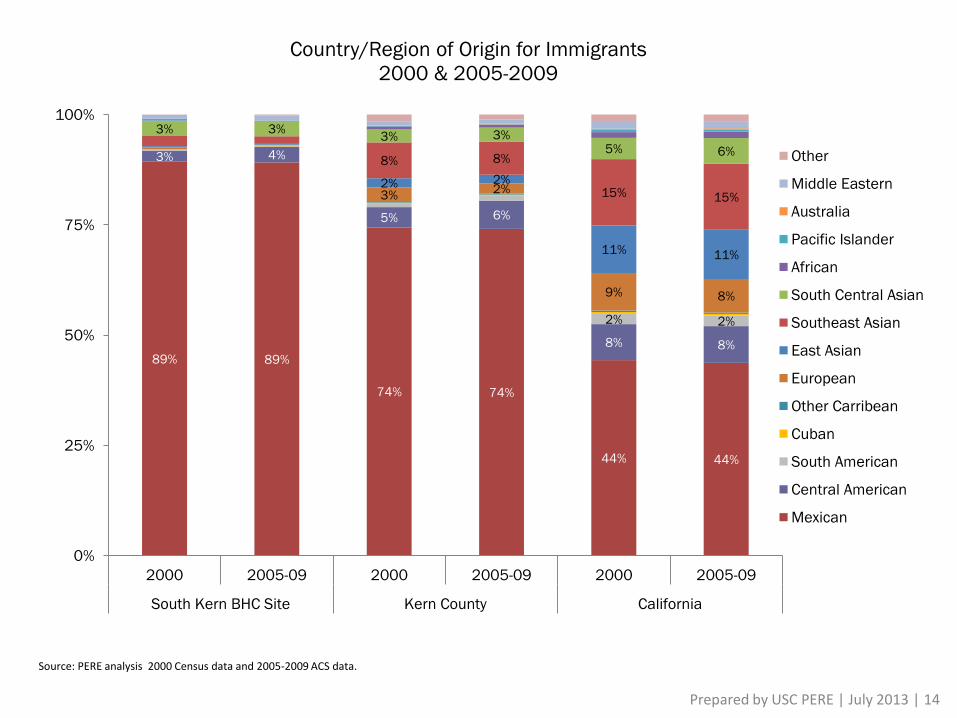
89% 89%
74% 74%
44% 44%
3% 4%
5% 6%
8% 8%
2% 2%
3% 2%
9% 8%
2% 2%
11% 11%
8% 8%
15% 15%
3% 3% 3% 3%
5% 6%
0%
25%
50%
75%
100%
2000 2005-09 2000 2005-09 2000 2005-09
South Kern BHC Site Kern County California
Country/Region of Origin for Immigrants
2000 & 2005-2009
Other
Middle Eastern
Australia
Pacific Islander
African
South Central Asian
Southeast Asian
East Asian
European
Other Carribean
Cuban
South American
Central American
Mexican
Source: PERE analysis 2000 Census data and 2005-2009 ACS data.
Prepared by USC PERE | July 2013 | 14
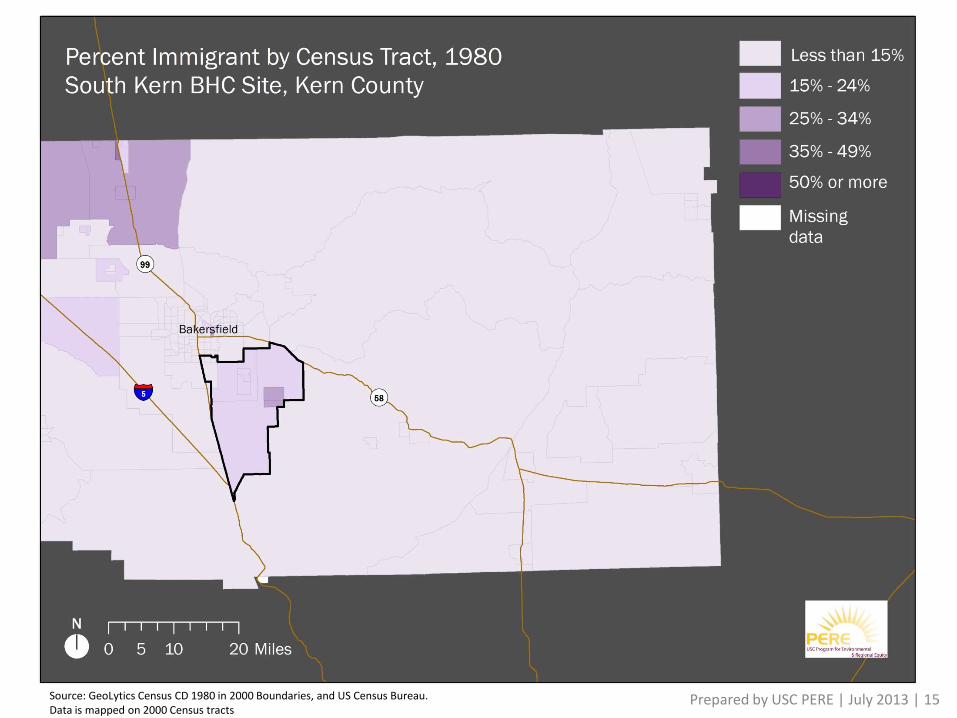
Prepared by USC PERE | July 2013 | 15 Source: GeoLytics Census CD 1980 in 2000 Boundaries, and US Census Bureau. Data is mapped on 2000 Census tracts

Prepared by USC PERE | July 2013 | 16 Source: GeoLytics Census CD 1990 Long Form in 2000 Boundaries, and US Census Bureau. Data is mapped on 2000 Census tracts
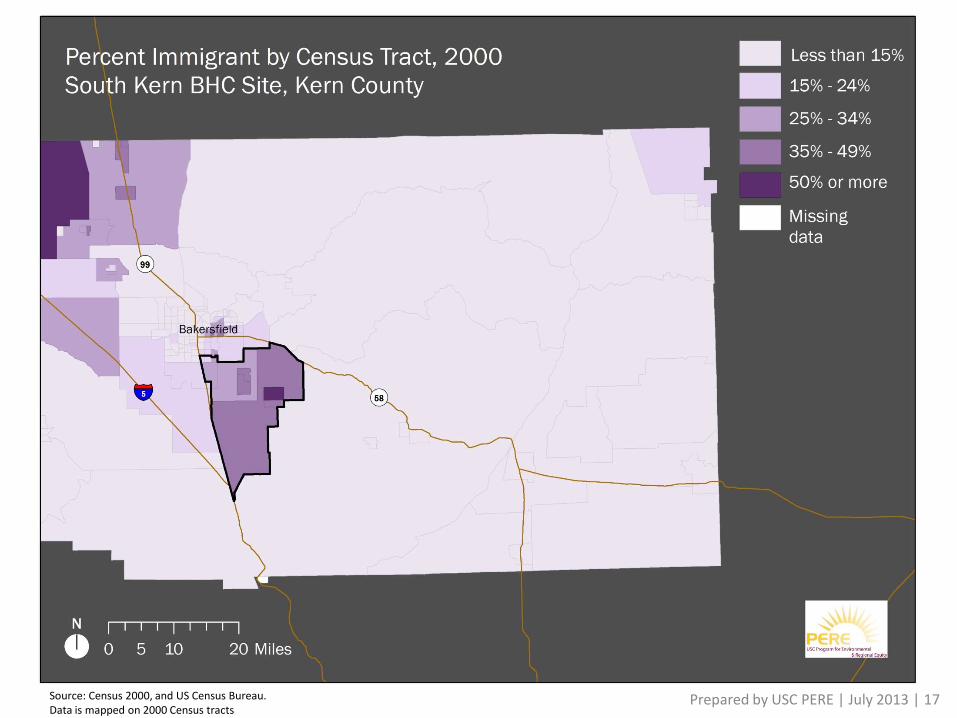
Prepared by USC PERE | July 2013 | 17 Source: Census 2000, and US Census Bureau. Data is mapped on 2000 Census tracts

Prepared by USC PERE | July 2013 | 18 Source: 2009 ACS 5 year Summary File, and US Census Bureau. Data is mapped on 2000 Census tracts

Geography of Change
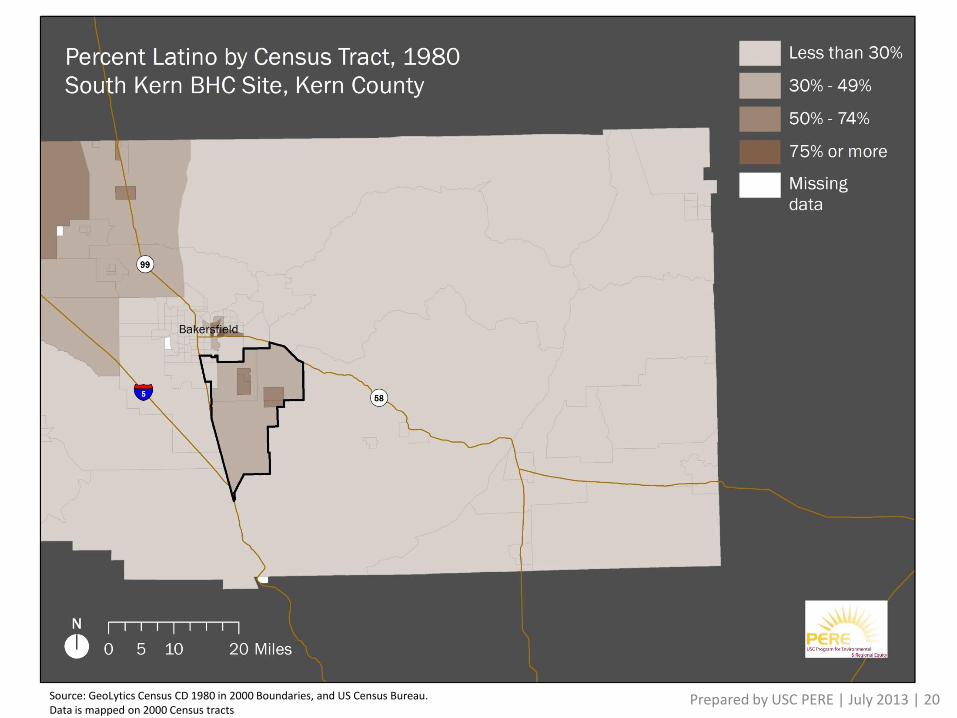
Prepared by USC PERE | July 2013 | 20 Source: GeoLytics Census CD 1980 in 2000 Boundaries, and US Census Bureau. Data is mapped on 2000 Census tracts

Prepared by USC PERE | July 2013 | 21 Source: GeoLytics Census CD 1990 Long Form in 2000 Boundaries, and US Census Bureau. Data is mapped on 2000 Census tracts
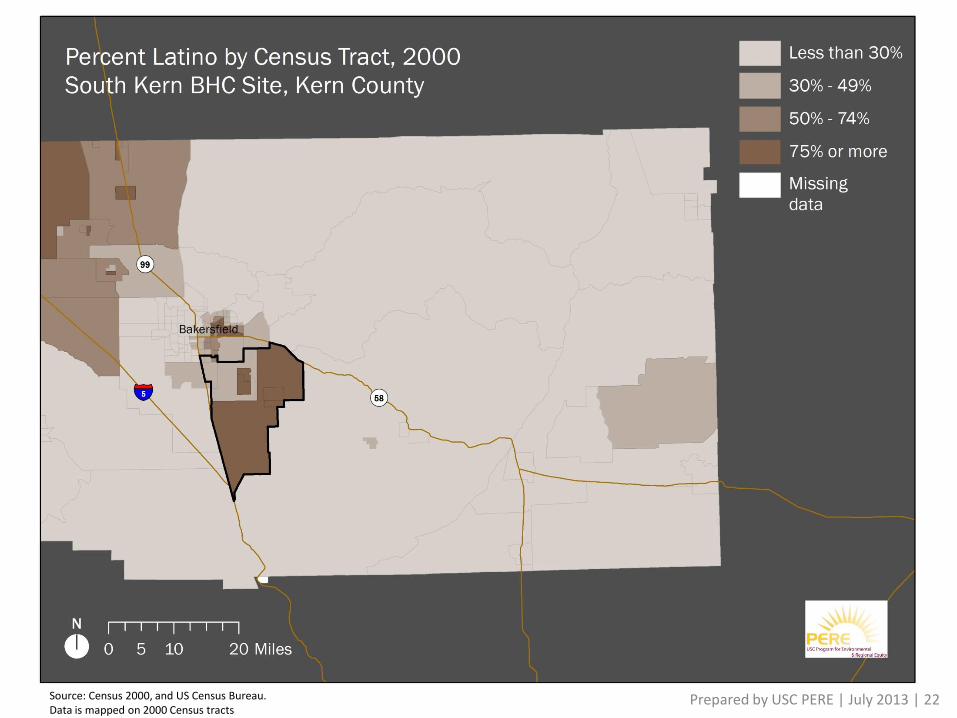
Prepared by USC PERE | July 2013 | 22 Source: Census 2000, and US Census Bureau. Data is mapped on 2000 Census tracts
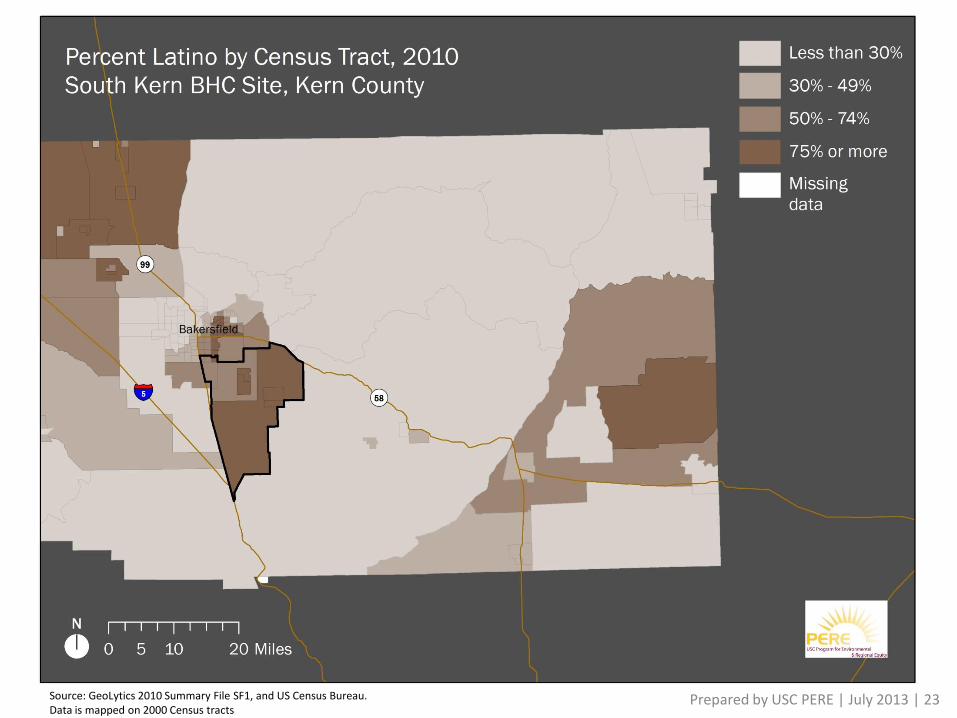
Prepared by USC PERE | July 2013 | 23 Source: GeoLytics 2010 Summary File SF1, and US Census Bureau. Data is mapped on 2000 Census tracts

Prepared by USC PERE | July 2013 | 24 Source: GeoLytics Census CD 1980 in 2000 Boundaries, and US Census Bureau. Data is mapped on 2000 Census tracts
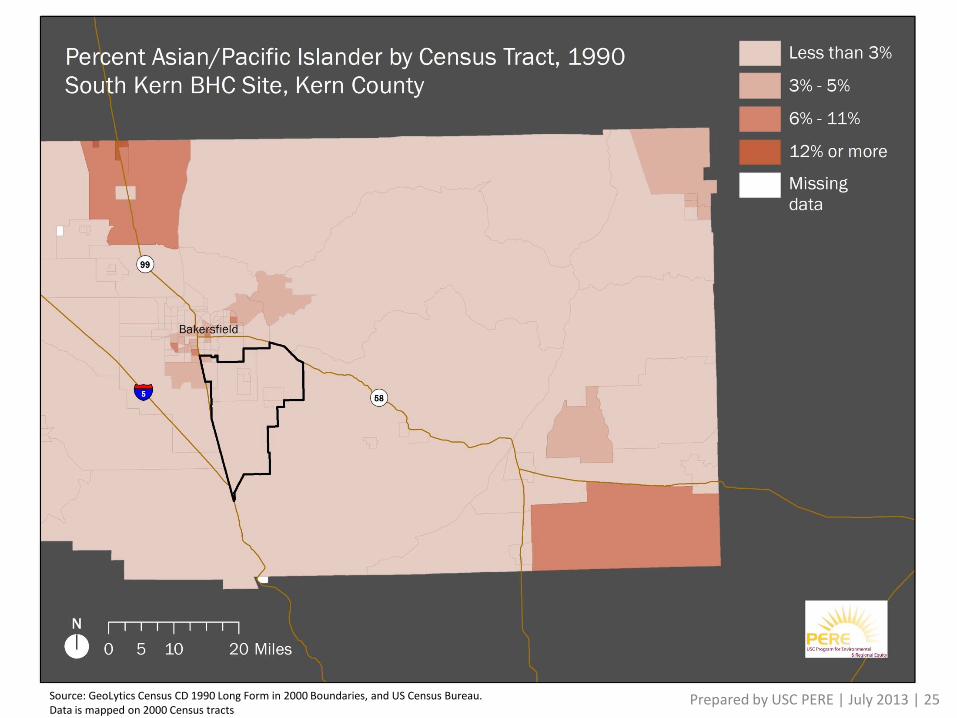
Prepared by USC PERE | July 2013 | 25 Source: GeoLytics Census CD 1990 Long Form in 2000 Boundaries, and US Census Bureau. Data is mapped on 2000 Census tracts
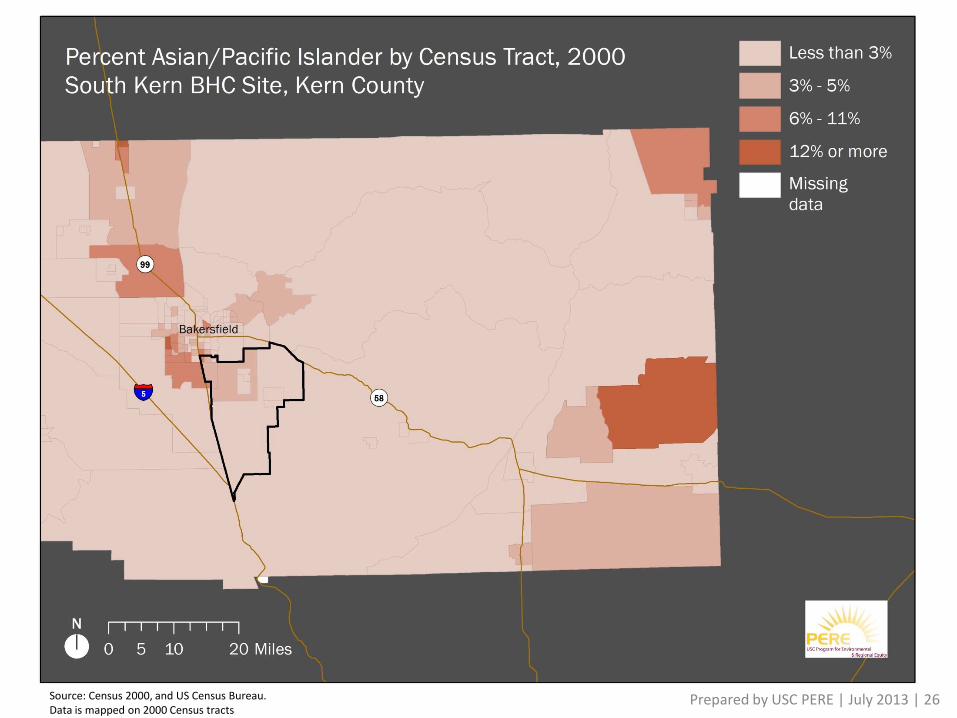
Prepared by USC PERE | July 2013 | 26 Source: Census 2000, and US Census Bureau. Data is mapped on 2000 Census tracts
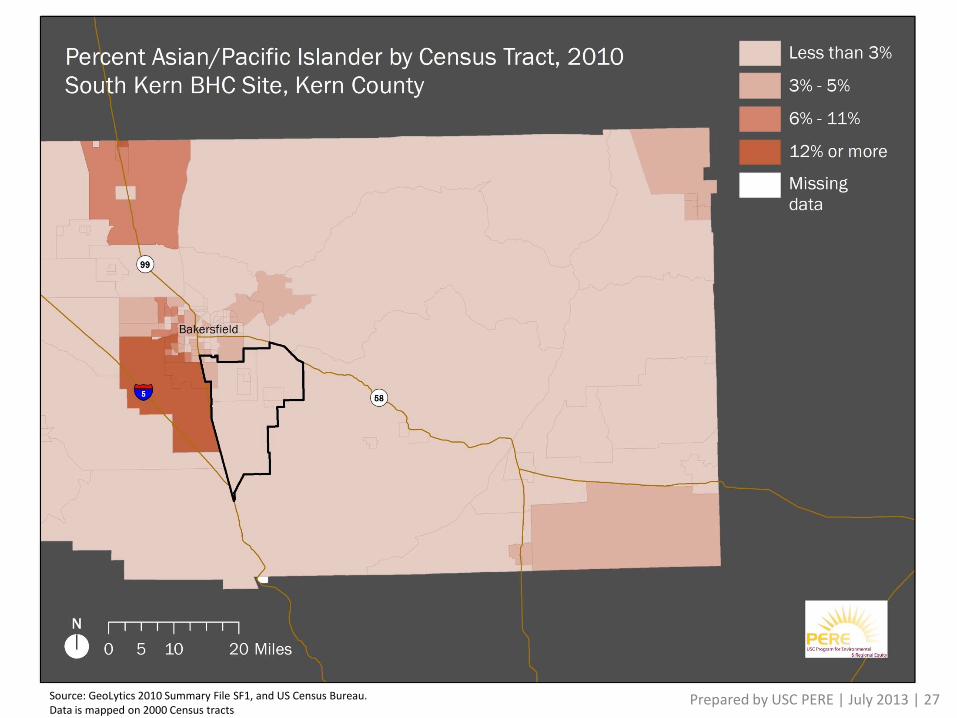
Prepared by USC PERE | July 2013 | 27 Source: GeoLytics 2010 Summary File SF1, and US Census Bureau. Data is mapped on 2000 Census tracts

Prepared by USC PERE | July 2013 | 28 Source: GeoLytics Census CD 1980 in 2000 Boundaries, and US Census Bureau. Data is mapped on 2000 Census tracts
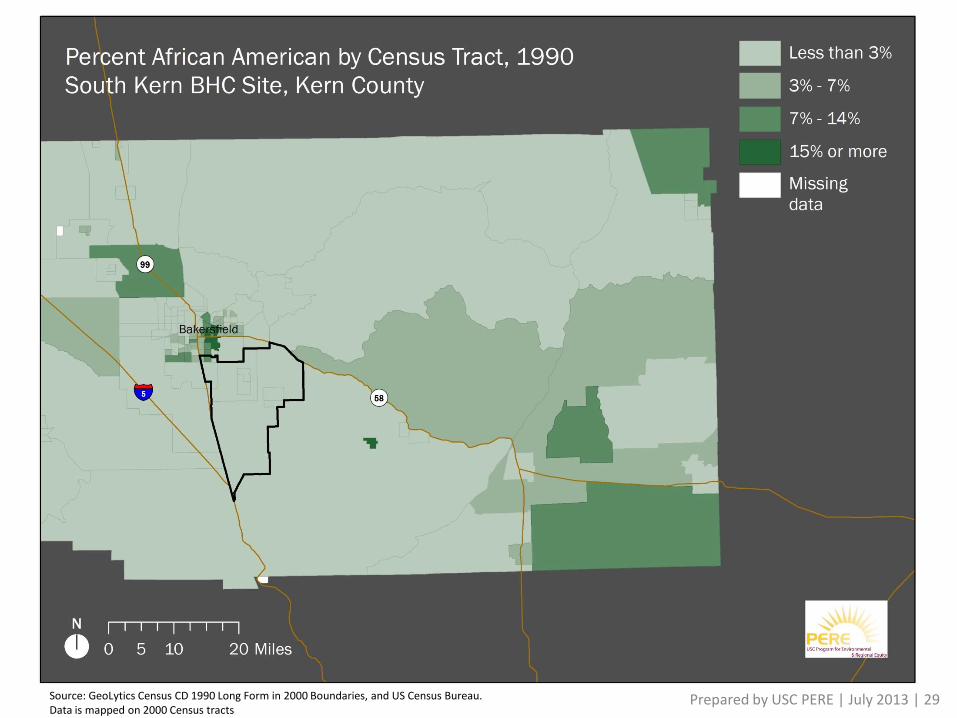
Prepared by USC PERE | July 2013 | 29 Source: GeoLytics Census CD 1990 Long Form in 2000 Boundaries, and US Census Bureau. Data is mapped on 2000 Census tracts
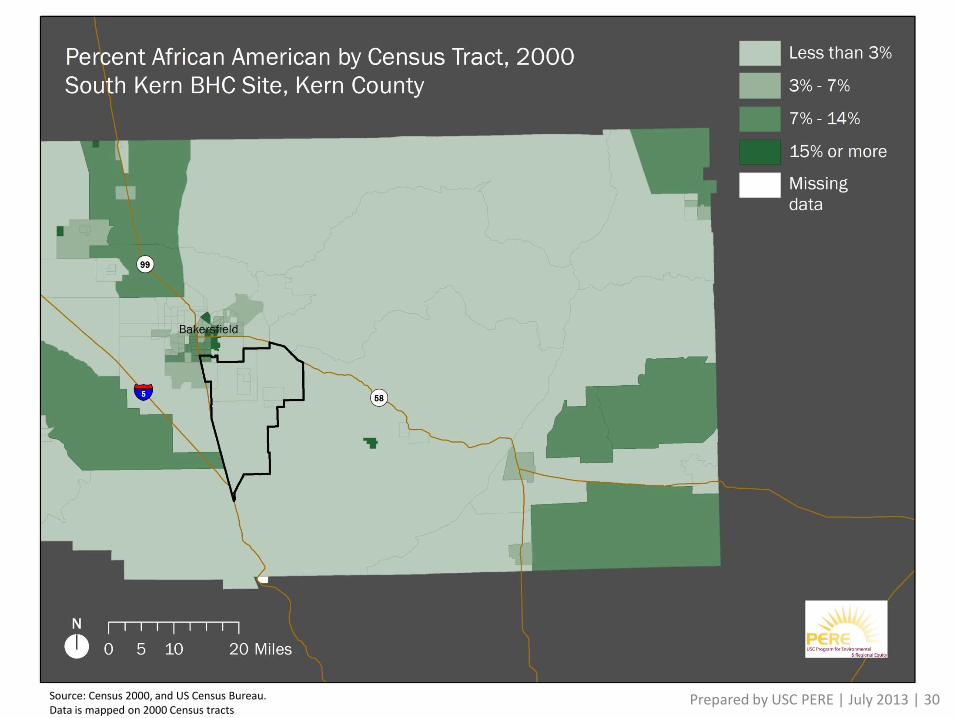
Prepared by USC PERE | July 2013 | 30 Source: Census 2000, and US Census Bureau. Data is mapped on 2000 Census tracts
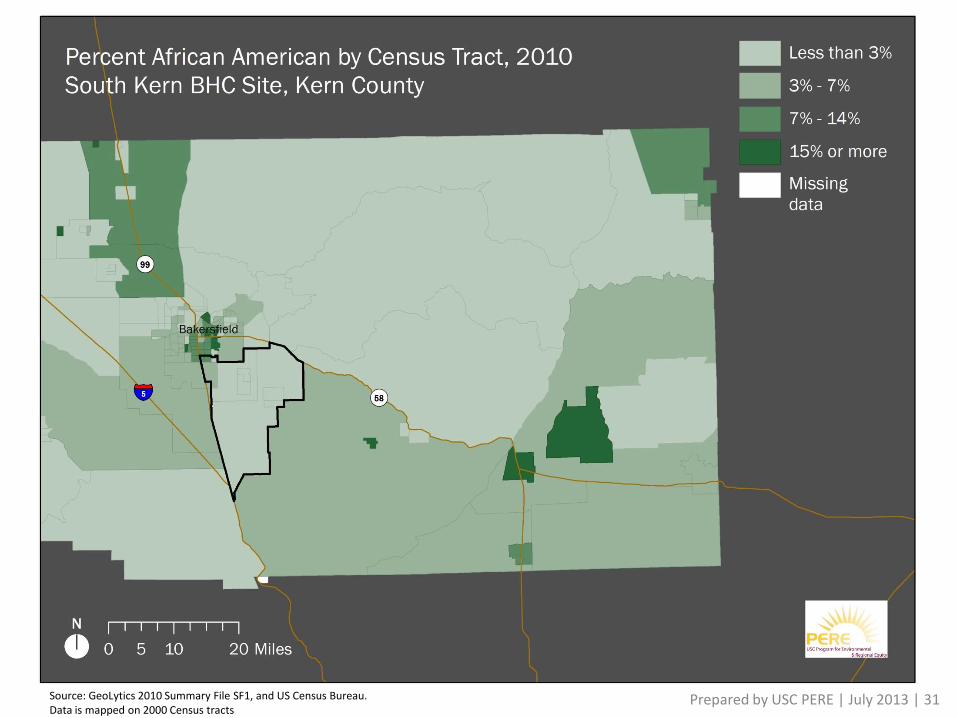
Prepared by USC PERE | July 2013 | 31 Source: GeoLytics 2010 Summary File SF1, and US Census Bureau. Data is mapped on 2000 Census tracts
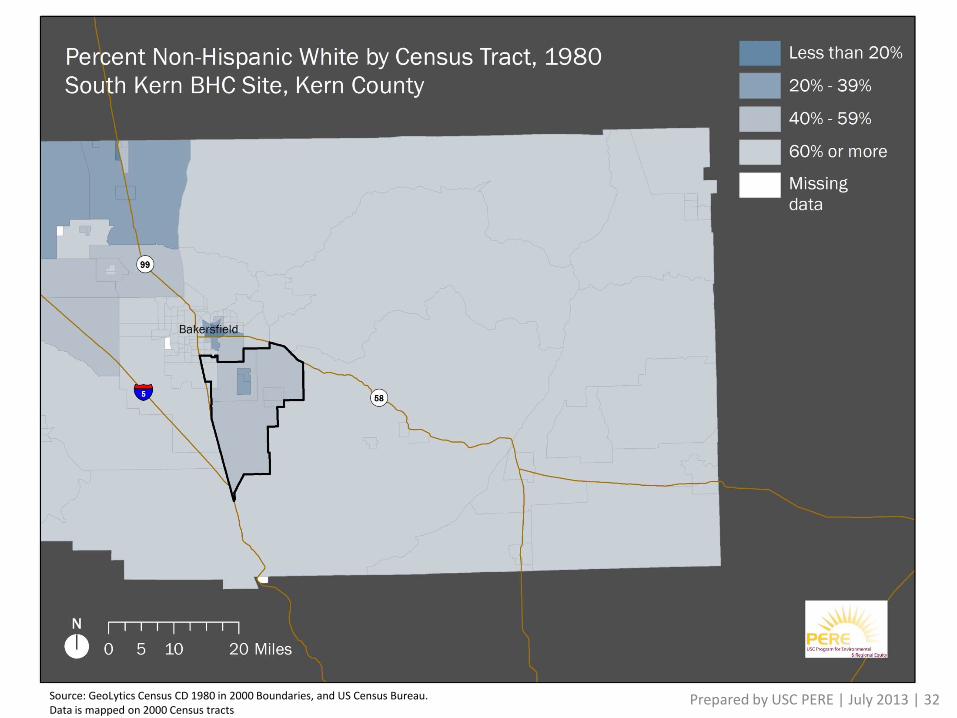
Prepared by USC PERE | July 2013 | 32 Source: GeoLytics Census CD 1980 in 2000 Boundaries, and US Census Bureau. Data is mapped on 2000 Census tracts
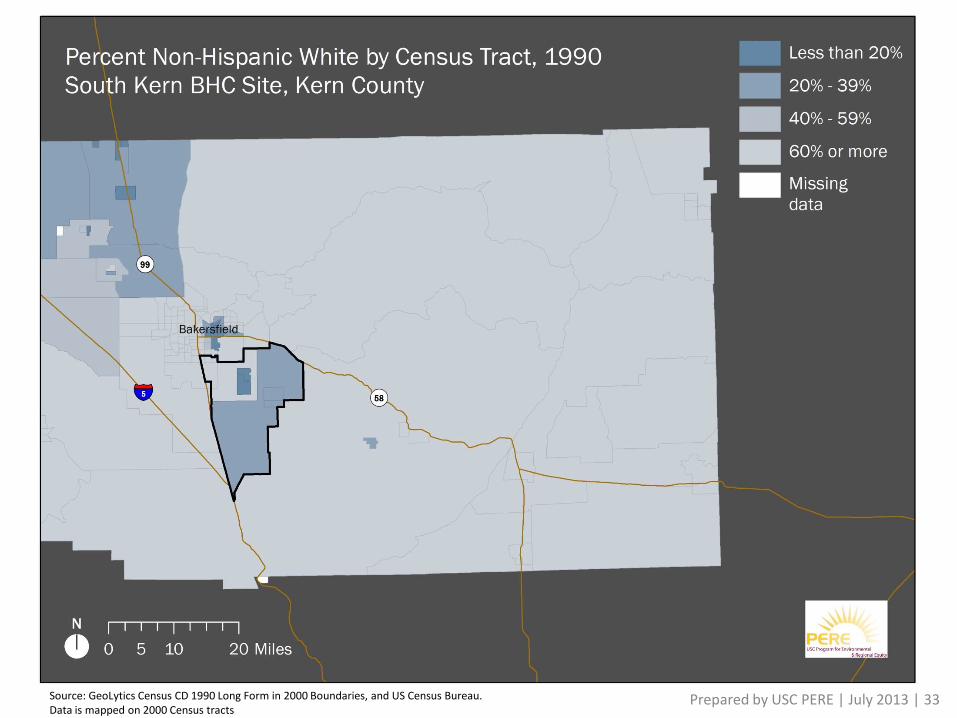
Prepared by USC PERE | July 2013 | 33 Source: GeoLytics Census CD 1990 Long Form in 2000 Boundaries, and US Census Bureau. Data is mapped on 2000 Census tracts

Prepared by USC PERE | July 2013 | 34 Source: Census 2000, and US Census Bureau. Data is mapped on 2000 Census tracts

Prepared by USC PERE | July 2013 | 35 Source: GeoLytics 2010 Summary File SF1, and US Census Bureau. Data is mapped on 2000 Census tracts
Generational Trends
12% 10% 8% 6% 4% 2% 0% 2% 4% 6% 8% 10% 12%
Under 5 years
5 to 9 years
10 to 14 years
15 to 19 years
20 to 24 years
25 to 29 years
30 to 34 years
35 to 39 years
40 to 44 years
45 to 49 years
50 to 54 years
55 to 59 years
60 to 64 years
65 to 69 years
70 to 74 years
75 to 79 years
80 to 84 years
85 years and over
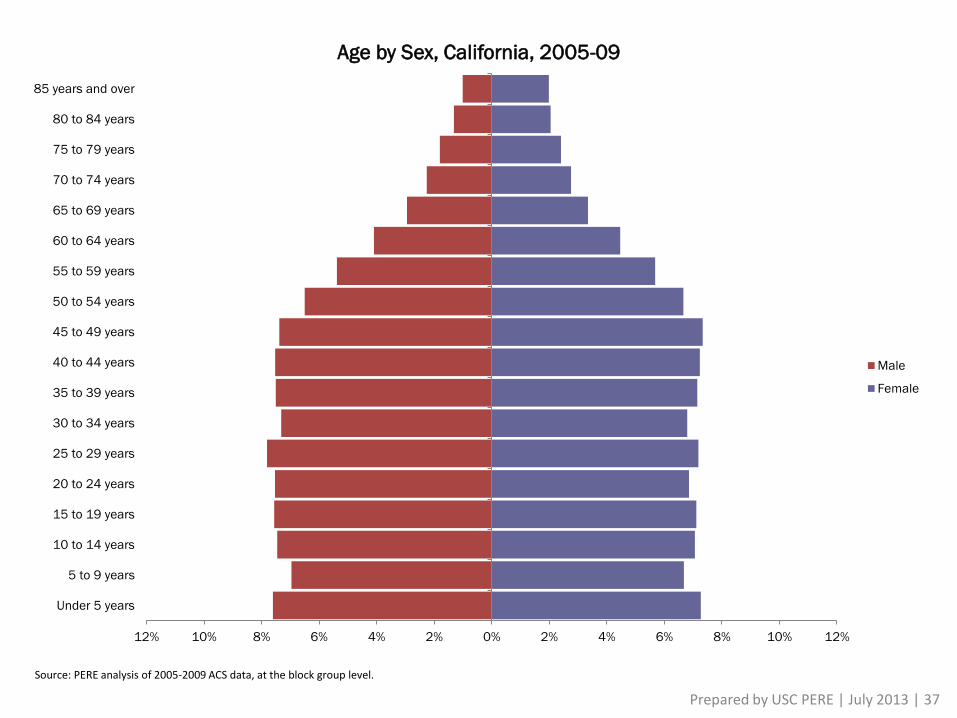
Age by Sex, California, 2005-09
Male
Female
Source: PERE analysis of 2005-2009 ACS data, at the block group level.
Prepared by USC PERE | July 2013 | 37
12% 10% 8% 6% 4% 2% 0% 2% 4% 6% 8% 10% 12%
Under 5 years
5 to 9 years
10 to 14 years
15 to 19 years
20 to 24 years
25 to 29 years
30 to 34 years
35 to 39 years
40 to 44 years
45 to 49 years
50 to 54 years
55 to 59 years
60 to 64 years
65 to 69 years
70 to 74 years
75 to 79 years
80 to 84 years
85 years and over
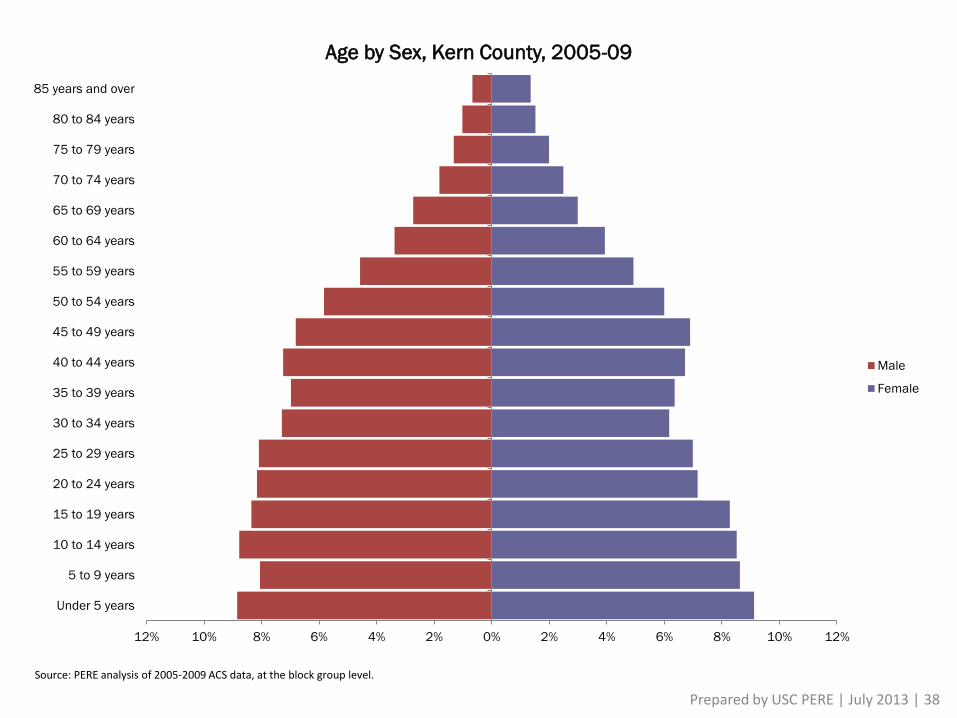
Age by Sex, Kern County, 2005-09
Male
Female
Source: PERE analysis of 2005-2009 ACS data, at the block group level.
Prepared by USC PERE | July 2013 | 38
12% 10% 8% 6% 4% 2% 0% 2% 4% 6% 8% 10% 12%
Under 5 years
5 to 9 years
10 to 14 years
15 to 19 years
20 to 24 years
25 to 29 years
30 to 34 years
35 to 39 years
40 to 44 years
45 to 49 years
50 to 54 years
55 to 59 years
60 to 64 years
65 to 69 years
70 to 74 years
75 to 79 years
80 to 84 years
85 years and over
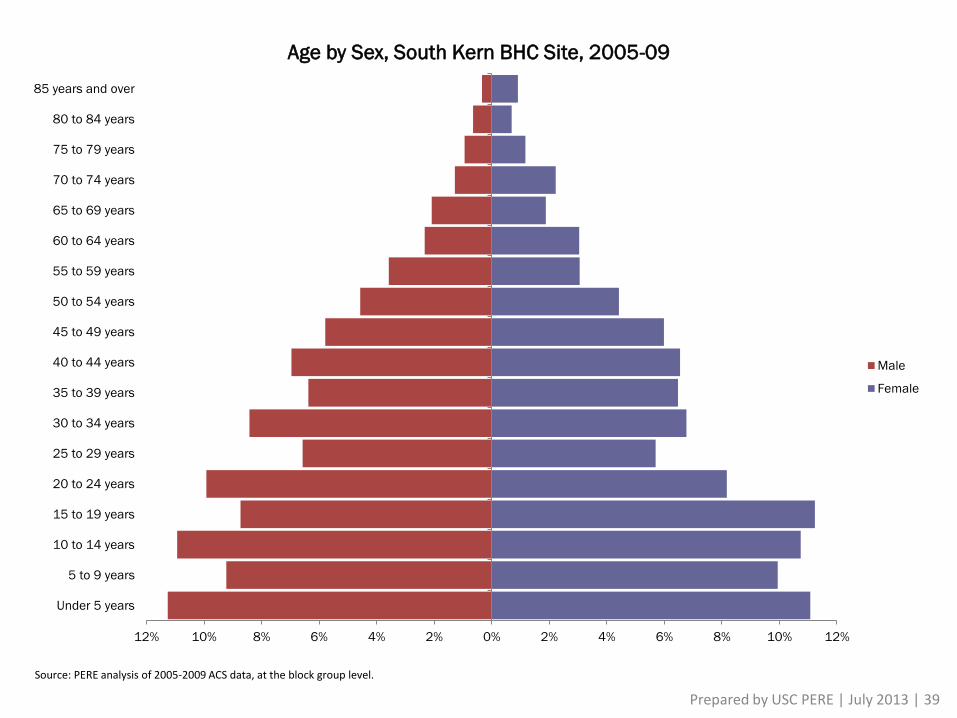
Age by Sex, South Kern BHC Site, 2005-09
Male
Female
Source: PERE analysis of 2005-2009 ACS data, at the block group level.
Prepared by USC PERE | July 2013 | 39

22%
41%
19%
43%
22%
39%
25% 30%
62%
55%
65%
52%
63%
57%
64%
64%
16%
4%
16%
5%
15%
4% 11%
6%
0%
25%
50%
75%
100%
White Latino Asian/Pacific
Islander
Black White Latino Asian/Pacific
Islander
Black
South Kern BHC Site Kern County
Age Distribution by Race/Ethnicity
2005-2009
Greater
than 64
18 to
64
years
old
Less
than 18
Source: PERE analysis of 2005-2009 ACS data
Prepared by USC PERE | July 2013 | 40

50
55
60
65
70
75
80
85
90
95
100
1990 2000 2005-09
Dependency Ratio*
1990 to 2005-2009
South Kern BHC Site
Kern County
California
Source: PERE analysis of 1990 and 2000 Census data, and 2005-2009 ACS data, at the block group level.
*The Dependency Ratio is the population above the age of 64 and below the age of 18 as a share of the working age population (ages 18-64).
Prepared by USC PERE | July 2013 | 41

7.8%
30.0% 30.4%
85.7%
58.2%
48.9%
3.1%
10.5%
3.7% 5.5% 6.4%
3.2% 3.9%
0%
25%
50%
75%
100%
South Kern BHC Site Kern County California
% o
f A
ll Y
ou
th
Youth by Race/Ethnicity*
2005-2009
Other
African American or Black
Asian or Pacific Islander
Latino
White
* "Youth" includes everyone less than 18 years old Source: PERE analysis of 1990 and 2000 Census data, and 2005-2009 ACS data, at the tract level.
Prepared by USC PERE | July 2013 | 42
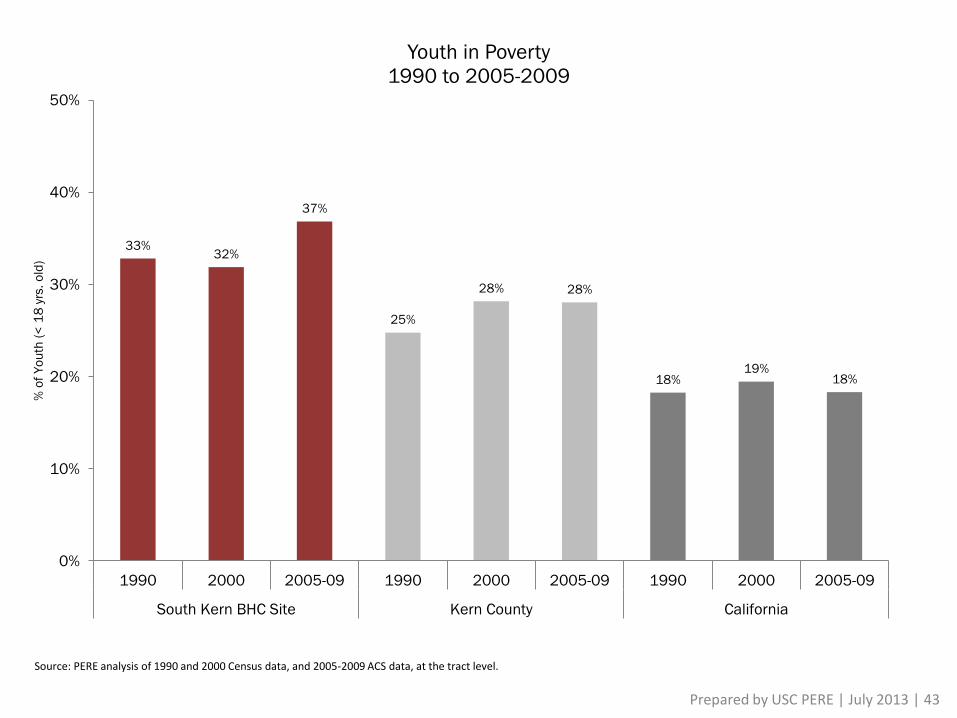
33% 32%
37%
25%
28% 28%
18% 19%
18%
0%
10%
20%
30%
40%
50%
1990 2000 2005-09 1990 2000 2005-09 1990 2000 2005-09
South Kern BHC Site Kern County California
% o
f Y
ou
th (
< 1
8 y
rs.
old
)
Youth in Poverty
1990 to 2005-2009
Source: PERE analysis of 1990 and 2000 Census data, and 2005-2009 ACS data, at the tract level.
Prepared by USC PERE | July 2013 | 43
0%
10%
20%
30%
40%
50%
1990 2000 2005-09 1990 2000 2005-09 1990 2000 2005-09
South Kern BHC Site Kern County California
% o
f A
ge
Gro
up
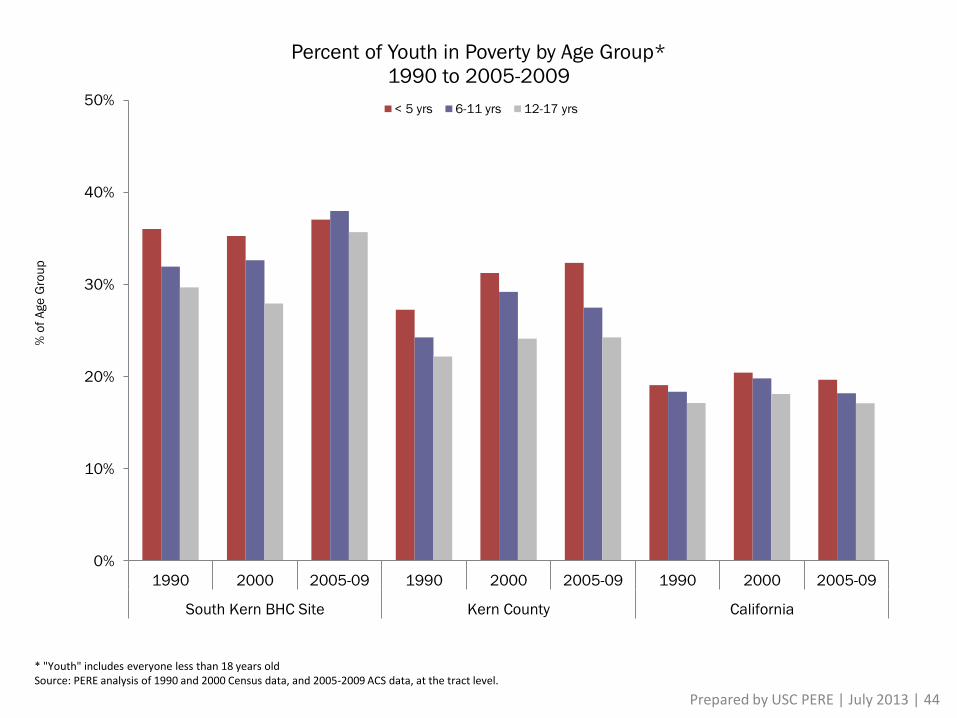
Percent of Youth in Poverty by Age Group*
1990 to 2005-2009
< 5 yrs 6-11 yrs 12-17 yrs
* "Youth" includes everyone less than 18 years old Source: PERE analysis of 1990 and 2000 Census data, and 2005-2009 ACS data, at the tract level.
Prepared by USC PERE | July 2013 | 44

37.0%
32.3%
19.6%
38.0%
27.5%
18.2%
35.7%
24.2%
17.1%
0%
10%
20%
30%
40%
50%
South Kern BHC Site Kern County California
% o
f A
ge
Gro
up
Percent of Youth in Poverty by Age Group*
2005-2009
< 5 yrs 6-11 yrs 12-17 yrs
* "Youth" includes everyone less than 18 years old Source: PERE analysis of 1990 and 2000 Census data, and 2005-2009 ACS data, at the tract level.
Prepared by USC PERE | March 19, 2013 | 45
Economic Indicators

40.7%
46.9% 47.6%
29.0%
34.5% 33.9%
21.4% 24.1% 22.9%
0%
10%
20%
30%
40%
50%
60%
70%
80%
90%
100%
1990 2000 2005-2009
% o
f P
op
ula
tio
n
Percent of Population Below 150 Percent Federal Poverty Line (FPL)*
1990 to 2005-2009
South Kern BHC Site Kern County California
*Includes all persons living in households with household incomes below 150 percent of the FPL. Source: PERE analysis of 1990 and 2000 Census data, and 2005-2009 ACS data, at the tract level.
Prepared by USC PERE | July 2013 | 47
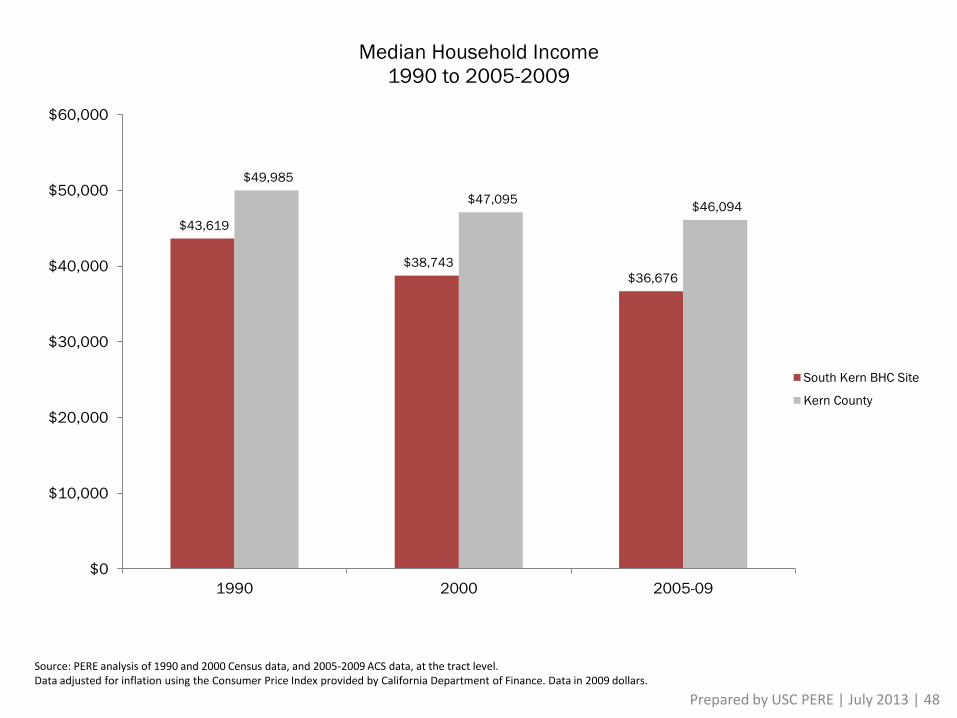
$43,619
$38,743
$36,676
$49,985
$47,095 $46,094
$0
$10,000
$20,000
$30,000
$40,000
$50,000
$60,000
1990 2000 2005-09
Median Household Income
1990 to 2005-2009
South Kern BHC Site
Kern County
Source: PERE analysis of 1990 and 2000 Census data, and 2005-2009 ACS data, at the tract level. Data adjusted for inflation using the Consumer Price Index provided by California Department of Finance. Data in 2009 dollars.
Prepared by USC PERE | July 2013 | 48
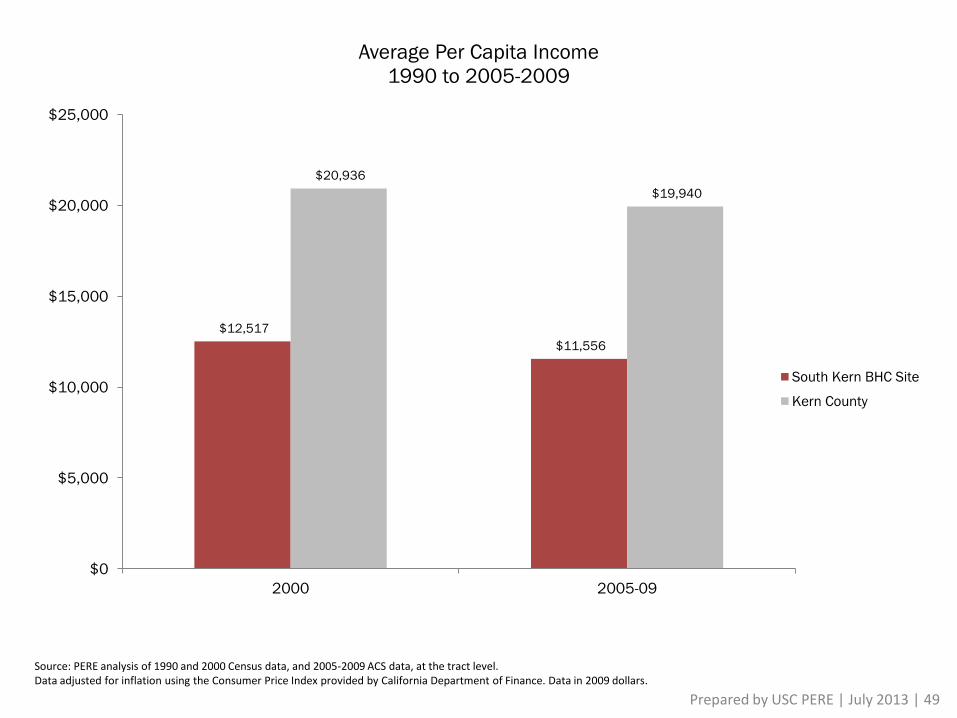
$12,517
$11,556
$20,936
$19,940
$0
$5,000
$10,000
$15,000
$20,000
$25,000
2000 2005-09
Average Per Capita Income
1990 to 2005-2009
South Kern BHC Site
Kern County
Source: PERE analysis of 1990 and 2000 Census data, and 2005-2009 ACS data, at the tract level. Data adjusted for inflation using the Consumer Price Index provided by California Department of Finance. Data in 2009 dollars.
Prepared by USC PERE | July 2013 | 49

14%
18%
12% 12%
8% 8%
30% 29% 31%
28%
22%
19%
10% 11%
15%
12% 13%
10%
40%
34%
36% 35%
22%
20%
0%
10%
20%
30%
40%
50%
60%
2000 2005-09 2000 2005-09 2000 2005-09
South Kern BHC Site Kern County California
Percent Poverty by Race/Ethnicity
2000 & 2005-2009
White Latino Asian/Pacific Islander Black
Source: PERE analysis of 2000 Census data and 2005-2009 ACS data
Prepared by USC PERE | July 2013 | 50
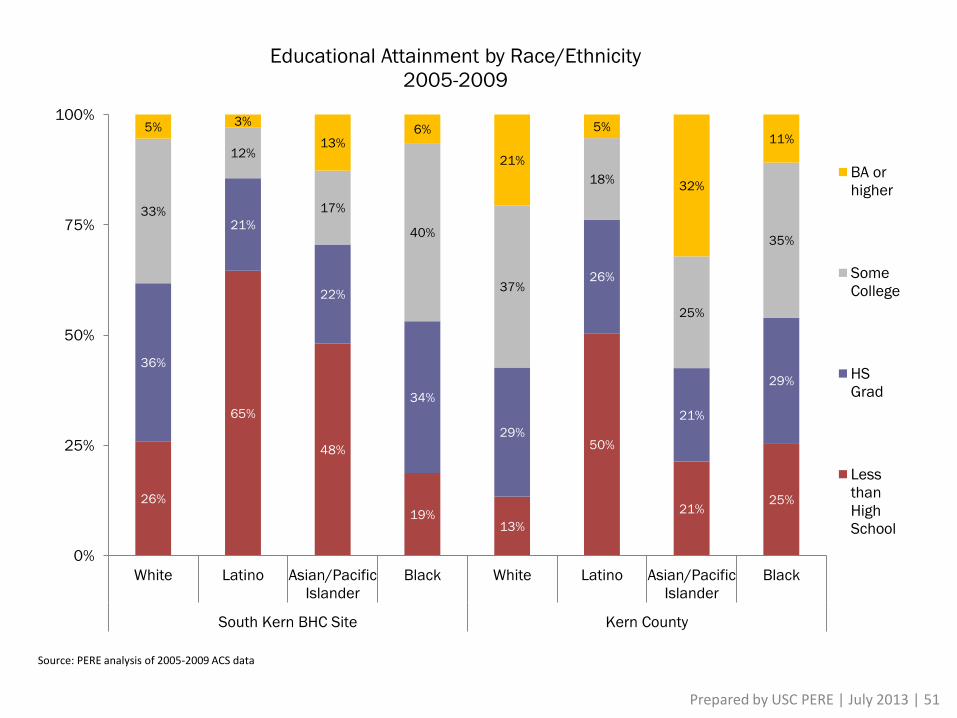
26%
65%
48%
19% 13%
50%
21% 25%
36%
21%
22%
34%
29%
26%
21%
29%
33%
12%
17%
40%
37%
18%
25%
35%
5% 3%
13% 6%
21%
5%
32%
11%
0%
25%
50%
75%
100%
White Latino Asian/Pacific
Islander
Black White Latino Asian/Pacific
Islander
Black
South Kern BHC Site Kern County
Educational Attainment by Race/Ethnicity
2005-2009
BA or
higher
Some
College
HS
Grad
Less
than
High
School
Source: PERE analysis of 2005-2009 ACS data
Prepared by USC PERE | July 2013 | 51
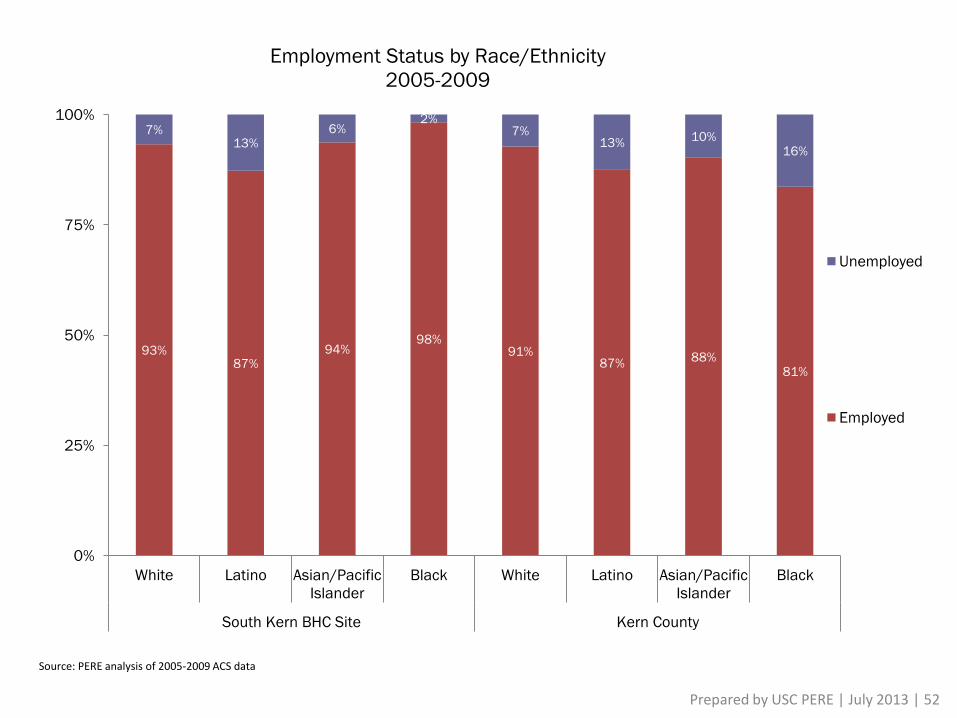
93% 87%
94% 98%
91% 87%
88% 81%
7% 13%
6% 2%
7% 13%
10% 16%
0%
25%
50%
75%
100%
White Latino Asian/Pacific
Islander
Black White Latino Asian/Pacific
Islander
Black
South Kern BHC Site Kern County
Employment Status by Race/Ethnicity
2005-2009
Unemployed
Employed
Source: PERE analysis of 2005-2009 ACS data
Prepared by USC PERE | July 2013 | 52

25%
9% 16% 14%
36%
13%
38%
30%
14%
15%
15% 24%
15%
20%
19% 29%
26%
16%
27%
35%
26%
20%
22% 21%
28%
11% 17%
6%
14% 14%
6%
13% 12%
13%
4% 8%
19% 18%
26%
12% 10% 16%
11% 12%
0%
25%
50%
75%
100%
White Latino Asian/Pacific
Islander
Black White Latino Asian/Pacific
Islander
Black
South Kern BHC Site Kern County
Occupation by Race/Ethnicity
2005-2009
Production
Construction
Farming
Sales
Service
Management/
Professional
Source: PERE analysis 2005-2009 ACS data.
Prepared by USC PERE | July 2013 | 53

70%
97%
72% 67% 54% 83%
48% 25%
65% 22% 43% 68%
35%
30%
3%
28% 33%
46%
17%
52% 75%
35%
78%
57% 32%
65%
0
1,000
2,000
3,000
4,000
5,000
6,000
7,000
8,000
Industry by Sex, 2005-2009
Female Male
6,867
2,312
1,138 1,164
2,257
1,590
367 599
1,315
3,240
1,566
1,061
567
Source: PERE analysis of 2005-2009 ACS data.
Prepared by USC PERE | July 2013 | 54

Housing Equity Indicators
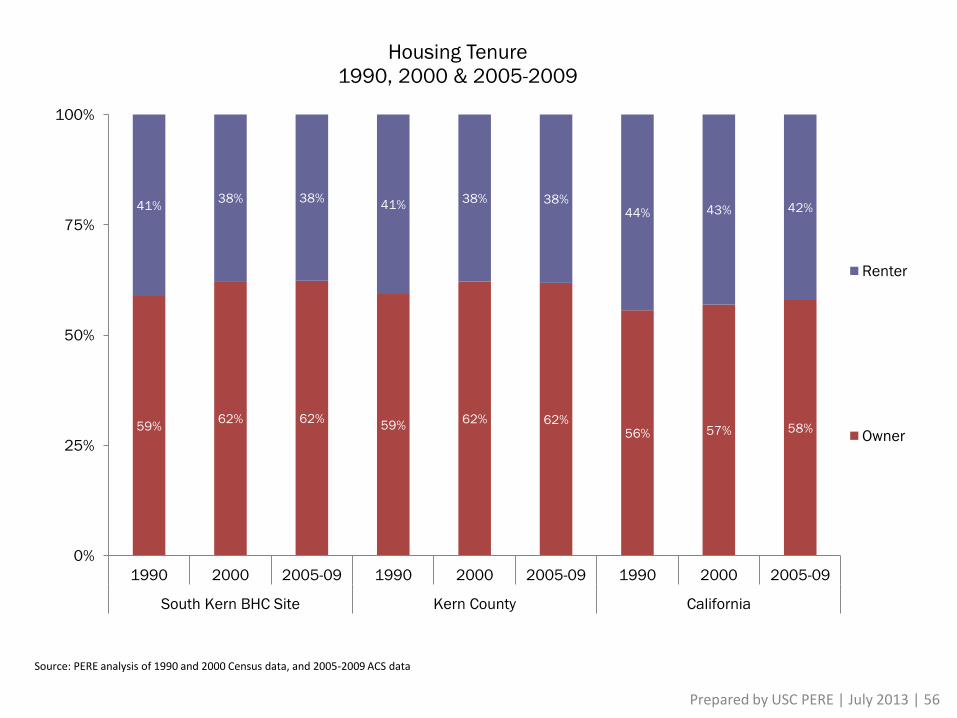
59% 62% 62%
59% 62% 62%
56% 57% 58%
41% 38% 38%
41% 38% 38%
44% 43% 42%
0%
25%
50%
75%
100%
1990 2000 2005-09 1990 2000 2005-09 1990 2000 2005-09
South Kern BHC Site Kern County California
Housing Tenure
1990, 2000 & 2005-2009
Renter
Owner
Source: PERE analysis of 1990 and 2000 Census data, and 2005-2009 ACS data
Prepared by USC PERE | July 2013 | 56

69%
61% 61% 60%
69%
54%
67%
39%
31%
39% 39% 40%
31%
46%
33%
61%
0%
25%
50%
75%
100%
White Latino Asian/Pacific
Islander
Black White Latino Asian/Pacific
Islander
Black
South Kern BHC Site Kern County
Housing Tenure by Race/Ethnicity
2005-2009
Renter
Owner
Source: PERE analysis of 2005-2009 ACS data
Prepared by USC PERE | July 2013 | 57
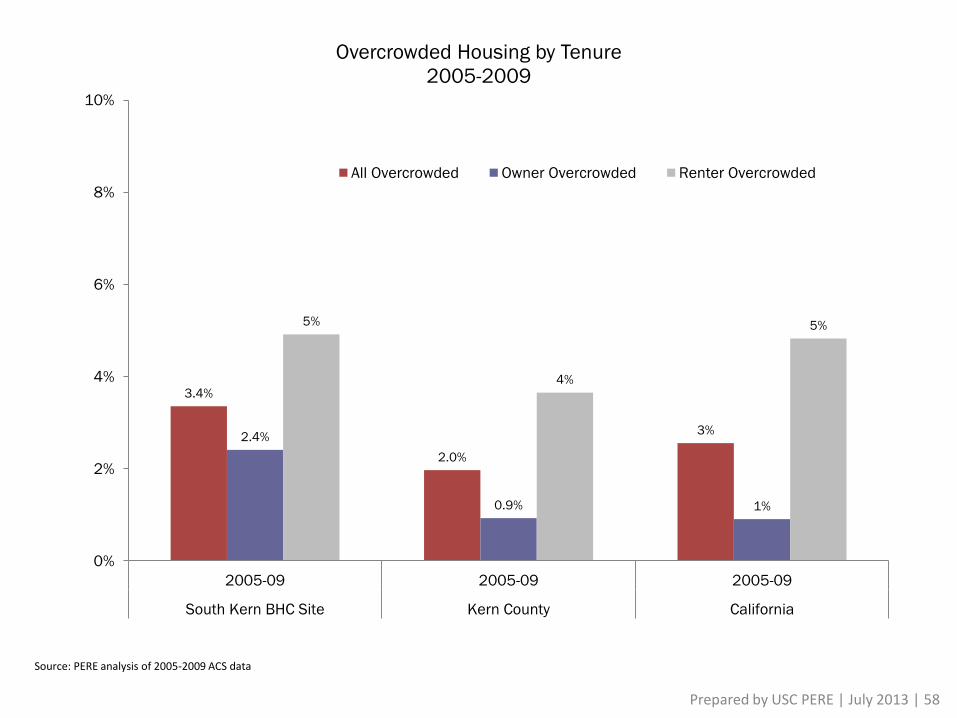
3.4%
2.0%
3% 2.4%
0.9% 1%
5%
4%
5%
0%
2%
4%
6%
8%
10%
2005-09 2005-09 2005-09
South Kern BHC Site Kern County California
Overcrowded Housing by Tenure
2005-2009
All Overcrowded Owner Overcrowded Renter Overcrowded
Source: PERE analysis of 2005-2009 ACS data
Prepared by USC PERE | July 2013 | 58
Health Equity Indicators

SOUTH KERN BHC
Source: California Health Interview Survey. CHIS 2009 BHC Health Profile. Los Angeles, CA: UCLA Center for Health Policy Research, 2011.
• 40% of adults are
uninsured versus 25% in
Kern County & 22%* in CA
• 25% of adults are insured
by private coverage /
employer versus 45%* in
Kern County & 61%* in CA
• 1% of children are
uninsured versus 6%* in
Kern County & 5%* in CA
* Denotes statistically significant difference from BHC site estimate.
Prepared by USC PERE | July 2013 | 60
Environmental Justice Indicators

Source: Rachel Morello-Frosch (UC Berkeley), Manuel Pastor (USC), and James Sadd (Occidental College); analysis by USC's Program for Environmental and Regional Equity (PERE).
Prepared by USC PERE | July 2013 | 62
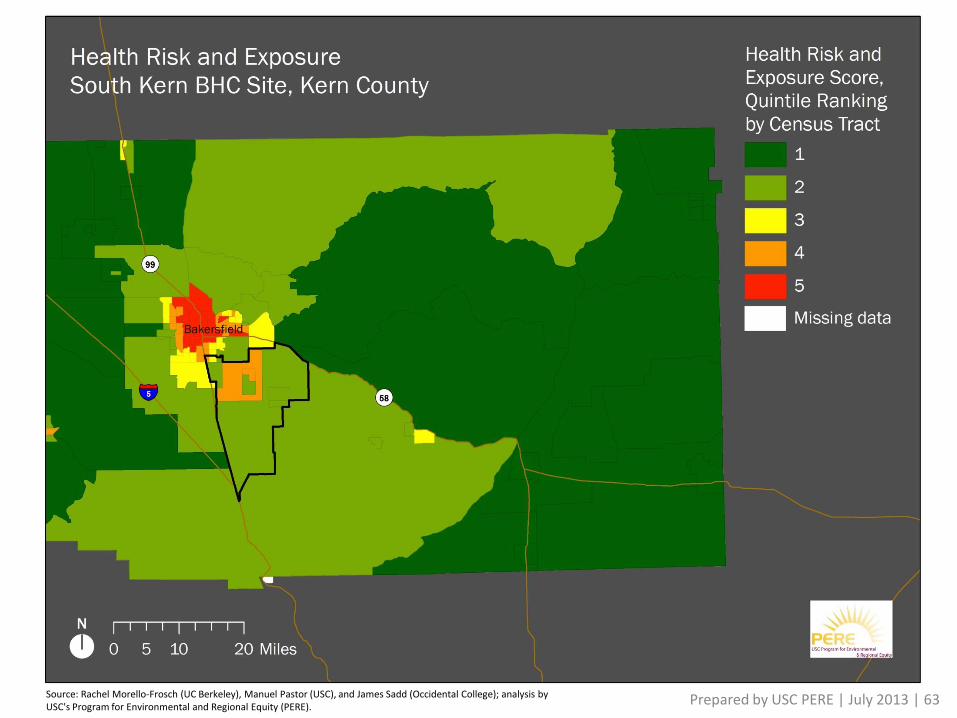
Source: Rachel Morello-Frosch (UC Berkeley), Manuel Pastor (USC), and James Sadd (Occidental College); analysis by USC's Program for Environmental and Regional Equity (PERE).
Prepared by USC PERE | July 2013 | 63
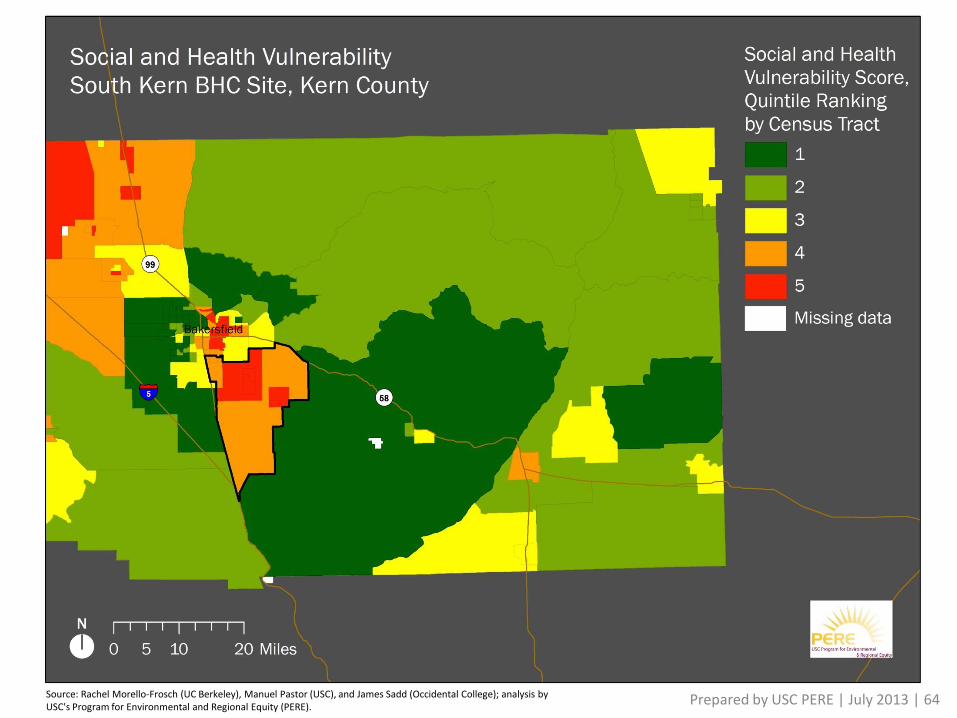
Source: Rachel Morello-Frosch (UC Berkeley), Manuel Pastor (USC), and James Sadd (Occidental College); analysis by USC's Program for Environmental and Regional Equity (PERE).
Prepared by USC PERE | July 2013 | 64

CUMULATIVE IMPACT
Prepared by USC PERE | July 2013 | 65
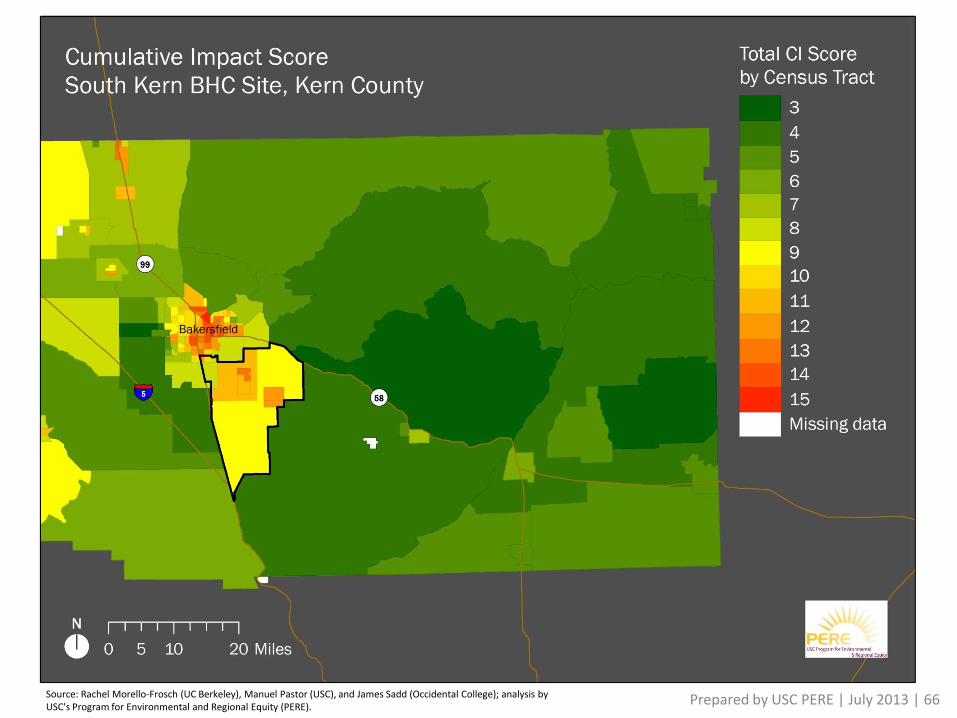
Source: Rachel Morello-Frosch (UC Berkeley), Manuel Pastor (USC), and James Sadd (Occidental College); analysis by USC's Program for Environmental and Regional Equity (PERE).
Prepared by USC PERE | July 2013 | 66

Regional Economic Trends
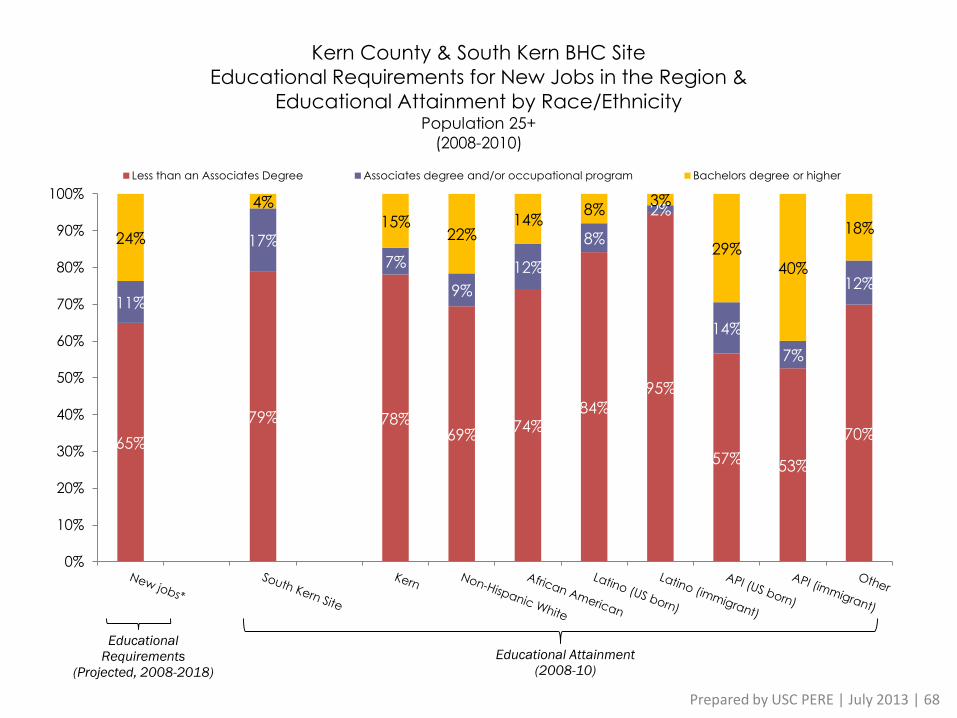
65%
79% 78%69%
74%84%
95%
57% 53%
70%
11%
17%
7%
9%
12%
8%
2%
14%
7%
12%
24%
4%
15%22%
14%8%
3%
29%
40%
18%
0%
10%
20%
30%
40%
50%
60%
70%
80%
90%
100%
Kern County & South Kern BHC Site
Educational Requirements for New Jobs in the Region &
Educational Attainment by Race/EthnicityPopulation 25+
(2008-2010)
Less than an Associates Degree Associates degree and/or occupational program Bachelors degree or higher
Educational
Requirements
(Projected, 2008-2018)
Educational Attainment
(2008-10)
Prepared by USC PERE | July 2013 | 68
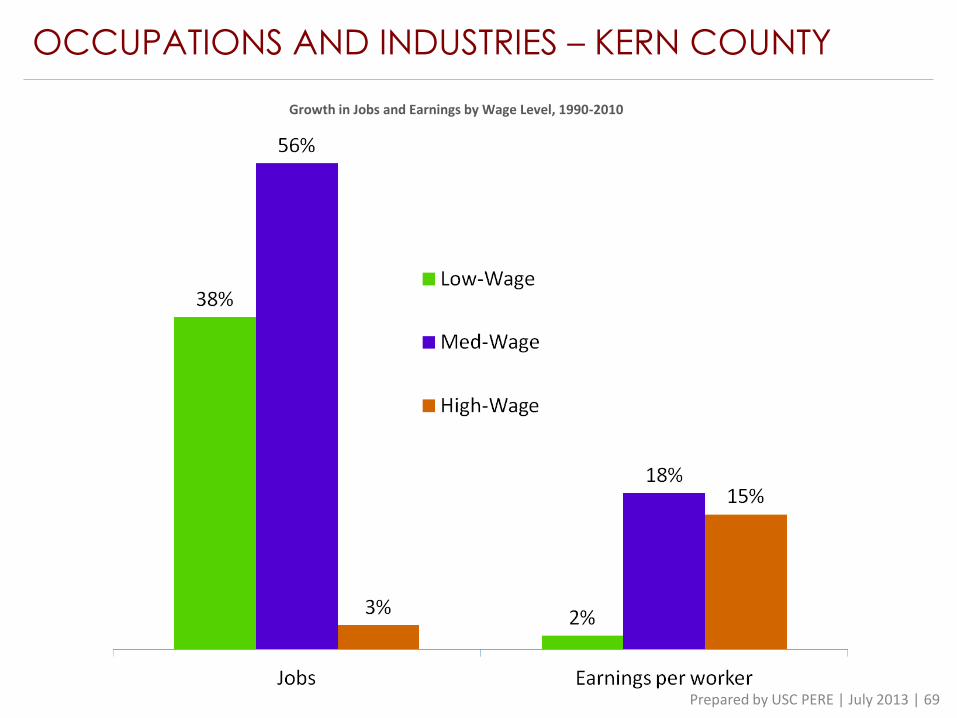
OCCUPATIONS AND INDUSTRIES – KERN COUNTY
Growth in Jobs and Earnings by Wage Level, 1990-2010
Prepared by USC PERE | July 2013 | 69
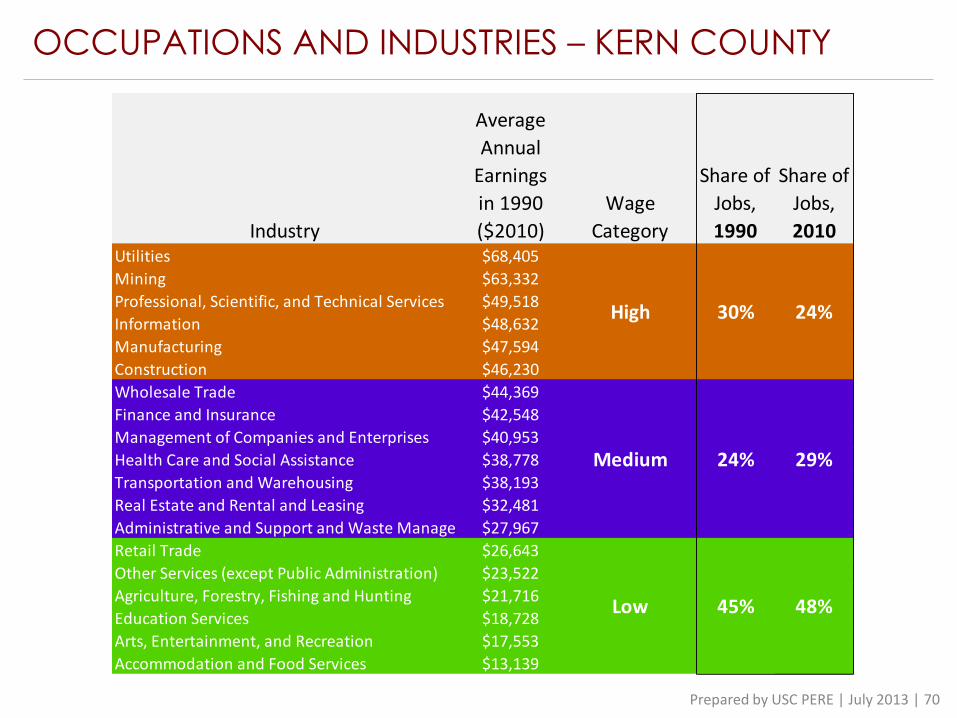
Industry
Average
Annual
Earnings
in 1990
($2010)
Wage
Category
Share of
Jobs,
1990
Share of
Jobs,
2010Utilities $68,405
Mining $63,332
Professional, Scientific, and Technical Services $49,518
Information $48,632
Manufacturing $47,594
Construction $46,230
Wholesale Trade $44,369
Finance and Insurance $42,548
Management of Companies and Enterprises $40,953
Health Care and Social Assistance $38,778
Transportation and Warehousing $38,193
Real Estate and Rental and Leasing $32,481
Administrative and Support and Waste Management and Remediation Services$27,967
Retail Trade $26,643
Other Services (except Public Administration) $23,522
Agriculture, Forestry, Fishing and Hunting $21,716
Education Services $18,728
Arts, Entertainment, and Recreation $17,553
Accommodation and Food Services $13,139
Low 45% 48%
High 30% 24%
Medium 24% 29%
OCCUPATIONS AND INDUSTRIES – KERN COUNTY
Prepared by USC PERE | July 2013 | 70
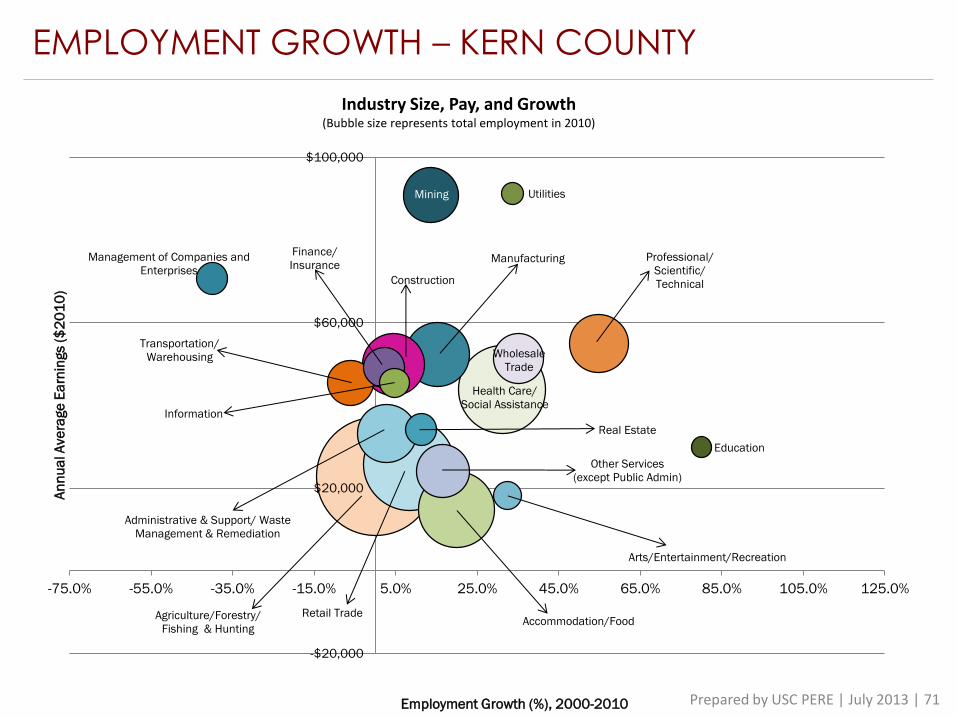
EMPLOYMENT GROWTH – KERN COUNTY
Industry Size, Pay, and Growth (Bubble size represents total employment in 2010)
Health Care/
Social Assistance
Manufacturing
Agriculture/Forestry/
Fishing & Hunting
Retail Trade
Mining
Construction
Administrative & Support/ Waste
Management & Remediation
Professional/
Scientific/
Technical
Wholesale
Trade
Accommodation/Food
Transportation/
Warehousing
Finance/
Insurance
Information
Other Services
(except Public Admin)
Real Estate
Management of Companies and
Enterprises
Education
Arts/Entertainment/Recreation
Utilities
-$20,000
$20,000
$60,000
$100,000
-75.0% -55.0% -35.0% -15.0% 5.0% 25.0% 45.0% 65.0% 85.0% 105.0% 125.0%
An
nu
al A
ve
rage
Ea
rnin
gs (
$2
01
0)
Employment Growth (%), 2000-2010 Prepared by USC PERE | July 2013 | 71

LINKING COMMUNITIES
Neighborhood Index : Using 5 indicators subtracting each from their mean of the county they are in and then dividing by the standard deviation.
Help determine the combined effect of social factors that impact health and well-being, including poverty, unemployment, less than high school education, cancer risk, and premature births.
Prepared by USC PERE | July 2013 | 72
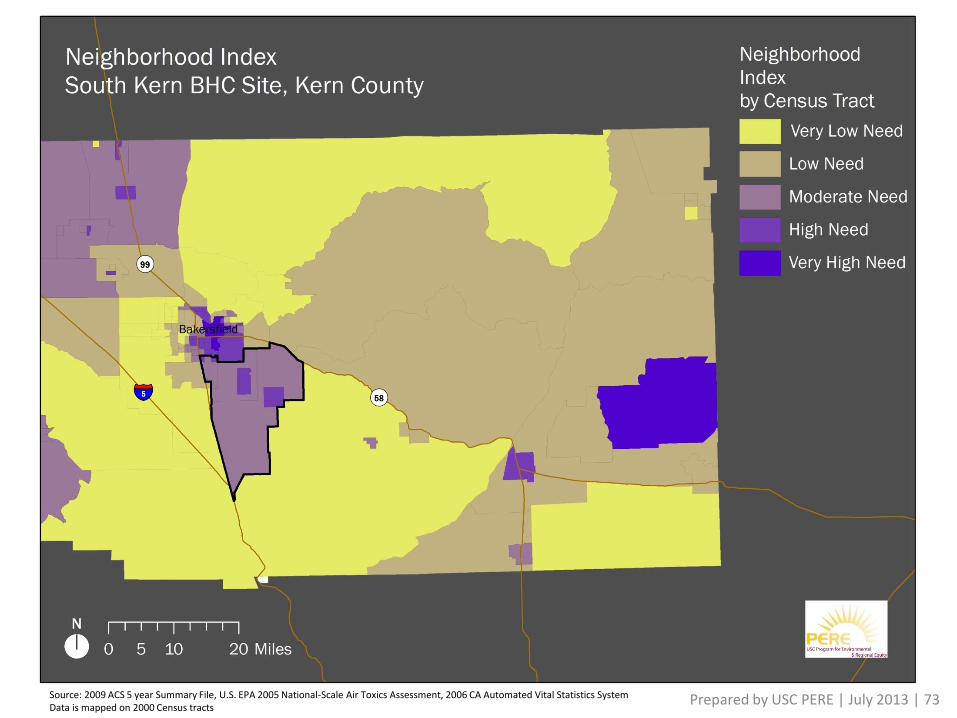
Prepared by USC PERE | July 2013 | 73 Source: 2009 ACS 5 year Summary File, U.S. EPA 2005 National-Scale Air Toxics Assessment, 2006 CA Automated Vital Statistics System Data is mapped on 2000 Census tracts