Getting to know your parish Research - Diocese of … · Getting to know your parish What is this...
361
1 Getting to know your parish What is this spotlight? How should I use it? Questions Contents This short spotlight brings together a range of information about your parish, both in terms of your congregations, but also the wider community living in your area. It covers areas such as Christian affiliation, population age and ethnicity profiles, household structures, deprivation, employment, schools and qualifications, alongside church statistics such as attendance and giving. There is information at the end of the spotlight about where this data comes from and how it was calculated. If you have any further queries then please do contact the Research and Statistics team at [email protected] This spotlight is not an end in itself, but rather a starting place for you to explore further. You may want to discuss it at a PCC meeting or with leadership teams. We’ve included some questions on each page to help you to think about the information, however some things will be of more relevance in some areas than others, and these are just suggestions to get you started. We’ve also included some bigger questions about what to do next at the end of the spotlight on page 17. There’s space for you to write some notes here. It might be helpful to write a short paragraph to summarise your community profile or note down anything that has struck you as particularly important. There are also details at the end for where you can find further information should you want to dig a little deeper. 1. Summary: a brief overview of your parish, including what look to be 5 of the most pressing social issues in your area 2. Age: age profile of your community 3. Ethnicity: ethnicity profile of your community 4. Integration: English language speaking and length of UK residency in your community 5. Religious affiliation: religious affiliation in your community 6. Households: families, dependents, one person households, temporary residents and housing tenure 7. Marital and civil partnership status 8. Employment: occupations, benefits and mobility in your community 9. Education: CofE schools and qualification levels in your community 10. Health: people with health problems and carers in your community 11. Deprivation: different types of deprivation in your community Research & Statistics
-
Upload
nguyenmien -
Category
Documents
-
view
220 -
download
0
Transcript of Getting to know your parish Research - Diocese of … · Getting to know your parish What is this...

1
Getting to know your parish
What is this spotlight?
How should I use it?
Questions
Contents
This short spotlight brings together a range of information about your parish,
both in terms of your congregations, but also the wider community living in
your area. It covers areas such as Christian affiliation, population age and
ethnicity profiles, household structures, deprivation, employment, schools
and qualifications, alongside church statistics such as attendance and giving.
There is information at the end of the spotlight about where this data comes
from and how it was calculated. If you have any further queries then please
do contact the Research and Statistics team at
This spotlight is not an end in itself, but rather a starting place for you to
explore further. You may want to discuss it at a PCC meeting or with
leadership teams. We’ve included some questions on each page to help you
to think about the information, however some things will be of more
relevance in some areas than others, and these are just suggestions to get
you started. We’ve also included some bigger questions about what to do
next at the end of the spotlight on page 17. There’s space for you to write
some notes here. It might be helpful to write a short paragraph to
summarise your community profile or note down anything that has struck
you as particularly important. There are also details at the end for where
you can find further information should you want to dig a little deeper.
1. Summary: a brief overview of your parish, including what look to be 5 of
the most pressing social issues in your area
2. Age: age profile of your community
3. Ethnicity: ethnicity profile of your community
4. Integration: English language speaking and length of UK residency in your
community
5. Religious affiliation: religious affiliation in your community
6. Households: families, dependents, one person households, temporary
residents and housing tenure
7. Marital and civil partnership status
8. Employment: occupations, benefits and mobility in your community
9. Education: CofE schools and qualification levels in your community
10. Health: people with health problems and carers in your community
11. Deprivation: different types of deprivation in your community
Research
&
Statistics

2
Parishioners at glance
Ambrosden: St Mary the Virgin
2011 Tax Efficient Planned
Giving/person/week1
2011 Electoral
Roll1
Benefit Claiming
Housing Costs
Education
69%
57%
Issues to look out for in your parish
£5
Annual Parochial Returns
Oct
ob
er W
eekl
y
Att
end
ance
1
0-4
5-15
2011 Parish
Share Paid1
30
PARISH OVERVIEW
8%
Parish
9%
11%
72%
Age Profile (20112)3,300
Proportion Christian
Sorry, no Fresh Expressions listed for this parish.Fresh Expressions
3,700
BICESTER & ISLIP
OXFORD
16-64
Age
Gro
up
Diocese
627029
Deanery
Archdeaconry
20013
20112
20013
20112
Included Churches
Oxford
Population
Low/No Qualifications
Parish of: Ambrosden
Parish Code: 270029
65 +
£17,408
Housing Access
Research
&
Statistics
0
10
20
30
40
50
2007 2008 2009 2010 2011
Highestweek
Average
LowestWeek

3
Parish 20112 Deanery 20112 Diocese 20112
Demographics: AGE PROFILE AND ATTENDANCE AT SERVICES
Does the age profile of your congregation match that of your parish? Are you engaging with the
parish's largest demographic: those aged 30 - 44?
40% 30% 20% 10% 0% 10% 20% 30% 40%
0 - 4
5 - 7
8 - 9
10 - 14
15
16 - 17
18 - 19
20 - 24
25 - 29
30 - 44
45 - 59
60 - 64
65 - 74
75 - 84
85 - 89
90 & overAge profile of parish populations 20013 & 20112
Parish2011
Parish2001
0% 10% 20% 30% 40%
0 - 14
15 - 29
30 - 44
45 - 59
60 - 74
75 - 89
90 & over
0% 10% 20% 30%
0 - 14
15 - 29
30 - 44
45 - 59
60 - 74
75 - 89
90 & over
0% 5% 10% 15% 20% 25%
0 - 14
15 - 29
30 - 44
45 - 59
60 - 74
75 - 89
90 & over
Research
&
Statistics

4
15%
Diocesan Congregation4 (2007)
Parish Population2 (2011)
(nearest 50)
Demographics: AGE PROFILE AND ATTENDANCE AT SERVICES
Comparable Age profile of Adults
25%
65 +
40%
Age
350
400
18 - 44
22% 38%
2,700
300
0 - 4
5 - 15
16 - 64
Diocesan Core Congregation Age Profile4 (2007)
Diocesan Population2 (2011) 37%
45 - 64
Does the age profile of your congregation match that of your parish?
65 +
Infant Baptisms
20111
8
Highest Weeks
Attendance 20111
-
36
9%
13%
16%
22%
40%
0% 10% 20% 30% 40% 50%
Research
&
Statistics
5
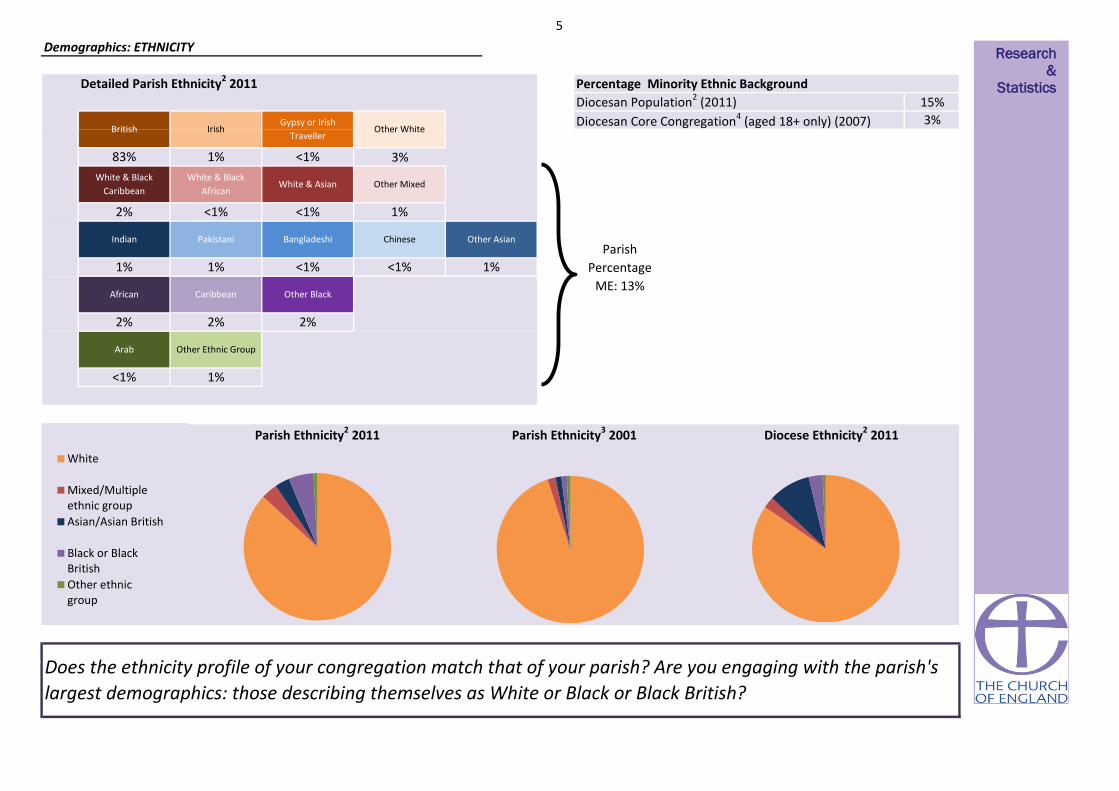
Detailed Parish Ethnicity2 2011
Parish Ethnicity2 2011 Parish Ethnicity3 2001 Diocese Ethnicity2 2011
Arab Other Ethnic Group
2%2%
Indian Bangladeshi Chinese
African Caribbean
Parish
Percentage
ME: 13%
Other Asian
1%
Does the ethnicity profile of your congregation match that of your parish? Are you engaging with the parish's
largest demographics: those describing themselves as White or Black or Black British?
1%
3%
<1%1% <1%
<1%
<1%<1%
Demographics: ETHNICITY
1%
83%
Other White
3%
White & Asian Other Mixed
2%
2%
<1%
British
White & Black
Caribbean
Diocesan Population2 (2011)
Diocesan Core Congregation4 (aged 18+ only) (2007)
Percentage Minority Ethnic Background
15%
1%
Irish
Pakistani
1%
Other Black
Gypsy or Irish
Traveller
White & Black
African
Research
&
Statistics
White
Mixed/Multipleethnic group
Asian/Asian British
Black or BlackBritish
Other ethnicgroup

6
Cannot speak English well or cannot speak
English Can speak English well or very well
1% 3%Have English as their main language (English or
Welsh if in Wales)
96%2Percentage of people who
Demographics: Integration
10 years or more
87%
2 years or more but less
than 5 years
Born in the UK
Less than 2 years
2% 3% 5%
5 years or more but less
than 10 years
Are services in your parish accessible to all residents? Do you offer any services in foreign
languages? What can you offer those who may not have been in the UK for long?
2Resident in UK:
2%
Research
&
Statistics
7
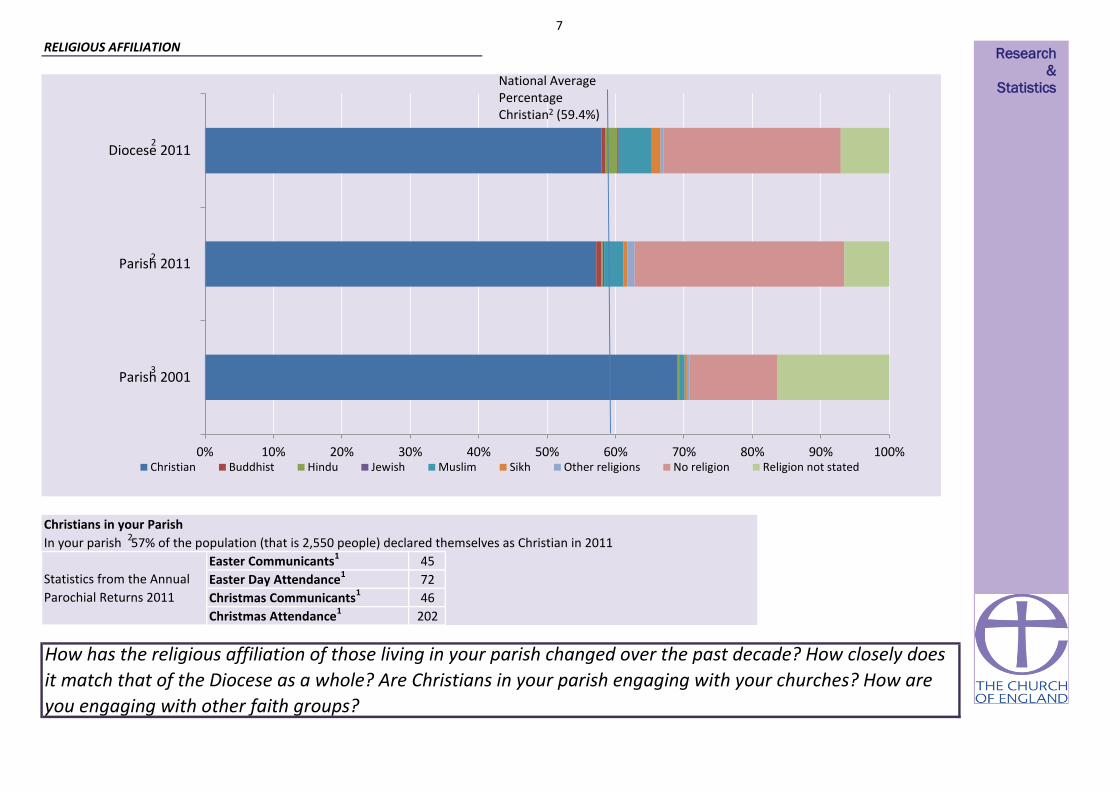
In your parish 57% of the population (that is 2,550 people) declared themselves as Christian in 2011
202
Statistics from the Annual
Parochial Returns 2011
Easter Communicants1
Easter Day Attendance1
Christmas Communicants1
Christmas Attendance1
Christians in your Parish
RELIGIOUS AFFILIATION
45
72
46
How has the religious affiliation of those living in your parish changed over the past decade? How closely does
it match that of the Diocese as a whole? Are Christians in your parish engaging with your churches? How are
you engaging with other faith groups?
0% 10% 20% 30% 40% 50% 60% 70% 80% 90% 100%
Parish 2001
Parish 2011
Diocese 2011
Christian Buddhist Hindu Jewish Muslim Sikh Other religions No religion Religion not stated
2
3
National Average Percentage Christian2 (59.4%)
Research
&
Statistics
2
2

8
Household Spaces2 2011
With at least one usual resident i.e. not vacant 95%
0%Caravan or other mobile or temporary structure
600 300 150
Who lives in your parish? Are there issues with access to housing? How permenant are your
parishioners?
Tenure2
Social rented as a percentage of all households2 13%
Social Rented householdsOwner occupied households
(including shared ownership)
Private Rented households
(including those living rent free)
HOUSEHOLDS, LIFESTYLE AND THE COMMUNITY I Research
&
Statistics
9
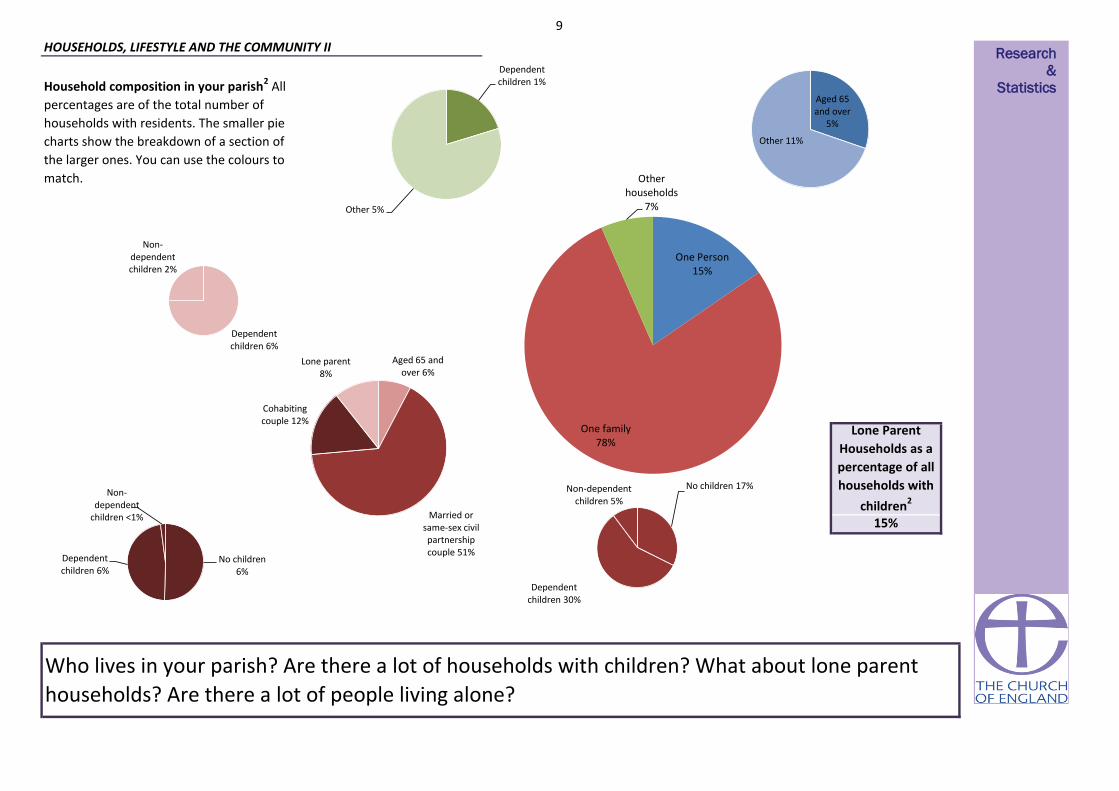
Household composition in your parish2 All
percentages are of the total number of
households with residents. The smaller pie
charts show the breakdown of a section of
the larger ones. You can use the colours to
match.
Lone Parent
Households as a
percentage of all
households with
children2
15%
Who lives in your parish? Are there a lot of households with children? What about lone parent
households? Are there a lot of people living alone?
HOUSEHOLDS, LIFESTYLE AND THE COMMUNITY II
Aged 65 and over
5%
Other 11%
One Person 15%
One family 78%
Other households
7%
Dependent children 1%
Other 5%
Aged 65 and over 6%
Married or same-sex civil partnership couple 51%
Cohabiting couple 12%
Lone parent 8%
No children 17%
Dependent children 30%
Non-dependent children 5%
No children 6%
Dependent children 6%
Non-dependent
children <1%
Dependent children 6%
Non-dependent children 2%
Research
&
Statistics
10
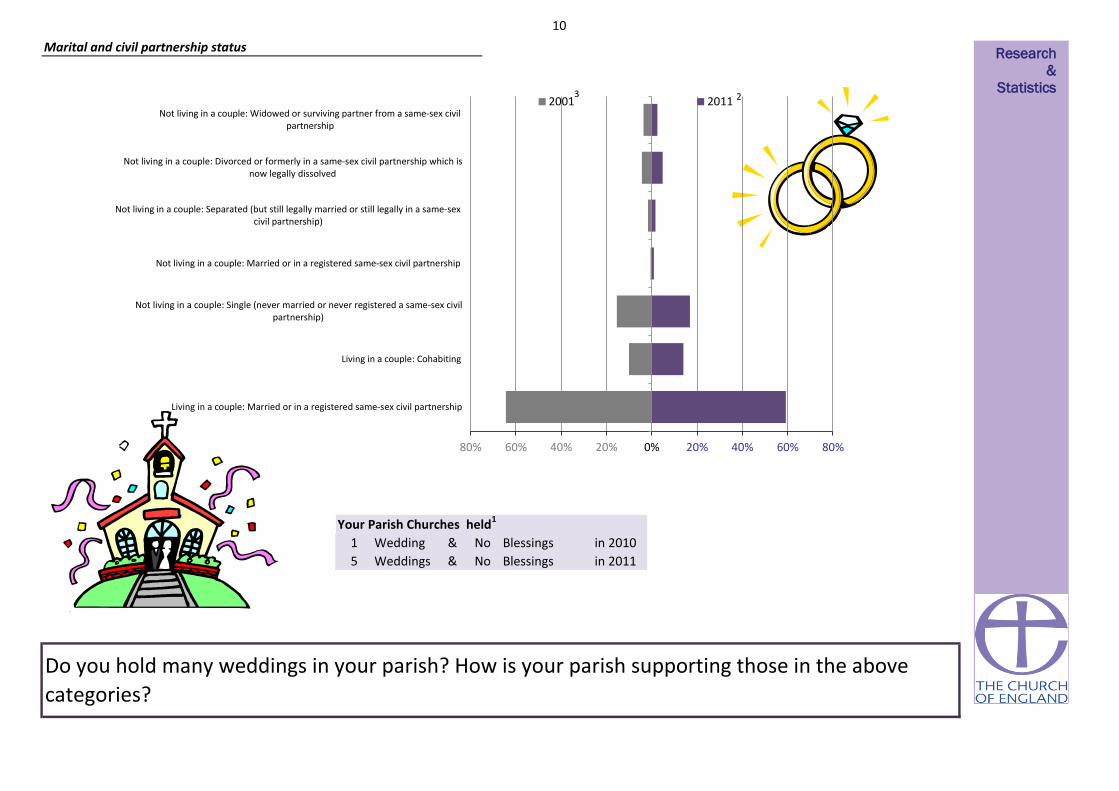
Wedding & Blessings in 2010
Weddings & Blessings in 20115 No
Your Parish Churches held1
Do you hold many weddings in your parish? How is your parish supporting those in the above
categories?
1 No
Marital and civil partnership status
80% 60% 40% 20% 0% 20% 40% 60% 80%
Living in a couple: Married or in a registered same-sex civil partnership
Living in a couple: Cohabiting
Not living in a couple: Single (never married or never registered a same-sex civilpartnership)
Not living in a couple: Married or in a registered same-sex civil partnership
Not living in a couple: Separated (but still legally married or still legally in a same-sexcivil partnership)
Not living in a couple: Divorced or formerly in a same-sex civil partnership which isnow legally dissolved
Not living in a couple: Widowed or surviving partner from a same-sex civilpartnership
2001 2011
Research
&
Statistics 2 3

11
£7
£0
£0
£62,578
£16,116
£15,475
Parish Expenditure1
TEPG/PERSON/WEEK1
Other/person/week1Other planned giving1
How are your parish finances? How does this compare to your community profile?
£10,128
£20,743
EMPLOYMENT AND SOCIAL GRADE, LIFESTYLE
The National Statistics Socio-economic Classification (NS-SeC) is an occupationally
based classification but has rules to provide coverage of the whole adult population.
The NS-SeC provides an indication of socio-economic position based on occupation.
It is an Office for National Statistics standard classification. To assign a person aged
16 to 74 to an NS-SeC category their occupation title is combined with information
about their employment status, whether they are employed or self-employed and
whether or not they supervise other employees. Full-time students are recorded in
the' full-time students' category regardless of whether they are economically active
or not.Parish Share Assessed1
Parish Share Paid1
£0
£0
£24,916
£17,734
£17,408
£5
£8,449Tax Efficient Planned Giving (TEPG)1
Finance Returns 2010
NS-SeC of Household Reference Person2
£41,214Parish Income12011
Research
&
Statistics
0% 5% 10% 15% 20% 25%
Higher managerial, administrative and professional occupations
Lower managerial, administrative and professional occupations
Intermediate occupations
Small employers and own account workers
Lower supervisory and technical occupations
Semi-routine occupations
Routine occupations
Never worked and long-term unemployed
Not classified (Full-time students or not classifiable for other reasons)
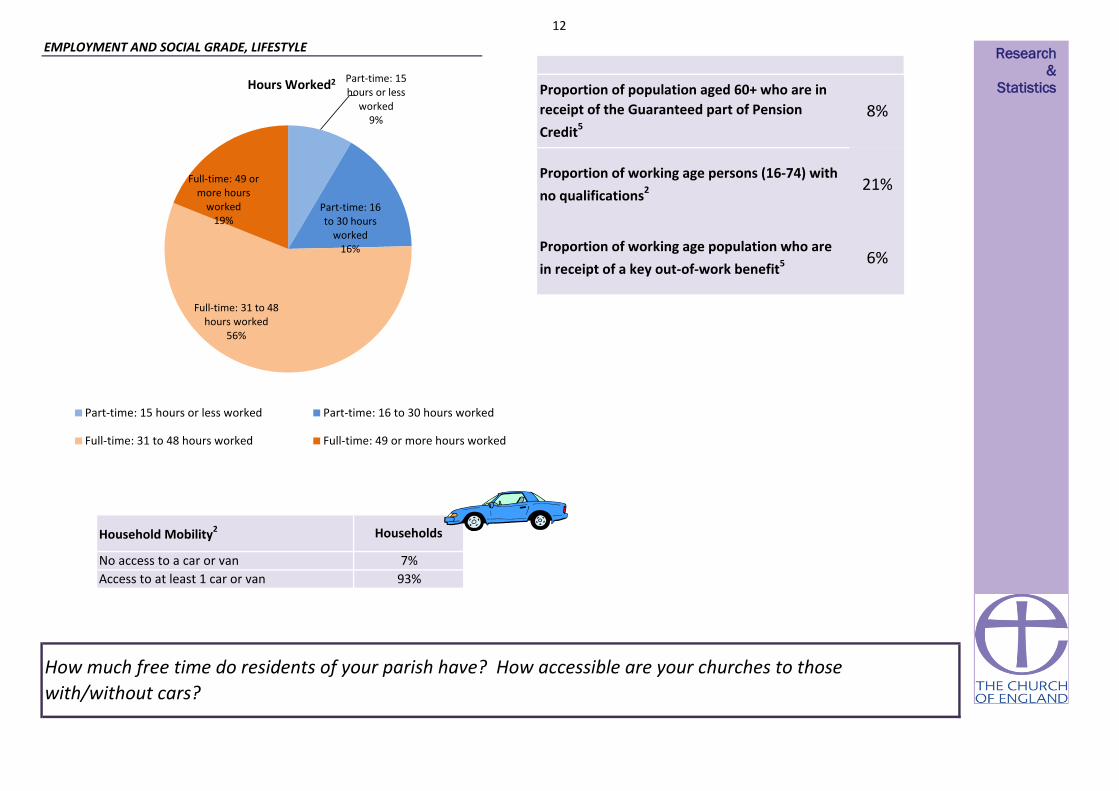
12
7%
93%
Households
6%
EMPLOYMENT AND SOCIAL GRADE, LIFESTYLE
How much free time do residents of your parish have? How accessible are your churches to those
with/without cars?
Access to at least 1 car or van
Household Mobility2
Proportion of population aged 60+ who are in
receipt of the Guaranteed part of Pension
Credit5
8%
Proportion of working age persons (16-74) with
no qualifications2 21%
Proportion of working age population who are
in receipt of a key out-of-work benefit5
No access to a car or van
Part-time: 15 hours or less
worked 9%
Part-time: 16 to 30 hours
worked 16%
Full-time: 31 to 48 hours worked
56%
Full-time: 49 or more hours
worked 19%
Hours Worked2
Part-time: 15 hours or less worked Part-time: 16 to 30 hours worked
Full-time: 31 to 48 hours worked Full-time: 49 or more hours worked
Research
&
Statistics

13
Church Schools in the parish
Parish2 2011 (proportion of 16+ population) National2 2011 (proportion of 16+ population)
EDUCATION AND SCHOOLS
How qualified are residents of your parish? What Church of England schools are available?
Sorry, we do not currently have
any Church Schools listed for this
parish.
20%
19%
17% 3%
13%
21%
7%
22%
13%
15% 4%
12%
27%
6% No qualifications (No formal qualifications)
Level 1 qualifications (1-4 GCSEs or equivalent)
Level 2 qualifications (5 GCSEs or equivalent)
Apprenticeships
Level 3 qualifications (2 or more A-levels orequivalent )
Level 4 qualifications and above (Bachelorsdegree or equivalent, and higher qualifications)
Other qualifications (including foreignqualifications)
Research
&
Statistics

14
Hours per week of provision of unpaid care2
1% 1%
Very bad health Bad health Fair health
1 - 19
Are there people in your parish with health problems? Is there anything you can do to assist with
day-to-day activities of those who have health problems?
HEALTH
0
Long-term health problem or disability2
50 +93% 5%
Good health Very good health
1%
Day-to-day activities limited a lot Day-to-day activities limited a little Day-to-day activities not limited
5% 7% 88%
3% 10% 34% 52%
General health2
20 - 49
Research
&
Statistics

15
You parish can be categorised as in the most or least deprived 10% or 50% of all parishes within the diocese and of all parishes nationally
50% least deprived 50% least deprived
Life expectancy at birth (girls)6 (1999-2003)
Life Expectancy at birth (boys)6 (1999-2003)
13%
10.6
50% least deprived8% 50% least deprived
50% most deprivedPercentage of Children under 16 in Poverty7 (2010)
Percentage of working age persons (16-74) with no
qualifications2 (2011)
50% least deprived
Life expectancy at birth can give an idea of overall quality of life. Life expectancy is an average. Women tend to have greater life expectancy. Life expectany can be affected by family history, marital status, economic status,
physique, exercise, diet, drug use including smoking and alcohol consumption, disposition, education, environment, sleep, climate, and health care.
Proportion of the population aged 60+ who are in receipt of
the Guaranteed part of Pension Credit5 (2012)
10%
Social rented as a percentage of all households2 (2011)
Index of Multiple Deprivation (IMD)8 (2010)
Proportion of the working age population who are in receipt
of a key out-of-work benefit5 (2012)
Lone Parent Households as a percentage of all households
with children2 (2011)
Pension Credit is an income related benefit made up of 2 parts - Guarantee Credit and Savings Credit. The guaranteed part tops up weekly income if it’s below £142.70 (single people) or £217.90 (couples) so those who
receive this are on a low income. This statistic only covers people living in private households, and not residential institutions (such as nursing homes).
50% least deprived
The proportion of children in families in receipr of either out of work benefits or tax credits where their reported income is less than 60% median income. Poor children may be excluded from participating in society. They may be unable to afford school
trips and activities; school uniforms or warm winter clothes, be unable to go swimming, have friends round for tea or celebrate their birthdays. Many will never have a holiday. Children who grow up poor are more likely to leave school without
qualifications, have lower employment chances, thus restricting their ability to get a good job and financially contribute to society.
50% least deprived
21% 50% most deprived
DEPRIVATION AND KEY ISSUES AFFECTING PARISHIONERS
Score
80
50% least deprived84
6%
Deprivation is considered to be a multi-dimensional problem, encompassing a range of domains such as financial, health, education, services or crime. continuous measure of relative deprivation therefore there is no definitive point on the scale below
which areas are considered to be deprived and above which they are not.While being in the most deprived 10% may indicate financial disadvantage, it could equally be due to isolated living.
Number of people aged 16 to State Pension age claiming: Jobseeker’s Allowance (JSA), Employment and Support Allowance (ESA), Incapacity Benefit (IB), Income Support (IS) (as a lone parent or in the “other” category),
Other income related benefits.
Social housing is housing that is let at low rents and on a secure basis to people in housing need. It is generally provided by councils and not-for-profit organisations such as housing associations. Vulnerable groups are often
concentrated in the social housing sector, with low rates of employment and low income levels
Children in single parent families have a much higher risk of living in poverty than children in couple families. Single parents may rely on informal childcare.
What are the particular issues that affect your parish? Are you doing anything to address these?
50% least deprived
Deprivation Indicator Diocesan Position National Position
A low-level of skill or educational attainment is one indicator of social disadvantage. Qualifications may make it easier to find employment. Learning also helps promote active citizenship and combat social exclusion.
15%
50% least deprived
50% most deprived
50% most deprived
50% most deprived
50% most deprived
50% most deprived
50% most deprived
Research
&
Statistics

16
0
0.0 10% least deprived 0
0
0
10% most deprived
50% most deprived
50% most deprived
50% most deprived
50% most deprived
50% most deprived
0 0 0
10% least deprived
50% least deprived 50% least deprived
00 0
0
0
0
0
0
50% least deprived
50% least deprived
50% least deprived
50% least deprived
50% least deprived
50% least deprived
10% least deprived
10% least deprived
0 0 0
0Skills Sub-domain 16.7
0
0
0
0
00 0
0
1
0
0
0
0
0
0
0
0
0 0
0
0 0
0
0
0
0
0
0
1
0
1
0
0.0
0.0
5%
0 0
11050% least deprived
0
0
0
0
0
0
1
21.7
0
10% least deprived
10% most deprived
0
00
50% most deprived 0
0
50% least deprived 1
50% least deprived 0
Number of LSOAs amongst
least deprived*Diocesan position National position
HEALTH DEPRIVATION AND
DISABILITY-0.5
Average
Score for
parishIMD Subdomains8 (2010)
INCOME
EMPLOYMENT
Number of LSOAs amongst
most deprived*
1%
0
Income Deprivation Affecting
Children Index0.1
CRIME AND DISORDER
LIVING ENVIRONMENT
Indoors Sub-domain
Outdoors Sub-domain
0
0
Geographical Barriers Sub-domain
13.1
50% most deprived
EDUCATION SKILLS AND TRAINING
BARRIERS TO HOUSING AND SERVICES50% most deprived
Wider Barriers Sub-domain
Children/Young People Sub-domain26.7 0 0
0
0
10% most deprived 50% most deprived
1
0
0
0
0
-1.3
050% least deprived
5.4
51.8
15.6
10.5
33.7
50% most deprived 50% most deprived
10% 1%
DEPRIVATION AND KEY ISSUES AFFECTING PARISHIONERSIt is important to note that these statistics are a measure of deprivation, not affluence, and to recognise that not every person in a highly deprived area will themselves be
deprived. Equally, there will be some deprived people living in the least deprived areas.
Deprivation covers a broad range of issues and refers to unmet needs caused by a lack of resources of all kinds, not just financial. The English Indices of Deprivation
attempt to measure a broader concept of multiple deprivation, made up of several distinct dimensions, or domains, of deprivation. Seven domains of deprivation are
combined to produce the overall Index of Multiple Deprivation. Each domain contains a number of component indicators. The English Indices of Deprivation are a
continuous measure of relative deprivation therefore there is no definitive point on the scale below which areas are considered to be deprived and above which they are
not. Deprived areas have been defined in this release as those containing LSOAs that are amongst the 10 per cent most deprived in England according to the overall Index
of Multiple Deprivation.
Overall IMD 0 100
5% 10%
10.6 50% most deprived
00
00 1
*There are 3 full or partial LSOAs included in this parish
0 0
What are the particular issues that affect your parish? Are you doing anything to address these?
Income Deprivation Affecting Older
People Index
0
Research
&
Statistics

17
This spotlight has given you some information about your parish both in terms of your own church congregations and your local community. This is not an
end in itself, but rather a starting place for you to explore further. Questions to consider might include:
• What does our congregation look like?
• How does it compare to the local population?
• What other churches are there in the area? What parts of the community do they reach? Which parts of the community are being missed?
• What other local organisations or centres are there, that might bring people into our parish? Examples might be Hospitals or health centres, prisons, job
centres, homeless shelters, schools, charities, mother and toddler groups, uniformed organisations, community centres, libraries, shops, offices, stations?
How can we interact with these people?
• What areas of our parish do we know well or less well?
• How does the local community change between weekdays and weekends? How do our services and events fit with the shifting local population?
• Is our website/'A Church Near You' profile up to date?
• Are our records up to date?
****************************************************************************************************************************
What to do next?
Your notes
WHAT TO DO NEXT Research
&
Statistics

18
Sources of further information
Public Health Observatories - APHO JSNA Datasets (The datasets are intended to cover a
range of issues, focused on underlying determinants of health and conditions which account
for substantial numbers of preventable diseases and deaths.)
A Church Near You
www.achurchnearyou.com
UpMyStreet - UK house prices, property, crime, local neighbourhood & schools
London Street Gangs - Territory maps and background information
http://www.londonstreetgangs.com/
Hint: Scroll to the bottom of the "Gang Maps" page to see boundaries.
AboutMyArea - The local interactive site - news, reviews, what's on, events, businesses
Research & Statistics GIS
http://www.churchofengland.org/about-us/facts-stats/research-statistics/census-2011.aspx
Church Urban Fund
www.cuf.org.uk
Homeless Pages - Information, Research and Publications on homelessness
http://www.homelesspages.org.uk/
http://www.upmystreet.com/
Hint: Use the "My Neighbourhood" tab
The network of Public Health Observatories - Health Profiles
www.apho.org.uk/resource/view.aspx?RID=91736
The Poverty Site - Geographic Analysis
www.poverty.org.uk/summary/regional.shtml
http://www.apho.org.uk/default.aspx?QN=HP_FINDSEARCH2011
MurderMap - London Homicide Reported Direct from The Old Bailey
Police.uk - Local crime and policing information for England and Wales
http://www.police.uk/
ONS - Neighbourhood Statistics
http://www.aboutmyarea.co.uk/
http://neighbourhood.statistics.gov.uk/
Hint: Use the summary box
http://www.murdermap.co.uk/
Research
&
Statistics

19
Proportion of the population aged 60+ who are in receipt of the Guaranteed part of Pension Credit (August 2012)
Estimated using LSOA level data sourced from http://83.244.183.180/NESS/BEN/iben.htm
Proportion of the working age population who are in receipt of a key out-of-work benefit (Q3 2012)
Life Expectancy at birth (boys) (1999-2003)
Estimated using ward level data from ONS.
Life expectancy at birth (girls) (1999-2003)
Estimated using ward level data from ONS.
Percentage of Children under 16 in Poverty (2009)
Estimated using LSOA level data from http://www.hmrc.gov.uk/statistics/child-poverty-stats.htm
IMD (2010)
Methodology: Government data is published on government boundaries that do not match ecclesiastical boundaries. In order to produce parish population and demographic
estimates we have worked with the ONS to use a best fit modelling process. As such, these statistics can only be considered estimates and, particularly in very diverse areas, are
best used in the context of local knowledge. Where parish populations are sparse the figures for government areas overlapping the parish are used.
Parish estimates from the census have been calculated using the census output area data published by the ONS. These are provisional estimates, and when more granular data at
postcode level is available, will be revised. Estimates have been modelled by allocating the population weighted centroid of each output area to the parish within which it falls.
This means that some parishes have not been allocated population, however proportions for demographic variables have been calculated based on the output areas overlaying
the parish.
For further information about this process, please contact [email protected].
Contains public sector information licensed under the Open Government Licence v1.0 http://www.nationalarchives.gov.uk/doc/open-government-licence/
Estimated using OA level data sourced from ONS Census Data 2011, ONS
Estimated using OA level data sourced from ONS Census Data 2001, ONS
When analysing data, it is important to consider that some parishes are very small and proportions may be very large even where very few cases meet the criteria.
ABOUT THIS DATA
http://www.churchofengland.org/about-us/facts-stats/research-statistics/clergydiversityaudit2005linkpage.aspx
Estimated using OA level data from DWP Information, Governance and Security Directorate from
http://statistics.dwp.gov.uk/asd/asd1/tabtools/census_output_area_data/index.php?page=census_output_area_data
Annual parochial returns
ONS Census data 2011
ONS Census data 2001
2007 Church Diversity Survey
DWP
ONS
HMRC
Department for Communities and Local Government
1
2
3
4
5
6
7
8
These have been collected annually between 2007 and 2011 by the Research and Statistics team, Archbishops’ Council
When quoting figures derived from this data, care should be taken with the level of accuracy quoted.
Estimated using LSOA level data from Communities and Local Government, 2010.
https://www.gov.uk/government/uploads/system/uploads/attachment_data/file/6320/1870718.pdf
Research
&
Statistics

1
Getting to know your parish
What is this spotlight?
How should I use it?
Questions
Contents
This short spotlight brings together a range of information about your parish,
both in terms of your congregations, but also the wider community living in
your area. It covers areas such as Christian affiliation, population age and
ethnicity profiles, household structures, deprivation, employment, schools
and qualifications, alongside church statistics such as attendance and giving.
There is information at the end of the spotlight about where this data comes
from and how it was calculated. If you have any further queries then please
do contact the Research and Statistics team at
This spotlight is not an end in itself, but rather a starting place for you to
explore further. You may want to discuss it at a PCC meeting or with
leadership teams. We’ve included some questions on each page to help you
to think about the information, however some things will be of more
relevance in some areas than others, and these are just suggestions to get
you started. We’ve also included some bigger questions about what to do
next at the end of the spotlight on page 17. There’s space for you to write
some notes here. It might be helpful to write a short paragraph to
summarise your community profile or note down anything that has struck
you as particularly important. There are also details at the end for where
you can find further information should you want to dig a little deeper.
1. Summary: a brief overview of your parish, including what look to be 5 of
the most pressing social issues in your area
2. Age: age profile of your community
3. Ethnicity: ethnicity profile of your community
4. Integration: English language speaking and length of UK residency in your
community
5. Religious affiliation: religious affiliation in your community
6. Households: families, dependents, one person households, temporary
residents and housing tenure
7. Marital and civil partnership status
8. Employment: occupations, benefits and mobility in your community
9. Education: CofE schools and qualification levels in your community
10. Health: people with health problems and carers in your community
11. Deprivation: different types of deprivation in your community
Research
&
Statistics
2
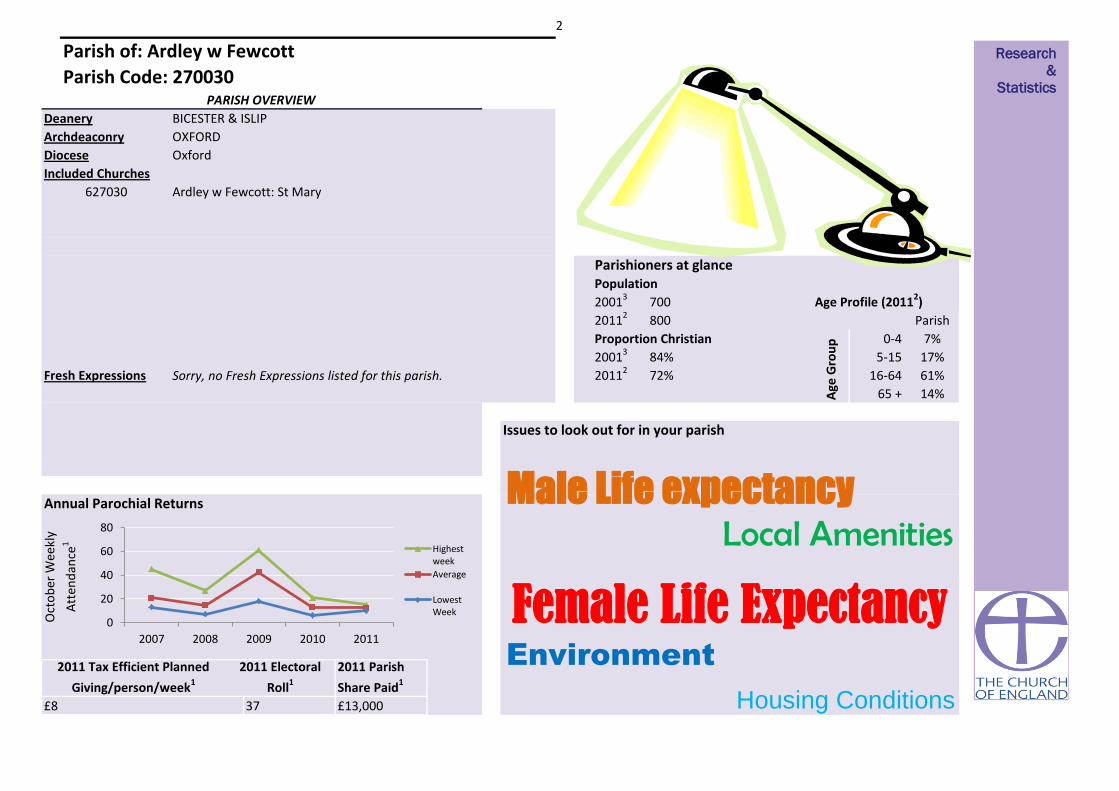
Parishioners at glance
Ardley w Fewcott: St Mary
2011 Tax Efficient Planned
Giving/person/week1
2011 Electoral
Roll1
Housing Conditions
Environment
Female Life Expectancy
84%
72%
Issues to look out for in your parish
£8
Annual Parochial Returns
Oct
ob
er W
eekl
y
Att
end
ance
1
0-4
5-15
2011 Parish
Share Paid1
37
PARISH OVERVIEW
14%
Parish
7%
17%
61%
Age Profile (20112)700
Proportion Christian
Sorry, no Fresh Expressions listed for this parish.Fresh Expressions
800
BICESTER & ISLIP
OXFORD
16-64
Age
Gro
up
Diocese
627030
Deanery
Archdeaconry
20013
20112
20013
20112
Included Churches
Oxford
Population
Local Amenities
Parish of: Ardley w Fewcott
Parish Code: 270030
65 +
£13,000
Male Life expectancy
Research
&
Statistics
0
20
40
60
80
2007 2008 2009 2010 2011
Highestweek
Average
LowestWeek

3
Parish 20112 Deanery 20112 Diocese 20112
Demographics: AGE PROFILE AND ATTENDANCE AT SERVICES
Does the age profile of your congregation match that of your parish? Are you engaging with the
parish's largest demographic: those aged 45 - 59?
30% 20% 10% 0% 10% 20% 30%
0 - 4
5 - 7
8 - 9
10 - 14
15
16 - 17
18 - 19
20 - 24
25 - 29
30 - 44
45 - 59
60 - 64
65 - 74
75 - 84
85 - 89
90 & overAge profile of parish populations 20013 & 20112
Parish2011
Parish2001
0% 5% 10% 15% 20% 25%
0 - 14
15 - 29
30 - 44
45 - 59
60 - 74
75 - 89
90 & over
0% 10% 20% 30%
0 - 14
15 - 29
30 - 44
45 - 59
60 - 74
75 - 89
90 & over
0% 5% 10% 15% 20% 25%
0 - 14
15 - 29
30 - 44
45 - 59
60 - 74
75 - 89
90 & over
Research
&
Statistics

4
15%
Diocesan Congregation4 (2007)
Parish Population2 (2011)
(nearest 50)
Demographics: AGE PROFILE AND ATTENDANCE AT SERVICES
Comparable Age profile of Adults
25%
65 +
40%
Age
50
150
18 - 44
22% 38%
450
100
0 - 4
5 - 15
16 - 64
Diocesan Core Congregation Age Profile4 (2007)
Diocesan Population2 (2011) 37%
45 - 64
Does the age profile of your congregation match that of your parish?
65 +
Infant Baptisms
20111
1
Highest Weeks
Attendance 20111
-
15
9%
13%
16%
22%
40%
0% 10% 20% 30% 40% 50%
Research
&
Statistics

5
Detailed Parish Ethnicity2 2011
Parish Ethnicity2 2011 Parish Ethnicity3 2001 Diocese Ethnicity2 2011
Arab Other Ethnic Group
<1%0%
Indian Bangladeshi Chinese
African Caribbean
Parish
Percentage
ME: 2%
Other Asian
<1%
Does the ethnicity profile of your congregation match that of your parish? Are you engaging with the parish's
largest demographics: those describing themselves as White or Asian/Asian British?
<1%
3%
0%1% 0%
0%
<1%<1%
Demographics: ETHNICITY
<1%
93%
Other White
4%
White & Asian Other Mixed
0%
<1%
0%
British
White & Black
Caribbean
Diocesan Population2 (2011)
Diocesan Core Congregation4 (aged 18+ only) (2007)
Percentage Minority Ethnic Background
15%
1%
Irish
Pakistani
0%
Other Black
Gypsy or Irish
Traveller
White & Black
African
Research
&
Statistics
White
Mixed/Multipleethnic group
Asian/Asian British
Black or BlackBritish
Other ethnicgroup
6
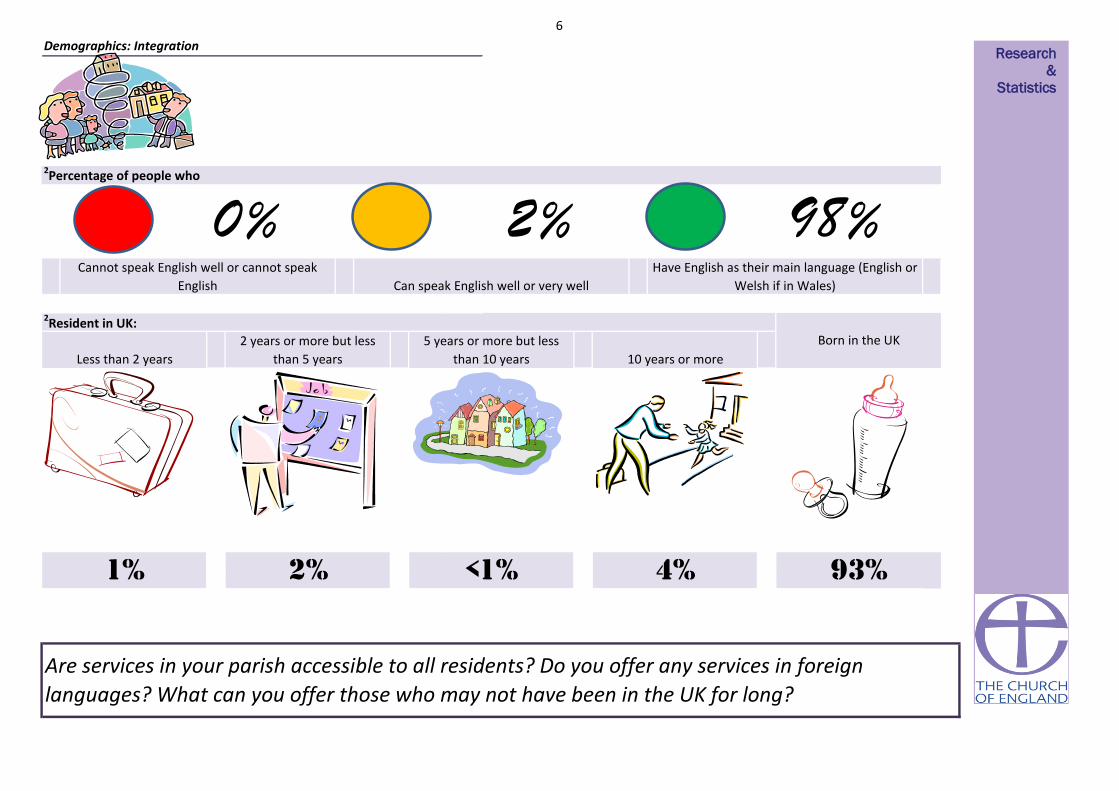
Cannot speak English well or cannot speak
English Can speak English well or very well
0% 2%Have English as their main language (English or
Welsh if in Wales)
98%2Percentage of people who
Demographics: Integration
10 years or more
93%
2 years or more but less
than 5 years
Born in the UK
Less than 2 years
2% <1% 4%
5 years or more but less
than 10 years
Are services in your parish accessible to all residents? Do you offer any services in foreign
languages? What can you offer those who may not have been in the UK for long?
2Resident in UK:
1%
Research
&
Statistics

7
In your parish 72% of the population (that is 650 people) declared themselves as Christian in 2011
57
Statistics from the Annual
Parochial Returns 2011
Easter Communicants1
Easter Day Attendance1
Christmas Communicants1
Christmas Attendance1
Christians in your Parish
RELIGIOUS AFFILIATION
27
31
43
How has the religious affiliation of those living in your parish changed over the past decade? How closely does
it match that of the Diocese as a whole? Are Christians in your parish engaging with your churches? How are
you engaging with other faith groups?
0% 10% 20% 30% 40% 50% 60% 70% 80% 90% 100%
Parish 2001
Parish 2011
Diocese 2011
Christian Buddhist Hindu Jewish Muslim Sikh Other religions No religion Religion not stated
2
3
National Average Percentage Christian2 (59.4%)
Research
&
Statistics
2
2

8
Household Spaces2 2011
With at least one usual resident i.e. not vacant 98%
<1%Caravan or other mobile or temporary structure
200 <50 <50
Who lives in your parish? Are there issues with access to housing? How permenant are your
parishioners?
Tenure2
Social rented as a percentage of all households2 5%
Social Rented householdsOwner occupied households
(including shared ownership)
Private Rented households
(including those living rent free)
HOUSEHOLDS, LIFESTYLE AND THE COMMUNITY I Research
&
Statistics

9
Household composition in your parish2 All
percentages are of the total number of
households with residents. The smaller pie
charts show the breakdown of a section of
the larger ones. You can use the colours to
match.
Lone Parent
Households as a
percentage of all
households with
children2
17%
Who lives in your parish? Are there a lot of households with children? What about lone parent
households? Are there a lot of people living alone?
HOUSEHOLDS, LIFESTYLE AND THE COMMUNITY II
Aged 65 and over 9%
Other 8%
One Person 16%
One family 75%
Other households
8%
Dependent children 3%
All aged 65 and over
<1%
Other 4%
Aged 65 and over 8%
Married or same-sex civil partnership couple 50%
Cohabiting couple 9%
Lone parent 9%
No children 19%
Dependent children 24%
Non-dependent children 7%
No children 5%
Dependent children 4%
Dependent children 7%
Non-dependent children 2%
Research
&
Statistics
10
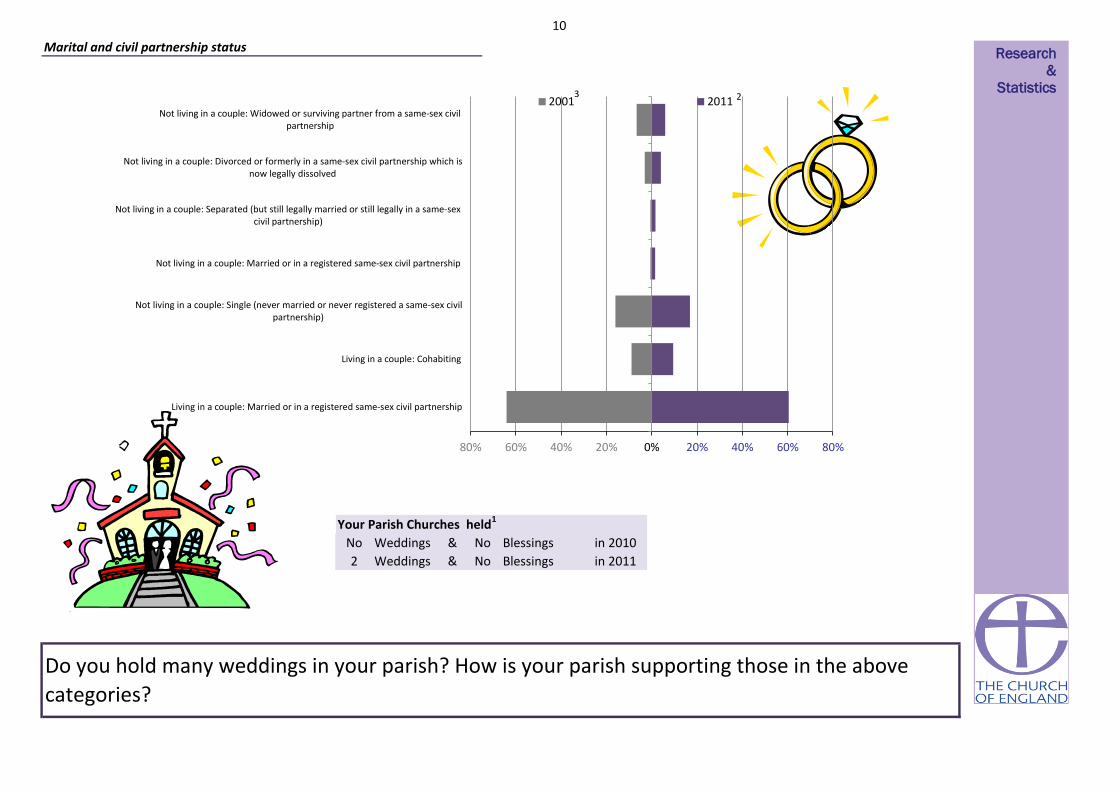
Weddings & Blessings in 2010
Weddings & Blessings in 20112 No
Your Parish Churches held1
Do you hold many weddings in your parish? How is your parish supporting those in the above
categories?
No No
Marital and civil partnership status
80% 60% 40% 20% 0% 20% 40% 60% 80%
Living in a couple: Married or in a registered same-sex civil partnership
Living in a couple: Cohabiting
Not living in a couple: Single (never married or never registered a same-sex civilpartnership)
Not living in a couple: Married or in a registered same-sex civil partnership
Not living in a couple: Separated (but still legally married or still legally in a same-sexcivil partnership)
Not living in a couple: Divorced or formerly in a same-sex civil partnership which isnow legally dissolved
Not living in a couple: Widowed or surviving partner from a same-sex civilpartnership
2001 2011
Research
&
Statistics 2 3

11
£7
£0
£0
£62,361
£14,531
£14,500
Parish Expenditure1
TEPG/PERSON/WEEK1
Other/person/week1Other planned giving1
How are your parish finances? How does this compare to your community profile?
£3,979
£16,379
EMPLOYMENT AND SOCIAL GRADE, LIFESTYLE
The National Statistics Socio-economic Classification (NS-SeC) is an occupationally
based classification but has rules to provide coverage of the whole adult population.
The NS-SeC provides an indication of socio-economic position based on occupation.
It is an Office for National Statistics standard classification. To assign a person aged
16 to 74 to an NS-SeC category their occupation title is combined with information
about their employment status, whether they are employed or self-employed and
whether or not they supervise other employees. Full-time students are recorded in
the' full-time students' category regardless of whether they are economically active
or not.Parish Share Assessed1
Parish Share Paid1
£0
£0
£20,905
£13,660
£13,000
£8
£3,865Tax Efficient Planned Giving (TEPG)1
Finance Returns 2010
NS-SeC of Household Reference Person2
£12,957Parish Income12011
Research
&
Statistics
0% 5% 10% 15% 20% 25% 30%
Higher managerial, administrative and professional occupations
Lower managerial, administrative and professional occupations
Intermediate occupations
Small employers and own account workers
Lower supervisory and technical occupations
Semi-routine occupations
Routine occupations
Never worked and long-term unemployed
Not classified (Full-time students or not classifiable for other reasons)

12
8%
92%
Households
2%
EMPLOYMENT AND SOCIAL GRADE, LIFESTYLE
How much free time do residents of your parish have? How accessible are your churches to those
with/without cars?
Access to at least 1 car or van
Household Mobility2
Proportion of population aged 60+ who are in
receipt of the Guaranteed part of Pension
Credit5
9%
Proportion of working age persons (16-74) with
no qualifications2 21%
Proportion of working age population who are
in receipt of a key out-of-work benefit5
No access to a car or van
Part-time: 15 hours or less
worked 9%
Part-time: 16 to 30 hours
worked 16%
Full-time: 31 to 48 hours worked
56%
Full-time: 49 or more hours
worked 18%
Hours Worked2
Part-time: 15 hours or less worked Part-time: 16 to 30 hours worked
Full-time: 31 to 48 hours worked Full-time: 49 or more hours worked
Research
&
Statistics
13
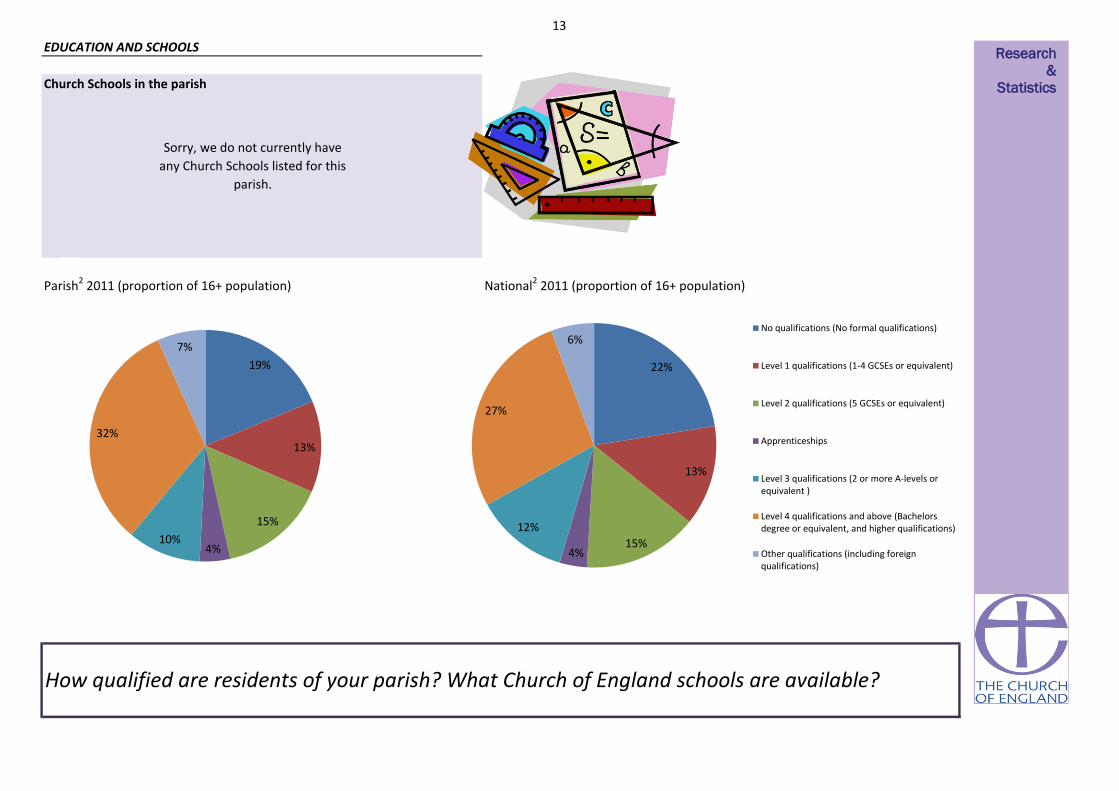
Church Schools in the parish
Parish2 2011 (proportion of 16+ population) National2 2011 (proportion of 16+ population)
EDUCATION AND SCHOOLS
How qualified are residents of your parish? What Church of England schools are available?
Sorry, we do not currently have
any Church Schools listed for this
parish.
19%
13%
15%
4% 10%
32%
7%
22%
13%
15% 4%
12%
27%
6% No qualifications (No formal qualifications)
Level 1 qualifications (1-4 GCSEs or equivalent)
Level 2 qualifications (5 GCSEs or equivalent)
Apprenticeships
Level 3 qualifications (2 or more A-levels orequivalent )
Level 4 qualifications and above (Bachelorsdegree or equivalent, and higher qualifications)
Other qualifications (including foreignqualifications)
Research
&
Statistics

14
Hours per week of provision of unpaid care2
1% 2%
Very bad health Bad health Fair health
1 - 19
Are there people in your parish with health problems? Is there anything you can do to assist with
day-to-day activities of those who have health problems?
HEALTH
0
Long-term health problem or disability2
50 +91% 7%
Good health Very good health
1%
Day-to-day activities limited a lot Day-to-day activities limited a little Day-to-day activities not limited
8% 6% 86%
3% 12% 28% 57%
General health2
20 - 49
Research
&
Statistics

15
You parish can be categorised as in the most or least deprived 10% or 50% of all parishes within the diocese and of all parishes nationally
10% most deprived 10% most deprived
Life expectancy at birth (girls)6 (1999-2003)
Life Expectancy at birth (boys)6 (1999-2003)
5%
11.7
50% most deprived9% 50% least deprived
50% least deprivedPercentage of Children under 16 in Poverty7 (2010)
Percentage of working age persons (16-74) with no
qualifications2 (2011)
10% most deprived
Life expectancy at birth can give an idea of overall quality of life. Life expectancy is an average. Women tend to have greater life expectancy. Life expectany can be affected by family history, marital status, economic status,
physique, exercise, diet, drug use including smoking and alcohol consumption, disposition, education, environment, sleep, climate, and health care.
Proportion of the population aged 60+ who are in receipt of
the Guaranteed part of Pension Credit5 (2012)
6%
Social rented as a percentage of all households2 (2011)
Index of Multiple Deprivation (IMD)8 (2010)
Proportion of the working age population who are in receipt
of a key out-of-work benefit5 (2012)
Lone Parent Households as a percentage of all households
with children2 (2011)
Pension Credit is an income related benefit made up of 2 parts - Guarantee Credit and Savings Credit. The guaranteed part tops up weekly income if it’s below £142.70 (single people) or £217.90 (couples) so those who
receive this are on a low income. This statistic only covers people living in private households, and not residential institutions (such as nursing homes).
50% least deprived
The proportion of children in families in receipr of either out of work benefits or tax credits where their reported income is less than 60% median income. Poor children may be excluded from participating in society. They may be unable to afford school
trips and activities; school uniforms or warm winter clothes, be unable to go swimming, have friends round for tea or celebrate their birthdays. Many will never have a holiday. Children who grow up poor are more likely to leave school without
qualifications, have lower employment chances, thus restricting their ability to get a good job and financially contribute to society.
50% least deprived
21% 50% most deprived
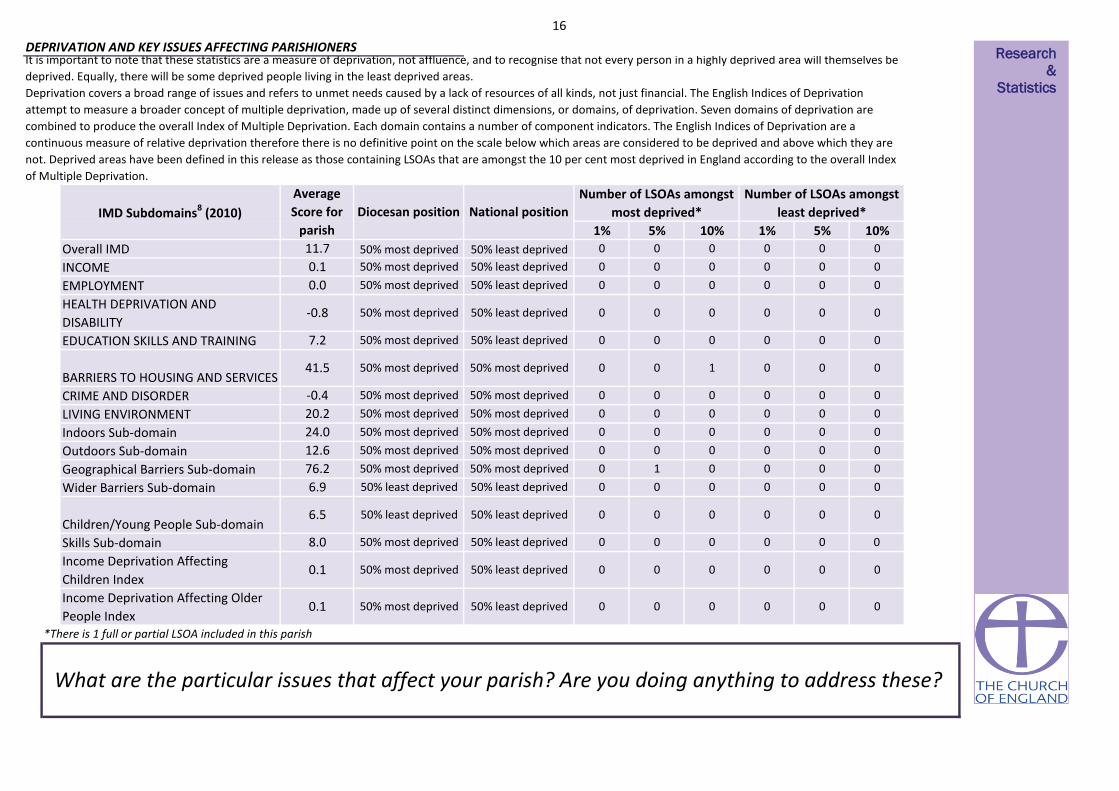
DEPRIVATION AND KEY ISSUES AFFECTING PARISHIONERS
Score
73
10% most deprived76
2%
Deprivation is considered to be a multi-dimensional problem, encompassing a range of domains such as financial, health, education, services or crime. continuous measure of relative deprivation therefore there is no definitive point on the scale below
which areas are considered to be deprived and above which they are not.While being in the most deprived 10% may indicate financial disadvantage, it could equally be due to isolated living.
Number of people aged 16 to State Pension age claiming: Jobseeker’s Allowance (JSA), Employment and Support Allowance (ESA), Incapacity Benefit (IB), Income Support (IS) (as a lone parent or in the “other” category),
Other income related benefits.
Social housing is housing that is let at low rents and on a secure basis to people in housing need. It is generally provided by councils and not-for-profit organisations such as housing associations. Vulnerable groups are often
concentrated in the social housing sector, with low rates of employment and low income levels
Children in single parent families have a much higher risk of living in poverty than children in couple families. Single parents may rely on informal childcare.
What are the particular issues that affect your parish? Are you doing anything to address these?
50% least deprived
Deprivation Indicator Diocesan Position National Position
A low-level of skill or educational attainment is one indicator of social disadvantage. Qualifications may make it easier to find employment. Learning also helps promote active citizenship and combat social exclusion.
17%
50% least deprived
50% least deprived
10% least deprived
50% most deprived
50% least deprived
50% least deprived
50% most deprived
Research
&
Statistics
16
0
0.1 50% least deprived 0
0
1
50% most deprived
50% least deprived
50% most deprived
50% least deprived
50% least deprived
50% most deprived
0 0 0
50% most deprived
50% most deprived 50% least deprived
00 0
0
0
0
0
0
50% most deprived
50% most deprived
50% most deprived
50% most deprived
50% most deprived
50% most deprived
50% least deprived
50% least deprived
0 0 0
0Skills Sub-domain 8.0
0
0
0
0
00 0
0
0
0
0
0
0
0
0
0
0
0 0
0
0 0
0
0
0
0
0
0
0
0
0
0
0.1
0.0
5%
0 0
00050% most deprived
0
0
0
1
0
0
0
7.2
0
50% most deprived
50% most deprived
0
00
50% least deprived 0
0
50% most deprived 0
50% least deprived 0
Number of LSOAs amongst
least deprived*Diocesan position National position
HEALTH DEPRIVATION AND
DISABILITY-0.8
Average
Score for
parishIMD Subdomains8 (2010)
INCOME
EMPLOYMENT
Number of LSOAs amongst
most deprived*
1%
0
Income Deprivation Affecting
Children Index0.1
CRIME AND DISORDER
LIVING ENVIRONMENT
Indoors Sub-domain
Outdoors Sub-domain
0
0
Geographical Barriers Sub-domain
24.0
50% most deprived
EDUCATION SKILLS AND TRAINING
BARRIERS TO HOUSING AND SERVICES50% most deprived
Wider Barriers Sub-domain
Children/Young People Sub-domain6.5 0 0
0
0
50% least deprived 50% least deprived
0
0
0
0
0
-0.4
050% most deprived
12.6
76.2
6.9
20.2
41.5
50% most deprived 50% least deprived
10% 1%
DEPRIVATION AND KEY ISSUES AFFECTING PARISHIONERSIt is important to note that these statistics are a measure of deprivation, not affluence, and to recognise that not every person in a highly deprived area will themselves be
deprived. Equally, there will be some deprived people living in the least deprived areas.
Deprivation covers a broad range of issues and refers to unmet needs caused by a lack of resources of all kinds, not just financial. The English Indices of Deprivation
attempt to measure a broader concept of multiple deprivation, made up of several distinct dimensions, or domains, of deprivation. Seven domains of deprivation are
combined to produce the overall Index of Multiple Deprivation. Each domain contains a number of component indicators. The English Indices of Deprivation are a
continuous measure of relative deprivation therefore there is no definitive point on the scale below which areas are considered to be deprived and above which they are
not. Deprived areas have been defined in this release as those containing LSOAs that are amongst the 10 per cent most deprived in England according to the overall Index
of Multiple Deprivation.
Overall IMD 0 000
5% 10%
11.7 50% most deprived
00
00 0
*There is 1 full or partial LSOA included in this parish
0 0
What are the particular issues that affect your parish? Are you doing anything to address these?
Income Deprivation Affecting Older
People Index
0
Research
&
Statistics

17
This spotlight has given you some information about your parish both in terms of your own church congregations and your local community. This is not an
end in itself, but rather a starting place for you to explore further. Questions to consider might include:
• What does our congregation look like?
• How does it compare to the local population?
• What other churches are there in the area? What parts of the community do they reach? Which parts of the community are being missed?
• What other local organisations or centres are there, that might bring people into our parish? Examples might be Hospitals or health centres, prisons, job
centres, homeless shelters, schools, charities, mother and toddler groups, uniformed organisations, community centres, libraries, shops, offices, stations?
How can we interact with these people?
• What areas of our parish do we know well or less well?
• How does the local community change between weekdays and weekends? How do our services and events fit with the shifting local population?
• Is our website/'A Church Near You' profile up to date?
• Are our records up to date?
****************************************************************************************************************************
What to do next?
Your notes
WHAT TO DO NEXT Research
&
Statistics

18
Sources of further information
Public Health Observatories - APHO JSNA Datasets (The datasets are intended to cover a
range of issues, focused on underlying determinants of health and conditions which account
for substantial numbers of preventable diseases and deaths.)
A Church Near You
www.achurchnearyou.com
UpMyStreet - UK house prices, property, crime, local neighbourhood & schools
London Street Gangs - Territory maps and background information
http://www.londonstreetgangs.com/
Hint: Scroll to the bottom of the "Gang Maps" page to see boundaries.
AboutMyArea - The local interactive site - news, reviews, what's on, events, businesses
Research & Statistics GIS
http://www.churchofengland.org/about-us/facts-stats/research-statistics/census-2011.aspx
Church Urban Fund
www.cuf.org.uk
Homeless Pages - Information, Research and Publications on homelessness
http://www.homelesspages.org.uk/
http://www.upmystreet.com/
Hint: Use the "My Neighbourhood" tab
The network of Public Health Observatories - Health Profiles
www.apho.org.uk/resource/view.aspx?RID=91736
The Poverty Site - Geographic Analysis
www.poverty.org.uk/summary/regional.shtml
http://www.apho.org.uk/default.aspx?QN=HP_FINDSEARCH2011
MurderMap - London Homicide Reported Direct from The Old Bailey
Police.uk - Local crime and policing information for England and Wales
http://www.police.uk/
ONS - Neighbourhood Statistics
http://www.aboutmyarea.co.uk/
http://neighbourhood.statistics.gov.uk/
Hint: Use the summary box
http://www.murdermap.co.uk/
Research
&
Statistics

19
Proportion of the population aged 60+ who are in receipt of the Guaranteed part of Pension Credit (August 2012)
Estimated using LSOA level data sourced from http://83.244.183.180/NESS/BEN/iben.htm
Proportion of the working age population who are in receipt of a key out-of-work benefit (Q3 2012)
Life Expectancy at birth (boys) (1999-2003)
Estimated using ward level data from ONS.
Life expectancy at birth (girls) (1999-2003)
Estimated using ward level data from ONS.
Percentage of Children under 16 in Poverty (2009)
Estimated using LSOA level data from http://www.hmrc.gov.uk/statistics/child-poverty-stats.htm
IMD (2010)
Methodology: Government data is published on government boundaries that do not match ecclesiastical boundaries. In order to produce parish population and demographic
estimates we have worked with the ONS to use a best fit modelling process. As such, these statistics can only be considered estimates and, particularly in very diverse areas, are
best used in the context of local knowledge. Where parish populations are sparse the figures for government areas overlapping the parish are used.
Parish estimates from the census have been calculated using the census output area data published by the ONS. These are provisional estimates, and when more granular data at
postcode level is available, will be revised. Estimates have been modelled by allocating the population weighted centroid of each output area to the parish within which it falls.
This means that some parishes have not been allocated population, however proportions for demographic variables have been calculated based on the output areas overlaying
the parish.
For further information about this process, please contact [email protected].
Contains public sector information licensed under the Open Government Licence v1.0 http://www.nationalarchives.gov.uk/doc/open-government-licence/
Estimated using OA level data sourced from ONS Census Data 2011, ONS
Estimated using OA level data sourced from ONS Census Data 2001, ONS
When analysing data, it is important to consider that some parishes are very small and proportions may be very large even where very few cases meet the criteria.
ABOUT THIS DATA
http://www.churchofengland.org/about-us/facts-stats/research-statistics/clergydiversityaudit2005linkpage.aspx
Estimated using OA level data from DWP Information, Governance and Security Directorate from
http://statistics.dwp.gov.uk/asd/asd1/tabtools/census_output_area_data/index.php?page=census_output_area_data
Annual parochial returns
ONS Census data 2011
ONS Census data 2001
2007 Church Diversity Survey
DWP
ONS
HMRC
Department for Communities and Local Government
1
2
3
4
5
6
7
8
These have been collected annually between 2007 and 2011 by the Research and Statistics team, Archbishops’ Council
When quoting figures derived from this data, care should be taken with the level of accuracy quoted.
Estimated using LSOA level data from Communities and Local Government, 2010.
https://www.gov.uk/government/uploads/system/uploads/attachment_data/file/6320/1870718.pdf
Research
&
Statistics

1
Getting to know your parish
What is this spotlight?
How should I use it?
Questions
Contents
This short spotlight brings together a range of information about your parish,
both in terms of your congregations, but also the wider community living in
your area. It covers areas such as Christian affiliation, population age and
ethnicity profiles, household structures, deprivation, employment, schools
and qualifications, alongside church statistics such as attendance and giving.
There is information at the end of the spotlight about where this data comes
from and how it was calculated. If you have any further queries then please
do contact the Research and Statistics team at
This spotlight is not an end in itself, but rather a starting place for you to
explore further. You may want to discuss it at a PCC meeting or with
leadership teams. We’ve included some questions on each page to help you
to think about the information, however some things will be of more
relevance in some areas than others, and these are just suggestions to get
you started. We’ve also included some bigger questions about what to do
next at the end of the spotlight on page 17. There’s space for you to write
some notes here. It might be helpful to write a short paragraph to
summarise your community profile or note down anything that has struck
you as particularly important. There are also details at the end for where
you can find further information should you want to dig a little deeper.
1. Summary: a brief overview of your parish, including what look to be 5 of
the most pressing social issues in your area
2. Age: age profile of your community
3. Ethnicity: ethnicity profile of your community
4. Integration: English language speaking and length of UK residency in your
community
5. Religious affiliation: religious affiliation in your community
6. Households: families, dependents, one person households, temporary
residents and housing tenure
7. Marital and civil partnership status
8. Employment: occupations, benefits and mobility in your community
9. Education: CofE schools and qualification levels in your community
10. Health: people with health problems and carers in your community
11. Deprivation: different types of deprivation in your community
Research
&
Statistics

2
Parishioners at glance
Bicester: St Edburg
Caversfield: St Laurence
2011 Tax Efficient Planned
Giving/person/week1
2011 Electoral
Roll1
Environment
Housing Costs
Education
76%
65%
Issues to look out for in your parish
£52
Annual Parochial Returns
Oct
ob
er W
eekl
y
Att
end
ance
1
0-4
5-15
2011 Parish
Share Paid1
281
PARISH OVERVIEW
13%
Parish
8%
13%
66%
Age Profile (20112)22,300
Proportion Christian
Sorry, no Fresh Expressions listed for this parish.Fresh Expressions
23,300
BICESTER & ISLIP
OXFORD
16-64
Age
Gro
up
Diocese
627031
Deanery
Archdeaconry
20013
20112
20013
20112
Included Churches
Oxford
Population
Housing Access
Parish of: Bicester w Caversfield
Parish Code: 270031
65 +
£96,000
Low/No Qualifications
627034
Research
&
Statistics
0
100
200
300
400
500
2007 2008 2009 2010 2011
Highestweek
Average
LowestWeek
3
Parish 20112 Deanery 20112 Diocese 20112
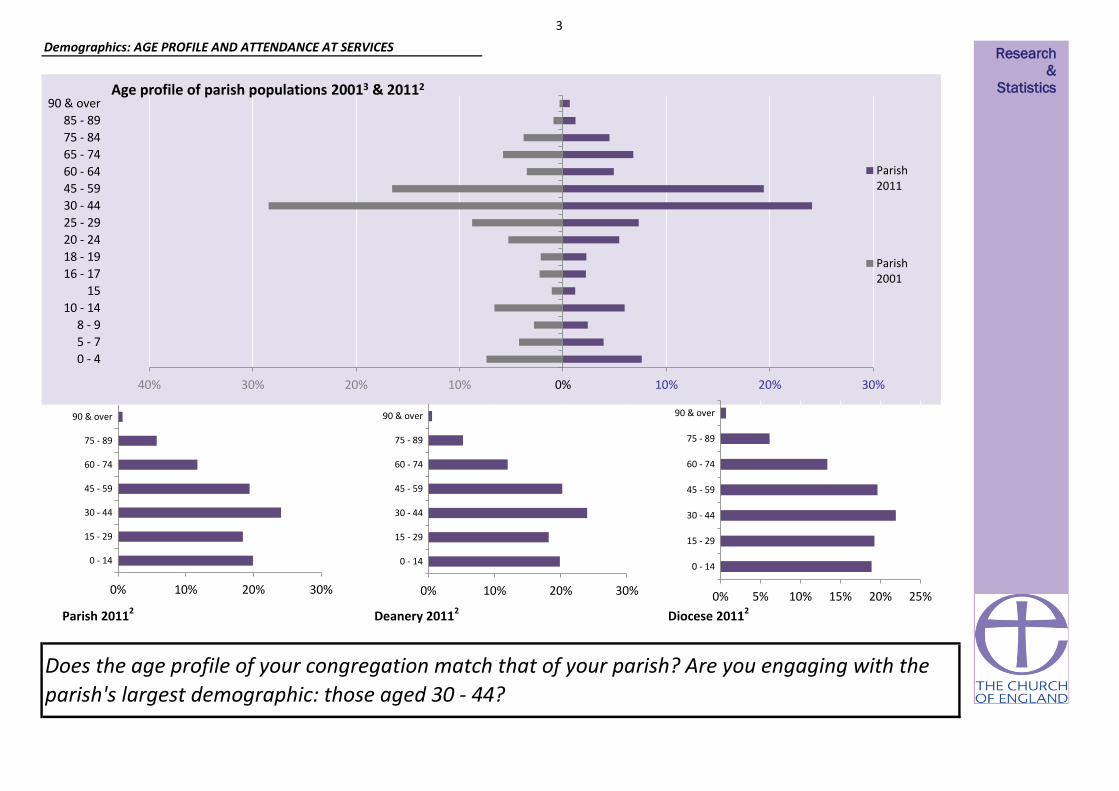
Demographics: AGE PROFILE AND ATTENDANCE AT SERVICES
Does the age profile of your congregation match that of your parish? Are you engaging with the
parish's largest demographic: those aged 30 - 44?
40% 30% 20% 10% 0% 10% 20% 30%
0 - 4
5 - 7
8 - 9
10 - 14
15
16 - 17
18 - 19
20 - 24
25 - 29
30 - 44
45 - 59
60 - 64
65 - 74
75 - 84
85 - 89
90 & overAge profile of parish populations 20013 & 20112
Parish2011
Parish2001
0% 10% 20% 30%
0 - 14
15 - 29
30 - 44
45 - 59
60 - 74
75 - 89
90 & over
0% 10% 20% 30%
0 - 14
15 - 29
30 - 44
45 - 59
60 - 74
75 - 89
90 & over
0% 5% 10% 15% 20% 25%
0 - 14
15 - 29
30 - 44
45 - 59
60 - 74
75 - 89
90 & over
Research
&
Statistics

4
15%
Diocesan Congregation4 (2007)
Parish Population2 (2011)
(nearest 50)
Demographics: AGE PROFILE AND ATTENDANCE AT SERVICES
Comparable Age profile of Adults
25%
65 +
40%
Age
1,800
3,150
18 - 44
22% 38%
15,300
3,050
0 - 4
5 - 15
16 - 64
Diocesan Core Congregation Age Profile4 (2007)
Diocesan Population2 (2011) 37%
45 - 64
Does the age profile of your congregation match that of your parish?
65 +
Infant Baptisms
20111
59
Highest Weeks
Attendance 20111
52
248
9%
13%
16%
22%
40%
0% 10% 20% 30% 40% 50%
Research
&
Statistics

5
Detailed Parish Ethnicity2 2011
Parish Ethnicity2 2011 Parish Ethnicity3 2001 Diocese Ethnicity2 2011
Arab Other Ethnic Group
<1%1%
Indian Bangladeshi Chinese
African Caribbean
Parish
Percentage
ME: 7%
Other Asian
1%
Does the ethnicity profile of your congregation match that of your parish? Are you engaging with the parish's
largest demographics: those describing themselves as White or Asian/Asian British?
<1%
3%
1%1% <1%
0%
<1%<1%
Demographics: ETHNICITY
<1%
86%
Other White
6%
White & Asian Other Mixed
1%
1%
<1%
British
White & Black
Caribbean
Diocesan Population2 (2011)
Diocesan Core Congregation4 (aged 18+ only) (2007)
Percentage Minority Ethnic Background
15%
1%
Irish
Pakistani
<1%
Other Black
Gypsy or Irish
Traveller
White & Black
African
Research
&
Statistics
White
Mixed/Multipleethnic group
Asian/Asian British
Black or BlackBritish
Other ethnicgroup

6
Cannot speak English well or cannot speak
English Can speak English well or very well
1% 5%Have English as their main language (English or
Welsh if in Wales)
94%2Percentage of people who
Demographics: Integration
10 years or more
87%
2 years or more but less
than 5 years
Born in the UK
Less than 2 years
2% 3% 5%
5 years or more but less
than 10 years
Are services in your parish accessible to all residents? Do you offer any services in foreign
languages? What can you offer those who may not have been in the UK for long?
2Resident in UK:
2%
Research
&
Statistics
7
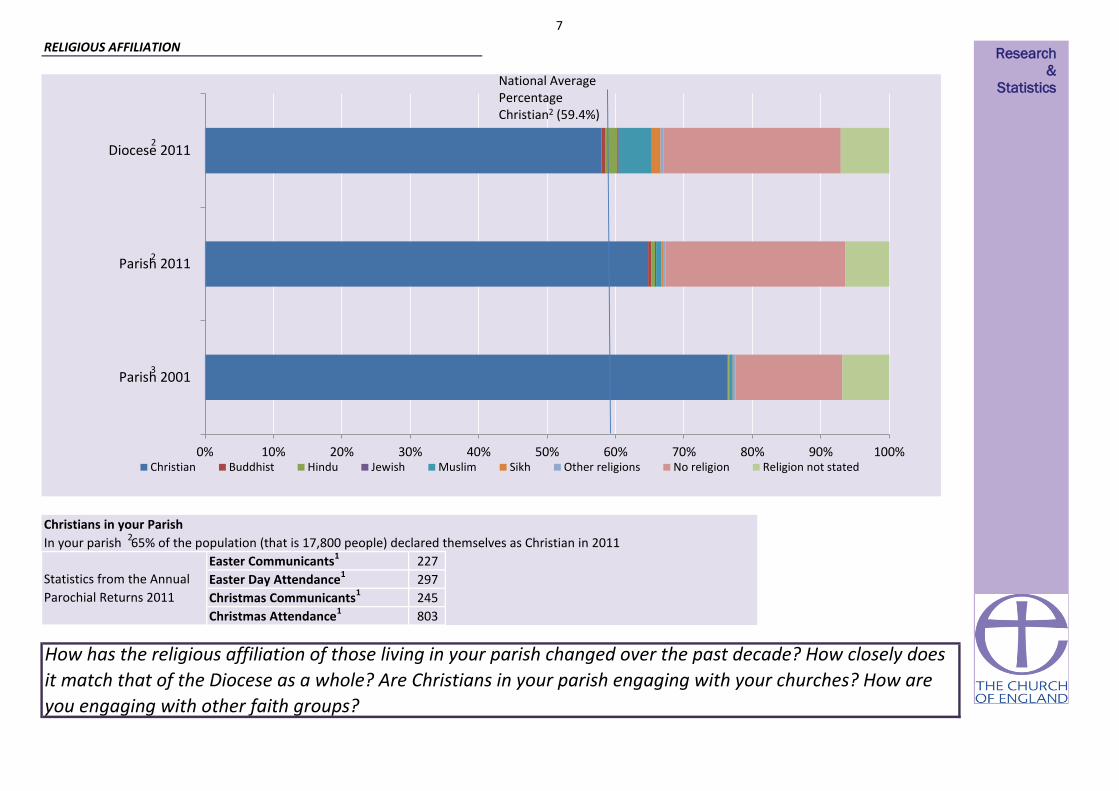
In your parish 65% of the population (that is 17,800 people) declared themselves as Christian in 2011
803
Statistics from the Annual
Parochial Returns 2011
Easter Communicants1
Easter Day Attendance1
Christmas Communicants1
Christmas Attendance1
Christians in your Parish
RELIGIOUS AFFILIATION
227
297
245
How has the religious affiliation of those living in your parish changed over the past decade? How closely does
it match that of the Diocese as a whole? Are Christians in your parish engaging with your churches? How are
you engaging with other faith groups?
0% 10% 20% 30% 40% 50% 60% 70% 80% 90% 100%
Parish 2001
Parish 2011
Diocese 2011
Christian Buddhist Hindu Jewish Muslim Sikh Other religions No religion Religion not stated
2
3
National Average Percentage Christian2 (59.4%)
Research
&
Statistics
2
2

8
Household Spaces2 2011
With at least one usual resident i.e. not vacant 97%
<1%Caravan or other mobile or temporary structure
6650 1550 1100
Who lives in your parish? Are there issues with access to housing? How permenant are your
parishioners?
Tenure2
Social rented as a percentage of all households2 12%
Social Rented householdsOwner occupied households
(including shared ownership)
Private Rented households
(including those living rent free)
HOUSEHOLDS, LIFESTYLE AND THE COMMUNITY I Research
&
Statistics

9
Household composition in your parish2 All
percentages are of the total number of
households with residents. The smaller pie
charts show the breakdown of a section of
the larger ones. You can use the colours to
match.
Lone Parent
Households as a
percentage of all
households with
children2
17%
Who lives in your parish? Are there a lot of households with children? What about lone parent
households? Are there a lot of people living alone?
HOUSEHOLDS, LIFESTYLE AND THE COMMUNITY II
Aged 65 and over 10%
Other 15%
One Person 25%
One family 68%
Other households
7%
Dependent children 2%
All aged 65 and over
<1%
Other 4%
Aged 65 and over 7%
Married or same-sex civil partnership couple 40%
Cohabiting couple 12%
Lone parent 9%
No children 13%
Dependent children 20%
Non-dependent children 6%
No children 7%
Dependent children 5%
Non-dependent
children <1%
Dependent children 6%
Non-dependent children 3%
Research
&
Statistics
10
Weddings & Blessings in 2010
Weddings & Blessings in 201115 2
Your Parish Churches held1
Do you hold many weddings in your parish? How is your parish supporting those in the above
categories?
15 No
Marital and civil partnership status
60% 40% 20% 0% 20% 40% 60%
Living in a couple: Married or in a registered same-sex civil partnership
Living in a couple: Cohabiting
Not living in a couple: Single (never married or never registered a same-sex civilpartnership)
Not living in a couple: Married or in a registered same-sex civil partnership
Not living in a couple: Separated (but still legally married or still legally in a same-sexcivil partnership)
Not living in a couple: Divorced or formerly in a same-sex civil partnership which isnow legally dissolved
Not living in a couple: Widowed or surviving partner from a same-sex civilpartnership
2001 2011
Research
&
Statistics 2 3
11
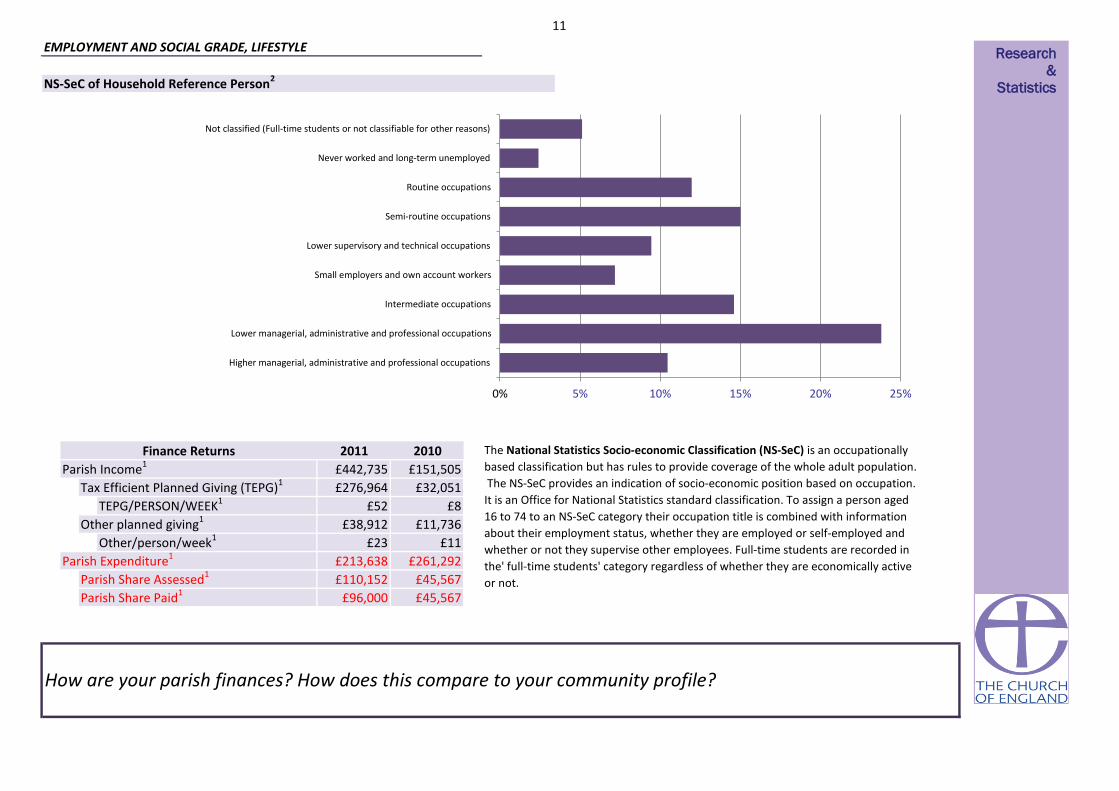
£8
£11,736
£11
£261,292
£45,567
£45,567
Parish Expenditure1
TEPG/PERSON/WEEK1
Other/person/week1Other planned giving1
How are your parish finances? How does this compare to your community profile?
£276,964
£442,735
EMPLOYMENT AND SOCIAL GRADE, LIFESTYLE
The National Statistics Socio-economic Classification (NS-SeC) is an occupationally
based classification but has rules to provide coverage of the whole adult population.
The NS-SeC provides an indication of socio-economic position based on occupation.
It is an Office for National Statistics standard classification. To assign a person aged
16 to 74 to an NS-SeC category their occupation title is combined with information
about their employment status, whether they are employed or self-employed and
whether or not they supervise other employees. Full-time students are recorded in
the' full-time students' category regardless of whether they are economically active
or not.Parish Share Assessed1
Parish Share Paid1
£38,912
£23
£213,638
£110,152
£96,000
£52
£32,051Tax Efficient Planned Giving (TEPG)1
Finance Returns 2010
NS-SeC of Household Reference Person2
£151,505Parish Income12011
Research
&
Statistics
0% 5% 10% 15% 20% 25%
Higher managerial, administrative and professional occupations
Lower managerial, administrative and professional occupations
Intermediate occupations
Small employers and own account workers
Lower supervisory and technical occupations
Semi-routine occupations
Routine occupations
Never worked and long-term unemployed
Not classified (Full-time students or not classifiable for other reasons)

12
17%
83%
Households
5%
EMPLOYMENT AND SOCIAL GRADE, LIFESTYLE
How much free time do residents of your parish have? How accessible are your churches to those
with/without cars?
Access to at least 1 car or van
Household Mobility2
Proportion of population aged 60+ who are in
receipt of the Guaranteed part of Pension
Credit5
12%
Proportion of working age persons (16-74) with
no qualifications2 21%
Proportion of working age population who are
in receipt of a key out-of-work benefit5
No access to a car or van
Part-time: 15 hours or less
worked 8%
Part-time: 16 to 30 hours
worked 16%
Full-time: 31 to 48 hours worked
64%
Full-time: 49 or more hours
worked 13%
Hours Worked2
Part-time: 15 hours or less worked Part-time: 16 to 30 hours worked
Full-time: 31 to 48 hours worked Full-time: 49 or more hours worked
Research
&
Statistics

13
Church Schools in the parish
ST EDBURGS CE PRIMARY SCHOOL
Parish2 2011 (proportion of 16+ population) National2 2011 (proportion of 16+ population)
EDUCATION AND SCHOOLS
How qualified are residents of your parish? What Church of England schools are available?
19%
17%
16% 4%
12%
25%
6%
22%
13%
15% 4%
12%
27%
6% No qualifications (No formal qualifications)
Level 1 qualifications (1-4 GCSEs or equivalent)
Level 2 qualifications (5 GCSEs or equivalent)
Apprenticeships
Level 3 qualifications (2 or more A-levels orequivalent )
Level 4 qualifications and above (Bachelorsdegree or equivalent, and higher qualifications)
Other qualifications (including foreignqualifications)
Research
&
Statistics
14
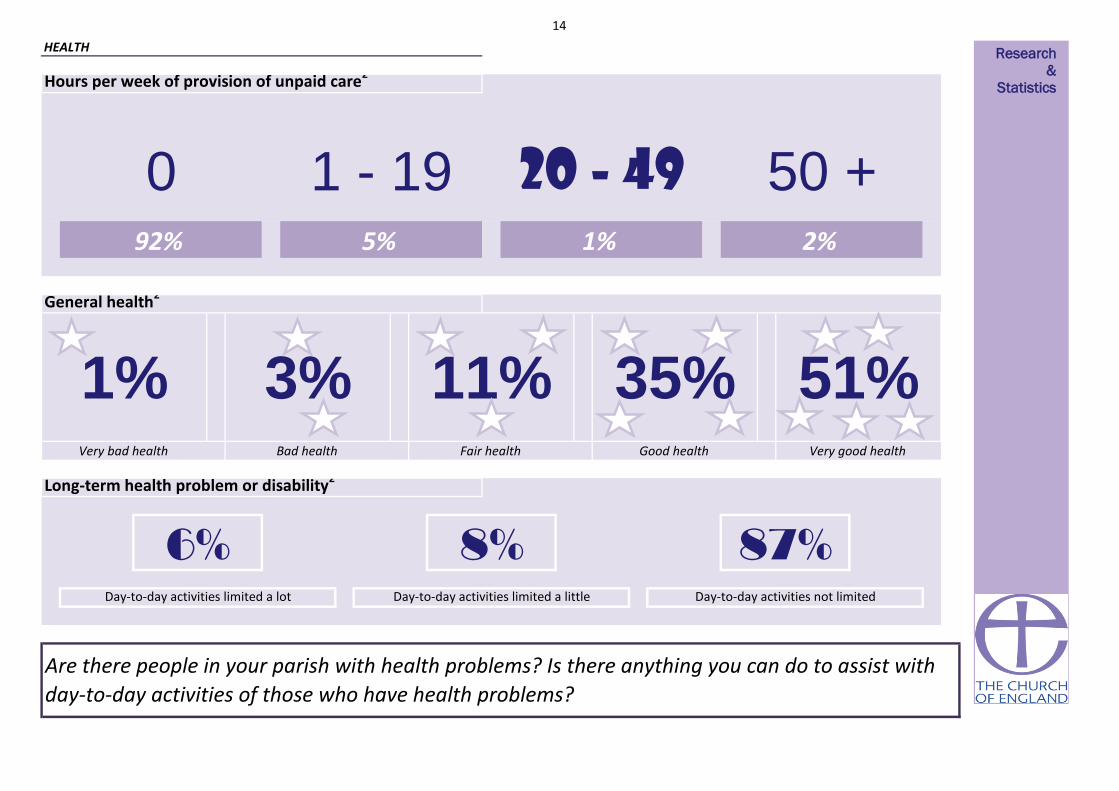
Hours per week of provision of unpaid care2
1% 2%
Very bad health Bad health Fair health
1 - 19
Are there people in your parish with health problems? Is there anything you can do to assist with
day-to-day activities of those who have health problems?
HEALTH
0
Long-term health problem or disability2
50 +92% 5%
Good health Very good health
1%
Day-to-day activities limited a lot Day-to-day activities limited a little Day-to-day activities not limited
6% 8% 87%
3% 11% 35% 51%
General health2
20 - 49
Research
&
Statistics

15
You parish can be categorised as in the most or least deprived 10% or 50% of all parishes within the diocese and of all parishes nationally
50% most deprived 50% most deprived
Life expectancy at birth (girls)6 (1999-2003)
Life Expectancy at birth (boys)6 (1999-2003)
12%
10.8
50% most deprived12% 50% least deprived
50% most deprivedPercentage of Children under 16 in Poverty7 (2010)
Percentage of working age persons (16-74) with no
qualifications2 (2011)
50% least deprived
Life expectancy at birth can give an idea of overall quality of life. Life expectancy is an average. Women tend to have greater life expectancy. Life expectany can be affected by family history, marital status, economic status,
physique, exercise, diet, drug use including smoking and alcohol consumption, disposition, education, environment, sleep, climate, and health care.
Proportion of the population aged 60+ who are in receipt of
the Guaranteed part of Pension Credit5 (2012)
11%
Social rented as a percentage of all households2 (2011)
Index of Multiple Deprivation (IMD)8 (2010)
Proportion of the working age population who are in receipt
of a key out-of-work benefit5 (2012)
Lone Parent Households as a percentage of all households
with children2 (2011)
Pension Credit is an income related benefit made up of 2 parts - Guarantee Credit and Savings Credit. The guaranteed part tops up weekly income if it’s below £142.70 (single people) or £217.90 (couples) so those who
receive this are on a low income. This statistic only covers people living in private households, and not residential institutions (such as nursing homes).
50% least deprived
The proportion of children in families in receipr of either out of work benefits or tax credits where their reported income is less than 60% median income. Poor children may be excluded from participating in society. They may be unable to afford school
trips and activities; school uniforms or warm winter clothes, be unable to go swimming, have friends round for tea or celebrate their birthdays. Many will never have a holiday. Children who grow up poor are more likely to leave school without
qualifications, have lower employment chances, thus restricting their ability to get a good job and financially contribute to society.
50% most deprived
21% 50% most deprived
DEPRIVATION AND KEY ISSUES AFFECTING PARISHIONERS
Score
77
50% least deprived84
5%
Deprivation is considered to be a multi-dimensional problem, encompassing a range of domains such as financial, health, education, services or crime. continuous measure of relative deprivation therefore there is no definitive point on the scale below
which areas are considered to be deprived and above which they are not.While being in the most deprived 10% may indicate financial disadvantage, it could equally be due to isolated living.
Number of people aged 16 to State Pension age claiming: Jobseeker’s Allowance (JSA), Employment and Support Allowance (ESA), Incapacity Benefit (IB), Income Support (IS) (as a lone parent or in the “other” category),
Other income related benefits.
Social housing is housing that is let at low rents and on a secure basis to people in housing need. It is generally provided by councils and not-for-profit organisations such as housing associations. Vulnerable groups are often
concentrated in the social housing sector, with low rates of employment and low income levels
Children in single parent families have a much higher risk of living in poverty than children in couple families. Single parents may rely on informal childcare.
What are the particular issues that affect your parish? Are you doing anything to address these?
50% least deprived
Deprivation Indicator Diocesan Position National Position
A low-level of skill or educational attainment is one indicator of social disadvantage. Qualifications may make it easier to find employment. Learning also helps promote active citizenship and combat social exclusion.
17%
50% least deprived
50% most deprived
50% least deprived
50% most deprived
50% most deprived
50% most deprived
50% most deprived
Research
&
Statistics

16
0
0.1 50% least deprived 0
1
1
10% most deprived
50% most deprived
50% least deprived
50% most deprived
50% most deprived
50% least deprived
0 0 0
50% least deprived
50% most deprived 50% least deprived
00 0
0
0
0
1
0
50% most deprived
50% least deprived
50% most deprived
50% least deprived
50% least deprived
50% most deprived
50% least deprived
50% least deprived
0 2 2
0Skills Sub-domain 18.0
2
0
0
0
00 0
2
0
0
0
5
2
0
3
1
1
0 0
0
0 1
0
3
0
3
0
0
2
0
2
0
0.1
0.0
5%
0 0
14050% most deprived
0
0
0
1
0
0
0
19.6
0
50% least deprived
10% most deprived
0
00
50% most deprived 1
0
50% most deprived 2
50% least deprived 0
Number of LSOAs amongst
least deprived*Diocesan position National position
HEALTH DEPRIVATION AND
DISABILITY-0.5
Average
Score for
parishIMD Subdomains8 (2010)
INCOME
EMPLOYMENT
Number of LSOAs amongst
most deprived*
1%
0
Income Deprivation Affecting
Children Index0.1
CRIME AND DISORDER
LIVING ENVIRONMENT
Indoors Sub-domain
Outdoors Sub-domain
0
0
Geographical Barriers Sub-domain
9.1
50% least deprived
EDUCATION SKILLS AND TRAINING
BARRIERS TO HOUSING AND SERVICES50% least deprived
Wider Barriers Sub-domain
Children/Young People Sub-domain21.3 0 0
0
0
50% most deprived 50% most deprived
0
0
0
0
0
-0.5
050% least deprived
8.3
26.5
16.2
8.9
21.3
50% most deprived 50% most deprived
10% 1%
DEPRIVATION AND KEY ISSUES AFFECTING PARISHIONERSIt is important to note that these statistics are a measure of deprivation, not affluence, and to recognise that not every person in a highly deprived area will themselves be
deprived. Equally, there will be some deprived people living in the least deprived areas.
Deprivation covers a broad range of issues and refers to unmet needs caused by a lack of resources of all kinds, not just financial. The English Indices of Deprivation
attempt to measure a broader concept of multiple deprivation, made up of several distinct dimensions, or domains, of deprivation. Seven domains of deprivation are
combined to produce the overall Index of Multiple Deprivation. Each domain contains a number of component indicators. The English Indices of Deprivation are a
continuous measure of relative deprivation therefore there is no definitive point on the scale below which areas are considered to be deprived and above which they are
not. Deprived areas have been defined in this release as those containing LSOAs that are amongst the 10 per cent most deprived in England according to the overall Index
of Multiple Deprivation.
Overall IMD 1 300
5% 10%
10.8 50% most deprived
20
20 1
*There are 17 full or partial LSOAs included in this parish
0 0
What are the particular issues that affect your parish? Are you doing anything to address these?
Income Deprivation Affecting Older
People Index
0
Research
&
Statistics

17
This spotlight has given you some information about your parish both in terms of your own church congregations and your local community. This is not an
end in itself, but rather a starting place for you to explore further. Questions to consider might include:
• What does our congregation look like?
• How does it compare to the local population?
• What other churches are there in the area? What parts of the community do they reach? Which parts of the community are being missed?
• What other local organisations or centres are there, that might bring people into our parish? Examples might be Hospitals or health centres, prisons, job
centres, homeless shelters, schools, charities, mother and toddler groups, uniformed organisations, community centres, libraries, shops, offices, stations?
How can we interact with these people?
• What areas of our parish do we know well or less well?
• How does the local community change between weekdays and weekends? How do our services and events fit with the shifting local population?
• Is our website/'A Church Near You' profile up to date?
• Are our records up to date?
****************************************************************************************************************************
What to do next?
Your notes
WHAT TO DO NEXT Research
&
Statistics

18
Sources of further information
Public Health Observatories - APHO JSNA Datasets (The datasets are intended to cover a
range of issues, focused on underlying determinants of health and conditions which account
for substantial numbers of preventable diseases and deaths.)
A Church Near You
www.achurchnearyou.com
UpMyStreet - UK house prices, property, crime, local neighbourhood & schools
London Street Gangs - Territory maps and background information
http://www.londonstreetgangs.com/
Hint: Scroll to the bottom of the "Gang Maps" page to see boundaries.
AboutMyArea - The local interactive site - news, reviews, what's on, events, businesses
Research & Statistics GIS
http://www.churchofengland.org/about-us/facts-stats/research-statistics/census-2011.aspx
Church Urban Fund
www.cuf.org.uk
Homeless Pages - Information, Research and Publications on homelessness
http://www.homelesspages.org.uk/
http://www.upmystreet.com/
Hint: Use the "My Neighbourhood" tab
The network of Public Health Observatories - Health Profiles
www.apho.org.uk/resource/view.aspx?RID=91736
The Poverty Site - Geographic Analysis
www.poverty.org.uk/summary/regional.shtml
http://www.apho.org.uk/default.aspx?QN=HP_FINDSEARCH2011
MurderMap - London Homicide Reported Direct from The Old Bailey
Police.uk - Local crime and policing information for England and Wales
http://www.police.uk/
ONS - Neighbourhood Statistics
http://www.aboutmyarea.co.uk/
http://neighbourhood.statistics.gov.uk/
Hint: Use the summary box
http://www.murdermap.co.uk/
Research
&
Statistics

19
Proportion of the population aged 60+ who are in receipt of the Guaranteed part of Pension Credit (August 2012)
Estimated using LSOA level data sourced from http://83.244.183.180/NESS/BEN/iben.htm
Proportion of the working age population who are in receipt of a key out-of-work benefit (Q3 2012)
Life Expectancy at birth (boys) (1999-2003)
Estimated using ward level data from ONS.
Life expectancy at birth (girls) (1999-2003)
Estimated using ward level data from ONS.
Percentage of Children under 16 in Poverty (2009)
Estimated using LSOA level data from http://www.hmrc.gov.uk/statistics/child-poverty-stats.htm
IMD (2010)
Methodology: Government data is published on government boundaries that do not match ecclesiastical boundaries. In order to produce parish population and demographic
estimates we have worked with the ONS to use a best fit modelling process. As such, these statistics can only be considered estimates and, particularly in very diverse areas, are
best used in the context of local knowledge. Where parish populations are sparse the figures for government areas overlapping the parish are used.
Parish estimates from the census have been calculated using the census output area data published by the ONS. These are provisional estimates, and when more granular data at
postcode level is available, will be revised. Estimates have been modelled by allocating the population weighted centroid of each output area to the parish within which it falls.
This means that some parishes have not been allocated population, however proportions for demographic variables have been calculated based on the output areas overlaying
the parish.
For further information about this process, please contact [email protected].
Contains public sector information licensed under the Open Government Licence v1.0 http://www.nationalarchives.gov.uk/doc/open-government-licence/
Estimated using OA level data sourced from ONS Census Data 2011, ONS
Estimated using OA level data sourced from ONS Census Data 2001, ONS
When analysing data, it is important to consider that some parishes are very small and proportions may be very large even where very few cases meet the criteria.
ABOUT THIS DATA
http://www.churchofengland.org/about-us/facts-stats/research-statistics/clergydiversityaudit2005linkpage.aspx
Estimated using OA level data from DWP Information, Governance and Security Directorate from
http://statistics.dwp.gov.uk/asd/asd1/tabtools/census_output_area_data/index.php?page=census_output_area_data
Annual parochial returns
ONS Census data 2011
ONS Census data 2001
2007 Church Diversity Survey
DWP
ONS
HMRC
Department for Communities and Local Government
1
2
3
4
5
6
7
8
These have been collected annually between 2007 and 2011 by the Research and Statistics team, Archbishops’ Council
When quoting figures derived from this data, care should be taken with the level of accuracy quoted.
Estimated using LSOA level data from Communities and Local Government, 2010.
https://www.gov.uk/government/uploads/system/uploads/attachment_data/file/6320/1870718.pdf
Research
&
Statistics
1
Getting to know your parish
What is this spotlight?
How should I use it?
Questions
Contents
This short spotlight brings together a range of information about your parish,
both in terms of your congregations, but also the wider community living in
your area. It covers areas such as Christian affiliation, population age and
ethnicity profiles, household structures, deprivation, employment, schools
and qualifications, alongside church statistics such as attendance and giving.
There is information at the end of the spotlight about where this data comes
from and how it was calculated. If you have any further queries then please
do contact the Research and Statistics team at
This spotlight is not an end in itself, but rather a starting place for you to
explore further. You may want to discuss it at a PCC meeting or with
leadership teams. We’ve included some questions on each page to help you
to think about the information, however some things will be of more
relevance in some areas than others, and these are just suggestions to get
you started. We’ve also included some bigger questions about what to do
next at the end of the spotlight on page 17. There’s space for you to write
some notes here. It might be helpful to write a short paragraph to
summarise your community profile or note down anything that has struck
you as particularly important. There are also details at the end for where
you can find further information should you want to dig a little deeper.
1. Summary: a brief overview of your parish, including what look to be 5 of
the most pressing social issues in your area
2. Age: age profile of your community
3. Ethnicity: ethnicity profile of your community
4. Integration: English language speaking and length of UK residency in your
community
5. Religious affiliation: religious affiliation in your community
6. Households: families, dependents, one person households, temporary
residents and housing tenure
7. Marital and civil partnership status
8. Employment: occupations, benefits and mobility in your community
9. Education: CofE schools and qualification levels in your community
10. Health: people with health problems and carers in your community
11. Deprivation: different types of deprivation in your community
Research
&
Statistics
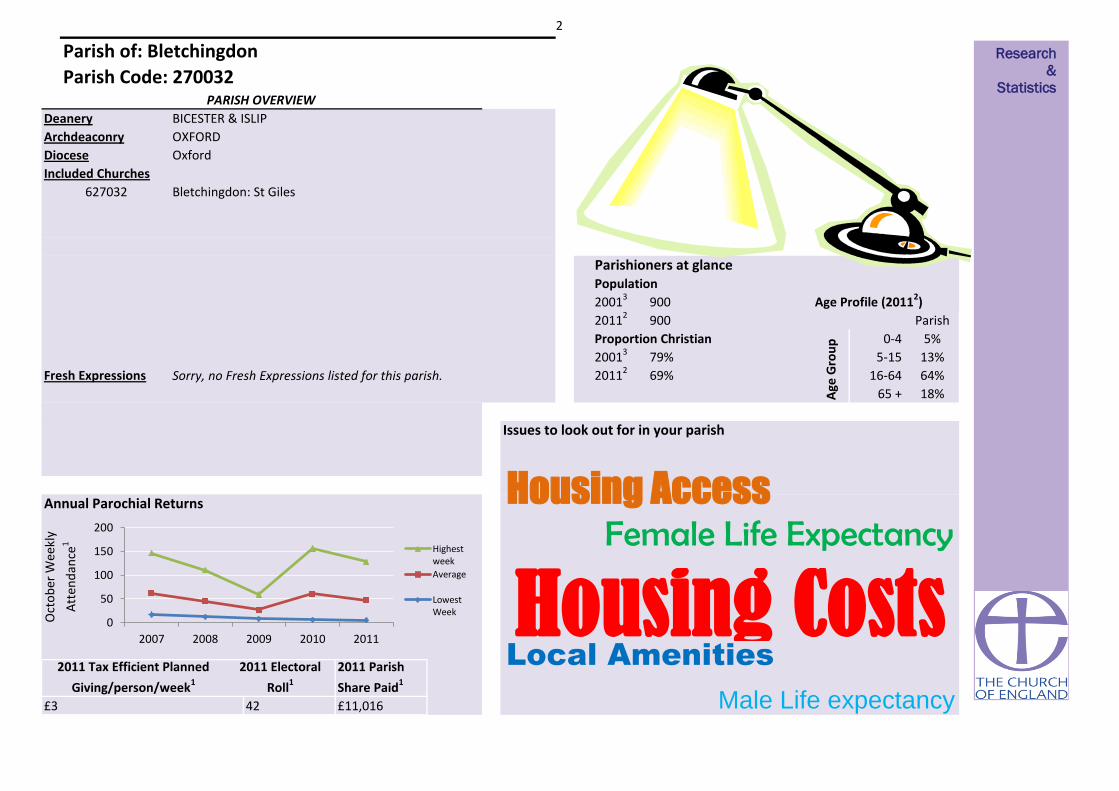
2
Parishioners at glance
Bletchingdon: St Giles
2011 Tax Efficient Planned
Giving/person/week1
2011 Electoral
Roll1
Male Life expectancy
Local Amenities
Housing Costs
79%
69%
Issues to look out for in your parish
£3
Annual Parochial Returns
Oct
ob
er W
eekl
y
Att
end
ance
1
0-4
5-15
2011 Parish
Share Paid1
42
PARISH OVERVIEW
18%
Parish
5%
13%
64%
Age Profile (20112)900
Proportion Christian
Sorry, no Fresh Expressions listed for this parish.Fresh Expressions
900
BICESTER & ISLIP
OXFORD
16-64
Age
Gro
up
Diocese
627032
Deanery
Archdeaconry
20013
20112
20013
20112
Included Churches
Oxford
Population
Female Life Expectancy
Parish of: Bletchingdon
Parish Code: 270032
65 +
£11,016
Housing Access
Research
&
Statistics
0
50
100
150
200
2007 2008 2009 2010 2011
Highestweek
Average
LowestWeek

3
Parish 20112 Deanery 20112 Diocese 20112
Demographics: AGE PROFILE AND ATTENDANCE AT SERVICES
Does the age profile of your congregation match that of your parish? Are you engaging with the
parish's largest demographic: those aged 45 - 59?
25% 20% 15% 10% 5% 0% 5% 10% 15% 20% 25% 30%
0 - 4
5 - 7
8 - 9
10 - 14
15
16 - 17
18 - 19
20 - 24
25 - 29
30 - 44
45 - 59
60 - 64
65 - 74
75 - 84
85 - 89
90 & overAge profile of parish populations 20013 & 20112
Parish2011
Parish2001
0% 5% 10% 15% 20% 25%
0 - 14
15 - 29
30 - 44
45 - 59
60 - 74
75 - 89
90 & over
0% 10% 20% 30%
0 - 14
15 - 29
30 - 44
45 - 59
60 - 74
75 - 89
90 & over
0% 5% 10% 15% 20% 25%
0 - 14
15 - 29
30 - 44
45 - 59
60 - 74
75 - 89
90 & over
Research
&
Statistics

4
15%
Diocesan Congregation4 (2007)
Parish Population2 (2011)
(nearest 50)
Demographics: AGE PROFILE AND ATTENDANCE AT SERVICES
Comparable Age profile of Adults
25%
65 +
40%
Age
50
100
18 - 44
22% 38%
600
150
0 - 4
5 - 15
16 - 64
Diocesan Core Congregation Age Profile4 (2007)
Diocesan Population2 (2011) 37%
45 - 64
Does the age profile of your congregation match that of your parish?
65 +
Infant Baptisms
20111
2
Highest Weeks
Attendance 20111
58
70
9%
13%
16%
22%
40%
0% 10% 20% 30% 40% 50%
Research
&
Statistics

5
Detailed Parish Ethnicity2 2011
Parish Ethnicity2 2011 Parish Ethnicity3 2001 Diocese Ethnicity2 2011
Arab Other Ethnic Group
0%<1%
Indian Bangladeshi Chinese
African Caribbean
Parish
Percentage
ME: 4%
Other Asian
<1%
Does the ethnicity profile of your congregation match that of your parish? Are you engaging with the parish's
largest demographics: those describing themselves as White or Asian/Asian British?
<1%
3%
<1%1% 0%
0%
1%<1%
Demographics: ETHNICITY
<1%
92%
Other White
3%
White & Asian Other Mixed
<1%
<1%
0%
British
White & Black
Caribbean
Diocesan Population2 (2011)
Diocesan Core Congregation4 (aged 18+ only) (2007)
Percentage Minority Ethnic Background
15%
1%
Irish
Pakistani
0%
Other Black
Gypsy or Irish
Traveller
White & Black
African
Research
&
Statistics
White
Mixed/Multipleethnic group
Asian/Asian British
Black or BlackBritish
Other ethnicgroup

6
Cannot speak English well or cannot speak
English Can speak English well or very well
0% 2%Have English as their main language (English or
Welsh if in Wales)
98%2Percentage of people who
Demographics: Integration
10 years or more
91%
2 years or more but less
than 5 years
Born in the UK
Less than 2 years
1% 2% 5%
5 years or more but less
than 10 years
Are services in your parish accessible to all residents? Do you offer any services in foreign
languages? What can you offer those who may not have been in the UK for long?
2Resident in UK:
1%
Research
&
Statistics
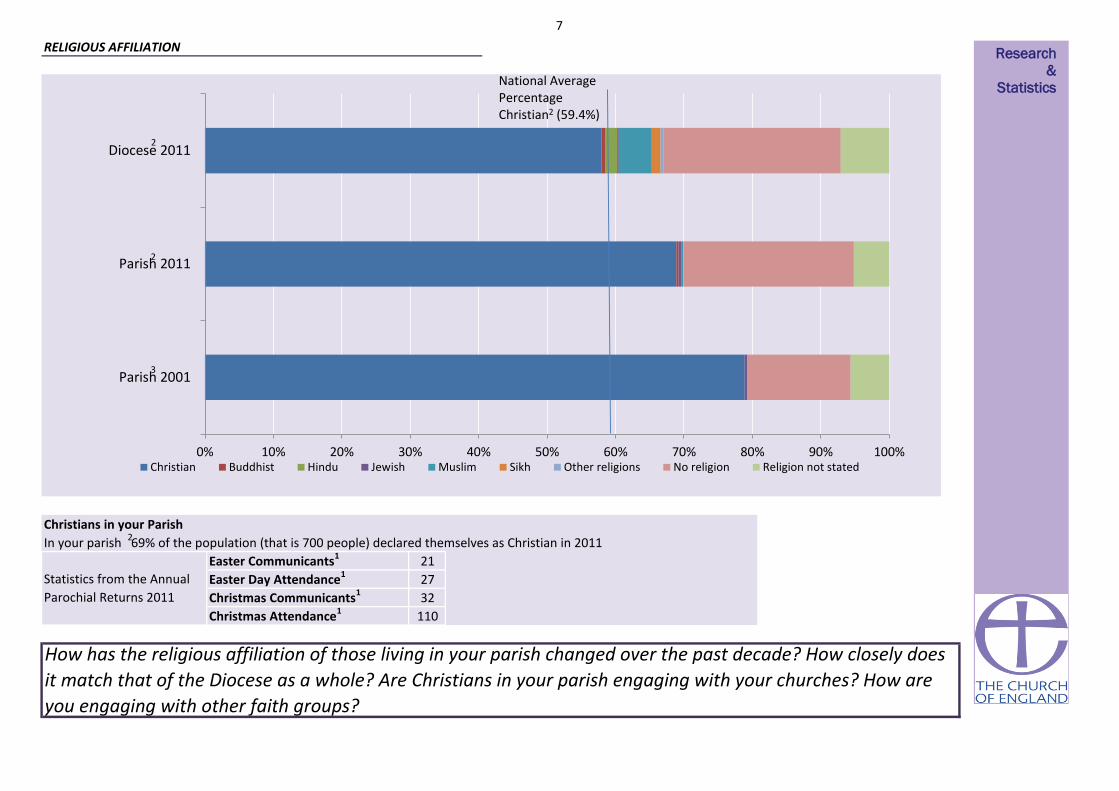
7
In your parish 69% of the population (that is 700 people) declared themselves as Christian in 2011
110
Statistics from the Annual
Parochial Returns 2011
Easter Communicants1
Easter Day Attendance1
Christmas Communicants1
Christmas Attendance1
Christians in your Parish
RELIGIOUS AFFILIATION
21
27
32
How has the religious affiliation of those living in your parish changed over the past decade? How closely does
it match that of the Diocese as a whole? Are Christians in your parish engaging with your churches? How are
you engaging with other faith groups?
0% 10% 20% 30% 40% 50% 60% 70% 80% 90% 100%
Parish 2001
Parish 2011
Diocese 2011
Christian Buddhist Hindu Jewish Muslim Sikh Other religions No religion Religion not stated
2
3
National Average Percentage Christian2 (59.4%)
Research
&
Statistics
2
2

8
Household Spaces2 2011
With at least one usual resident i.e. not vacant 94%
1%Caravan or other mobile or temporary structure
200 50 50
Who lives in your parish? Are there issues with access to housing? How permenant are your
parishioners?
Tenure2
Social rented as a percentage of all households2 20%
Social Rented householdsOwner occupied households
(including shared ownership)
Private Rented households
(including those living rent free)
HOUSEHOLDS, LIFESTYLE AND THE COMMUNITY I Research
&
Statistics
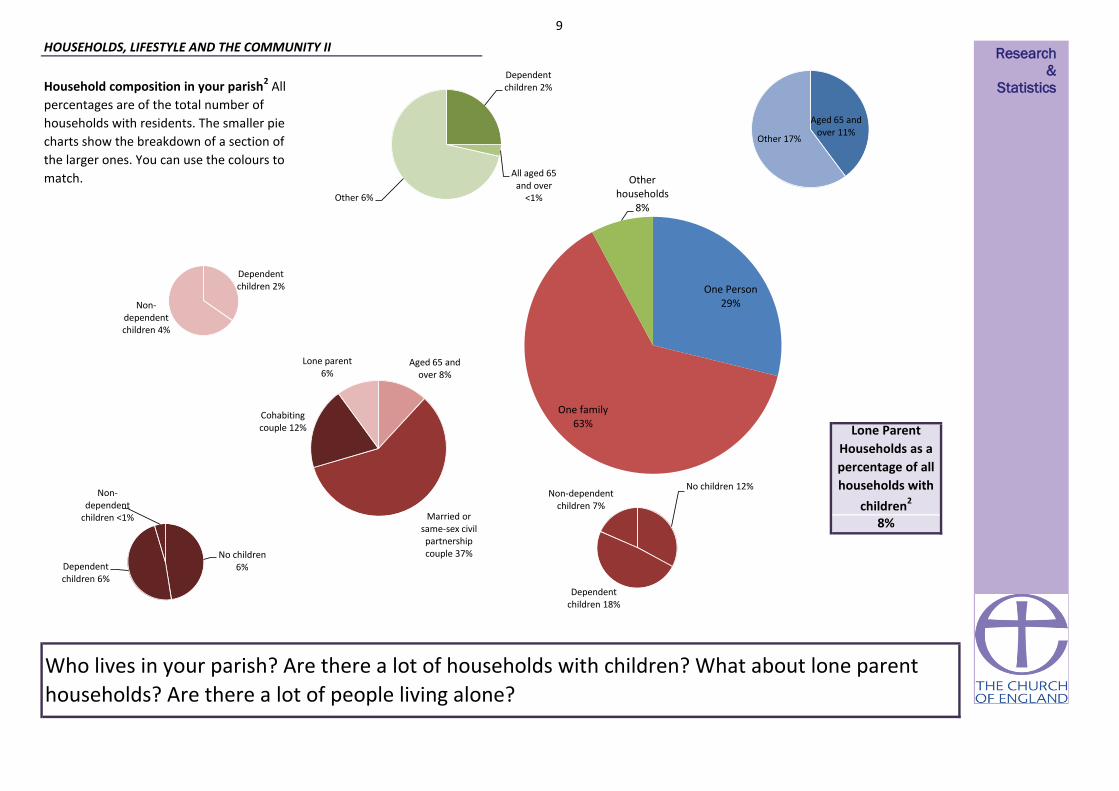
9
Household composition in your parish2 All
percentages are of the total number of
households with residents. The smaller pie
charts show the breakdown of a section of
the larger ones. You can use the colours to
match.
Lone Parent
Households as a
percentage of all
households with
children2
8%
Who lives in your parish? Are there a lot of households with children? What about lone parent
households? Are there a lot of people living alone?
HOUSEHOLDS, LIFESTYLE AND THE COMMUNITY II
Aged 65 and over 11%
Other 17%
One Person 29%
One family 63%
Other households
8%
Dependent children 2%
All aged 65 and over
<1% Other 6%
Aged 65 and over 8%
Married or same-sex civil partnership couple 37%
Cohabiting couple 12%
Lone parent 6%
No children 12%
Dependent children 18%
Non-dependent children 7%
No children 6% Dependent
children 6%
Non-dependent
children <1%
Dependent children 2%
Non-dependent children 4%
Research
&
Statistics

10
Wedding & Blessings in 2010
Wedding & Blessings in 20111 No
Your Parish Churches held1
Do you hold many weddings in your parish? How is your parish supporting those in the above
categories?
1 No
Marital and civil partnership status
80% 60% 40% 20% 0% 20% 40% 60%
Living in a couple: Married or in a registered same-sex civil partnership
Living in a couple: Cohabiting
Not living in a couple: Single (never married or never registered a same-sex civilpartnership)
Not living in a couple: Married or in a registered same-sex civil partnership
Not living in a couple: Separated (but still legally married or still legally in a same-sexcivil partnership)
Not living in a couple: Divorced or formerly in a same-sex civil partnership which isnow legally dissolved
Not living in a couple: Widowed or surviving partner from a same-sex civilpartnership
2001 2011
Research
&
Statistics 2 3

11
£3
£1,000
£19
£21,401
£10,491
£10,491
Parish Expenditure1
TEPG/PERSON/WEEK1
Other/person/week1Other planned giving1
How are your parish finances? How does this compare to your community profile?
£3,906
£41,312
EMPLOYMENT AND SOCIAL GRADE, LIFESTYLE
The National Statistics Socio-economic Classification (NS-SeC) is an occupationally
based classification but has rules to provide coverage of the whole adult population.
The NS-SeC provides an indication of socio-economic position based on occupation.
It is an Office for National Statistics standard classification. To assign a person aged
16 to 74 to an NS-SeC category their occupation title is combined with information
about their employment status, whether they are employed or self-employed and
whether or not they supervise other employees. Full-time students are recorded in
the' full-time students' category regardless of whether they are economically active
or not.Parish Share Assessed1
Parish Share Paid1
£1,000
£19
£22,375
£11,342
£11,016
£3
£3,929Tax Efficient Planned Giving (TEPG)1
Finance Returns 2010
NS-SeC of Household Reference Person2
£27,871Parish Income12011
Research
&
Statistics
0% 5% 10% 15% 20% 25%
Higher managerial, administrative and professional occupations
Lower managerial, administrative and professional occupations
Intermediate occupations
Small employers and own account workers
Lower supervisory and technical occupations
Semi-routine occupations
Routine occupations
Never worked and long-term unemployed
Not classified (Full-time students or not classifiable for other reasons)

12
9%
91%
Households
5%
EMPLOYMENT AND SOCIAL GRADE, LIFESTYLE
How much free time do residents of your parish have? How accessible are your churches to those
with/without cars?
Access to at least 1 car or van
Household Mobility2
Proportion of population aged 60+ who are in
receipt of the Guaranteed part of Pension
Credit5
12%
Proportion of working age persons (16-74) with
no qualifications2 21%
Proportion of working age population who are
in receipt of a key out-of-work benefit5
No access to a car or van
Part-time: 15 hours or less
worked 9%
Part-time: 16 to 30 hours worked
17%
Full-time: 31 to 48 hours worked
56%
Full-time: 49 or more hours
worked 18%
Hours Worked2
Part-time: 15 hours or less worked Part-time: 16 to 30 hours worked
Full-time: 31 to 48 hours worked Full-time: 49 or more hours worked
Research
&
Statistics

13
Church Schools in the parish
BLECHINGDON PAROCHIAL CE PRIMARY SCHOOL
Parish2 2011 (proportion of 16+ population) National2 2011 (proportion of 16+ population)
EDUCATION AND SCHOOLS
How qualified are residents of your parish? What Church of England schools are available?
18%
14%
18%
5%
11%
30%
4%
22%
13%
15% 4%
12%
27%
6% No qualifications (No formal qualifications)
Level 1 qualifications (1-4 GCSEs or equivalent)
Level 2 qualifications (5 GCSEs or equivalent)
Apprenticeships
Level 3 qualifications (2 or more A-levels orequivalent )
Level 4 qualifications and above (Bachelorsdegree or equivalent, and higher qualifications)
Other qualifications (including foreignqualifications)
Research
&
Statistics

14
Hours per week of provision of unpaid care2
2% 2%
Very bad health Bad health Fair health
1 - 19
Are there people in your parish with health problems? Is there anything you can do to assist with
day-to-day activities of those who have health problems?
HEALTH
0
Long-term health problem or disability2
50 +89% 8%
Good health Very good health
2%
Day-to-day activities limited a lot Day-to-day activities limited a little Day-to-day activities not limited
9% 8% 83%
4% 13% 34% 48%
General health2
20 - 49
Research
&
Statistics

15
You parish can be categorised as in the most or least deprived 10% or 50% of all parishes within the diocese and of all parishes nationally
50% most deprived 50% most deprived
Life expectancy at birth (girls)6 (1999-2003)
Life Expectancy at birth (boys)6 (1999-2003)
20%
13.8
50% most deprived12% 50% most deprived
50% most deprivedPercentage of Children under 16 in Poverty7 (2010)
Percentage of working age persons (16-74) with no
qualifications2 (2011)
50% most deprived
Life expectancy at birth can give an idea of overall quality of life. Life expectancy is an average. Women tend to have greater life expectancy. Life expectany can be affected by family history, marital status, economic status,
physique, exercise, diet, drug use including smoking and alcohol consumption, disposition, education, environment, sleep, climate, and health care.
Proportion of the population aged 60+ who are in receipt of
the Guaranteed part of Pension Credit5 (2012)
7%
Social rented as a percentage of all households2 (2011)
Index of Multiple Deprivation (IMD)8 (2010)
Proportion of the working age population who are in receipt
of a key out-of-work benefit5 (2012)
Lone Parent Households as a percentage of all households
with children2 (2011)
Pension Credit is an income related benefit made up of 2 parts - Guarantee Credit and Savings Credit. The guaranteed part tops up weekly income if it’s below £142.70 (single people) or £217.90 (couples) so those who
receive this are on a low income. This statistic only covers people living in private households, and not residential institutions (such as nursing homes).
50% least deprived
The proportion of children in families in receipr of either out of work benefits or tax credits where their reported income is less than 60% median income. Poor children may be excluded from participating in society. They may be unable to afford school
trips and activities; school uniforms or warm winter clothes, be unable to go swimming, have friends round for tea or celebrate their birthdays. Many will never have a holiday. Children who grow up poor are more likely to leave school without
qualifications, have lower employment chances, thus restricting their ability to get a good job and financially contribute to society.
50% least deprived
21% 50% most deprived
DEPRIVATION AND KEY ISSUES AFFECTING PARISHIONERS
Score
76
50% most deprived80
5%
Deprivation is considered to be a multi-dimensional problem, encompassing a range of domains such as financial, health, education, services or crime. continuous measure of relative deprivation therefore there is no definitive point on the scale below
which areas are considered to be deprived and above which they are not.While being in the most deprived 10% may indicate financial disadvantage, it could equally be due to isolated living.
Number of people aged 16 to State Pension age claiming: Jobseeker’s Allowance (JSA), Employment and Support Allowance (ESA), Incapacity Benefit (IB), Income Support (IS) (as a lone parent or in the “other” category),
Other income related benefits.
Social housing is housing that is let at low rents and on a secure basis to people in housing need. It is generally provided by councils and not-for-profit organisations such as housing associations. Vulnerable groups are often
concentrated in the social housing sector, with low rates of employment and low income levels
Children in single parent families have a much higher risk of living in poverty than children in couple families. Single parents may rely on informal childcare.
What are the particular issues that affect your parish? Are you doing anything to address these?
10% least deprived
Deprivation Indicator Diocesan Position National Position
A low-level of skill or educational attainment is one indicator of social disadvantage. Qualifications may make it easier to find employment. Learning also helps promote active citizenship and combat social exclusion.
8%
50% least deprived
50% most deprived
50% least deprived
50% most deprived
10% most deprived
50% most deprived
50% least deprived
Research
&
Statistics
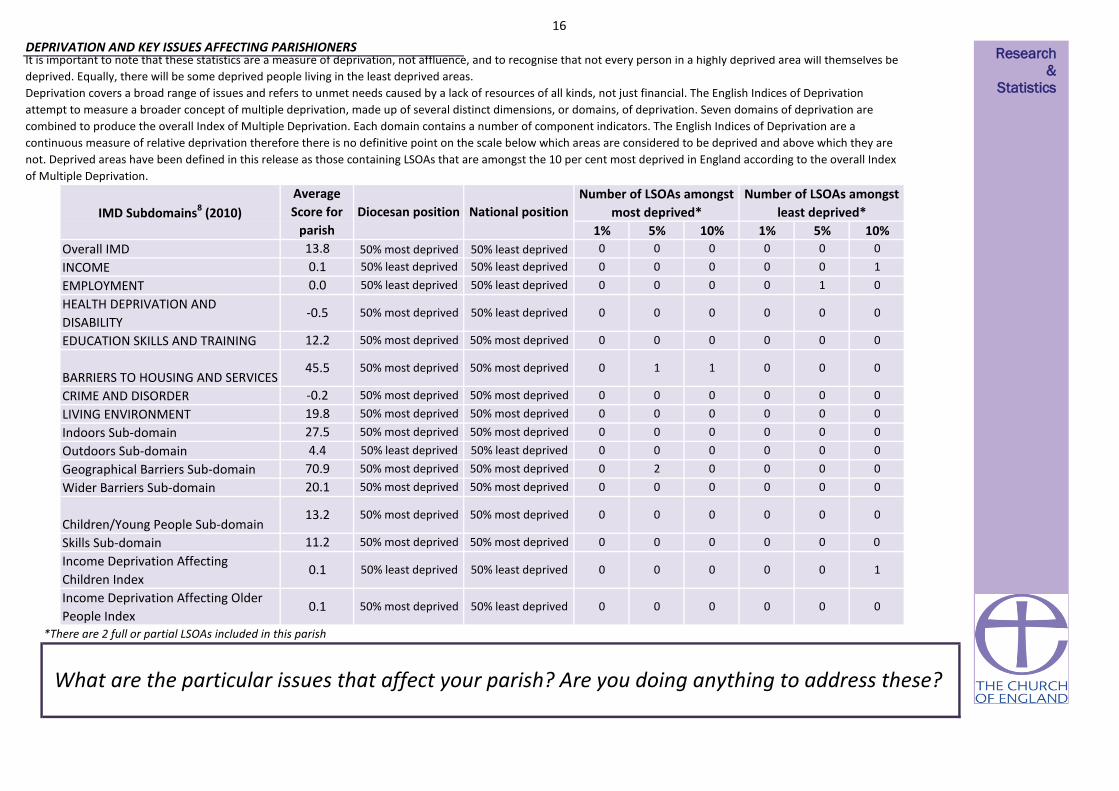
16
0
0.1 50% least deprived 0
0
2
50% most deprived
50% most deprived
50% most deprived
50% most deprived
50% most deprived
50% most deprived
0 0 0
50% most deprived
50% least deprived 50% least deprived
00 0
0
0
0
0
0
50% least deprived
50% most deprived
50% least deprived
50% most deprived
50% most deprived
50% most deprived
50% least deprived
50% least deprived
0 0 1
0Skills Sub-domain 11.2
0
0
0
0
00 0
0
0
0
0
0
0
0
0
0
0
0 0
0
0 0
0
0
0
0
0
0
0
0
1
0
0.1
0.0
5%
0 0
10050% least deprived
0
0
0
1
0
0
0
12.2
1
50% most deprived
50% most deprived
0
00
50% most deprived 0
0
50% least deprived 0
50% least deprived 0
Number of LSOAs amongst
least deprived*Diocesan position National position
HEALTH DEPRIVATION AND
DISABILITY-0.5
Average
Score for
parishIMD Subdomains8 (2010)
INCOME
EMPLOYMENT
Number of LSOAs amongst
most deprived*
1%
0
Income Deprivation Affecting
Children Index0.1
CRIME AND DISORDER
LIVING ENVIRONMENT
Indoors Sub-domain
Outdoors Sub-domain
0
0
Geographical Barriers Sub-domain
27.5
50% most deprived
EDUCATION SKILLS AND TRAINING
BARRIERS TO HOUSING AND SERVICES50% most deprived
Wider Barriers Sub-domain
Children/Young People Sub-domain13.2 0 0
0
0
50% most deprived 50% most deprived
0
0
0
0
0
-0.2
050% most deprived
4.4
70.9
20.1
19.8
45.5
50% most deprived 50% least deprived
10% 1%
DEPRIVATION AND KEY ISSUES AFFECTING PARISHIONERSIt is important to note that these statistics are a measure of deprivation, not affluence, and to recognise that not every person in a highly deprived area will themselves be
deprived. Equally, there will be some deprived people living in the least deprived areas.
Deprivation covers a broad range of issues and refers to unmet needs caused by a lack of resources of all kinds, not just financial. The English Indices of Deprivation
attempt to measure a broader concept of multiple deprivation, made up of several distinct dimensions, or domains, of deprivation. Seven domains of deprivation are
combined to produce the overall Index of Multiple Deprivation. Each domain contains a number of component indicators. The English Indices of Deprivation are a
continuous measure of relative deprivation therefore there is no definitive point on the scale below which areas are considered to be deprived and above which they are
not. Deprived areas have been defined in this release as those containing LSOAs that are amongst the 10 per cent most deprived in England according to the overall Index
of Multiple Deprivation.
Overall IMD 0 000
5% 10%
13.8 50% most deprived
00
00 0
*There are 2 full or partial LSOAs included in this parish
0 0
What are the particular issues that affect your parish? Are you doing anything to address these?
Income Deprivation Affecting Older
People Index
0
Research
&
Statistics

17
This spotlight has given you some information about your parish both in terms of your own church congregations and your local community. This is not an
end in itself, but rather a starting place for you to explore further. Questions to consider might include:
• What does our congregation look like?
• How does it compare to the local population?
• What other churches are there in the area? What parts of the community do they reach? Which parts of the community are being missed?
• What other local organisations or centres are there, that might bring people into our parish? Examples might be Hospitals or health centres, prisons, job
centres, homeless shelters, schools, charities, mother and toddler groups, uniformed organisations, community centres, libraries, shops, offices, stations?
How can we interact with these people?
• What areas of our parish do we know well or less well?
• How does the local community change between weekdays and weekends? How do our services and events fit with the shifting local population?
• Is our website/'A Church Near You' profile up to date?
• Are our records up to date?
****************************************************************************************************************************
What to do next?
Your notes
WHAT TO DO NEXT Research
&
Statistics

18
Sources of further information
Public Health Observatories - APHO JSNA Datasets (The datasets are intended to cover a
range of issues, focused on underlying determinants of health and conditions which account
for substantial numbers of preventable diseases and deaths.)
A Church Near You
www.achurchnearyou.com
UpMyStreet - UK house prices, property, crime, local neighbourhood & schools
London Street Gangs - Territory maps and background information
http://www.londonstreetgangs.com/
Hint: Scroll to the bottom of the "Gang Maps" page to see boundaries.
AboutMyArea - The local interactive site - news, reviews, what's on, events, businesses
Research & Statistics GIS
http://www.churchofengland.org/about-us/facts-stats/research-statistics/census-2011.aspx
Church Urban Fund
www.cuf.org.uk
Homeless Pages - Information, Research and Publications on homelessness
http://www.homelesspages.org.uk/
http://www.upmystreet.com/
Hint: Use the "My Neighbourhood" tab
The network of Public Health Observatories - Health Profiles
www.apho.org.uk/resource/view.aspx?RID=91736
The Poverty Site - Geographic Analysis
www.poverty.org.uk/summary/regional.shtml
http://www.apho.org.uk/default.aspx?QN=HP_FINDSEARCH2011
MurderMap - London Homicide Reported Direct from The Old Bailey
Police.uk - Local crime and policing information for England and Wales
http://www.police.uk/
ONS - Neighbourhood Statistics
http://www.aboutmyarea.co.uk/
http://neighbourhood.statistics.gov.uk/
Hint: Use the summary box
http://www.murdermap.co.uk/
Research
&
Statistics

19
Proportion of the population aged 60+ who are in receipt of the Guaranteed part of Pension Credit (August 2012)
Estimated using LSOA level data sourced from http://83.244.183.180/NESS/BEN/iben.htm
Proportion of the working age population who are in receipt of a key out-of-work benefit (Q3 2012)
Life Expectancy at birth (boys) (1999-2003)
Estimated using ward level data from ONS.
Life expectancy at birth (girls) (1999-2003)
Estimated using ward level data from ONS.
Percentage of Children under 16 in Poverty (2009)
Estimated using LSOA level data from http://www.hmrc.gov.uk/statistics/child-poverty-stats.htm
IMD (2010)
Methodology: Government data is published on government boundaries that do not match ecclesiastical boundaries. In order to produce parish population and demographic
estimates we have worked with the ONS to use a best fit modelling process. As such, these statistics can only be considered estimates and, particularly in very diverse areas, are
best used in the context of local knowledge. Where parish populations are sparse the figures for government areas overlapping the parish are used.
Parish estimates from the census have been calculated using the census output area data published by the ONS. These are provisional estimates, and when more granular data at
postcode level is available, will be revised. Estimates have been modelled by allocating the population weighted centroid of each output area to the parish within which it falls.
This means that some parishes have not been allocated population, however proportions for demographic variables have been calculated based on the output areas overlaying
the parish.
For further information about this process, please contact [email protected].
Contains public sector information licensed under the Open Government Licence v1.0 http://www.nationalarchives.gov.uk/doc/open-government-licence/
Estimated using OA level data sourced from ONS Census Data 2011, ONS
Estimated using OA level data sourced from ONS Census Data 2001, ONS
When analysing data, it is important to consider that some parishes are very small and proportions may be very large even where very few cases meet the criteria.
ABOUT THIS DATA
http://www.churchofengland.org/about-us/facts-stats/research-statistics/clergydiversityaudit2005linkpage.aspx
Estimated using OA level data from DWP Information, Governance and Security Directorate from
http://statistics.dwp.gov.uk/asd/asd1/tabtools/census_output_area_data/index.php?page=census_output_area_data
Annual parochial returns
ONS Census data 2011
ONS Census data 2001
2007 Church Diversity Survey
DWP
ONS
HMRC
Department for Communities and Local Government
1
2
3
4
5
6
7
8
These have been collected annually between 2007 and 2011 by the Research and Statistics team, Archbishops’ Council
When quoting figures derived from this data, care should be taken with the level of accuracy quoted.
Estimated using LSOA level data from Communities and Local Government, 2010.
https://www.gov.uk/government/uploads/system/uploads/attachment_data/file/6320/1870718.pdf
Research
&
Statistics

1
Getting to know your parish
What is this spotlight?
How should I use it?
Questions
Contents
This short spotlight brings together a range of information about your parish,
both in terms of your congregations, but also the wider community living in
your area. It covers areas such as Christian affiliation, population age and
ethnicity profiles, household structures, deprivation, employment, schools
and qualifications, alongside church statistics such as attendance and giving.
There is information at the end of the spotlight about where this data comes
from and how it was calculated. If you have any further queries then please
do contact the Research and Statistics team at
This spotlight is not an end in itself, but rather a starting place for you to
explore further. You may want to discuss it at a PCC meeting or with
leadership teams. We’ve included some questions on each page to help you
to think about the information, however some things will be of more
relevance in some areas than others, and these are just suggestions to get
you started. We’ve also included some bigger questions about what to do
next at the end of the spotlight on page 17. There’s space for you to write
some notes here. It might be helpful to write a short paragraph to
summarise your community profile or note down anything that has struck
you as particularly important. There are also details at the end for where
you can find further information should you want to dig a little deeper.
1. Summary: a brief overview of your parish, including what look to be 5 of
the most pressing social issues in your area
2. Age: age profile of your community
3. Ethnicity: ethnicity profile of your community
4. Integration: English language speaking and length of UK residency in your
community
5. Religious affiliation: religious affiliation in your community
6. Households: families, dependents, one person households, temporary
residents and housing tenure
7. Marital and civil partnership status
8. Employment: occupations, benefits and mobility in your community
9. Education: CofE schools and qualification levels in your community
10. Health: people with health problems and carers in your community
11. Deprivation: different types of deprivation in your community
Research
&
Statistics

2
Parishioners at glance
Bucknell: St Peter
2011 Tax Efficient Planned
Giving/person/week1
2011 Electoral
Roll1
Housing Costs
Environment
Female Life Expectancy
86%
69%
Issues to look out for in your parish
£6
Annual Parochial Returns
Oct
ob
er W
eekl
y
Att
end
ance
1
0-4
5-15
2011 Parish
Share Paid1
25
PARISH OVERVIEW
20%
Parish
7%
11%
62%
Age Profile (20112)200
Proportion Christian
Sorry, no Fresh Expressions listed for this parish.Fresh Expressions
300
BICESTER & ISLIP
OXFORD
16-64
Age
Gro
up
Diocese
627033
Deanery
Archdeaconry
20013
20112
20013
20112
Included Churches
Oxford
Population
Local Amenities
Parish of: Bucknell
Parish Code: 270033
65 +
£13,116
Male Life expectancy
Research
&
Statistics
0
50
100
150
200
2007 2008 2009 2010 2011
Highestweek
Average
LowestWeek

3
Parish 20112 Deanery 20112 Diocese 20112
Demographics: AGE PROFILE AND ATTENDANCE AT SERVICES
Does the age profile of your congregation match that of your parish? Are you engaging with the
parish's largest demographic: those aged 30 - 44?
30% 25% 20% 15% 10% 5% 0% 5% 10% 15% 20% 25%
0 - 4
5 - 7
8 - 9
10 - 14
15
16 - 17
18 - 19
20 - 24
25 - 29
30 - 44
45 - 59
60 - 64
65 - 74
75 - 84
85 - 89
90 & overAge profile of parish populations 20013 & 20112
Parish2011
Parish2001
0% 5% 10% 15% 20% 25%
0 - 14
15 - 29
30 - 44
45 - 59
60 - 74
75 - 89
90 & over
0% 10% 20% 30%
0 - 14
15 - 29
30 - 44
45 - 59
60 - 74
75 - 89
90 & over
0% 5% 10% 15% 20% 25%
0 - 14
15 - 29
30 - 44
45 - 59
60 - 74
75 - 89
90 & over
Research
&
Statistics

4
15%
Diocesan Congregation4 (2007)
Parish Population2 (2011)
(nearest 50)
Demographics: AGE PROFILE AND ATTENDANCE AT SERVICES
Comparable Age profile of Adults
25%
65 +
40%
Age
-
50
18 - 44
22% 38%
150
50
0 - 4
5 - 15
16 - 64
Diocesan Core Congregation Age Profile4 (2007)
Diocesan Population2 (2011) 37%
45 - 64
Does the age profile of your congregation match that of your parish?
65 +
Infant Baptisms
20111
2
Highest Weeks
Attendance 20111
6
31
9%
13%
16%
22%
40%
0% 10% 20% 30% 40% 50%
Research
&
Statistics

5
Detailed Parish Ethnicity2 2011
Parish Ethnicity2 2011 Parish Ethnicity3 2001 Diocese Ethnicity2 2011
Arab Other Ethnic Group
0%<1%
Indian Bangladeshi Chinese
African Caribbean
Parish
Percentage
ME: 3%
Other Asian
0%
Does the ethnicity profile of your congregation match that of your parish? Are you engaging with the parish's
largest demographics: those describing themselves as White or Asian/Asian British?
0%
3%
0%0% 0%
0%
<1%0%
Demographics: ETHNICITY
<1%
92%
Other White
3%
White & Asian Other Mixed
<1%
0%
0%
British
White & Black
Caribbean
Diocesan Population2 (2011)
Diocesan Core Congregation4 (aged 18+ only) (2007)
Percentage Minority Ethnic Background
15%
1%
Irish
Pakistani
2%
Other Black
Gypsy or Irish
Traveller
White & Black
African
Research
&
Statistics
White
Mixed/Multipleethnic group
Asian/Asian British
Black or BlackBritish
Other ethnicgroup

6
Cannot speak English well or cannot speak
English Can speak English well or very well
0% 1%Have English as their main language (English or
Welsh if in Wales)
99%2Percentage of people who
Demographics: Integration
10 years or more
93%
2 years or more but less
than 5 years
Born in the UK
Less than 2 years
0% 1% 3%
5 years or more but less
than 10 years
Are services in your parish accessible to all residents? Do you offer any services in foreign
languages? What can you offer those who may not have been in the UK for long?
2Resident in UK:
2%
Research
&
Statistics

7
In your parish 69% of the population (that is 200 people) declared themselves as Christian in 2011
80
Statistics from the Annual
Parochial Returns 2011
Easter Communicants1
Easter Day Attendance1
Christmas Communicants1
Christmas Attendance1
Christians in your Parish
RELIGIOUS AFFILIATION
24
34
41
How has the religious affiliation of those living in your parish changed over the past decade? How closely does
it match that of the Diocese as a whole? Are Christians in your parish engaging with your churches? How are
you engaging with other faith groups?
0% 10% 20% 30% 40% 50% 60% 70% 80% 90% 100%
Parish 2001
Parish 2011
Diocese 2011
Christian Buddhist Hindu Jewish Muslim Sikh Other religions No religion Religion not stated
2
3
National Average Percentage Christian2 (59.4%)
Research
&
Statistics
2
2

8
Household Spaces2 2011
With at least one usual resident i.e. not vacant 95%
1%Caravan or other mobile or temporary structure
50 <50 <50
Who lives in your parish? Are there issues with access to housing? How permenant are your
parishioners?
Tenure2
Social rented as a percentage of all households2 11%
Social Rented householdsOwner occupied households
(including shared ownership)
Private Rented households
(including those living rent free)
HOUSEHOLDS, LIFESTYLE AND THE COMMUNITY I Research
&
Statistics

9
Household composition in your parish2 All
percentages are of the total number of
households with residents. The smaller pie
charts show the breakdown of a section of
the larger ones. You can use the colours to
match.
Lone Parent
Households as a
percentage of all
households with
children2
15%
Who lives in your parish? Are there a lot of households with children? What about lone parent
households? Are there a lot of people living alone?
HOUSEHOLDS, LIFESTYLE AND THE COMMUNITY II
Aged 65 and over 10%
Other 10%
One Person 20%
One family 73%
Other households
7%
Dependent children 3%
All aged 65 and over
<1%
Other 3%
Aged 65 and over 12%
Married or same-sex civil partnership couple 40%
Cohabiting couple 10%
Lone parent 11%
No children 15%
Dependent children 20%
Non-dependent children 5%
No children 6%
Dependent children 4%
Dependent children 5% Non-
dependent children 7%
Research
&
Statistics
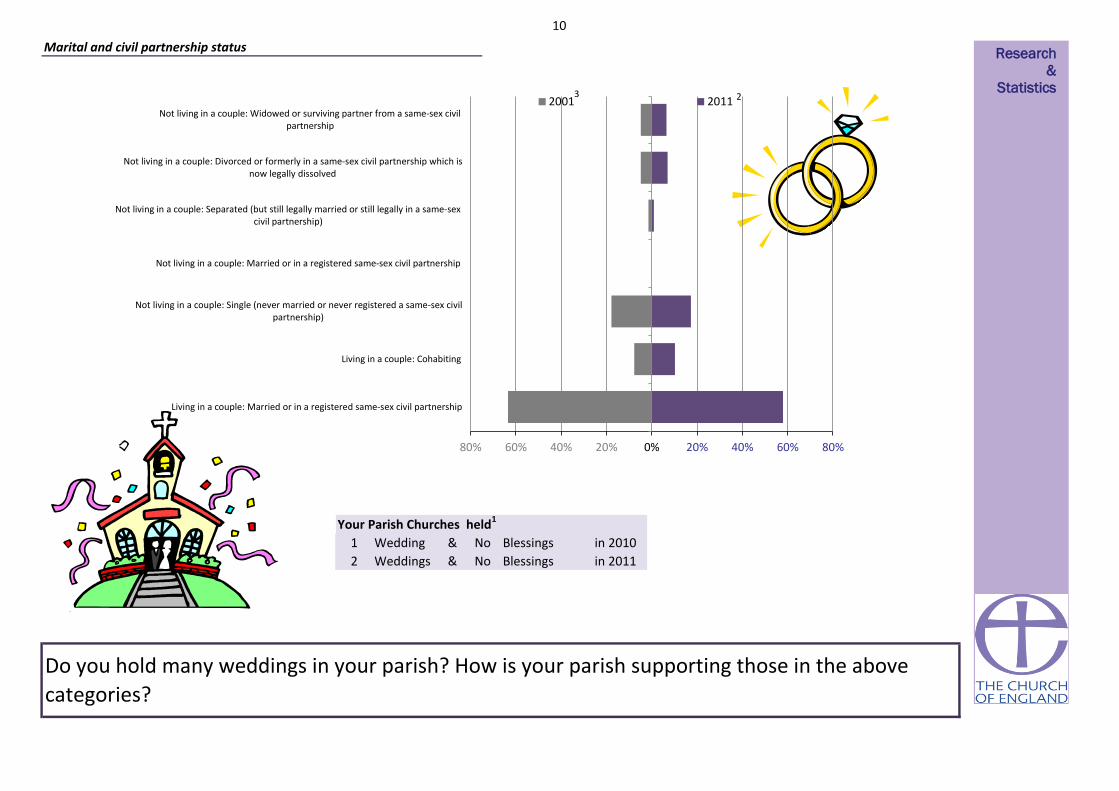
10
Wedding & Blessings in 2010
Weddings & Blessings in 20112 No
Your Parish Churches held1
Do you hold many weddings in your parish? How is your parish supporting those in the above
categories?
1 No
Marital and civil partnership status
80% 60% 40% 20% 0% 20% 40% 60% 80%
Living in a couple: Married or in a registered same-sex civil partnership
Living in a couple: Cohabiting
Not living in a couple: Single (never married or never registered a same-sex civilpartnership)
Not living in a couple: Married or in a registered same-sex civil partnership
Not living in a couple: Separated (but still legally married or still legally in a same-sexcivil partnership)
Not living in a couple: Divorced or formerly in a same-sex civil partnership which isnow legally dissolved
Not living in a couple: Widowed or surviving partner from a same-sex civilpartnership
2001 2011
Research
&
Statistics 2 3
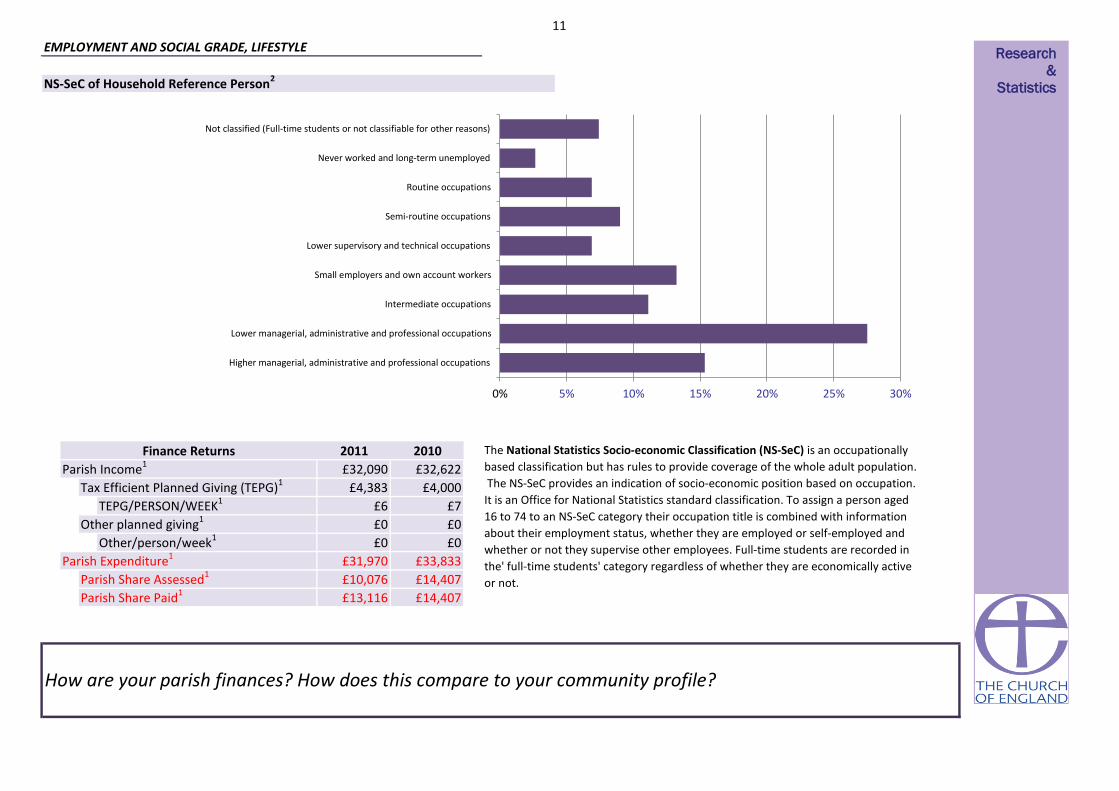
11
£7
£0
£0
£33,833
£14,407
£14,407
Parish Expenditure1
TEPG/PERSON/WEEK1
Other/person/week1Other planned giving1
How are your parish finances? How does this compare to your community profile?
£4,383
£32,090
EMPLOYMENT AND SOCIAL GRADE, LIFESTYLE
The National Statistics Socio-economic Classification (NS-SeC) is an occupationally
based classification but has rules to provide coverage of the whole adult population.
The NS-SeC provides an indication of socio-economic position based on occupation.
It is an Office for National Statistics standard classification. To assign a person aged
16 to 74 to an NS-SeC category their occupation title is combined with information
about their employment status, whether they are employed or self-employed and
whether or not they supervise other employees. Full-time students are recorded in
the' full-time students' category regardless of whether they are economically active
or not.Parish Share Assessed1
Parish Share Paid1
£0
£0
£31,970
£10,076
£13,116
£6
£4,000Tax Efficient Planned Giving (TEPG)1
Finance Returns 2010
NS-SeC of Household Reference Person2
£32,622Parish Income12011
Research
&
Statistics
0% 5% 10% 15% 20% 25% 30%
Higher managerial, administrative and professional occupations
Lower managerial, administrative and professional occupations
Intermediate occupations
Small employers and own account workers
Lower supervisory and technical occupations
Semi-routine occupations
Routine occupations
Never worked and long-term unemployed
Not classified (Full-time students or not classifiable for other reasons)

12
6%
94%
Households
2%
EMPLOYMENT AND SOCIAL GRADE, LIFESTYLE
How much free time do residents of your parish have? How accessible are your churches to those
with/without cars?
Access to at least 1 car or van
Household Mobility2
Proportion of population aged 60+ who are in
receipt of the Guaranteed part of Pension
Credit5
9%
Proportion of working age persons (16-74) with
no qualifications2 28%
Proportion of working age population who are
in receipt of a key out-of-work benefit5
No access to a car or van
Part-time: 15 hours or less
worked 9%
Part-time: 16 to 30 hours
worked 15%
Full-time: 31 to 48 hours worked
51%
Full-time: 49 or more hours
worked 25%
Hours Worked2
Part-time: 15 hours or less worked Part-time: 16 to 30 hours worked
Full-time: 31 to 48 hours worked Full-time: 49 or more hours worked
Research
&
Statistics
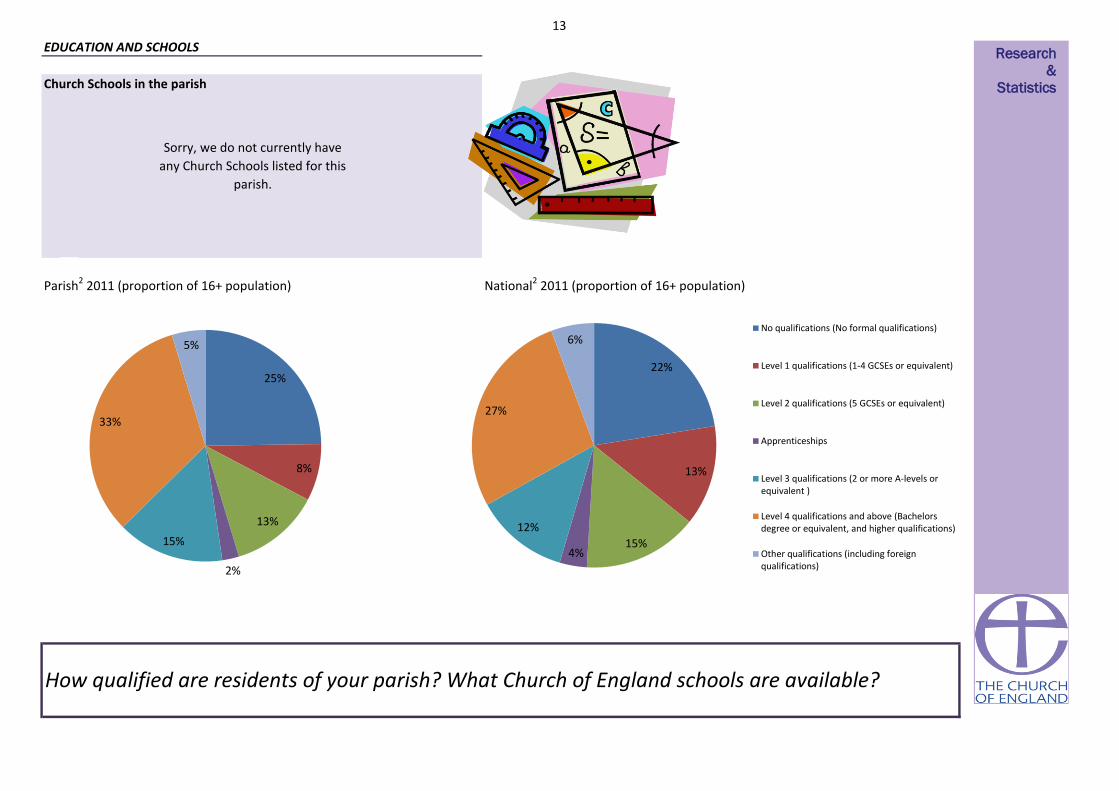
13
Church Schools in the parish
Parish2 2011 (proportion of 16+ population) National2 2011 (proportion of 16+ population)
EDUCATION AND SCHOOLS
How qualified are residents of your parish? What Church of England schools are available?
Sorry, we do not currently have
any Church Schools listed for this
parish.
25%
8%
13%
2%
15%
33%
5%
22%
13%
15% 4%
12%
27%
6% No qualifications (No formal qualifications)
Level 1 qualifications (1-4 GCSEs or equivalent)
Level 2 qualifications (5 GCSEs or equivalent)
Apprenticeships
Level 3 qualifications (2 or more A-levels orequivalent )
Level 4 qualifications and above (Bachelorsdegree or equivalent, and higher qualifications)
Other qualifications (including foreignqualifications)
Research
&
Statistics

14
Hours per week of provision of unpaid care2
2% 2%
Very bad health Bad health Fair health
1 - 19
Are there people in your parish with health problems? Is there anything you can do to assist with
day-to-day activities of those who have health problems?
HEALTH
0
Long-term health problem or disability2
50 +91% 5%
Good health Very good health
1%
Day-to-day activities limited a lot Day-to-day activities limited a little Day-to-day activities not limited
4% 10% 86%
1% 17% 28% 53%
General health2
20 - 49
Research
&
Statistics

15
You parish can be categorised as in the most or least deprived 10% or 50% of all parishes within the diocese and of all parishes nationally
10% most deprived 10% most deprived
Life expectancy at birth (girls)6 (1999-2003)
Life Expectancy at birth (boys)6 (1999-2003)
11%
11.7
50% most deprived9% 50% least deprived
50% least deprivedPercentage of Children under 16 in Poverty7 (2010)
Percentage of working age persons (16-74) with no
qualifications2 (2011)
10% most deprived
Life expectancy at birth can give an idea of overall quality of life. Life expectancy is an average. Women tend to have greater life expectancy. Life expectany can be affected by family history, marital status, economic status,
physique, exercise, diet, drug use including smoking and alcohol consumption, disposition, education, environment, sleep, climate, and health care.
Proportion of the population aged 60+ who are in receipt of
the Guaranteed part of Pension Credit5 (2012)
6%
Social rented as a percentage of all households2 (2011)
Index of Multiple Deprivation (IMD)8 (2010)
Proportion of the working age population who are in receipt
of a key out-of-work benefit5 (2012)
Lone Parent Households as a percentage of all households
with children2 (2011)
Pension Credit is an income related benefit made up of 2 parts - Guarantee Credit and Savings Credit. The guaranteed part tops up weekly income if it’s below £142.70 (single people) or £217.90 (couples) so those who
receive this are on a low income. This statistic only covers people living in private households, and not residential institutions (such as nursing homes).
50% most deprived
The proportion of children in families in receipr of either out of work benefits or tax credits where their reported income is less than 60% median income. Poor children may be excluded from participating in society. They may be unable to afford school
trips and activities; school uniforms or warm winter clothes, be unable to go swimming, have friends round for tea or celebrate their birthdays. Many will never have a holiday. Children who grow up poor are more likely to leave school without
qualifications, have lower employment chances, thus restricting their ability to get a good job and financially contribute to society.
50% least deprived
28% 10% most deprived
DEPRIVATION AND KEY ISSUES AFFECTING PARISHIONERS
Score
73
10% most deprived76
2%
Deprivation is considered to be a multi-dimensional problem, encompassing a range of domains such as financial, health, education, services or crime. continuous measure of relative deprivation therefore there is no definitive point on the scale below
which areas are considered to be deprived and above which they are not.While being in the most deprived 10% may indicate financial disadvantage, it could equally be due to isolated living.
Number of people aged 16 to State Pension age claiming: Jobseeker’s Allowance (JSA), Employment and Support Allowance (ESA), Incapacity Benefit (IB), Income Support (IS) (as a lone parent or in the “other” category),
Other income related benefits.
Social housing is housing that is let at low rents and on a secure basis to people in housing need. It is generally provided by councils and not-for-profit organisations such as housing associations. Vulnerable groups are often
concentrated in the social housing sector, with low rates of employment and low income levels
Children in single parent families have a much higher risk of living in poverty than children in couple families. Single parents may rely on informal childcare.
What are the particular issues that affect your parish? Are you doing anything to address these?
50% least deprived
Deprivation Indicator Diocesan Position National Position
A low-level of skill or educational attainment is one indicator of social disadvantage. Qualifications may make it easier to find employment. Learning also helps promote active citizenship and combat social exclusion.
15%
50% least deprived
50% most deprived
10% least deprived
50% most deprived
50% most deprived
50% least deprived
50% most deprived
Research
&
Statistics

16
0
0.1 50% least deprived 0
0
1
50% most deprived
50% least deprived
50% most deprived
50% least deprived
50% least deprived
50% most deprived
0 0 0
50% most deprived
50% most deprived 50% least deprived
00 0
0
0
0
0
0
50% most deprived
50% most deprived
50% most deprived
50% most deprived
50% most deprived
50% most deprived
50% least deprived
50% least deprived
0 0 0
0Skills Sub-domain 8.0
0
0
0
0
00 0
0
0
0
0
0
0
0
0
0
0
0 0
0
0 0
0
0
0
0
0
0
0
0
0
0
0.1
0.0
5%
0 0
00050% most deprived
0
0
0
1
0
0
0
7.2
0
50% most deprived
50% most deprived
0
00
50% least deprived 0
0
50% most deprived 0
50% least deprived 0
Number of LSOAs amongst
least deprived*Diocesan position National position
HEALTH DEPRIVATION AND
DISABILITY-0.8
Average
Score for
parishIMD Subdomains8 (2010)
INCOME
EMPLOYMENT
Number of LSOAs amongst
most deprived*
1%
0
Income Deprivation Affecting
Children Index0.1
CRIME AND DISORDER
LIVING ENVIRONMENT
Indoors Sub-domain
Outdoors Sub-domain
0
0
Geographical Barriers Sub-domain
24.0
50% most deprived
EDUCATION SKILLS AND TRAINING
BARRIERS TO HOUSING AND SERVICES50% most deprived
Wider Barriers Sub-domain
Children/Young People Sub-domain6.5 0 0
0
0
50% least deprived 50% least deprived
0
0
0
0
0
-0.4
050% most deprived
12.6
76.2
6.9
20.2
41.5
50% most deprived 50% least deprived
10% 1%
DEPRIVATION AND KEY ISSUES AFFECTING PARISHIONERSIt is important to note that these statistics are a measure of deprivation, not affluence, and to recognise that not every person in a highly deprived area will themselves be
deprived. Equally, there will be some deprived people living in the least deprived areas.
Deprivation covers a broad range of issues and refers to unmet needs caused by a lack of resources of all kinds, not just financial. The English Indices of Deprivation
attempt to measure a broader concept of multiple deprivation, made up of several distinct dimensions, or domains, of deprivation. Seven domains of deprivation are
combined to produce the overall Index of Multiple Deprivation. Each domain contains a number of component indicators. The English Indices of Deprivation are a
continuous measure of relative deprivation therefore there is no definitive point on the scale below which areas are considered to be deprived and above which they are
not. Deprived areas have been defined in this release as those containing LSOAs that are amongst the 10 per cent most deprived in England according to the overall Index
of Multiple Deprivation.
Overall IMD 0 000
5% 10%
11.7 50% most deprived
00
00 0
*There is 1 full or partial LSOA included in this parish
0 0
What are the particular issues that affect your parish? Are you doing anything to address these?
Income Deprivation Affecting Older
People Index
0
Research
&
Statistics

17
This spotlight has given you some information about your parish both in terms of your own church congregations and your local community. This is not an
end in itself, but rather a starting place for you to explore further. Questions to consider might include:
• What does our congregation look like?
• How does it compare to the local population?
• What other churches are there in the area? What parts of the community do they reach? Which parts of the community are being missed?
• What other local organisations or centres are there, that might bring people into our parish? Examples might be Hospitals or health centres, prisons, job
centres, homeless shelters, schools, charities, mother and toddler groups, uniformed organisations, community centres, libraries, shops, offices, stations?
How can we interact with these people?
• What areas of our parish do we know well or less well?
• How does the local community change between weekdays and weekends? How do our services and events fit with the shifting local population?
• Is our website/'A Church Near You' profile up to date?
• Are our records up to date?
****************************************************************************************************************************
What to do next?
Your notes
WHAT TO DO NEXT Research
&
Statistics

18
Sources of further information
Public Health Observatories - APHO JSNA Datasets (The datasets are intended to cover a
range of issues, focused on underlying determinants of health and conditions which account
for substantial numbers of preventable diseases and deaths.)
A Church Near You
www.achurchnearyou.com
UpMyStreet - UK house prices, property, crime, local neighbourhood & schools
London Street Gangs - Territory maps and background information
http://www.londonstreetgangs.com/
Hint: Scroll to the bottom of the "Gang Maps" page to see boundaries.
AboutMyArea - The local interactive site - news, reviews, what's on, events, businesses
Research & Statistics GIS
http://www.churchofengland.org/about-us/facts-stats/research-statistics/census-2011.aspx
Church Urban Fund
www.cuf.org.uk
Homeless Pages - Information, Research and Publications on homelessness
http://www.homelesspages.org.uk/
http://www.upmystreet.com/
Hint: Use the "My Neighbourhood" tab
The network of Public Health Observatories - Health Profiles
www.apho.org.uk/resource/view.aspx?RID=91736
The Poverty Site - Geographic Analysis
www.poverty.org.uk/summary/regional.shtml
http://www.apho.org.uk/default.aspx?QN=HP_FINDSEARCH2011
MurderMap - London Homicide Reported Direct from The Old Bailey
Police.uk - Local crime and policing information for England and Wales
http://www.police.uk/
ONS - Neighbourhood Statistics
http://www.aboutmyarea.co.uk/
http://neighbourhood.statistics.gov.uk/
Hint: Use the summary box
http://www.murdermap.co.uk/
Research
&
Statistics

19
Proportion of the population aged 60+ who are in receipt of the Guaranteed part of Pension Credit (August 2012)
Estimated using LSOA level data sourced from http://83.244.183.180/NESS/BEN/iben.htm
Proportion of the working age population who are in receipt of a key out-of-work benefit (Q3 2012)
Life Expectancy at birth (boys) (1999-2003)
Estimated using ward level data from ONS.
Life expectancy at birth (girls) (1999-2003)
Estimated using ward level data from ONS.
Percentage of Children under 16 in Poverty (2009)
Estimated using LSOA level data from http://www.hmrc.gov.uk/statistics/child-poverty-stats.htm
IMD (2010)
Methodology: Government data is published on government boundaries that do not match ecclesiastical boundaries. In order to produce parish population and demographic
estimates we have worked with the ONS to use a best fit modelling process. As such, these statistics can only be considered estimates and, particularly in very diverse areas, are
best used in the context of local knowledge. Where parish populations are sparse the figures for government areas overlapping the parish are used.
Parish estimates from the census have been calculated using the census output area data published by the ONS. These are provisional estimates, and when more granular data at
postcode level is available, will be revised. Estimates have been modelled by allocating the population weighted centroid of each output area to the parish within which it falls.
This means that some parishes have not been allocated population, however proportions for demographic variables have been calculated based on the output areas overlaying
the parish.
For further information about this process, please contact [email protected].
Contains public sector information licensed under the Open Government Licence v1.0 http://www.nationalarchives.gov.uk/doc/open-government-licence/
Estimated using OA level data sourced from ONS Census Data 2011, ONS
Estimated using OA level data sourced from ONS Census Data 2001, ONS
When analysing data, it is important to consider that some parishes are very small and proportions may be very large even where very few cases meet the criteria.
ABOUT THIS DATA
http://www.churchofengland.org/about-us/facts-stats/research-statistics/clergydiversityaudit2005linkpage.aspx
Estimated using OA level data from DWP Information, Governance and Security Directorate from
http://statistics.dwp.gov.uk/asd/asd1/tabtools/census_output_area_data/index.php?page=census_output_area_data
Annual parochial returns
ONS Census data 2011
ONS Census data 2001
2007 Church Diversity Survey
DWP
ONS
HMRC
Department for Communities and Local Government
1
2
3
4
5
6
7
8
These have been collected annually between 2007 and 2011 by the Research and Statistics team, Archbishops’ Council
When quoting figures derived from this data, care should be taken with the level of accuracy quoted.
Estimated using LSOA level data from Communities and Local Government, 2010.
https://www.gov.uk/government/uploads/system/uploads/attachment_data/file/6320/1870718.pdf
Research
&
Statistics

1
Getting to know your parish
What is this spotlight?
How should I use it?
Questions
Contents
This short spotlight brings together a range of information about your parish,
both in terms of your congregations, but also the wider community living in
your area. It covers areas such as Christian affiliation, population age and
ethnicity profiles, household structures, deprivation, employment, schools
and qualifications, alongside church statistics such as attendance and giving.
There is information at the end of the spotlight about where this data comes
from and how it was calculated. If you have any further queries then please
do contact the Research and Statistics team at
This spotlight is not an end in itself, but rather a starting place for you to
explore further. You may want to discuss it at a PCC meeting or with
leadership teams. We’ve included some questions on each page to help you
to think about the information, however some things will be of more
relevance in some areas than others, and these are just suggestions to get
you started. We’ve also included some bigger questions about what to do
next at the end of the spotlight on page 17. There’s space for you to write
some notes here. It might be helpful to write a short paragraph to
summarise your community profile or note down anything that has struck
you as particularly important. There are also details at the end for where
you can find further information should you want to dig a little deeper.
1. Summary: a brief overview of your parish, including what look to be 5 of
the most pressing social issues in your area
2. Age: age profile of your community
3. Ethnicity: ethnicity profile of your community
4. Integration: English language speaking and length of UK residency in your
community
5. Religious affiliation: religious affiliation in your community
6. Households: families, dependents, one person households, temporary
residents and housing tenure
7. Marital and civil partnership status
8. Employment: occupations, benefits and mobility in your community
9. Education: CofE schools and qualification levels in your community
10. Health: people with health problems and carers in your community
11. Deprivation: different types of deprivation in your community
Research
&
Statistics
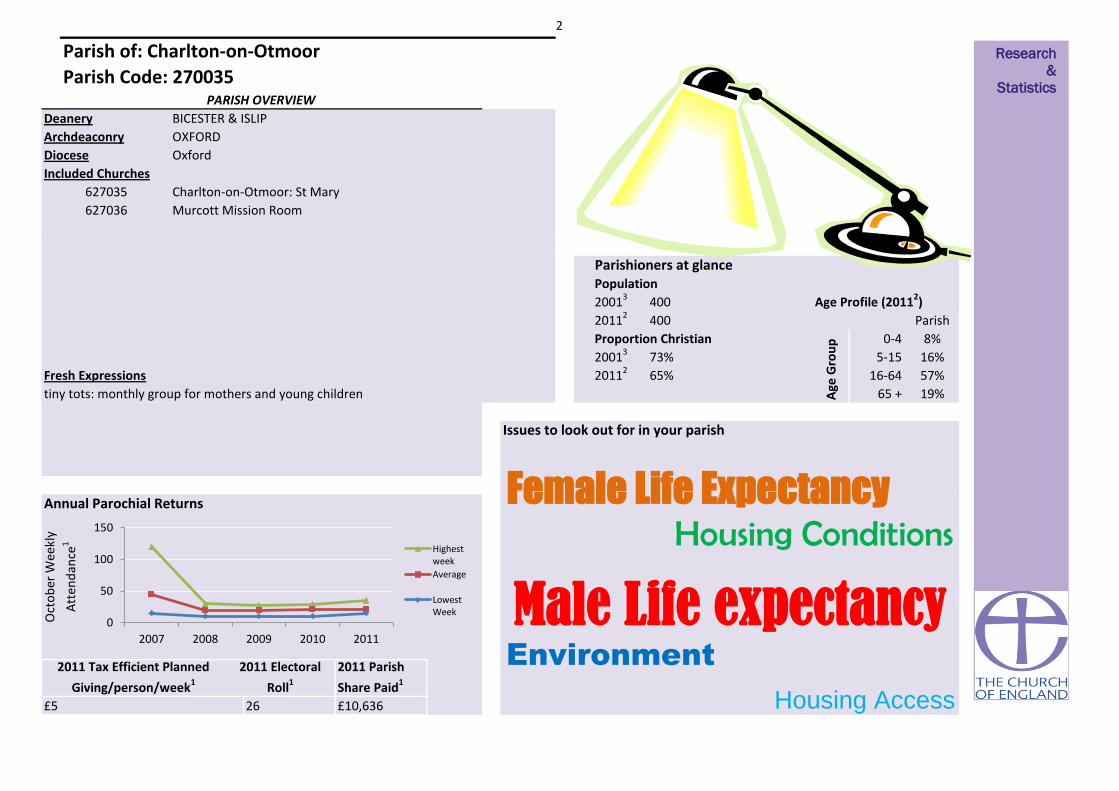
2
Parishioners at glance
tiny tots: monthly group for mothers and young children
Charlton-on-Otmoor: St Mary
Murcott Mission Room
2011 Tax Efficient Planned
Giving/person/week1
2011 Electoral
Roll1
Housing Access
Environment
Male Life expectancy
73%
65%
Issues to look out for in your parish
£5
Annual Parochial Returns
Oct
ob
er W
eekl
y
Att
end
ance
1
0-4
5-15
2011 Parish
Share Paid1
26
PARISH OVERVIEW
19%
Parish
8%
16%
57%
Age Profile (20112)400
Proportion Christian
Fresh Expressions
400
BICESTER & ISLIP
OXFORD
16-64
Age
Gro
up
Diocese
627035
Deanery
Archdeaconry
20013
20112
20013
20112
Included Churches
Oxford
Population
Housing Conditions
Parish of: Charlton-on-Otmoor
Parish Code: 270035
65 +
£10,636
Female Life Expectancy
627036
Research
&
Statistics
0
50
100
150
2007 2008 2009 2010 2011
Highestweek
Average
LowestWeek

3
Parish 20112 Deanery 20112 Diocese 20112
Demographics: AGE PROFILE AND ATTENDANCE AT SERVICES
Does the age profile of your congregation match that of your parish? Are you engaging with the
parish's largest demographic: those aged 0 - 14?
30% 20% 10% 0% 10% 20% 30%
0 - 4
5 - 7
8 - 9
10 - 14
15
16 - 17
18 - 19
20 - 24
25 - 29
30 - 44
45 - 59
60 - 64
65 - 74
75 - 84
85 - 89
90 & overAge profile of parish populations 20013 & 20112
Parish2011
Parish2001
0% 5% 10% 15% 20% 25%
0 - 14
15 - 29
30 - 44
45 - 59
60 - 74
75 - 89
90 & over
0% 10% 20% 30%
0 - 14
15 - 29
30 - 44
45 - 59
60 - 74
75 - 89
90 & over
0% 5% 10% 15% 20% 25%
0 - 14
15 - 29
30 - 44
45 - 59
60 - 74
75 - 89
90 & over
Research
&
Statistics

4
15%
Diocesan Congregation4 (2007)
Parish Population2 (2011)
(nearest 50)
Demographics: AGE PROFILE AND ATTENDANCE AT SERVICES
Comparable Age profile of Adults
25%
65 +
40%
Age
50
50
18 - 44
22% 38%
250
100
0 - 4
5 - 15
16 - 64
Diocesan Core Congregation Age Profile4 (2007)
Diocesan Population2 (2011) 37%
45 - 64
Does the age profile of your congregation match that of your parish?
65 +
Infant Baptisms
20111
4
Highest Weeks
Attendance 20111
8
27
9%
13%
16%
22%
40%
0% 10% 20% 30% 40% 50%
Research
&
Statistics

5
Detailed Parish Ethnicity2 2011
Parish Ethnicity2 2011 Parish Ethnicity3 2001 Diocese Ethnicity2 2011
Arab Other Ethnic Group
0%<1%
Indian Bangladeshi Chinese
African Caribbean
Parish
Percentage
ME: 2%
Other Asian
<1%
Does the ethnicity profile of your congregation match that of your parish? Are you engaging with the parish's
largest demographics: those describing themselves as White or Mixed/Multiple ethnic group?
<1%
3%
0%0% <1%
0%
0%0%
Demographics: ETHNICITY
<1%
95%
Other White
3%
White & Asian Other Mixed
<1%
0%
0%
British
White & Black
Caribbean
Diocesan Population2 (2011)
Diocesan Core Congregation4 (aged 18+ only) (2007)
Percentage Minority Ethnic Background
15%
<1%
Irish
Pakistani
0%
Other Black
Gypsy or Irish
Traveller
White & Black
African
Research
&
Statistics
White
Mixed/Multipleethnic group
Asian/Asian British
Black or BlackBritish
Other ethnicgroup

6
Cannot speak English well or cannot speak
English Can speak English well or very well
0% 2%Have English as their main language (English or
Welsh if in Wales)
98%2Percentage of people who
Demographics: Integration
10 years or more
93%
2 years or more but less
than 5 years
Born in the UK
Less than 2 years
0% 1% 4%
5 years or more but less
than 10 years
Are services in your parish accessible to all residents? Do you offer any services in foreign
languages? What can you offer those who may not have been in the UK for long?
2Resident in UK:
2%
Research
&
Statistics

7
In your parish 65% of the population (that is 350 people) declared themselves as Christian in 2011
135
Statistics from the Annual
Parochial Returns 2011
Easter Communicants1
Easter Day Attendance1
Christmas Communicants1
Christmas Attendance1
Christians in your Parish
RELIGIOUS AFFILIATION
16
20
30
How has the religious affiliation of those living in your parish changed over the past decade? How closely does
it match that of the Diocese as a whole? Are Christians in your parish engaging with your churches? How are
you engaging with other faith groups?
0% 10% 20% 30% 40% 50% 60% 70% 80% 90% 100%
Parish 2001
Parish 2011
Diocese 2011
Christian Buddhist Hindu Jewish Muslim Sikh Other religions No religion Religion not stated
2
3
National Average Percentage Christian2 (59.4%)
Research
&
Statistics
2
2

8
Household Spaces2 2011
With at least one usual resident i.e. not vacant 98%
0%Caravan or other mobile or temporary structure
150 <50 <50
Who lives in your parish? Are there issues with access to housing? How permenant are your
parishioners?
Tenure2
Social rented as a percentage of all households2 2%
Social Rented householdsOwner occupied households
(including shared ownership)
Private Rented households
(including those living rent free)
HOUSEHOLDS, LIFESTYLE AND THE COMMUNITY I Research
&
Statistics

9
Household composition in your parish2 All
percentages are of the total number of
households with residents. The smaller pie
charts show the breakdown of a section of
the larger ones. You can use the colours to
match.
Lone Parent
Households as a
percentage of all
households with
children2
5%
Who lives in your parish? Are there a lot of households with children? What about lone parent
households? Are there a lot of people living alone?
HOUSEHOLDS, LIFESTYLE AND THE COMMUNITY II
Aged 65 and over 10%
Other 10%
One Person 19%
One family 74%
Other households
6%
Dependent children 5%
All aged 65 and over
<1%
Other 1%
Aged 65 and over 15%
Married or same-sex civil partnership couple 46%
Cohabiting couple 9%
Lone parent 4%
No children 19%
Dependent children 23%
Non-dependent children 4%
No children 6%
Dependent children 2%
Non-dependent children 1%
Dependent children 2% Non-
dependent children 2%
Research
&
Statistics

10
Wedding & Blessings in 2010
Wedding & Blessings in 20111 No
Your Parish Churches held1
Do you hold many weddings in your parish? How is your parish supporting those in the above
categories?
1 No
Marital and civil partnership status
80% 60% 40% 20% 0% 20% 40% 60% 80%
Living in a couple: Married or in a registered same-sex civil partnership
Living in a couple: Cohabiting
Not living in a couple: Single (never married or never registered a same-sex civilpartnership)
Not living in a couple: Married or in a registered same-sex civil partnership
Not living in a couple: Separated (but still legally married or still legally in a same-sexcivil partnership)
Not living in a couple: Divorced or formerly in a same-sex civil partnership which isnow legally dissolved
Not living in a couple: Widowed or surviving partner from a same-sex civilpartnership
2001 2011
Research
&
Statistics 2 3
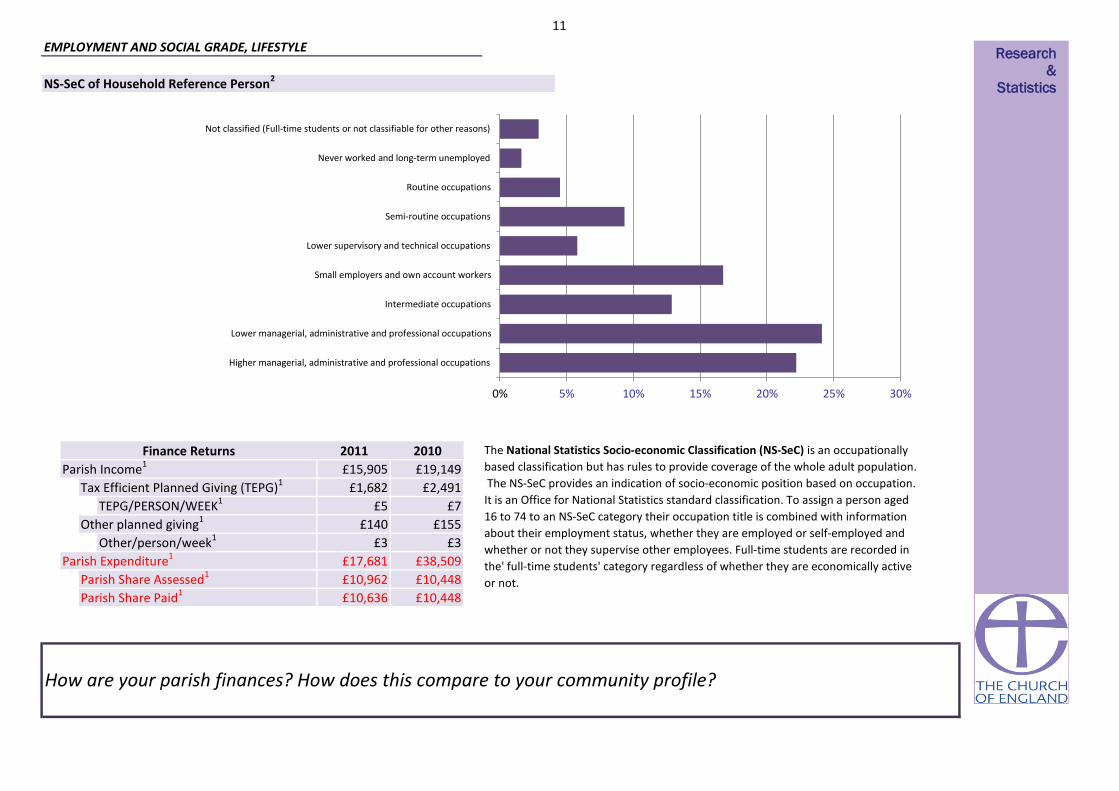
11
£7
£155
£3
£38,509
£10,448
£10,448
Parish Expenditure1
TEPG/PERSON/WEEK1
Other/person/week1Other planned giving1
How are your parish finances? How does this compare to your community profile?
£1,682
£15,905
EMPLOYMENT AND SOCIAL GRADE, LIFESTYLE
The National Statistics Socio-economic Classification (NS-SeC) is an occupationally
based classification but has rules to provide coverage of the whole adult population.
The NS-SeC provides an indication of socio-economic position based on occupation.
It is an Office for National Statistics standard classification. To assign a person aged
16 to 74 to an NS-SeC category their occupation title is combined with information
about their employment status, whether they are employed or self-employed and
whether or not they supervise other employees. Full-time students are recorded in
the' full-time students' category regardless of whether they are economically active
or not.Parish Share Assessed1
Parish Share Paid1
£140
£3
£17,681
£10,962
£10,636
£5
£2,491Tax Efficient Planned Giving (TEPG)1
Finance Returns 2010
NS-SeC of Household Reference Person2
£19,149Parish Income12011
Research
&
Statistics
0% 5% 10% 15% 20% 25% 30%
Higher managerial, administrative and professional occupations
Lower managerial, administrative and professional occupations
Intermediate occupations
Small employers and own account workers
Lower supervisory and technical occupations
Semi-routine occupations
Routine occupations
Never worked and long-term unemployed
Not classified (Full-time students or not classifiable for other reasons)

12
7%
93%
Households
3%
EMPLOYMENT AND SOCIAL GRADE, LIFESTYLE
How much free time do residents of your parish have? How accessible are your churches to those
with/without cars?
Access to at least 1 car or van
Household Mobility2
Proportion of population aged 60+ who are in
receipt of the Guaranteed part of Pension
Credit5
8%
Proportion of working age persons (16-74) with
no qualifications2 21%
Proportion of working age population who are
in receipt of a key out-of-work benefit5
No access to a car or van
Part-time: 15 hours or less
worked 6%
Part-time: 16 to 30 hours worked
21%
Full-time: 31 to 48 hours worked
53%
Full-time: 49 or more hours
worked 19%
Hours Worked2
Part-time: 15 hours or less worked Part-time: 16 to 30 hours worked
Full-time: 31 to 48 hours worked Full-time: 49 or more hours worked
Research
&
Statistics

13
Church Schools in the parish
CHARLTON-ON-OTMOOR PAROCHIAL PRIMARY SCHOOL
Parish2 2011 (proportion of 16+ population) National2 2011 (proportion of 16+ population)
EDUCATION AND SCHOOLS
How qualified are residents of your parish? What Church of England schools are available?
19%
9%
13%
6% 8%
42%
3%
22%
13%
15% 4%
12%
27%
6% No qualifications (No formal qualifications)
Level 1 qualifications (1-4 GCSEs or equivalent)
Level 2 qualifications (5 GCSEs or equivalent)
Apprenticeships
Level 3 qualifications (2 or more A-levels orequivalent )
Level 4 qualifications and above (Bachelorsdegree or equivalent, and higher qualifications)
Other qualifications (including foreignqualifications)
Research
&
Statistics

14
Hours per week of provision of unpaid care2
<1% 2%
Very bad health Bad health Fair health
1 - 19
Are there people in your parish with health problems? Is there anything you can do to assist with
day-to-day activities of those who have health problems?
HEALTH
0
Long-term health problem or disability2
50 +91% 7%
Good health Very good health
0%
Day-to-day activities limited a lot Day-to-day activities limited a little Day-to-day activities not limited
4% 6% 90%
2% 9% 31% 58%
General health2
20 - 49
Research
&
Statistics

15
You parish can be categorised as in the most or least deprived 10% or 50% of all parishes within the diocese and of all parishes nationally
10% most deprived 10% most deprived
Life expectancy at birth (girls)6 (1999-2003)
Life Expectancy at birth (boys)6 (1999-2003)
2%
5.0
50% least deprived8% 50% least deprived
10% least deprivedPercentage of Children under 16 in Poverty7 (2010)
Percentage of working age persons (16-74) with no
qualifications2 (2011)
10% most deprived
Life expectancy at birth can give an idea of overall quality of life. Life expectancy is an average. Women tend to have greater life expectancy. Life expectany can be affected by family history, marital status, economic status,
physique, exercise, diet, drug use including smoking and alcohol consumption, disposition, education, environment, sleep, climate, and health care.
Proportion of the population aged 60+ who are in receipt of
the Guaranteed part of Pension Credit5 (2012)
2%
Social rented as a percentage of all households2 (2011)
Index of Multiple Deprivation (IMD)8 (2010)
Proportion of the working age population who are in receipt
of a key out-of-work benefit5 (2012)
Lone Parent Households as a percentage of all households
with children2 (2011)
Pension Credit is an income related benefit made up of 2 parts - Guarantee Credit and Savings Credit. The guaranteed part tops up weekly income if it’s below £142.70 (single people) or £217.90 (couples) so those who
receive this are on a low income. This statistic only covers people living in private households, and not residential institutions (such as nursing homes).
50% least deprived
The proportion of children in families in receipr of either out of work benefits or tax credits where their reported income is less than 60% median income. Poor children may be excluded from participating in society. They may be unable to afford school
trips and activities; school uniforms or warm winter clothes, be unable to go swimming, have friends round for tea or celebrate their birthdays. Many will never have a holiday. Children who grow up poor are more likely to leave school without
qualifications, have lower employment chances, thus restricting their ability to get a good job and financially contribute to society.
10% least deprived
21% 50% most deprived
DEPRIVATION AND KEY ISSUES AFFECTING PARISHIONERS
Score
72
50% most deprived79
3%
Deprivation is considered to be a multi-dimensional problem, encompassing a range of domains such as financial, health, education, services or crime. continuous measure of relative deprivation therefore there is no definitive point on the scale below
which areas are considered to be deprived and above which they are not.While being in the most deprived 10% may indicate financial disadvantage, it could equally be due to isolated living.
Number of people aged 16 to State Pension age claiming: Jobseeker’s Allowance (JSA), Employment and Support Allowance (ESA), Incapacity Benefit (IB), Income Support (IS) (as a lone parent or in the “other” category),
Other income related benefits.
Social housing is housing that is let at low rents and on a secure basis to people in housing need. It is generally provided by councils and not-for-profit organisations such as housing associations. Vulnerable groups are often
concentrated in the social housing sector, with low rates of employment and low income levels
Children in single parent families have a much higher risk of living in poverty than children in couple families. Single parents may rely on informal childcare.
What are the particular issues that affect your parish? Are you doing anything to address these?
10% least deprived
Deprivation Indicator Diocesan Position National Position
A low-level of skill or educational attainment is one indicator of social disadvantage. Qualifications may make it easier to find employment. Learning also helps promote active citizenship and combat social exclusion.
5%
10% least deprived
10% least deprived
50% least deprived
10% least deprived
10% least deprived
50% least deprived
10% least deprived
Research
&
Statistics

16
0
0.1 50% least deprived 0
0
0
10% least deprived
50% least deprived
50% least deprived
10% least deprived
50% most deprived
50% least deprived
0 0 0
50% least deprived
10% least deprived 10% least deprived
00 0
0
0
0
0
0
50% most deprived
10% most deprived
50% most deprived
50% most deprived
50% most deprived
50% least deprived
10% least deprived
10% least deprived
0 1 0
0Skills Sub-domain 1.9
0
0
0
0
10 0
0
0
0
0
0
0
0
0
0
0
0 0
0
0 0
0
0
0
1
0
0
0
0
1
0
0.0
0.0
5%
0 0
01050% least deprived
0
0
0
0
0
0
0
6.0
0
10% least deprived
50% most deprived
0
00
50% least deprived 0
0
10% least deprived 0
10% least deprived 0
Number of LSOAs amongst
least deprived*Diocesan position National position
HEALTH DEPRIVATION AND
DISABILITY-0.8
Average
Score for
parishIMD Subdomains8 (2010)
INCOME
EMPLOYMENT
Number of LSOAs amongst
most deprived*
1%
0
Income Deprivation Affecting
Children Index0.0
CRIME AND DISORDER
LIVING ENVIRONMENT
Indoors Sub-domain
Outdoors Sub-domain
0
0
Geographical Barriers Sub-domain
32.9
50% least deprived
EDUCATION SKILLS AND TRAINING
BARRIERS TO HOUSING AND SERVICES10% least deprived
Wider Barriers Sub-domain
Children/Young People Sub-domain10.1 0 0
0
0
50% most deprived 50% least deprived
0
0
0
0
0
-1.3
010% most deprived
12.6
20.9
10.2
26.1
15.5
50% most deprived 50% least deprived
10% 1%
DEPRIVATION AND KEY ISSUES AFFECTING PARISHIONERSIt is important to note that these statistics are a measure of deprivation, not affluence, and to recognise that not every person in a highly deprived area will themselves be
deprived. Equally, there will be some deprived people living in the least deprived areas.
Deprivation covers a broad range of issues and refers to unmet needs caused by a lack of resources of all kinds, not just financial. The English Indices of Deprivation
attempt to measure a broader concept of multiple deprivation, made up of several distinct dimensions, or domains, of deprivation. Seven domains of deprivation are
combined to produce the overall Index of Multiple Deprivation. Each domain contains a number of component indicators. The English Indices of Deprivation are a
continuous measure of relative deprivation therefore there is no definitive point on the scale below which areas are considered to be deprived and above which they are
not. Deprived areas have been defined in this release as those containing LSOAs that are amongst the 10 per cent most deprived in England according to the overall Index
of Multiple Deprivation.
Overall IMD 0 100
5% 10%
5.0 10% least deprived
00
00 0
*There is 1 full or partial LSOA included in this parish
0 0
What are the particular issues that affect your parish? Are you doing anything to address these?
Income Deprivation Affecting Older
People Index
0
Research
&
Statistics

17
This spotlight has given you some information about your parish both in terms of your own church congregations and your local community. This is not an
end in itself, but rather a starting place for you to explore further. Questions to consider might include:
• What does our congregation look like?
• How does it compare to the local population?
• What other churches are there in the area? What parts of the community do they reach? Which parts of the community are being missed?
• What other local organisations or centres are there, that might bring people into our parish? Examples might be Hospitals or health centres, prisons, job
centres, homeless shelters, schools, charities, mother and toddler groups, uniformed organisations, community centres, libraries, shops, offices, stations?
How can we interact with these people?
• What areas of our parish do we know well or less well?
• How does the local community change between weekdays and weekends? How do our services and events fit with the shifting local population?
• Is our website/'A Church Near You' profile up to date?
• Are our records up to date?
****************************************************************************************************************************
What to do next?
Your notes
WHAT TO DO NEXT Research
&
Statistics

18
Sources of further information
Public Health Observatories - APHO JSNA Datasets (The datasets are intended to cover a
range of issues, focused on underlying determinants of health and conditions which account
for substantial numbers of preventable diseases and deaths.)
A Church Near You
www.achurchnearyou.com
UpMyStreet - UK house prices, property, crime, local neighbourhood & schools
London Street Gangs - Territory maps and background information
http://www.londonstreetgangs.com/
Hint: Scroll to the bottom of the "Gang Maps" page to see boundaries.
AboutMyArea - The local interactive site - news, reviews, what's on, events, businesses
Research & Statistics GIS
http://www.churchofengland.org/about-us/facts-stats/research-statistics/census-2011.aspx
Church Urban Fund
www.cuf.org.uk
Homeless Pages - Information, Research and Publications on homelessness
http://www.homelesspages.org.uk/
http://www.upmystreet.com/
Hint: Use the "My Neighbourhood" tab
The network of Public Health Observatories - Health Profiles
www.apho.org.uk/resource/view.aspx?RID=91736
The Poverty Site - Geographic Analysis
www.poverty.org.uk/summary/regional.shtml
http://www.apho.org.uk/default.aspx?QN=HP_FINDSEARCH2011
MurderMap - London Homicide Reported Direct from The Old Bailey
Police.uk - Local crime and policing information for England and Wales
http://www.police.uk/
ONS - Neighbourhood Statistics
http://www.aboutmyarea.co.uk/
http://neighbourhood.statistics.gov.uk/
Hint: Use the summary box
http://www.murdermap.co.uk/
Research
&
Statistics

19
Proportion of the population aged 60+ who are in receipt of the Guaranteed part of Pension Credit (August 2012)
Estimated using LSOA level data sourced from http://83.244.183.180/NESS/BEN/iben.htm
Proportion of the working age population who are in receipt of a key out-of-work benefit (Q3 2012)
Life Expectancy at birth (boys) (1999-2003)
Estimated using ward level data from ONS.
Life expectancy at birth (girls) (1999-2003)
Estimated using ward level data from ONS.
Percentage of Children under 16 in Poverty (2009)
Estimated using LSOA level data from http://www.hmrc.gov.uk/statistics/child-poverty-stats.htm
IMD (2010)
Methodology: Government data is published on government boundaries that do not match ecclesiastical boundaries. In order to produce parish population and demographic
estimates we have worked with the ONS to use a best fit modelling process. As such, these statistics can only be considered estimates and, particularly in very diverse areas, are
best used in the context of local knowledge. Where parish populations are sparse the figures for government areas overlapping the parish are used.
Parish estimates from the census have been calculated using the census output area data published by the ONS. These are provisional estimates, and when more granular data at
postcode level is available, will be revised. Estimates have been modelled by allocating the population weighted centroid of each output area to the parish within which it falls.
This means that some parishes have not been allocated population, however proportions for demographic variables have been calculated based on the output areas overlaying
the parish.
For further information about this process, please contact [email protected].
Contains public sector information licensed under the Open Government Licence v1.0 http://www.nationalarchives.gov.uk/doc/open-government-licence/
Estimated using OA level data sourced from ONS Census Data 2011, ONS
Estimated using OA level data sourced from ONS Census Data 2001, ONS
When analysing data, it is important to consider that some parishes are very small and proportions may be very large even where very few cases meet the criteria.
ABOUT THIS DATA
http://www.churchofengland.org/about-us/facts-stats/research-statistics/clergydiversityaudit2005linkpage.aspx
Estimated using OA level data from DWP Information, Governance and Security Directorate from
http://statistics.dwp.gov.uk/asd/asd1/tabtools/census_output_area_data/index.php?page=census_output_area_data
Annual parochial returns
ONS Census data 2011
ONS Census data 2001
2007 Church Diversity Survey
DWP
ONS
HMRC
Department for Communities and Local Government
1
2
3
4
5
6
7
8
These have been collected annually between 2007 and 2011 by the Research and Statistics team, Archbishops’ Council
When quoting figures derived from this data, care should be taken with the level of accuracy quoted.
Estimated using LSOA level data from Communities and Local Government, 2010.
https://www.gov.uk/government/uploads/system/uploads/attachment_data/file/6320/1870718.pdf
Research
&
Statistics

1
Getting to know your parish
What is this spotlight?
How should I use it?
Questions
Contents
This short spotlight brings together a range of information about your parish,
both in terms of your congregations, but also the wider community living in
your area. It covers areas such as Christian affiliation, population age and
ethnicity profiles, household structures, deprivation, employment, schools
and qualifications, alongside church statistics such as attendance and giving.
There is information at the end of the spotlight about where this data comes
from and how it was calculated. If you have any further queries then please
do contact the Research and Statistics team at
This spotlight is not an end in itself, but rather a starting place for you to
explore further. You may want to discuss it at a PCC meeting or with
leadership teams. We’ve included some questions on each page to help you
to think about the information, however some things will be of more
relevance in some areas than others, and these are just suggestions to get
you started. We’ve also included some bigger questions about what to do
next at the end of the spotlight on page 17. There’s space for you to write
some notes here. It might be helpful to write a short paragraph to
summarise your community profile or note down anything that has struck
you as particularly important. There are also details at the end for where
you can find further information should you want to dig a little deeper.
1. Summary: a brief overview of your parish, including what look to be 5 of
the most pressing social issues in your area
2. Age: age profile of your community
3. Ethnicity: ethnicity profile of your community
4. Integration: English language speaking and length of UK residency in your
community
5. Religious affiliation: religious affiliation in your community
6. Households: families, dependents, one person households, temporary
residents and housing tenure
7. Marital and civil partnership status
8. Employment: occupations, benefits and mobility in your community
9. Education: CofE schools and qualification levels in your community
10. Health: people with health problems and carers in your community
11. Deprivation: different types of deprivation in your community
Research
&
Statistics
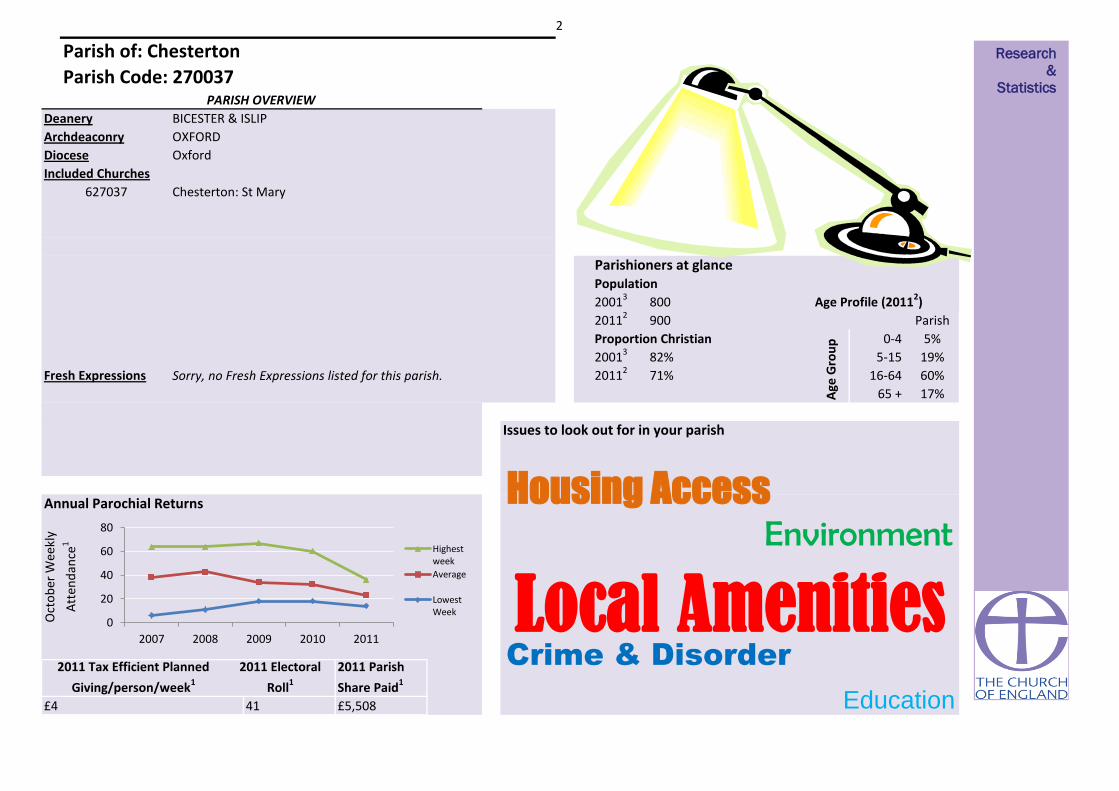
2
Parishioners at glance
Chesterton: St Mary
2011 Tax Efficient Planned
Giving/person/week1
2011 Electoral
Roll1
Education
Crime & Disorder
Local Amenities
82%
71%
Issues to look out for in your parish
£4
Annual Parochial Returns
Oct
ob
er W
eekl
y
Att
end
ance
1
0-4
5-15
2011 Parish
Share Paid1
41
PARISH OVERVIEW
17%
Parish
5%
19%
60%
Age Profile (20112)800
Proportion Christian
Sorry, no Fresh Expressions listed for this parish.Fresh Expressions
900
BICESTER & ISLIP
OXFORD
16-64
Age
Gro
up
Diocese
627037
Deanery
Archdeaconry
20013
20112
20013
20112
Included Churches
Oxford
Population
Environment
Parish of: Chesterton
Parish Code: 270037
65 +
£5,508
Housing Access
Research
&
Statistics
0
20
40
60
80
2007 2008 2009 2010 2011
Highestweek
Average
LowestWeek

3
Parish 20112 Deanery 20112 Diocese 20112
Demographics: AGE PROFILE AND ATTENDANCE AT SERVICES
Does the age profile of your congregation match that of your parish? Are you engaging with the
parish's largest demographic: those aged 45 - 59?
30% 20% 10% 0% 10% 20% 30%
0 - 4
5 - 7
8 - 9
10 - 14
15
16 - 17
18 - 19
20 - 24
25 - 29
30 - 44
45 - 59
60 - 64
65 - 74
75 - 84
85 - 89
90 & overAge profile of parish populations 20013 & 20112
Parish2011
Parish2001
0% 5% 10% 15% 20% 25%
0 - 14
15 - 29
30 - 44
45 - 59
60 - 74
75 - 89
90 & over
0% 10% 20% 30%
0 - 14
15 - 29
30 - 44
45 - 59
60 - 74
75 - 89
90 & over
0% 5% 10% 15% 20% 25%
0 - 14
15 - 29
30 - 44
45 - 59
60 - 74
75 - 89
90 & over
Research
&
Statistics
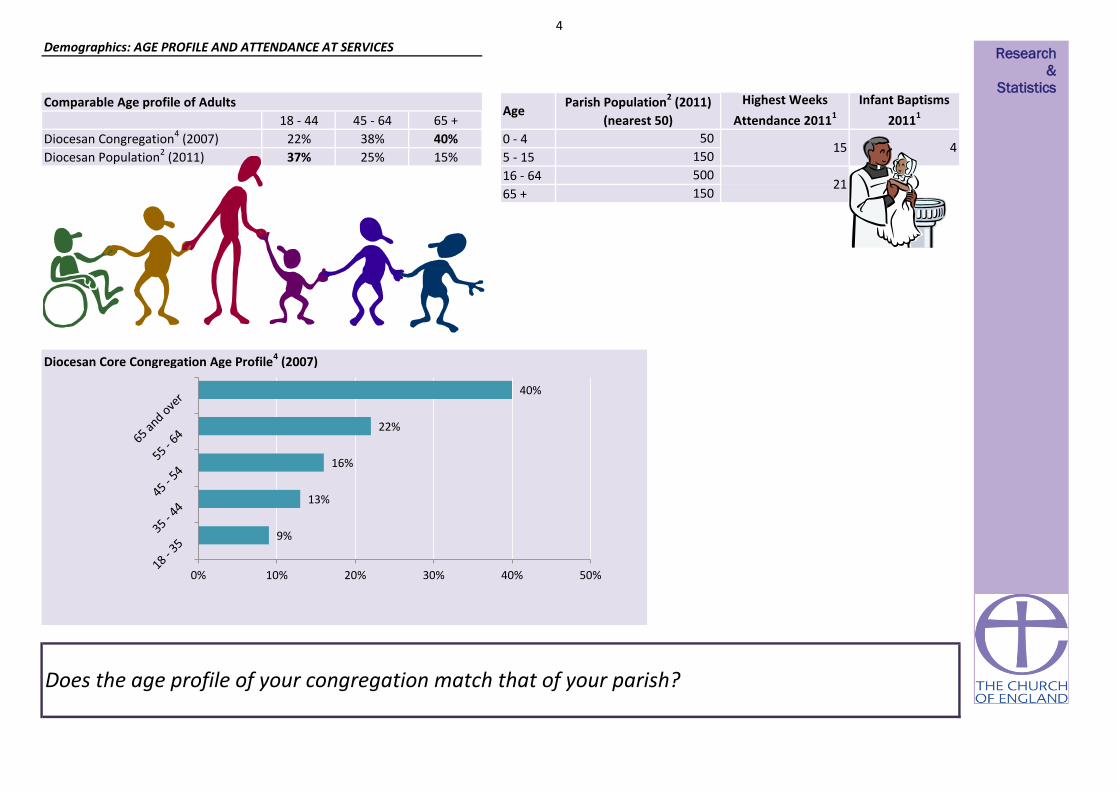
4
15%
Diocesan Congregation4 (2007)
Parish Population2 (2011)
(nearest 50)
Demographics: AGE PROFILE AND ATTENDANCE AT SERVICES
Comparable Age profile of Adults
25%
65 +
40%
Age
50
150
18 - 44
22% 38%
500
150
0 - 4
5 - 15
16 - 64
Diocesan Core Congregation Age Profile4 (2007)
Diocesan Population2 (2011) 37%
45 - 64
Does the age profile of your congregation match that of your parish?
65 +
Infant Baptisms
20111
4
Highest Weeks
Attendance 20111
15
21
9%
13%
16%
22%
40%
0% 10% 20% 30% 40% 50%
Research
&
Statistics

5
Detailed Parish Ethnicity2 2011
Parish Ethnicity2 2011 Parish Ethnicity3 2001 Diocese Ethnicity2 2011
Arab Other Ethnic Group
0%0%
Indian Bangladeshi Chinese
African Caribbean
Parish
Percentage
ME: 3%
Other Asian
1%
Does the ethnicity profile of your congregation match that of your parish? Are you engaging with the parish's
largest demographics: those describing themselves as White or Mixed/Multiple ethnic group?
<1%
3%
<1%<1% <1%
0%
1%0%
Demographics: ETHNICITY
<1%
94%
Other White
2%
White & Asian Other Mixed
<1%
<1%
0%
British
White & Black
Caribbean
Diocesan Population2 (2011)
Diocesan Core Congregation4 (aged 18+ only) (2007)
Percentage Minority Ethnic Background
15%
<1%
Irish
Pakistani
<1%
Other Black
Gypsy or Irish
Traveller
White & Black
African
Research
&
Statistics
White
Mixed/Multipleethnic group
Asian/Asian British
Black or BlackBritish
Other ethnicgroup

6
Cannot speak English well or cannot speak
English Can speak English well or very well
0% 1%Have English as their main language (English or
Welsh if in Wales)
99%2Percentage of people who
Demographics: Integration
10 years or more
92%
2 years or more but less
than 5 years
Born in the UK
Less than 2 years
1% 1% 5%
5 years or more but less
than 10 years
Are services in your parish accessible to all residents? Do you offer any services in foreign
languages? What can you offer those who may not have been in the UK for long?
2Resident in UK:
<1%
Research
&
Statistics
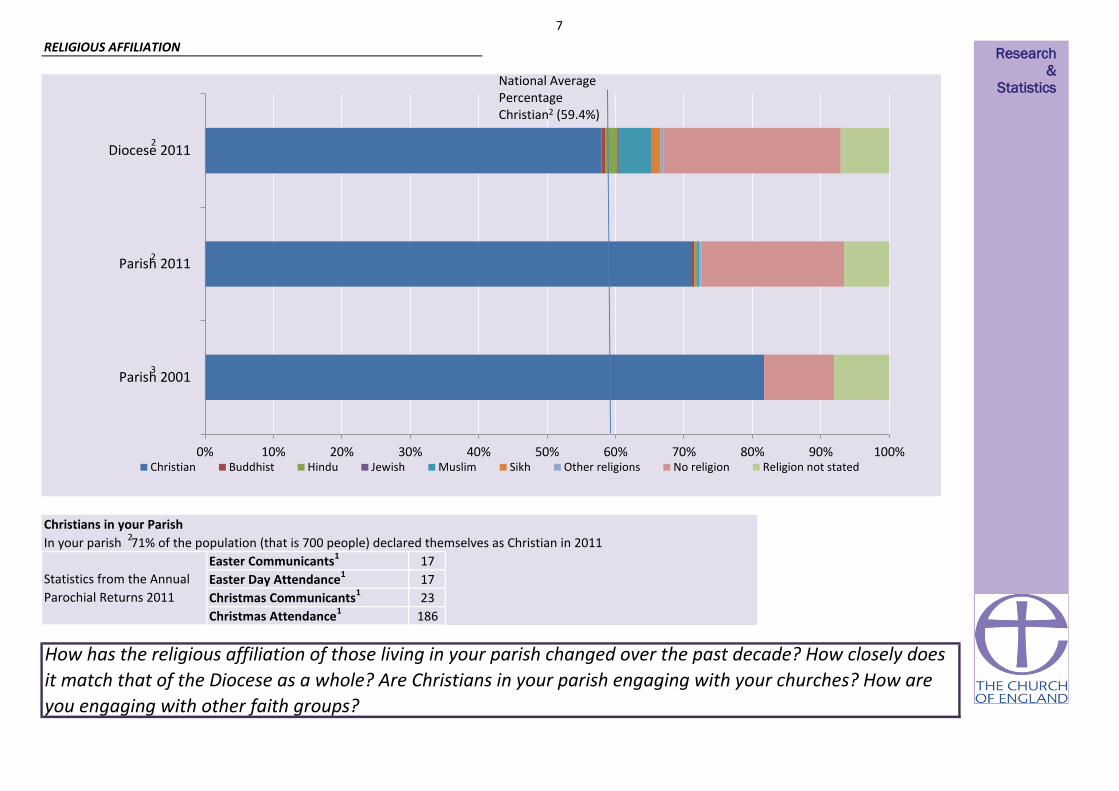
7
In your parish 71% of the population (that is 700 people) declared themselves as Christian in 2011
186
Statistics from the Annual
Parochial Returns 2011
Easter Communicants1
Easter Day Attendance1
Christmas Communicants1
Christmas Attendance1
Christians in your Parish
RELIGIOUS AFFILIATION
17
17
23
How has the religious affiliation of those living in your parish changed over the past decade? How closely does
it match that of the Diocese as a whole? Are Christians in your parish engaging with your churches? How are
you engaging with other faith groups?
0% 10% 20% 30% 40% 50% 60% 70% 80% 90% 100%
Parish 2001
Parish 2011
Diocese 2011
Christian Buddhist Hindu Jewish Muslim Sikh Other religions No religion Religion not stated
2
3
National Average Percentage Christian2 (59.4%)
Research
&
Statistics
2
2

8
Household Spaces2 2011
With at least one usual resident i.e. not vacant 95%
3%Caravan or other mobile or temporary structure
250 <50 <50
Who lives in your parish? Are there issues with access to housing? How permenant are your
parishioners?
Tenure2
Social rented as a percentage of all households2 8%
Social Rented householdsOwner occupied households
(including shared ownership)
Private Rented households
(including those living rent free)
HOUSEHOLDS, LIFESTYLE AND THE COMMUNITY I Research
&
Statistics
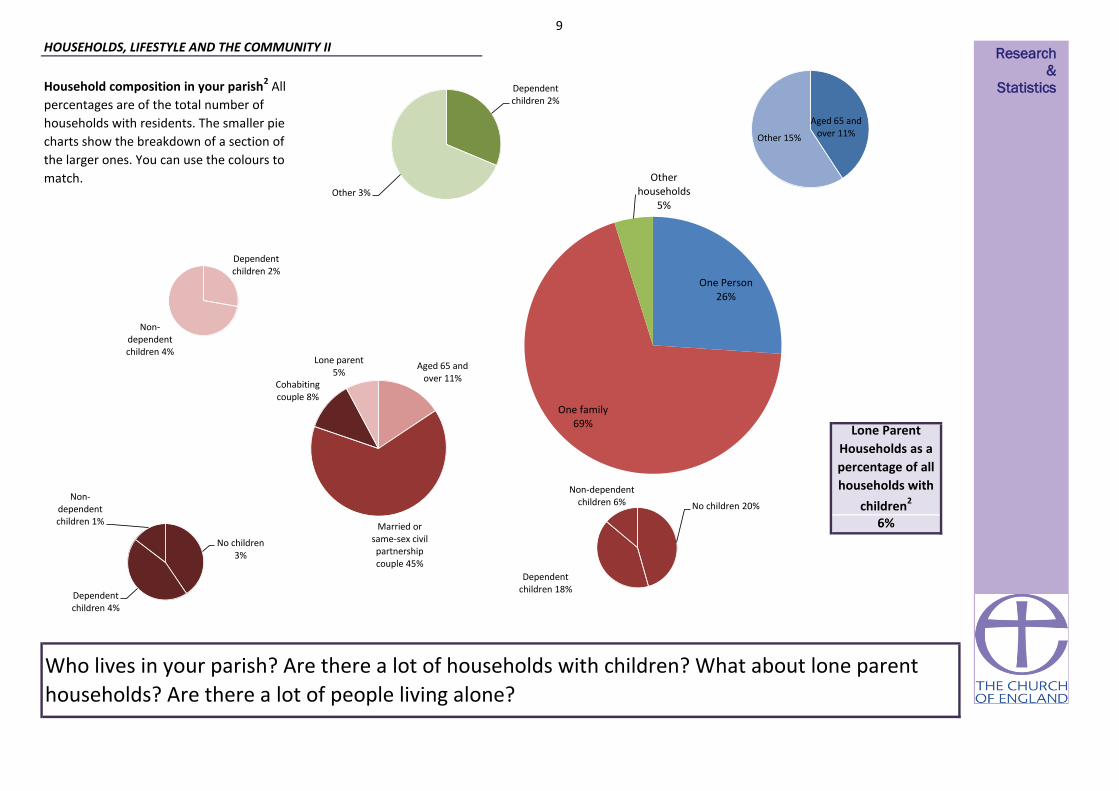
9
Household composition in your parish2 All
percentages are of the total number of
households with residents. The smaller pie
charts show the breakdown of a section of
the larger ones. You can use the colours to
match.
Lone Parent
Households as a
percentage of all
households with
children2
6%
Who lives in your parish? Are there a lot of households with children? What about lone parent
households? Are there a lot of people living alone?
HOUSEHOLDS, LIFESTYLE AND THE COMMUNITY II
Aged 65 and over 11% Other 15%
One Person 26%
One family 69%
Other households
5%
Dependent children 2%
Other 3%
Aged 65 and over 11%
Married or same-sex civil partnership couple 45%
Cohabiting couple 8%
Lone parent 5%
No children 20%
Dependent children 18%
Non-dependent children 6%
No children 3%
Dependent children 4%
Non-dependent children 1%
Dependent children 2%
Non-dependent children 4%
Research
&
Statistics

10
Weddings & Blessings in 2010
Weddings & Blessings in 20114 No
Your Parish Churches held1
Do you hold many weddings in your parish? How is your parish supporting those in the above
categories?
2 No
Marital and civil partnership status
80% 60% 40% 20% 0% 20% 40% 60% 80%
Living in a couple: Married or in a registered same-sex civil partnership
Living in a couple: Cohabiting
Not living in a couple: Single (never married or never registered a same-sex civilpartnership)
Not living in a couple: Married or in a registered same-sex civil partnership
Not living in a couple: Separated (but still legally married or still legally in a same-sexcivil partnership)
Not living in a couple: Divorced or formerly in a same-sex civil partnership which isnow legally dissolved
Not living in a couple: Widowed or surviving partner from a same-sex civilpartnership
2001 2011
Research
&
Statistics 2 3

11
£4
£108
£2
£15,697
£10,491
£10,491
Parish Expenditure1
TEPG/PERSON/WEEK1
Other/person/week1Other planned giving1
How are your parish finances? How does this compare to your community profile?
£2,976
£10,747
EMPLOYMENT AND SOCIAL GRADE, LIFESTYLE
The National Statistics Socio-economic Classification (NS-SeC) is an occupationally
based classification but has rules to provide coverage of the whole adult population.
The NS-SeC provides an indication of socio-economic position based on occupation.
It is an Office for National Statistics standard classification. To assign a person aged
16 to 74 to an NS-SeC category their occupation title is combined with information
about their employment status, whether they are employed or self-employed and
whether or not they supervise other employees. Full-time students are recorded in
the' full-time students' category regardless of whether they are economically active
or not.Parish Share Assessed1
Parish Share Paid1
£0
£0
£10,933
£11,342
£5,508
£4
£2,936Tax Efficient Planned Giving (TEPG)1
Finance Returns 2010
NS-SeC of Household Reference Person2
£15,901Parish Income12011
Research
&
Statistics
0% 5% 10% 15% 20% 25% 30% 35%
Higher managerial, administrative and professional occupations
Lower managerial, administrative and professional occupations
Intermediate occupations
Small employers and own account workers
Lower supervisory and technical occupations
Semi-routine occupations
Routine occupations
Never worked and long-term unemployed
Not classified (Full-time students or not classifiable for other reasons)

12
9%
91%
Households
3%
EMPLOYMENT AND SOCIAL GRADE, LIFESTYLE
How much free time do residents of your parish have? How accessible are your churches to those
with/without cars?
Access to at least 1 car or van
Household Mobility2
Proportion of population aged 60+ who are in
receipt of the Guaranteed part of Pension
Credit5
6%
Proportion of working age persons (16-74) with
no qualifications2 13%
Proportion of working age population who are
in receipt of a key out-of-work benefit5
No access to a car or van
Part-time: 15 hours or less
worked 8%
Part-time: 16 to 30 hours worked
21%
Full-time: 31 to 48 hours worked
51%
Full-time: 49 or more hours
worked 19%
Hours Worked2
Part-time: 15 hours or less worked Part-time: 16 to 30 hours worked
Full-time: 31 to 48 hours worked Full-time: 49 or more hours worked
Research
&
Statistics

13
Church Schools in the parish
CHESTERTON CE PRIMARY SCHOOL
Parish2 2011 (proportion of 16+ population) National2 2011 (proportion of 16+ population)
EDUCATION AND SCHOOLS
How qualified are residents of your parish? What Church of England schools are available?
12%
16%
17%
4% 12%
36%
3%
22%
13%
15% 4%
12%
27%
6% No qualifications (No formal qualifications)
Level 1 qualifications (1-4 GCSEs or equivalent)
Level 2 qualifications (5 GCSEs or equivalent)
Apprenticeships
Level 3 qualifications (2 or more A-levels orequivalent )
Level 4 qualifications and above (Bachelorsdegree or equivalent, and higher qualifications)
Other qualifications (including foreignqualifications)
Research
&
Statistics

14
Hours per week of provision of unpaid care2
1% 1%
Very bad health Bad health Fair health
1 - 19
Are there people in your parish with health problems? Is there anything you can do to assist with
day-to-day activities of those who have health problems?
HEALTH
0
Long-term health problem or disability2
50 +91% 7%
Good health Very good health
<1%
Day-to-day activities limited a lot Day-to-day activities limited a little Day-to-day activities not limited
5% 7% 88%
2% 10% 37% 51%
General health2
20 - 49
Research
&
Statistics

15
You parish can be categorised as in the most or least deprived 10% or 50% of all parishes within the diocese and of all parishes nationally
50% least deprived 10% least deprived
Life expectancy at birth (girls)6 (1999-2003)
Life Expectancy at birth (boys)6 (1999-2003)
8%
10.7
50% least deprived6% 10% least deprived
50% least deprivedPercentage of Children under 16 in Poverty7 (2010)
Percentage of working age persons (16-74) with no
qualifications2 (2011)
10% least deprived
Life expectancy at birth can give an idea of overall quality of life. Life expectancy is an average. Women tend to have greater life expectancy. Life expectany can be affected by family history, marital status, economic status,
physique, exercise, diet, drug use including smoking and alcohol consumption, disposition, education, environment, sleep, climate, and health care.
Proportion of the population aged 60+ who are in receipt of
the Guaranteed part of Pension Credit5 (2012)
4%
Social rented as a percentage of all households2 (2011)
Index of Multiple Deprivation (IMD)8 (2010)
Proportion of the working age population who are in receipt
of a key out-of-work benefit5 (2012)
Lone Parent Households as a percentage of all households
with children2 (2011)
Pension Credit is an income related benefit made up of 2 parts - Guarantee Credit and Savings Credit. The guaranteed part tops up weekly income if it’s below £142.70 (single people) or £217.90 (couples) so those who
receive this are on a low income. This statistic only covers people living in private households, and not residential institutions (such as nursing homes).
10% least deprived
The proportion of children in families in receipr of either out of work benefits or tax credits where their reported income is less than 60% median income. Poor children may be excluded from participating in society. They may be unable to afford school
trips and activities; school uniforms or warm winter clothes, be unable to go swimming, have friends round for tea or celebrate their birthdays. Many will never have a holiday. Children who grow up poor are more likely to leave school without
qualifications, have lower employment chances, thus restricting their ability to get a good job and financially contribute to society.
10% least deprived
13% 50% least deprived
DEPRIVATION AND KEY ISSUES AFFECTING PARISHIONERS
Score
80
10% least deprived87
3%
Deprivation is considered to be a multi-dimensional problem, encompassing a range of domains such as financial, health, education, services or crime. continuous measure of relative deprivation therefore there is no definitive point on the scale below
which areas are considered to be deprived and above which they are not.While being in the most deprived 10% may indicate financial disadvantage, it could equally be due to isolated living.
Number of people aged 16 to State Pension age claiming: Jobseeker’s Allowance (JSA), Employment and Support Allowance (ESA), Incapacity Benefit (IB), Income Support (IS) (as a lone parent or in the “other” category),
Other income related benefits.
Social housing is housing that is let at low rents and on a secure basis to people in housing need. It is generally provided by councils and not-for-profit organisations such as housing associations. Vulnerable groups are often
concentrated in the social housing sector, with low rates of employment and low income levels
Children in single parent families have a much higher risk of living in poverty than children in couple families. Single parents may rely on informal childcare.
What are the particular issues that affect your parish? Are you doing anything to address these?
10% least deprived
Deprivation Indicator Diocesan Position National Position
A low-level of skill or educational attainment is one indicator of social disadvantage. Qualifications may make it easier to find employment. Learning also helps promote active citizenship and combat social exclusion.
6%
50% least deprived
50% least deprived
50% least deprived
50% most deprived
50% least deprived
50% least deprived
50% least deprived
Research
&
Statistics

16
0
0.1 10% least deprived 0
0
1
50% least deprived
50% most deprived
10% most deprived
50% least deprived
50% most deprived
50% most deprived
0 0 0
50% least deprived
10% least deprived 10% least deprived
00 0
0
0
0
0
0
50% most deprived
50% most deprived
50% most deprived
50% least deprived
50% least deprived
50% least deprived
10% least deprived
10% least deprived
0 1 0
0Skills Sub-domain 4.5
0
0
0
0
00 0
0
0
0
0
0
0
0
0
0
0
0 0
0
0 0
0
0
0
0
0
0
0
0
0
0
0.0
0.0
5%
0 0
01010% least deprived
0
0
0
0
0
0
0
7.2
1
50% least deprived
50% most deprived
0
00
50% least deprived 0
0
50% least deprived 1
50% least deprived 0
Number of LSOAs amongst
least deprived*Diocesan position National position
HEALTH DEPRIVATION AND
DISABILITY-0.7
Average
Score for
parishIMD Subdomains8 (2010)
INCOME
EMPLOYMENT
Number of LSOAs amongst
most deprived*
1%
0
Income Deprivation Affecting
Children Index0.0
CRIME AND DISORDER
LIVING ENVIRONMENT
Indoors Sub-domain
Outdoors Sub-domain
0
0
Geographical Barriers Sub-domain
16.4
50% most deprived
EDUCATION SKILLS AND TRAINING
BARRIERS TO HOUSING AND SERVICES10% most deprived
Wider Barriers Sub-domain
Children/Young People Sub-domain9.8 0 0
0
0
50% most deprived 50% least deprived
0
0
0
0
0
-0.6
050% most deprived
7.5
81.9
12.1
13.4
47.0
50% most deprived 50% least deprived
10% 1%
DEPRIVATION AND KEY ISSUES AFFECTING PARISHIONERSIt is important to note that these statistics are a measure of deprivation, not affluence, and to recognise that not every person in a highly deprived area will themselves be
deprived. Equally, there will be some deprived people living in the least deprived areas.
Deprivation covers a broad range of issues and refers to unmet needs caused by a lack of resources of all kinds, not just financial. The English Indices of Deprivation
attempt to measure a broader concept of multiple deprivation, made up of several distinct dimensions, or domains, of deprivation. Seven domains of deprivation are
combined to produce the overall Index of Multiple Deprivation. Each domain contains a number of component indicators. The English Indices of Deprivation are a
continuous measure of relative deprivation therefore there is no definitive point on the scale below which areas are considered to be deprived and above which they are
not. Deprived areas have been defined in this release as those containing LSOAs that are amongst the 10 per cent most deprived in England according to the overall Index
of Multiple Deprivation.
Overall IMD 0 000
5% 10%
10.7 50% most deprived
00
10 0
*There is 1 full or partial LSOA included in this parish
0 0
What are the particular issues that affect your parish? Are you doing anything to address these?
Income Deprivation Affecting Older
People Index
0
Research
&
Statistics

17
This spotlight has given you some information about your parish both in terms of your own church congregations and your local community. This is not an
end in itself, but rather a starting place for you to explore further. Questions to consider might include:
• What does our congregation look like?
• How does it compare to the local population?
• What other churches are there in the area? What parts of the community do they reach? Which parts of the community are being missed?
• What other local organisations or centres are there, that might bring people into our parish? Examples might be Hospitals or health centres, prisons, job
centres, homeless shelters, schools, charities, mother and toddler groups, uniformed organisations, community centres, libraries, shops, offices, stations?
How can we interact with these people?
• What areas of our parish do we know well or less well?
• How does the local community change between weekdays and weekends? How do our services and events fit with the shifting local population?
• Is our website/'A Church Near You' profile up to date?
• Are our records up to date?
****************************************************************************************************************************
What to do next?
Your notes
WHAT TO DO NEXT Research
&
Statistics

18
Sources of further information
Public Health Observatories - APHO JSNA Datasets (The datasets are intended to cover a
range of issues, focused on underlying determinants of health and conditions which account
for substantial numbers of preventable diseases and deaths.)
A Church Near You
www.achurchnearyou.com
UpMyStreet - UK house prices, property, crime, local neighbourhood & schools
London Street Gangs - Territory maps and background information
http://www.londonstreetgangs.com/
Hint: Scroll to the bottom of the "Gang Maps" page to see boundaries.
AboutMyArea - The local interactive site - news, reviews, what's on, events, businesses
Research & Statistics GIS
http://www.churchofengland.org/about-us/facts-stats/research-statistics/census-2011.aspx
Church Urban Fund
www.cuf.org.uk
Homeless Pages - Information, Research and Publications on homelessness
http://www.homelesspages.org.uk/
http://www.upmystreet.com/
Hint: Use the "My Neighbourhood" tab
The network of Public Health Observatories - Health Profiles
www.apho.org.uk/resource/view.aspx?RID=91736
The Poverty Site - Geographic Analysis
www.poverty.org.uk/summary/regional.shtml
http://www.apho.org.uk/default.aspx?QN=HP_FINDSEARCH2011
MurderMap - London Homicide Reported Direct from The Old Bailey
Police.uk - Local crime and policing information for England and Wales
http://www.police.uk/
ONS - Neighbourhood Statistics
http://www.aboutmyarea.co.uk/
http://neighbourhood.statistics.gov.uk/
Hint: Use the summary box
http://www.murdermap.co.uk/
Research
&
Statistics

19
Proportion of the population aged 60+ who are in receipt of the Guaranteed part of Pension Credit (August 2012)
Estimated using LSOA level data sourced from http://83.244.183.180/NESS/BEN/iben.htm
Proportion of the working age population who are in receipt of a key out-of-work benefit (Q3 2012)
Life Expectancy at birth (boys) (1999-2003)
Estimated using ward level data from ONS.
Life expectancy at birth (girls) (1999-2003)
Estimated using ward level data from ONS.
Percentage of Children under 16 in Poverty (2009)
Estimated using LSOA level data from http://www.hmrc.gov.uk/statistics/child-poverty-stats.htm
IMD (2010)
Methodology: Government data is published on government boundaries that do not match ecclesiastical boundaries. In order to produce parish population and demographic
estimates we have worked with the ONS to use a best fit modelling process. As such, these statistics can only be considered estimates and, particularly in very diverse areas, are
best used in the context of local knowledge. Where parish populations are sparse the figures for government areas overlapping the parish are used.
Parish estimates from the census have been calculated using the census output area data published by the ONS. These are provisional estimates, and when more granular data at
postcode level is available, will be revised. Estimates have been modelled by allocating the population weighted centroid of each output area to the parish within which it falls.
This means that some parishes have not been allocated population, however proportions for demographic variables have been calculated based on the output areas overlaying
the parish.
For further information about this process, please contact [email protected].
Contains public sector information licensed under the Open Government Licence v1.0 http://www.nationalarchives.gov.uk/doc/open-government-licence/
Estimated using OA level data sourced from ONS Census Data 2011, ONS
Estimated using OA level data sourced from ONS Census Data 2001, ONS
When analysing data, it is important to consider that some parishes are very small and proportions may be very large even where very few cases meet the criteria.
ABOUT THIS DATA
http://www.churchofengland.org/about-us/facts-stats/research-statistics/clergydiversityaudit2005linkpage.aspx
Estimated using OA level data from DWP Information, Governance and Security Directorate from
http://statistics.dwp.gov.uk/asd/asd1/tabtools/census_output_area_data/index.php?page=census_output_area_data
Annual parochial returns
ONS Census data 2011
ONS Census data 2001
2007 Church Diversity Survey
DWP
ONS
HMRC
Department for Communities and Local Government
1
2
3
4
5
6
7
8
These have been collected annually between 2007 and 2011 by the Research and Statistics team, Archbishops’ Council
When quoting figures derived from this data, care should be taken with the level of accuracy quoted.
Estimated using LSOA level data from Communities and Local Government, 2010.
https://www.gov.uk/government/uploads/system/uploads/attachment_data/file/6320/1870718.pdf
Research
&
Statistics

1
Getting to know your parish
What is this spotlight?
How should I use it?
Questions
Contents
This short spotlight brings together a range of information about your parish,
both in terms of your congregations, but also the wider community living in
your area. It covers areas such as Christian affiliation, population age and
ethnicity profiles, household structures, deprivation, employment, schools
and qualifications, alongside church statistics such as attendance and giving.
There is information at the end of the spotlight about where this data comes
from and how it was calculated. If you have any further queries then please
do contact the Research and Statistics team at
This spotlight is not an end in itself, but rather a starting place for you to
explore further. You may want to discuss it at a PCC meeting or with
leadership teams. We’ve included some questions on each page to help you
to think about the information, however some things will be of more
relevance in some areas than others, and these are just suggestions to get
you started. We’ve also included some bigger questions about what to do
next at the end of the spotlight on page 17. There’s space for you to write
some notes here. It might be helpful to write a short paragraph to
summarise your community profile or note down anything that has struck
you as particularly important. There are also details at the end for where
you can find further information should you want to dig a little deeper.
1. Summary: a brief overview of your parish, including what look to be 5 of
the most pressing social issues in your area
2. Age: age profile of your community
3. Ethnicity: ethnicity profile of your community
4. Integration: English language speaking and length of UK residency in your
community
5. Religious affiliation: religious affiliation in your community
6. Households: families, dependents, one person households, temporary
residents and housing tenure
7. Marital and civil partnership status
8. Employment: occupations, benefits and mobility in your community
9. Education: CofE schools and qualification levels in your community
10. Health: people with health problems and carers in your community
11. Deprivation: different types of deprivation in your community
Research
&
Statistics

2
Parishioners at glance
Cottisford: St Mary the Virgin
Hardwick-cum-Tusmore: St Mary
2011 Tax Efficient Planned
Giving/person/week1
2011 Electoral
Roll1
Pensioner Poverty
Housing Access
Local Amenities
74%
73%
Issues to look out for in your parish
£6
Annual Parochial Returns
Oct
ob
er W
eekl
y
Att
end
ance
1
0-4
5-15
2011 Parish
Share Paid1
22
PARISH OVERVIEW
22%
Parish
6%
10%
62%
Age Profile (20112)200
Proportion Christian
Sorry, no Fresh Expressions listed for this parish.Fresh Expressions
200
BICESTER & ISLIP
OXFORD
16-64
Age
Gro
up
Diocese
627038
Deanery
Archdeaconry
20013
20112
20013
20112
Included Churches
Oxford
Population
Housing Conditions
Parish of: Cottisford and Hardwick-cum-Tusmore
Parish Code: 270038
65 +
£7,920
Elderly Deprivation
627045
Research
&
Statistics
0
5
10
15
20
25
2007 2008 2009 2010 2011
Highestweek
Average
LowestWeek

3
Parish 20112 Deanery 20112 Diocese 20112
Demographics: AGE PROFILE AND ATTENDANCE AT SERVICES
Does the age profile of your congregation match that of your parish? Are you engaging with the
parish's largest demographic: those aged 45 - 59?
30% 20% 10% 0% 10% 20% 30%
0 - 4
5 - 7
8 - 9
10 - 14
15
16 - 17
18 - 19
20 - 24
25 - 29
30 - 44
45 - 59
60 - 64
65 - 74
75 - 84
85 - 89
90 & overAge profile of parish populations 20013 & 20112
Parish2011
Parish2001
0% 5% 10% 15% 20% 25%
0 - 14
15 - 29
30 - 44
45 - 59
60 - 74
75 - 89
90 & over
0% 10% 20% 30%
0 - 14
15 - 29
30 - 44
45 - 59
60 - 74
75 - 89
90 & over
0% 5% 10% 15% 20% 25%
0 - 14
15 - 29
30 - 44
45 - 59
60 - 74
75 - 89
90 & over
Research
&
Statistics

4
15%
Diocesan Congregation4 (2007)
Parish Population2 (2011)
(nearest 50)
Demographics: AGE PROFILE AND ATTENDANCE AT SERVICES
Comparable Age profile of Adults
25%
65 +
40%
Age
-
-
18 - 44
22% 38%
150
50
0 - 4
5 - 15
16 - 64
Diocesan Core Congregation Age Profile4 (2007)
Diocesan Population2 (2011) 37%
45 - 64
Does the age profile of your congregation match that of your parish?
65 +
Infant Baptisms
20111
2
Highest Weeks
Attendance 20111
2
17
9%
13%
16%
22%
40%
0% 10% 20% 30% 40% 50%
Research
&
Statistics

5
Detailed Parish Ethnicity2 2011
Parish Ethnicity2 2011 Parish Ethnicity3 2001 Diocese Ethnicity2 2011
Arab Other Ethnic Group
1%0%
Indian Bangladeshi Chinese
African Caribbean
Parish
Percentage
ME: 3%
Other Asian
0%
Does the ethnicity profile of your congregation match that of your parish? Are you engaging with the parish's
largest demographics: those describing themselves as White or Mixed/Multiple ethnic group?
0%
3%
0%0% 0%
0%
<1%<1%
Demographics: ETHNICITY
0%
94%
Other White
3%
White & Asian Other Mixed
<1%
<1%
0%
British
White & Black
Caribbean
Diocesan Population2 (2011)
Diocesan Core Congregation4 (aged 18+ only) (2007)
Percentage Minority Ethnic Background
15%
0%
Irish
Pakistani
<1%
Other Black
Gypsy or Irish
Traveller
White & Black
African
Research
&
Statistics
White
Mixed/Multipleethnic group
Asian/Asian British
Black or BlackBritish
Other ethnicgroup

6
Cannot speak English well or cannot speak
English Can speak English well or very well
0% 1%Have English as their main language (English or
Welsh if in Wales)
99%2Percentage of people who
Demographics: Integration
10 years or more
93%
2 years or more but less
than 5 years
Born in the UK
Less than 2 years
1% <1% 6%
5 years or more but less
than 10 years
Are services in your parish accessible to all residents? Do you offer any services in foreign
languages? What can you offer those who may not have been in the UK for long?
2Resident in UK:
0%
Research
&
Statistics

7
In your parish 73% of the population (that is 150 people) declared themselves as Christian in 2011
33
Statistics from the Annual
Parochial Returns 2011
Easter Communicants1
Easter Day Attendance1
Christmas Communicants1
Christmas Attendance1
Christians in your Parish
RELIGIOUS AFFILIATION
24
25
24
How has the religious affiliation of those living in your parish changed over the past decade? How closely does
it match that of the Diocese as a whole? Are Christians in your parish engaging with your churches? How are
you engaging with other faith groups?
0% 10% 20% 30% 40% 50% 60% 70% 80% 90% 100%
Parish 2001
Parish 2011
Diocese 2011
Christian Buddhist Hindu Jewish Muslim Sikh Other religions No religion Religion not stated
2
3
National Average Percentage Christian2 (59.4%)
Research
&
Statistics
2
2

8
Household Spaces2 2011
With at least one usual resident i.e. not vacant 91%
0%Caravan or other mobile or temporary structure
50 <50 <50
Who lives in your parish? Are there issues with access to housing? How permenant are your
parishioners?
Tenure2
Social rented as a percentage of all households2 1%
Social Rented householdsOwner occupied households
(including shared ownership)
Private Rented households
(including those living rent free)
HOUSEHOLDS, LIFESTYLE AND THE COMMUNITY I Research
&
Statistics
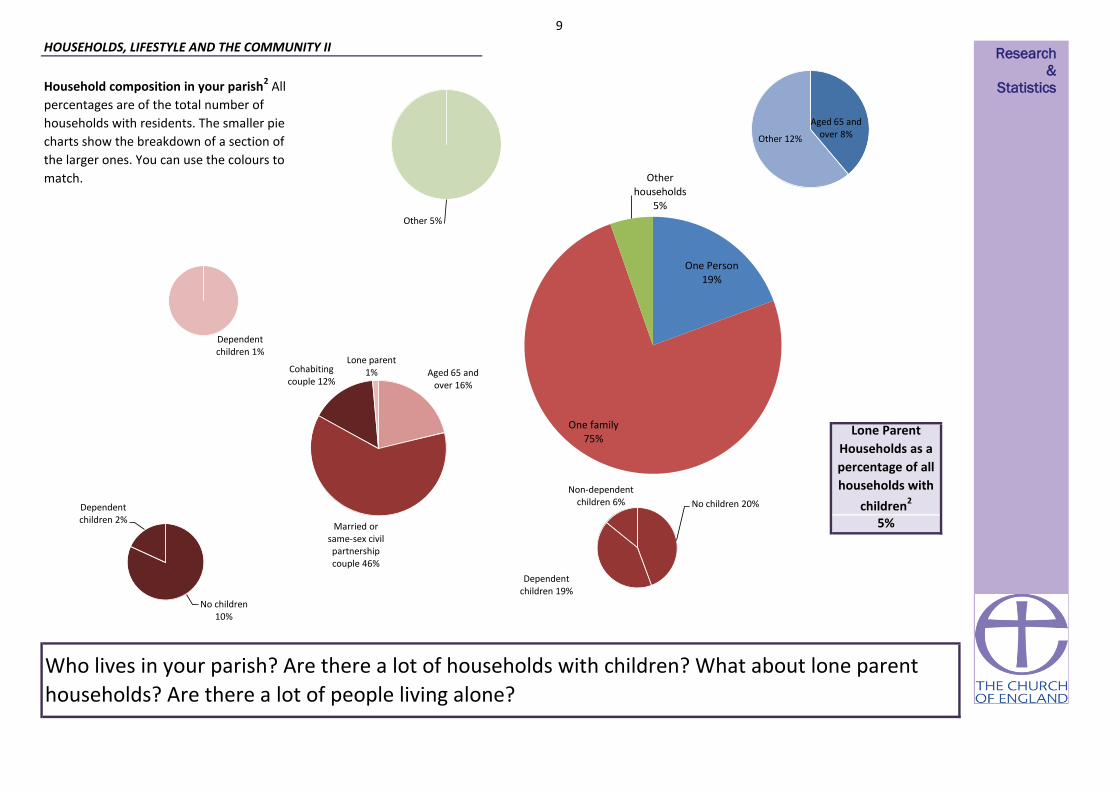
9
Household composition in your parish2 All
percentages are of the total number of
households with residents. The smaller pie
charts show the breakdown of a section of
the larger ones. You can use the colours to
match.
Lone Parent
Households as a
percentage of all
households with
children2
5%
Who lives in your parish? Are there a lot of households with children? What about lone parent
households? Are there a lot of people living alone?
HOUSEHOLDS, LIFESTYLE AND THE COMMUNITY II
Aged 65 and over 8% Other 12%
One Person 19%
One family 75%
Other households
5%
Other 5%
Aged 65 and over 16%
Married or same-sex civil partnership couple 46%
Cohabiting couple 12%
Lone parent 1%
No children 20%
Dependent children 19%
Non-dependent children 6%
No children 10%
Dependent children 2%
Dependent children 1%
Research
&
Statistics
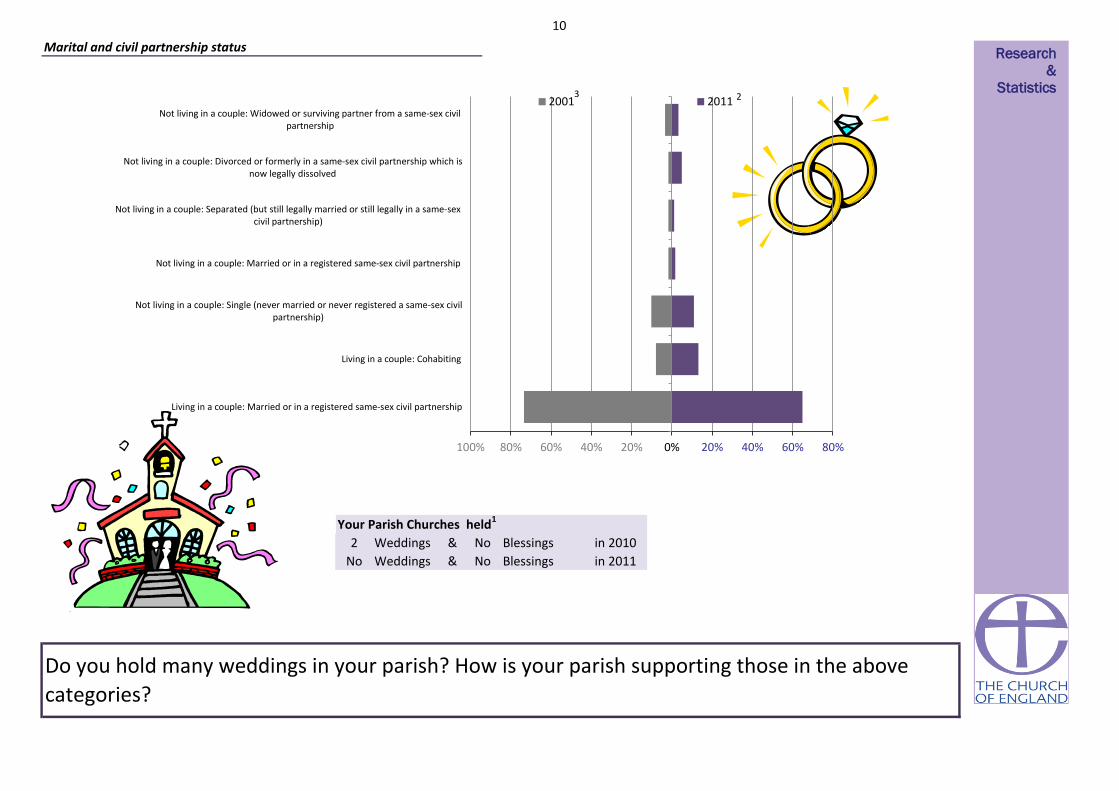
10
Weddings & Blessings in 2010
Weddings & Blessings in 2011No No
Your Parish Churches held1
Do you hold many weddings in your parish? How is your parish supporting those in the above
categories?
2 No
Marital and civil partnership status
100% 80% 60% 40% 20% 0% 20% 40% 60% 80%
Living in a couple: Married or in a registered same-sex civil partnership
Living in a couple: Cohabiting
Not living in a couple: Single (never married or never registered a same-sex civilpartnership)
Not living in a couple: Married or in a registered same-sex civil partnership
Not living in a couple: Separated (but still legally married or still legally in a same-sexcivil partnership)
Not living in a couple: Divorced or formerly in a same-sex civil partnership which isnow legally dissolved
Not living in a couple: Widowed or surviving partner from a same-sex civilpartnership
2001 2011
Research
&
Statistics 2 3
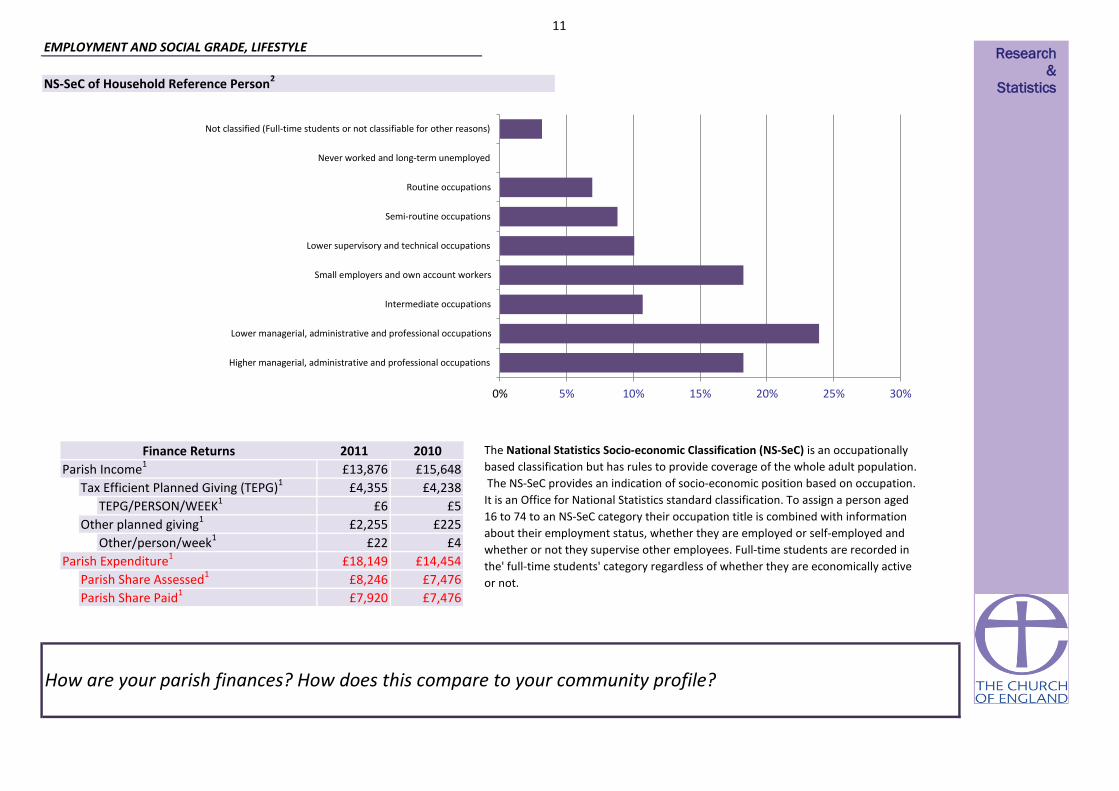
11
£5
£225
£4
£14,454
£7,476
£7,476
Parish Expenditure1
TEPG/PERSON/WEEK1
Other/person/week1Other planned giving1
How are your parish finances? How does this compare to your community profile?
£4,355
£13,876
EMPLOYMENT AND SOCIAL GRADE, LIFESTYLE
The National Statistics Socio-economic Classification (NS-SeC) is an occupationally
based classification but has rules to provide coverage of the whole adult population.
The NS-SeC provides an indication of socio-economic position based on occupation.
It is an Office for National Statistics standard classification. To assign a person aged
16 to 74 to an NS-SeC category their occupation title is combined with information
about their employment status, whether they are employed or self-employed and
whether or not they supervise other employees. Full-time students are recorded in
the' full-time students' category regardless of whether they are economically active
or not.Parish Share Assessed1
Parish Share Paid1
£2,255
£22
£18,149
£8,246
£7,920
£6
£4,238Tax Efficient Planned Giving (TEPG)1
Finance Returns 2010
NS-SeC of Household Reference Person2
£15,648Parish Income12011
Research
&
Statistics
0% 5% 10% 15% 20% 25% 30%
Higher managerial, administrative and professional occupations
Lower managerial, administrative and professional occupations
Intermediate occupations
Small employers and own account workers
Lower supervisory and technical occupations
Semi-routine occupations
Routine occupations
Never worked and long-term unemployed
Not classified (Full-time students or not classifiable for other reasons)

12
4%
96%
Households
6%
EMPLOYMENT AND SOCIAL GRADE, LIFESTYLE
How much free time do residents of your parish have? How accessible are your churches to those
with/without cars?
Access to at least 1 car or van
Household Mobility2
Proportion of population aged 60+ who are in
receipt of the Guaranteed part of Pension
Credit5
13%
Proportion of working age persons (16-74) with
no qualifications2 20%
Proportion of working age population who are
in receipt of a key out-of-work benefit5
No access to a car or van
Part-time: 15 hours or less
worked 17%
Part-time: 16 to 30 hours
worked 14%
Full-time: 31 to 48 hours worked
47%
Full-time: 49 or more hours
worked 22%
Hours Worked2
Part-time: 15 hours or less worked Part-time: 16 to 30 hours worked
Full-time: 31 to 48 hours worked Full-time: 49 or more hours worked
Research
&
Statistics

13
Church Schools in the parish
Parish2 2011 (proportion of 16+ population) National2 2011 (proportion of 16+ population)
EDUCATION AND SCHOOLS
How qualified are residents of your parish? What Church of England schools are available?
Sorry, we do not currently have
any Church Schools listed for this
parish.
18%
7%
25%
2%
10%
35%
3%
22%
13%
15% 4%
12%
27%
6% No qualifications (No formal qualifications)
Level 1 qualifications (1-4 GCSEs or equivalent)
Level 2 qualifications (5 GCSEs or equivalent)
Apprenticeships
Level 3 qualifications (2 or more A-levels orequivalent )
Level 4 qualifications and above (Bachelorsdegree or equivalent, and higher qualifications)
Other qualifications (including foreignqualifications)
Research
&
Statistics

14
Hours per week of provision of unpaid care2
0% 3%
Very bad health Bad health Fair health
1 - 19
Are there people in your parish with health problems? Is there anything you can do to assist with
day-to-day activities of those who have health problems?
HEALTH
0
Long-term health problem or disability2
50 +91% 6%
Good health Very good health
0%
Day-to-day activities limited a lot Day-to-day activities limited a little Day-to-day activities not limited
5% 9% 86%
1% 12% 38% 50%
General health2
20 - 49
Research
&
Statistics

15
You parish can be categorised as in the most or least deprived 10% or 50% of all parishes within the diocese and of all parishes nationally
50% least deprived 50% least deprived
Life expectancy at birth (girls)6 (1999-2003)
Life Expectancy at birth (boys)6 (1999-2003)
1%
13.3
50% most deprived13% 50% most deprived
50% most deprivedPercentage of Children under 16 in Poverty7 (2010)
Percentage of working age persons (16-74) with no
qualifications2 (2011)
10% least deprived
Life expectancy at birth can give an idea of overall quality of life. Life expectancy is an average. Women tend to have greater life expectancy. Life expectany can be affected by family history, marital status, economic status,
physique, exercise, diet, drug use including smoking and alcohol consumption, disposition, education, environment, sleep, climate, and health care.
Proportion of the population aged 60+ who are in receipt of
the Guaranteed part of Pension Credit5 (2012)
10%
Social rented as a percentage of all households2 (2011)
Index of Multiple Deprivation (IMD)8 (2010)
Proportion of the working age population who are in receipt
of a key out-of-work benefit5 (2012)
Lone Parent Households as a percentage of all households
with children2 (2011)
Pension Credit is an income related benefit made up of 2 parts - Guarantee Credit and Savings Credit. The guaranteed part tops up weekly income if it’s below £142.70 (single people) or £217.90 (couples) so those who
receive this are on a low income. This statistic only covers people living in private households, and not residential institutions (such as nursing homes).
50% least deprived
The proportion of children in families in receipr of either out of work benefits or tax credits where their reported income is less than 60% median income. Poor children may be excluded from participating in society. They may be unable to afford school
trips and activities; school uniforms or warm winter clothes, be unable to go swimming, have friends round for tea or celebrate their birthdays. Many will never have a holiday. Children who grow up poor are more likely to leave school without
qualifications, have lower employment chances, thus restricting their ability to get a good job and financially contribute to society.
50% least deprived
20% 50% most deprived
DEPRIVATION AND KEY ISSUES AFFECTING PARISHIONERS
Score
79
10% least deprived88
6%
Deprivation is considered to be a multi-dimensional problem, encompassing a range of domains such as financial, health, education, services or crime. continuous measure of relative deprivation therefore there is no definitive point on the scale below
which areas are considered to be deprived and above which they are not.While being in the most deprived 10% may indicate financial disadvantage, it could equally be due to isolated living.
Number of people aged 16 to State Pension age claiming: Jobseeker’s Allowance (JSA), Employment and Support Allowance (ESA), Incapacity Benefit (IB), Income Support (IS) (as a lone parent or in the “other” category),
Other income related benefits.
Social housing is housing that is let at low rents and on a secure basis to people in housing need. It is generally provided by councils and not-for-profit organisations such as housing associations. Vulnerable groups are often
concentrated in the social housing sector, with low rates of employment and low income levels
Children in single parent families have a much higher risk of living in poverty than children in couple families. Single parents may rely on informal childcare.
What are the particular issues that affect your parish? Are you doing anything to address these?
10% least deprived
Deprivation Indicator Diocesan Position National Position
A low-level of skill or educational attainment is one indicator of social disadvantage. Qualifications may make it easier to find employment. Learning also helps promote active citizenship and combat social exclusion.
5%
50% least deprived
10% least deprived
50% most deprived
50% most deprived
10% least deprived
50% most deprived
10% least deprived
Research
&
Statistics

16
0
0.2 50% most deprived 0
0
0
50% most deprived
50% most deprived
10% most deprived
50% least deprived
50% most deprived
10% most deprived
0 0 0
50% most deprived
50% least deprived 50% least deprived
00 0
0
0
0
0
0
50% least deprived
50% most deprived
50% least deprived
50% most deprived
50% most deprived
50% least deprived
10% least deprived
50% least deprived
0 0 0
0Skills Sub-domain 6.5
0
1
0
0
00 0
0
0
0
0
0
0
0
0
0
0
0 0
0
0 0
0
0
0
1
0
0
0
0
1
0
0.1
0.0
5%
0 0
00050% most deprived
0
0
0
0
0
0
0
4.8
1
10% least deprived
50% least deprived
0
00
50% least deprived 0
0
50% least deprived 0
50% least deprived 0
Number of LSOAs amongst
least deprived*Diocesan position National position
HEALTH DEPRIVATION AND
DISABILITY-0.4
Average
Score for
parishIMD Subdomains8 (2010)
INCOME
EMPLOYMENT
Number of LSOAs amongst
most deprived*
1%
0
Income Deprivation Affecting
Children Index0.1
CRIME AND DISORDER
LIVING ENVIRONMENT
Indoors Sub-domain
Outdoors Sub-domain
0
0
Geographical Barriers Sub-domain
28.6
10% most deprived
EDUCATION SKILLS AND TRAINING
BARRIERS TO HOUSING AND SERVICES10% most deprived
Wider Barriers Sub-domain
Children/Young People Sub-domain3.1 0 0
0
0
50% least deprived 50% least deprived
1
0
0
0
0
-1.2
050% most deprived
2.3
87.5
12.8
19.8
50.2
50% most deprived 50% most deprived
10% 1%
DEPRIVATION AND KEY ISSUES AFFECTING PARISHIONERSIt is important to note that these statistics are a measure of deprivation, not affluence, and to recognise that not every person in a highly deprived area will themselves be
deprived. Equally, there will be some deprived people living in the least deprived areas.
Deprivation covers a broad range of issues and refers to unmet needs caused by a lack of resources of all kinds, not just financial. The English Indices of Deprivation
attempt to measure a broader concept of multiple deprivation, made up of several distinct dimensions, or domains, of deprivation. Seven domains of deprivation are
combined to produce the overall Index of Multiple Deprivation. Each domain contains a number of component indicators. The English Indices of Deprivation are a
continuous measure of relative deprivation therefore there is no definitive point on the scale below which areas are considered to be deprived and above which they are
not. Deprived areas have been defined in this release as those containing LSOAs that are amongst the 10 per cent most deprived in England according to the overall Index
of Multiple Deprivation.
Overall IMD 0 000
5% 10%
13.3 50% most deprived
00
00 0
*There is 1 full or partial LSOA included in this parish
0 0
What are the particular issues that affect your parish? Are you doing anything to address these?
Income Deprivation Affecting Older
People Index
0
Research
&
Statistics

17
This spotlight has given you some information about your parish both in terms of your own church congregations and your local community. This is not an
end in itself, but rather a starting place for you to explore further. Questions to consider might include:
• What does our congregation look like?
• How does it compare to the local population?
• What other churches are there in the area? What parts of the community do they reach? Which parts of the community are being missed?
• What other local organisations or centres are there, that might bring people into our parish? Examples might be Hospitals or health centres, prisons, job
centres, homeless shelters, schools, charities, mother and toddler groups, uniformed organisations, community centres, libraries, shops, offices, stations?
How can we interact with these people?
• What areas of our parish do we know well or less well?
• How does the local community change between weekdays and weekends? How do our services and events fit with the shifting local population?
• Is our website/'A Church Near You' profile up to date?
• Are our records up to date?
****************************************************************************************************************************
What to do next?
Your notes
WHAT TO DO NEXT Research
&
Statistics

18
Sources of further information
Public Health Observatories - APHO JSNA Datasets (The datasets are intended to cover a
range of issues, focused on underlying determinants of health and conditions which account
for substantial numbers of preventable diseases and deaths.)
A Church Near You
www.achurchnearyou.com
UpMyStreet - UK house prices, property, crime, local neighbourhood & schools
London Street Gangs - Territory maps and background information
http://www.londonstreetgangs.com/
Hint: Scroll to the bottom of the "Gang Maps" page to see boundaries.
AboutMyArea - The local interactive site - news, reviews, what's on, events, businesses
Research & Statistics GIS
http://www.churchofengland.org/about-us/facts-stats/research-statistics/census-2011.aspx
Church Urban Fund
www.cuf.org.uk
Homeless Pages - Information, Research and Publications on homelessness
http://www.homelesspages.org.uk/
http://www.upmystreet.com/
Hint: Use the "My Neighbourhood" tab
The network of Public Health Observatories - Health Profiles
www.apho.org.uk/resource/view.aspx?RID=91736
The Poverty Site - Geographic Analysis
www.poverty.org.uk/summary/regional.shtml
http://www.apho.org.uk/default.aspx?QN=HP_FINDSEARCH2011
MurderMap - London Homicide Reported Direct from The Old Bailey
Police.uk - Local crime and policing information for England and Wales
http://www.police.uk/
ONS - Neighbourhood Statistics
http://www.aboutmyarea.co.uk/
http://neighbourhood.statistics.gov.uk/
Hint: Use the summary box
http://www.murdermap.co.uk/
Research
&
Statistics

19
Proportion of the population aged 60+ who are in receipt of the Guaranteed part of Pension Credit (August 2012)
Estimated using LSOA level data sourced from http://83.244.183.180/NESS/BEN/iben.htm
Proportion of the working age population who are in receipt of a key out-of-work benefit (Q3 2012)
Life Expectancy at birth (boys) (1999-2003)
Estimated using ward level data from ONS.
Life expectancy at birth (girls) (1999-2003)
Estimated using ward level data from ONS.
Percentage of Children under 16 in Poverty (2009)
Estimated using LSOA level data from http://www.hmrc.gov.uk/statistics/child-poverty-stats.htm
IMD (2010)
Methodology: Government data is published on government boundaries that do not match ecclesiastical boundaries. In order to produce parish population and demographic
estimates we have worked with the ONS to use a best fit modelling process. As such, these statistics can only be considered estimates and, particularly in very diverse areas, are
best used in the context of local knowledge. Where parish populations are sparse the figures for government areas overlapping the parish are used.
Parish estimates from the census have been calculated using the census output area data published by the ONS. These are provisional estimates, and when more granular data at
postcode level is available, will be revised. Estimates have been modelled by allocating the population weighted centroid of each output area to the parish within which it falls.
This means that some parishes have not been allocated population, however proportions for demographic variables have been calculated based on the output areas overlaying
the parish.
For further information about this process, please contact [email protected].
Contains public sector information licensed under the Open Government Licence v1.0 http://www.nationalarchives.gov.uk/doc/open-government-licence/
Estimated using OA level data sourced from ONS Census Data 2011, ONS
Estimated using OA level data sourced from ONS Census Data 2001, ONS
When analysing data, it is important to consider that some parishes are very small and proportions may be very large even where very few cases meet the criteria.
ABOUT THIS DATA
http://www.churchofengland.org/about-us/facts-stats/research-statistics/clergydiversityaudit2005linkpage.aspx
Estimated using OA level data from DWP Information, Governance and Security Directorate from
http://statistics.dwp.gov.uk/asd/asd1/tabtools/census_output_area_data/index.php?page=census_output_area_data
Annual parochial returns
ONS Census data 2011
ONS Census data 2001
2007 Church Diversity Survey
DWP
ONS
HMRC
Department for Communities and Local Government
1
2
3
4
5
6
7
8
These have been collected annually between 2007 and 2011 by the Research and Statistics team, Archbishops’ Council
When quoting figures derived from this data, care should be taken with the level of accuracy quoted.
Estimated using LSOA level data from Communities and Local Government, 2010.
https://www.gov.uk/government/uploads/system/uploads/attachment_data/file/6320/1870718.pdf
Research
&
Statistics

1
Getting to know your parish
What is this spotlight?
How should I use it?
Questions
Contents
This short spotlight brings together a range of information about your parish,
both in terms of your congregations, but also the wider community living in
your area. It covers areas such as Christian affiliation, population age and
ethnicity profiles, household structures, deprivation, employment, schools
and qualifications, alongside church statistics such as attendance and giving.
There is information at the end of the spotlight about where this data comes
from and how it was calculated. If you have any further queries then please
do contact the Research and Statistics team at
This spotlight is not an end in itself, but rather a starting place for you to
explore further. You may want to discuss it at a PCC meeting or with
leadership teams. We’ve included some questions on each page to help you
to think about the information, however some things will be of more
relevance in some areas than others, and these are just suggestions to get
you started. We’ve also included some bigger questions about what to do
next at the end of the spotlight on page 17. There’s space for you to write
some notes here. It might be helpful to write a short paragraph to
summarise your community profile or note down anything that has struck
you as particularly important. There are also details at the end for where
you can find further information should you want to dig a little deeper.
1. Summary: a brief overview of your parish, including what look to be 5 of
the most pressing social issues in your area
2. Age: age profile of your community
3. Ethnicity: ethnicity profile of your community
4. Integration: English language speaking and length of UK residency in your
community
5. Religious affiliation: religious affiliation in your community
6. Households: families, dependents, one person households, temporary
residents and housing tenure
7. Marital and civil partnership status
8. Employment: occupations, benefits and mobility in your community
9. Education: CofE schools and qualification levels in your community
10. Health: people with health problems and carers in your community
11. Deprivation: different types of deprivation in your community
Research
&
Statistics

2
Parishioners at glance
Finmere: St Michael
2011 Tax Efficient Planned
Giving/person/week1
2011 Electoral
Roll1
Ill-health/Disabilities
Deprivation
Local Amenities
83%
71%
Issues to look out for in your parish
£2
Annual Parochial Returns
Oct
ob
er W
eekl
y
Att
end
ance
1
0-4
5-15
2011 Parish
Share Paid1
31
PARISH OVERVIEW
17%
Parish
6%
15%
61%
Age Profile (20112)400
Proportion Christian
Sorry, no Fresh Expressions listed for this parish.Fresh Expressions
500
BICESTER & ISLIP
OXFORD
16-64
Age
Gro
up
Diocese
627039
Deanery
Archdeaconry
20013
20112
20013
20112
Included Churches
Oxford
Population
Housing Access
Parish of: Finmere
Parish Code: 270039
65 +
£7,200
Housing Conditions
Research
&
Statistics
0
50
100
150
200
250
2007 2008 2009 2010 2011
Highestweek
Average
LowestWeek
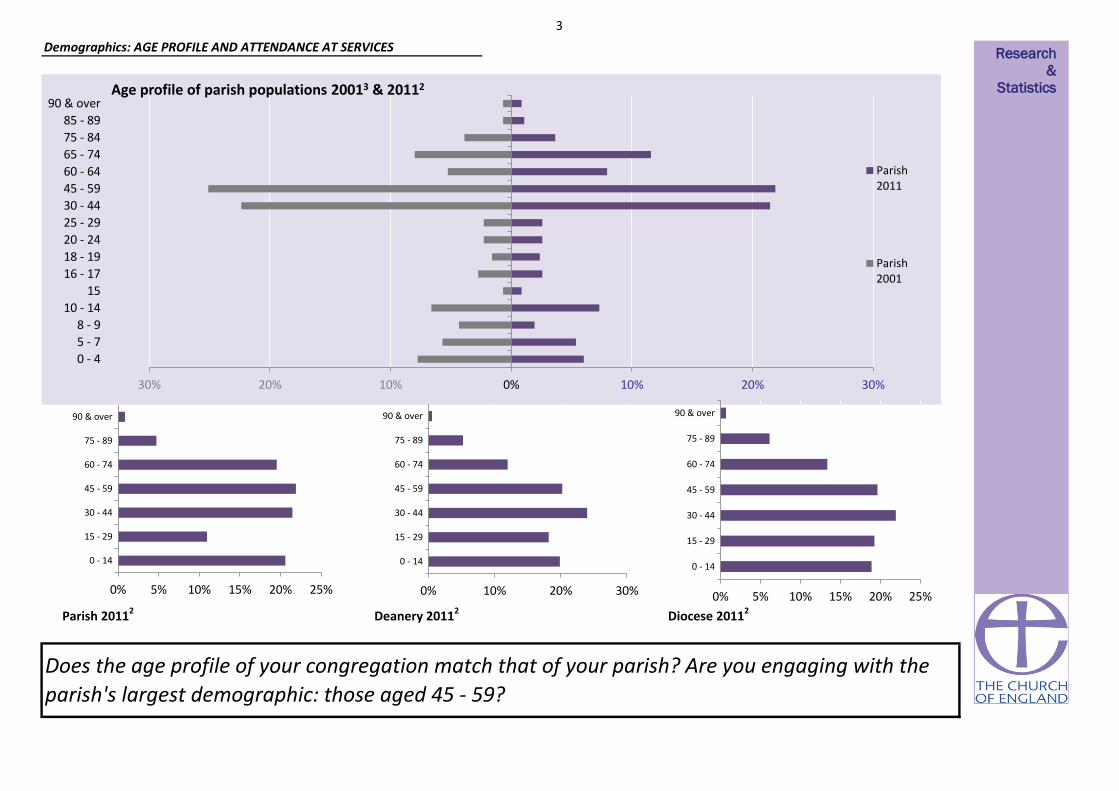
3
Parish 20112 Deanery 20112 Diocese 20112
Demographics: AGE PROFILE AND ATTENDANCE AT SERVICES
Does the age profile of your congregation match that of your parish? Are you engaging with the
parish's largest demographic: those aged 45 - 59?
30% 20% 10% 0% 10% 20% 30%
0 - 4
5 - 7
8 - 9
10 - 14
15
16 - 17
18 - 19
20 - 24
25 - 29
30 - 44
45 - 59
60 - 64
65 - 74
75 - 84
85 - 89
90 & overAge profile of parish populations 20013 & 20112
Parish2011
Parish2001
0% 5% 10% 15% 20% 25%
0 - 14
15 - 29
30 - 44
45 - 59
60 - 74
75 - 89
90 & over
0% 10% 20% 30%
0 - 14
15 - 29
30 - 44
45 - 59
60 - 74
75 - 89
90 & over
0% 5% 10% 15% 20% 25%
0 - 14
15 - 29
30 - 44
45 - 59
60 - 74
75 - 89
90 & over
Research
&
Statistics

4
15%
Diocesan Congregation4 (2007)
Parish Population2 (2011)
(nearest 50)
Demographics: AGE PROFILE AND ATTENDANCE AT SERVICES
Comparable Age profile of Adults
25%
65 +
40%
Age
50
50
18 - 44
22% 38%
300
100
0 - 4
5 - 15
16 - 64
Diocesan Core Congregation Age Profile4 (2007)
Diocesan Population2 (2011) 37%
45 - 64
Does the age profile of your congregation match that of your parish?
65 +
Infant Baptisms
20111
3
Highest Weeks
Attendance 20111
-
17
9%
13%
16%
22%
40%
0% 10% 20% 30% 40% 50%
Research
&
Statistics

5
Detailed Parish Ethnicity2 2011
Parish Ethnicity2 2011 Parish Ethnicity3 2001 Diocese Ethnicity2 2011
Arab Other Ethnic Group
0%0%
Indian Bangladeshi Chinese
African Caribbean
Parish
Percentage
ME: 3%
Other Asian
<1%
Does the ethnicity profile of your congregation match that of your parish? Are you engaging with the parish's
largest demographics: those describing themselves as White or Mixed/Multiple ethnic group?
<1%
3%
<1%1% 0%
0%
1%0%
Demographics: ETHNICITY
<1%
91%
Other White
3%
White & Asian Other Mixed
0%
0%
<1%
British
White & Black
Caribbean
Diocesan Population2 (2011)
Diocesan Core Congregation4 (aged 18+ only) (2007)
Percentage Minority Ethnic Background
15%
3%
Irish
Pakistani
0%
Other Black
Gypsy or Irish
Traveller
White & Black
African
Research
&
Statistics
White
Mixed/Multipleethnic group
Asian/Asian British
Black or BlackBritish
Other ethnicgroup

6
Cannot speak English well or cannot speak
English Can speak English well or very well
<1% 2%Have English as their main language (English or
Welsh if in Wales)
98%2Percentage of people who
Demographics: Integration
10 years or more
92%
2 years or more but less
than 5 years
Born in the UK
Less than 2 years
1% 1% 5%
5 years or more but less
than 10 years
Are services in your parish accessible to all residents? Do you offer any services in foreign
languages? What can you offer those who may not have been in the UK for long?
2Resident in UK:
1%
Research
&
Statistics

7
In your parish 71% of the population (that is 400 people) declared themselves as Christian in 2011
101
Statistics from the Annual
Parochial Returns 2011
Easter Communicants1
Easter Day Attendance1
Christmas Communicants1
Christmas Attendance1
Christians in your Parish
RELIGIOUS AFFILIATION
24
25
39
How has the religious affiliation of those living in your parish changed over the past decade? How closely does
it match that of the Diocese as a whole? Are Christians in your parish engaging with your churches? How are
you engaging with other faith groups?
0% 10% 20% 30% 40% 50% 60% 70% 80% 90% 100%
Parish 2001
Parish 2011
Diocese 2011
Christian Buddhist Hindu Jewish Muslim Sikh Other religions No religion Religion not stated
2
3
National Average Percentage Christian2 (59.4%)
Research
&
Statistics
2
2

8
Household Spaces2 2011
With at least one usual resident i.e. not vacant 97%
0%Caravan or other mobile or temporary structure
150 <50 <50
Who lives in your parish? Are there issues with access to housing? How permenant are your
parishioners?
Tenure2
Social rented as a percentage of all households2 5%
Social Rented householdsOwner occupied households
(including shared ownership)
Private Rented households
(including those living rent free)
HOUSEHOLDS, LIFESTYLE AND THE COMMUNITY I Research
&
Statistics

9
Household composition in your parish2 All
percentages are of the total number of
households with residents. The smaller pie
charts show the breakdown of a section of
the larger ones. You can use the colours to
match.
Lone Parent
Households as a
percentage of all
households with
children2
2%
Who lives in your parish? Are there a lot of households with children? What about lone parent
households? Are there a lot of people living alone?
HOUSEHOLDS, LIFESTYLE AND THE COMMUNITY II
Aged 65 and over 9%
Other 7%
One Person 16%
One family 79%
Other households
5%
Dependent children <1%
All aged 65 and over
<1%
Other 4%
Aged 65 and over 10%
Married or same-sex civil partnership couple 57%
Cohabiting couple 10%
Lone parent 2%
No children 24%
Dependent children 28%
Non-dependent children 5%
No children 6%
Dependent children 5%
Dependent children <1%
Non-dependent children 1%
Research
&
Statistics

10
Weddings & Blessings in 2010
Weddings & Blessings in 20114 No
Your Parish Churches held1
Do you hold many weddings in your parish? How is your parish supporting those in the above
categories?
No No
Marital and civil partnership status
80% 60% 40% 20% 0% 20% 40% 60% 80%
Living in a couple: Married or in a registered same-sex civil partnership
Living in a couple: Cohabiting
Not living in a couple: Single (never married or never registered a same-sex civilpartnership)
Not living in a couple: Married or in a registered same-sex civil partnership
Not living in a couple: Separated (but still legally married or still legally in a same-sexcivil partnership)
Not living in a couple: Divorced or formerly in a same-sex civil partnership which isnow legally dissolved
Not living in a couple: Widowed or surviving partner from a same-sex civilpartnership
2001 2011
Research
&
Statistics 2 3
11
£5
£1,062
£3
£40,109
£9,293
£5,450
Parish Expenditure1
TEPG/PERSON/WEEK1
Other/person/week1Other planned giving1
How are your parish finances? How does this compare to your community profile?
£1,294
£12,209
EMPLOYMENT AND SOCIAL GRADE, LIFESTYLE
The National Statistics Socio-economic Classification (NS-SeC) is an occupationally
based classification but has rules to provide coverage of the whole adult population.
The NS-SeC provides an indication of socio-economic position based on occupation.
It is an Office for National Statistics standard classification. To assign a person aged
16 to 74 to an NS-SeC category their occupation title is combined with information
about their employment status, whether they are employed or self-employed and
whether or not they supervise other employees. Full-time students are recorded in
the' full-time students' category regardless of whether they are economically active
or not.Parish Share Assessed1
Parish Share Paid1
£962
£4
£13,502
£10,170
£7,200
£2
£2,121Tax Efficient Planned Giving (TEPG)1
Finance Returns 2010
NS-SeC of Household Reference Person2
£25,683Parish Income12011
Research
&
Statistics
0% 5% 10% 15% 20% 25% 30%
Higher managerial, administrative and professional occupations
Lower managerial, administrative and professional occupations
Intermediate occupations
Small employers and own account workers
Lower supervisory and technical occupations
Semi-routine occupations
Routine occupations
Never worked and long-term unemployed
Not classified (Full-time students or not classifiable for other reasons)
12
4%
96%
Households
1%
EMPLOYMENT AND SOCIAL GRADE, LIFESTYLE
How much free time do residents of your parish have? How accessible are your churches to those
with/without cars?
Access to at least 1 car or van
Household Mobility2
Proportion of population aged 60+ who are in
receipt of the Guaranteed part of Pension
Credit5
5%
Proportion of working age persons (16-74) with
no qualifications2 13%
Proportion of working age population who are
in receipt of a key out-of-work benefit5
No access to a car or van
Part-time: 15 hours or less
worked 10%
Part-time: 16 to 30 hours worked
20%
Full-time: 31 to 48 hours worked
48%
Full-time: 49 or more hours
worked 22%
Hours Worked2
Part-time: 15 hours or less worked Part-time: 16 to 30 hours worked
Full-time: 31 to 48 hours worked Full-time: 49 or more hours worked
Research
&
Statistics
13
Church Schools in the parish
FINMERE CE PRIMARY SCHOOL
Parish2 2011 (proportion of 16+ population) National2 2011 (proportion of 16+ population)
EDUCATION AND SCHOOLS
How qualified are residents of your parish? What Church of England schools are available?
12%
10%
19%
3% 11%
44%
2%
22%
13%
15% 4%
12%
27%
6% No qualifications (No formal qualifications)
Level 1 qualifications (1-4 GCSEs or equivalent)
Level 2 qualifications (5 GCSEs or equivalent)
Apprenticeships
Level 3 qualifications (2 or more A-levels orequivalent )
Level 4 qualifications and above (Bachelorsdegree or equivalent, and higher qualifications)
Other qualifications (including foreignqualifications)
Research
&
Statistics
14
Hours per week of provision of unpaid care2
1% 2%
Very bad health Bad health Fair health
1 - 19
Are there people in your parish with health problems? Is there anything you can do to assist with
day-to-day activities of those who have health problems?
HEALTH
0
Long-term health problem or disability2
50 +89% 7%
Good health Very good health
1%
Day-to-day activities limited a lot Day-to-day activities limited a little Day-to-day activities not limited
6% 6% 88%
4% 8% 29% 58%
General health2
20 - 49
Research
&
Statistics

15
You parish can be categorised as in the most or least deprived 10% or 50% of all parishes within the diocese and of all parishes nationally
50% least deprived 50% least deprived
Life expectancy at birth (girls)6 (1999-2003)
Life Expectancy at birth (boys)6 (1999-2003)
5%
10.6
10% least deprived5% 10% least deprived
50% least deprivedPercentage of Children under 16 in Poverty7 (2010)
Percentage of working age persons (16-74) with no
qualifications2 (2011)
10% least deprived
Life expectancy at birth can give an idea of overall quality of life. Life expectancy is an average. Women tend to have greater life expectancy. Life expectany can be affected by family history, marital status, economic status,
physique, exercise, diet, drug use including smoking and alcohol consumption, disposition, education, environment, sleep, climate, and health care.
Proportion of the population aged 60+ who are in receipt of
the Guaranteed part of Pension Credit5 (2012)
6%
Social rented as a percentage of all households2 (2011)
Index of Multiple Deprivation (IMD)8 (2010)
Proportion of the working age population who are in receipt
of a key out-of-work benefit5 (2012)
Lone Parent Households as a percentage of all households
with children2 (2011)
Pension Credit is an income related benefit made up of 2 parts - Guarantee Credit and Savings Credit. The guaranteed part tops up weekly income if it’s below £142.70 (single people) or £217.90 (couples) so those who
receive this are on a low income. This statistic only covers people living in private households, and not residential institutions (such as nursing homes).
10% least deprived
The proportion of children in families in receipr of either out of work benefits or tax credits where their reported income is less than 60% median income. Poor children may be excluded from participating in society. They may be unable to afford school
trips and activities; school uniforms or warm winter clothes, be unable to go swimming, have friends round for tea or celebrate their birthdays. Many will never have a holiday. Children who grow up poor are more likely to leave school without
qualifications, have lower employment chances, thus restricting their ability to get a good job and financially contribute to society.
50% least deprived
13% 50% least deprived
DEPRIVATION AND KEY ISSUES AFFECTING PARISHIONERS
Score
79
10% least deprived88
1%
Deprivation is considered to be a multi-dimensional problem, encompassing a range of domains such as financial, health, education, services or crime. continuous measure of relative deprivation therefore there is no definitive point on the scale below
which areas are considered to be deprived and above which they are not.While being in the most deprived 10% may indicate financial disadvantage, it could equally be due to isolated living.
Number of people aged 16 to State Pension age claiming: Jobseeker’s Allowance (JSA), Employment and Support Allowance (ESA), Incapacity Benefit (IB), Income Support (IS) (as a lone parent or in the “other” category),
Other income related benefits.
Social housing is housing that is let at low rents and on a secure basis to people in housing need. It is generally provided by councils and not-for-profit organisations such as housing associations. Vulnerable groups are often
concentrated in the social housing sector, with low rates of employment and low income levels
Children in single parent families have a much higher risk of living in poverty than children in couple families. Single parents may rely on informal childcare.
What are the particular issues that affect your parish? Are you doing anything to address these?
10% least deprived
Deprivation Indicator Diocesan Position National Position
A low-level of skill or educational attainment is one indicator of social disadvantage. Qualifications may make it easier to find employment. Learning also helps promote active citizenship and combat social exclusion.
2%
50% least deprived
50% least deprived
10% least deprived
50% most deprived
50% least deprived
10% least deprived
10% least deprived
Research
&
Statistics

16
0
0.1 50% least deprived 0
0
1
50% least deprived
50% most deprived
50% most deprived
50% least deprived
50% most deprived
50% most deprived
0 0 0
50% least deprived
50% least deprived 10% least deprived
10 0
0
0
0
0
0
50% least deprived
10% most deprived
50% least deprived
50% most deprived
50% most deprived
50% least deprived
10% least deprived
10% least deprived
0 0 0
0Skills Sub-domain 3.5
0
0
0
0
00 0
0
0
0
0
0
1
0
0
0
0
0 0
1
0 0
0
0
0
1
0
0
0
0
1
0
0.0
0.0
5%
0 0
10050% least deprived
0
0
0
0
0
0
0
2.9
1
10% least deprived
50% least deprived
0
00
10% least deprived 0
0
50% least deprived 0
50% least deprived 0
Number of LSOAs amongst
least deprived*Diocesan position National position
HEALTH DEPRIVATION AND
DISABILITY-1.0
Average
Score for
parishIMD Subdomains8 (2010)
INCOME
EMPLOYMENT
Number of LSOAs amongst
most deprived*
1%
0
Income Deprivation Affecting
Children Index0.0
CRIME AND DISORDER
LIVING ENVIRONMENT
Indoors Sub-domain
Outdoors Sub-domain
0
0
Geographical Barriers Sub-domain
36.1
50% most deprived
EDUCATION SKILLS AND TRAINING
BARRIERS TO HOUSING AND SERVICES10% most deprived
Wider Barriers Sub-domain
Children/Young People Sub-domain2.3 0 0
0
0
50% least deprived 10% least deprived
0
0
0
0
0
-1.3
010% most deprived
1.1
80.0
11.9
24.4
46.0
50% most deprived 50% least deprived
10% 1%
DEPRIVATION AND KEY ISSUES AFFECTING PARISHIONERSIt is important to note that these statistics are a measure of deprivation, not affluence, and to recognise that not every person in a highly deprived area will themselves be
deprived. Equally, there will be some deprived people living in the least deprived areas.
Deprivation covers a broad range of issues and refers to unmet needs caused by a lack of resources of all kinds, not just financial. The English Indices of Deprivation
attempt to measure a broader concept of multiple deprivation, made up of several distinct dimensions, or domains, of deprivation. Seven domains of deprivation are
combined to produce the overall Index of Multiple Deprivation. Each domain contains a number of component indicators. The English Indices of Deprivation are a
continuous measure of relative deprivation therefore there is no definitive point on the scale below which areas are considered to be deprived and above which they are
not. Deprived areas have been defined in this release as those containing LSOAs that are amongst the 10 per cent most deprived in England according to the overall Index
of Multiple Deprivation.
Overall IMD 0 000
5% 10%
10.6 50% most deprived
00
00 0
*There is 1 full or partial LSOA included in this parish
0 0
What are the particular issues that affect your parish? Are you doing anything to address these?
Income Deprivation Affecting Older
People Index
0
Research
&
Statistics

17
This spotlight has given you some information about your parish both in terms of your own church congregations and your local community. This is not an
end in itself, but rather a starting place for you to explore further. Questions to consider might include:
• What does our congregation look like?
• How does it compare to the local population?
• What other churches are there in the area? What parts of the community do they reach? Which parts of the community are being missed?
• What other local organisations or centres are there, that might bring people into our parish? Examples might be Hospitals or health centres, prisons, job
centres, homeless shelters, schools, charities, mother and toddler groups, uniformed organisations, community centres, libraries, shops, offices, stations?
How can we interact with these people?
• What areas of our parish do we know well or less well?
• How does the local community change between weekdays and weekends? How do our services and events fit with the shifting local population?
• Is our website/'A Church Near You' profile up to date?
• Are our records up to date?
****************************************************************************************************************************
What to do next?
Your notes
WHAT TO DO NEXT Research
&
Statistics

18
Sources of further information
Public Health Observatories - APHO JSNA Datasets (The datasets are intended to cover a
range of issues, focused on underlying determinants of health and conditions which account
for substantial numbers of preventable diseases and deaths.)
A Church Near You
www.achurchnearyou.com
UpMyStreet - UK house prices, property, crime, local neighbourhood & schools
London Street Gangs - Territory maps and background information
http://www.londonstreetgangs.com/
Hint: Scroll to the bottom of the "Gang Maps" page to see boundaries.
AboutMyArea - The local interactive site - news, reviews, what's on, events, businesses
Research & Statistics GIS
http://www.churchofengland.org/about-us/facts-stats/research-statistics/census-2011.aspx
Church Urban Fund
www.cuf.org.uk
Homeless Pages - Information, Research and Publications on homelessness
http://www.homelesspages.org.uk/
http://www.upmystreet.com/
Hint: Use the "My Neighbourhood" tab
The network of Public Health Observatories - Health Profiles
www.apho.org.uk/resource/view.aspx?RID=91736
The Poverty Site - Geographic Analysis
www.poverty.org.uk/summary/regional.shtml
http://www.apho.org.uk/default.aspx?QN=HP_FINDSEARCH2011
MurderMap - London Homicide Reported Direct from The Old Bailey
Police.uk - Local crime and policing information for England and Wales
http://www.police.uk/
ONS - Neighbourhood Statistics
http://www.aboutmyarea.co.uk/
http://neighbourhood.statistics.gov.uk/
Hint: Use the summary box
http://www.murdermap.co.uk/
Research
&
Statistics

19
Proportion of the population aged 60+ who are in receipt of the Guaranteed part of Pension Credit (August 2012)
Estimated using LSOA level data sourced from http://83.244.183.180/NESS/BEN/iben.htm
Proportion of the working age population who are in receipt of a key out-of-work benefit (Q3 2012)
Life Expectancy at birth (boys) (1999-2003)
Estimated using ward level data from ONS.
Life expectancy at birth (girls) (1999-2003)
Estimated using ward level data from ONS.
Percentage of Children under 16 in Poverty (2009)
Estimated using LSOA level data from http://www.hmrc.gov.uk/statistics/child-poverty-stats.htm
IMD (2010)
Methodology: Government data is published on government boundaries that do not match ecclesiastical boundaries. In order to produce parish population and demographic
estimates we have worked with the ONS to use a best fit modelling process. As such, these statistics can only be considered estimates and, particularly in very diverse areas, are
best used in the context of local knowledge. Where parish populations are sparse the figures for government areas overlapping the parish are used.
Parish estimates from the census have been calculated using the census output area data published by the ONS. These are provisional estimates, and when more granular data at
postcode level is available, will be revised. Estimates have been modelled by allocating the population weighted centroid of each output area to the parish within which it falls.
This means that some parishes have not been allocated population, however proportions for demographic variables have been calculated based on the output areas overlaying
the parish.
For further information about this process, please contact [email protected].
Contains public sector information licensed under the Open Government Licence v1.0 http://www.nationalarchives.gov.uk/doc/open-government-licence/
Estimated using OA level data sourced from ONS Census Data 2011, ONS
Estimated using OA level data sourced from ONS Census Data 2001, ONS
When analysing data, it is important to consider that some parishes are very small and proportions may be very large even where very few cases meet the criteria.
ABOUT THIS DATA
http://www.churchofengland.org/about-us/facts-stats/research-statistics/clergydiversityaudit2005linkpage.aspx
Estimated using OA level data from DWP Information, Governance and Security Directorate from
http://statistics.dwp.gov.uk/asd/asd1/tabtools/census_output_area_data/index.php?page=census_output_area_data
Annual parochial returns
ONS Census data 2011
ONS Census data 2001
2007 Church Diversity Survey
DWP
ONS
HMRC
Department for Communities and Local Government
1
2
3
4
5
6
7
8
These have been collected annually between 2007 and 2011 by the Research and Statistics team, Archbishops’ Council
When quoting figures derived from this data, care should be taken with the level of accuracy quoted.
Estimated using LSOA level data from Communities and Local Government, 2010.
https://www.gov.uk/government/uploads/system/uploads/attachment_data/file/6320/1870718.pdf
Research
&
Statistics

1
Getting to know your parish
What is this spotlight?
How should I use it?
Questions
Contents
This short spotlight brings together a range of information about your parish,
both in terms of your congregations, but also the wider community living in
your area. It covers areas such as Christian affiliation, population age and
ethnicity profiles, household structures, deprivation, employment, schools
and qualifications, alongside church statistics such as attendance and giving.
There is information at the end of the spotlight about where this data comes
from and how it was calculated. If you have any further queries then please
do contact the Research and Statistics team at
This spotlight is not an end in itself, but rather a starting place for you to
explore further. You may want to discuss it at a PCC meeting or with
leadership teams. We’ve included some questions on each page to help you
to think about the information, however some things will be of more
relevance in some areas than others, and these are just suggestions to get
you started. We’ve also included some bigger questions about what to do
next at the end of the spotlight on page 17. There’s space for you to write
some notes here. It might be helpful to write a short paragraph to
summarise your community profile or note down anything that has struck
you as particularly important. There are also details at the end for where
you can find further information should you want to dig a little deeper.
1. Summary: a brief overview of your parish, including what look to be 5 of
the most pressing social issues in your area
2. Age: age profile of your community
3. Ethnicity: ethnicity profile of your community
4. Integration: English language speaking and length of UK residency in your
community
5. Religious affiliation: religious affiliation in your community
6. Households: families, dependents, one person households, temporary
residents and housing tenure
7. Marital and civil partnership status
8. Employment: occupations, benefits and mobility in your community
9. Education: CofE schools and qualification levels in your community
10. Health: people with health problems and carers in your community
11. Deprivation: different types of deprivation in your community
Research
&
Statistics

2
Parishioners at glance
Fringford: St Michael
2011 Tax Efficient Planned
Giving/person/week1
2011 Electoral
Roll1
Housing Access
Housing Conditions
Local Amenities
79%
69%
Issues to look out for in your parish
£5
Annual Parochial Returns
Oct
ob
er W
eekl
y
Att
end
ance
1
0-4
5-15
2011 Parish
Share Paid1
23
PARISH OVERVIEW
15%
Parish
4%
14%
67%
Age Profile (20112)600
Proportion Christian
Sorry, no Fresh Expressions listed for this parish.Fresh Expressions
600
BICESTER & ISLIP
OXFORD
16-64
Age
Gro
up
Diocese
627040
Deanery
Archdeaconry
20013
20112
20013
20112
Included Churches
Oxford
Population
Housing Costs
Parish of: Fringford
Parish Code: 270040
65 +
£4,569
Elderly Deprivation
Research
&
Statistics
0
10
20
30
40
50
60
2007 2008 2009 2010 2011
Highestweek
Average
LowestWeek

3
Parish 20112 Deanery 20112 Diocese 20112
Demographics: AGE PROFILE AND ATTENDANCE AT SERVICES
Does the age profile of your congregation match that of your parish? Are you engaging with the
parish's largest demographic: those aged 45 - 59?
40% 30% 20% 10% 0% 10% 20% 30% 40%
0 - 4
5 - 7
8 - 9
10 - 14
15
16 - 17
18 - 19
20 - 24
25 - 29
30 - 44
45 - 59
60 - 64
65 - 74
75 - 84
85 - 89
90 & overAge profile of parish populations 20013 & 20112
Parish2011
Parish2001
0% 10% 20% 30% 40%
0 - 14
15 - 29
30 - 44
45 - 59
60 - 74
75 - 89
90 & over
0% 10% 20% 30%
0 - 14
15 - 29
30 - 44
45 - 59
60 - 74
75 - 89
90 & over
0% 5% 10% 15% 20% 25%
0 - 14
15 - 29
30 - 44
45 - 59
60 - 74
75 - 89
90 & over
Research
&
Statistics

4
15%
Diocesan Congregation4 (2007)
Parish Population2 (2011)
(nearest 50)
Demographics: AGE PROFILE AND ATTENDANCE AT SERVICES
Comparable Age profile of Adults
25%
65 +
40%
Age
-
100
18 - 44
22% 38%
400
100
0 - 4
5 - 15
16 - 64
Diocesan Core Congregation Age Profile4 (2007)
Diocesan Population2 (2011) 37%
45 - 64
Does the age profile of your congregation match that of your parish?
65 +
Infant Baptisms
20111
2
Highest Weeks
Attendance 20111
4
15
9%
13%
16%
22%
40%
0% 10% 20% 30% 40% 50%
Research
&
Statistics

5
Detailed Parish Ethnicity2 2011
Parish Ethnicity2 2011 Parish Ethnicity3 2001 Diocese Ethnicity2 2011
Arab Other Ethnic Group
<1%0%
Indian Bangladeshi Chinese
African Caribbean
Parish
Percentage
ME: 2%
Other Asian
<1%
Does the ethnicity profile of your congregation match that of your parish? Are you engaging with the parish's
largest demographics: those describing themselves as White or Asian/Asian British?
<1%
3%
1%<1% 0%
0%
0%0%
Demographics: ETHNICITY
0%
95%
Other White
3%
White & Asian Other Mixed
<1%
0%
0%
British
White & Black
Caribbean
Diocesan Population2 (2011)
Diocesan Core Congregation4 (aged 18+ only) (2007)
Percentage Minority Ethnic Background
15%
<1%
Irish
Pakistani
0%
Other Black
Gypsy or Irish
Traveller
White & Black
African
Research
&
Statistics
White
Mixed/Multipleethnic group
Asian/Asian British
Black or BlackBritish
Other ethnicgroup

6
Cannot speak English well or cannot speak
English Can speak English well or very well
0% 1%Have English as their main language (English or
Welsh if in Wales)
99%2Percentage of people who
Demographics: Integration
10 years or more
94%
2 years or more but less
than 5 years
Born in the UK
Less than 2 years
1% <1% 4%
5 years or more but less
than 10 years
Are services in your parish accessible to all residents? Do you offer any services in foreign
languages? What can you offer those who may not have been in the UK for long?
2Resident in UK:
1%
Research
&
Statistics

7
In your parish 69% of the population (that is 500 people) declared themselves as Christian in 2011
72
Statistics from the Annual
Parochial Returns 2011
Easter Communicants1
Easter Day Attendance1
Christmas Communicants1
Christmas Attendance1
Christians in your Parish
RELIGIOUS AFFILIATION
15
30
24
How has the religious affiliation of those living in your parish changed over the past decade? How closely does
it match that of the Diocese as a whole? Are Christians in your parish engaging with your churches? How are
you engaging with other faith groups?
0% 10% 20% 30% 40% 50% 60% 70% 80% 90% 100%
Parish 2001
Parish 2011
Diocese 2011
Christian Buddhist Hindu Jewish Muslim Sikh Other religions No religion Religion not stated
2
3
National Average Percentage Christian2 (59.4%)
Research
&
Statistics
2
2

8
Household Spaces2 2011
With at least one usual resident i.e. not vacant 98%
0%Caravan or other mobile or temporary structure
200 <50 <50
Who lives in your parish? Are there issues with access to housing? How permenant are your
parishioners?
Tenure2
Social rented as a percentage of all households2 13%
Social Rented householdsOwner occupied households
(including shared ownership)
Private Rented households
(including those living rent free)
HOUSEHOLDS, LIFESTYLE AND THE COMMUNITY I Research
&
Statistics

9
Household composition in your parish2 All
percentages are of the total number of
households with residents. The smaller pie
charts show the breakdown of a section of
the larger ones. You can use the colours to
match.
Lone Parent
Households as a
percentage of all
households with
children2
11%
Who lives in your parish? Are there a lot of households with children? What about lone parent
households? Are there a lot of people living alone?
HOUSEHOLDS, LIFESTYLE AND THE COMMUNITY II
Aged 65 and over 10%
Other 16%
One Person 26%
One family 70%
Other households
4%
Dependent children 2%
All aged 65 and over
<1%
Other 2%
Aged 65 and over 7%
Married or same-sex civil partnership couple 45%
Cohabiting couple 11%
Lone parent 7%
No children 18%
Dependent children 21%
Non-dependent children 6%
No children 6%
Dependent children 4%
Non-dependent
children <1%
Dependent children 3%
Non-dependent children 4%
Research
&
Statistics
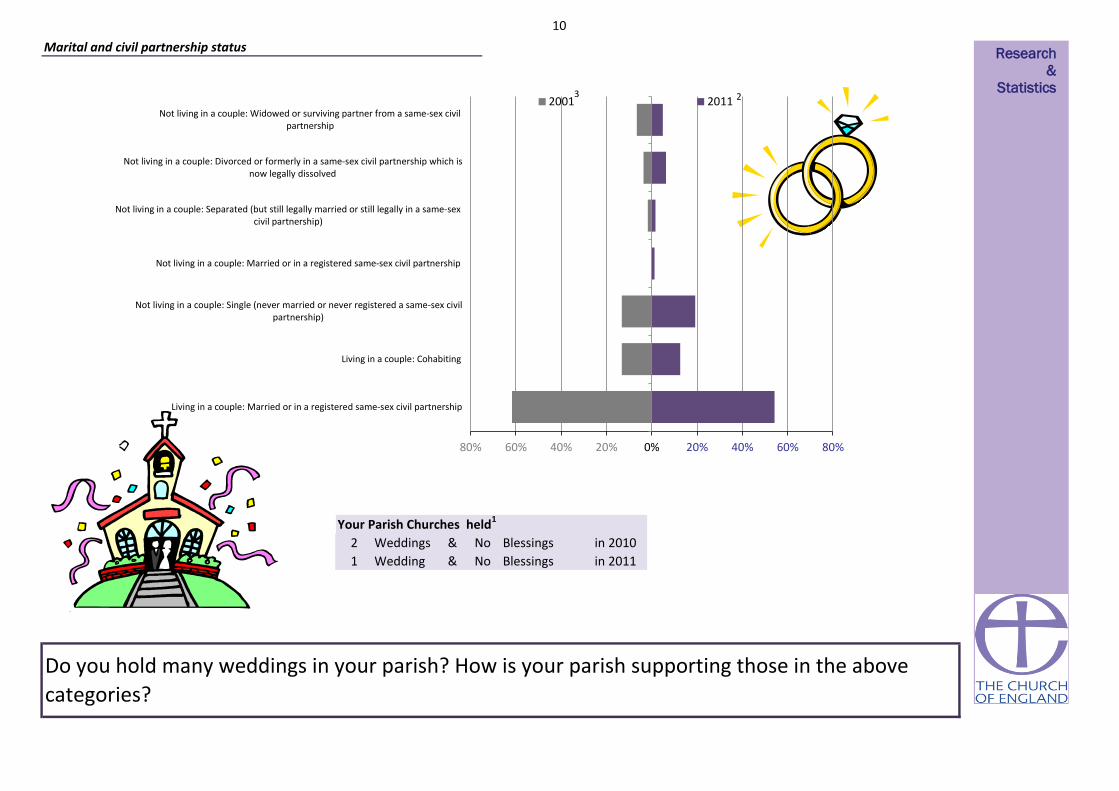
10
Weddings & Blessings in 2010
Wedding & Blessings in 20111 No
Your Parish Churches held1
Do you hold many weddings in your parish? How is your parish supporting those in the above
categories?
2 No
Marital and civil partnership status
80% 60% 40% 20% 0% 20% 40% 60% 80%
Living in a couple: Married or in a registered same-sex civil partnership
Living in a couple: Cohabiting
Not living in a couple: Single (never married or never registered a same-sex civilpartnership)
Not living in a couple: Married or in a registered same-sex civil partnership
Not living in a couple: Separated (but still legally married or still legally in a same-sexcivil partnership)
Not living in a couple: Divorced or formerly in a same-sex civil partnership which isnow legally dissolved
Not living in a couple: Widowed or surviving partner from a same-sex civilpartnership
2001 2011
Research
&
Statistics 2 3

11
£5
£0
£0
£28,720
£8,557
£8,557
Parish Expenditure1
TEPG/PERSON/WEEK1
Other/person/week1Other planned giving1
How are your parish finances? How does this compare to your community profile?
£5,572
£21,860
EMPLOYMENT AND SOCIAL GRADE, LIFESTYLE
The National Statistics Socio-economic Classification (NS-SeC) is an occupationally
based classification but has rules to provide coverage of the whole adult population.
The NS-SeC provides an indication of socio-economic position based on occupation.
It is an Office for National Statistics standard classification. To assign a person aged
16 to 74 to an NS-SeC category their occupation title is combined with information
about their employment status, whether they are employed or self-employed and
whether or not they supervise other employees. Full-time students are recorded in
the' full-time students' category regardless of whether they are economically active
or not.Parish Share Assessed1
Parish Share Paid1
£0
£0
£14,716
£9,391
£4,569
£5
£5,185Tax Efficient Planned Giving (TEPG)1
Finance Returns 2010
NS-SeC of Household Reference Person2
£27,871Parish Income12011
Research
&
Statistics
0% 5% 10% 15% 20% 25% 30% 35%
Higher managerial, administrative and professional occupations
Lower managerial, administrative and professional occupations
Intermediate occupations
Small employers and own account workers
Lower supervisory and technical occupations
Semi-routine occupations
Routine occupations
Never worked and long-term unemployed
Not classified (Full-time students or not classifiable for other reasons)

12
5%
95%
Households
3%
EMPLOYMENT AND SOCIAL GRADE, LIFESTYLE
How much free time do residents of your parish have? How accessible are your churches to those
with/without cars?
Access to at least 1 car or van
Household Mobility2
Proportion of population aged 60+ who are in
receipt of the Guaranteed part of Pension
Credit5
13%
Proportion of working age persons (16-74) with
no qualifications2 15%
Proportion of working age population who are
in receipt of a key out-of-work benefit5
No access to a car or van
Part-time: 15 hours or less
worked 13%
Part-time: 16 to 30 hours
worked 14%
Full-time: 31 to 48 hours worked
53%
Full-time: 49 or more hours
worked 20%
Hours Worked2
Part-time: 15 hours or less worked Part-time: 16 to 30 hours worked
Full-time: 31 to 48 hours worked Full-time: 49 or more hours worked
Research
&
Statistics

13
Church Schools in the parish
FRINGFORD CE PRIMARY SCHOOL
Parish2 2011 (proportion of 16+ population) National2 2011 (proportion of 16+ population)
EDUCATION AND SCHOOLS
How qualified are residents of your parish? What Church of England schools are available?
14%
13%
15%
3% 10%
41%
3%
22%
13%
15% 4%
12%
27%
6% No qualifications (No formal qualifications)
Level 1 qualifications (1-4 GCSEs or equivalent)
Level 2 qualifications (5 GCSEs or equivalent)
Apprenticeships
Level 3 qualifications (2 or more A-levels orequivalent )
Level 4 qualifications and above (Bachelorsdegree or equivalent, and higher qualifications)
Other qualifications (including foreignqualifications)
Research
&
Statistics
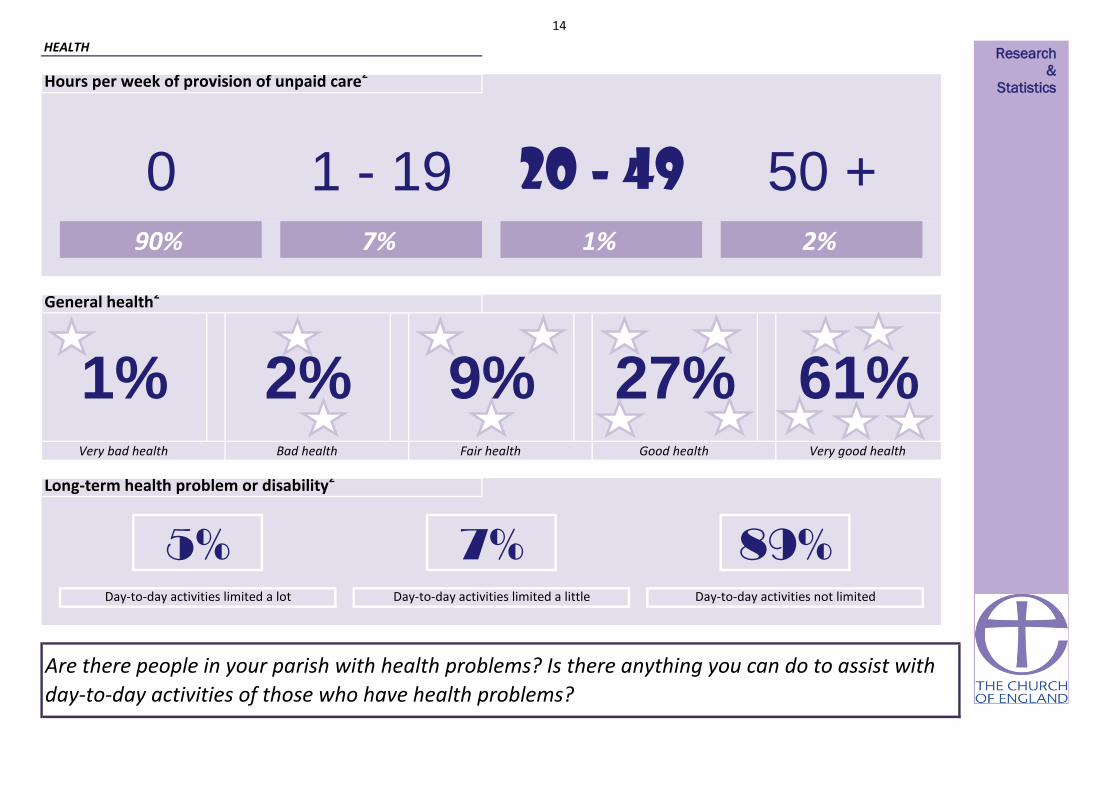
14
Hours per week of provision of unpaid care2
1% 2%
Very bad health Bad health Fair health
1 - 19
Are there people in your parish with health problems? Is there anything you can do to assist with
day-to-day activities of those who have health problems?
HEALTH
0
Long-term health problem or disability2
50 +90% 7%
Good health Very good health
1%
Day-to-day activities limited a lot Day-to-day activities limited a little Day-to-day activities not limited
5% 7% 89%
2% 9% 27% 61%
General health2
20 - 49
Research
&
Statistics
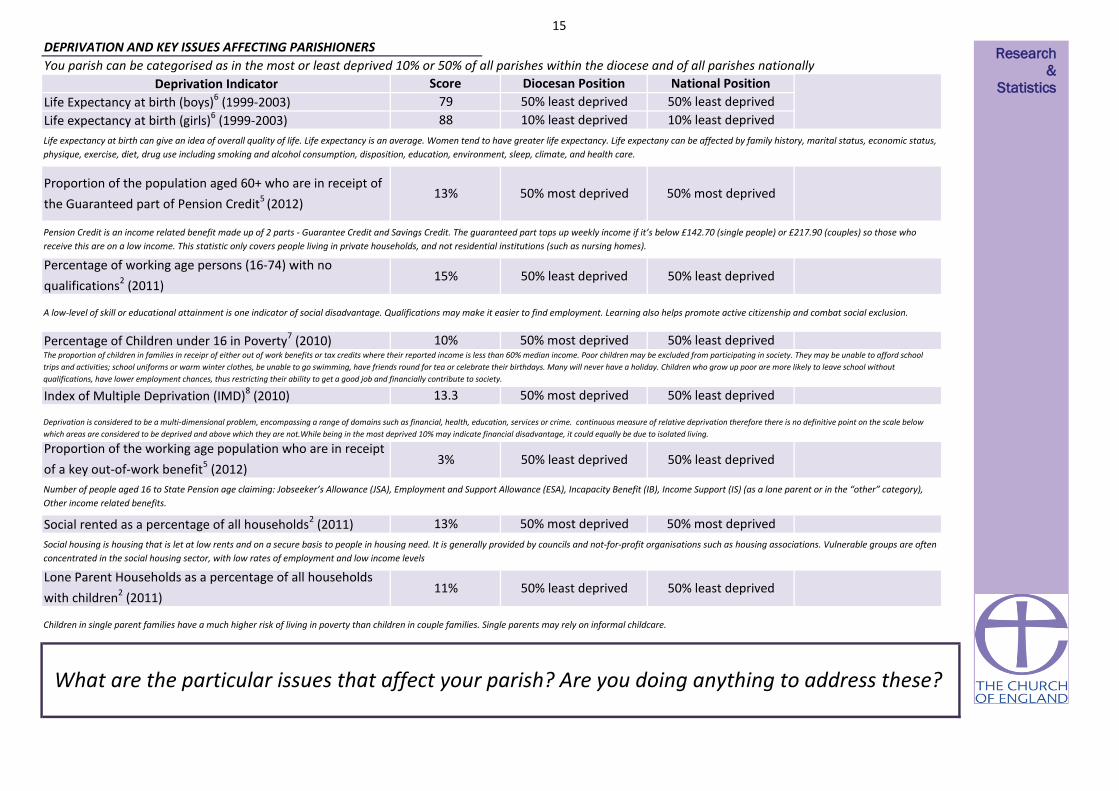
15
You parish can be categorised as in the most or least deprived 10% or 50% of all parishes within the diocese and of all parishes nationally
50% least deprived 50% least deprived
Life expectancy at birth (girls)6 (1999-2003)
Life Expectancy at birth (boys)6 (1999-2003)
13%
13.3
50% most deprived13% 50% most deprived
50% most deprivedPercentage of Children under 16 in Poverty7 (2010)
Percentage of working age persons (16-74) with no
qualifications2 (2011)
10% least deprived
Life expectancy at birth can give an idea of overall quality of life. Life expectancy is an average. Women tend to have greater life expectancy. Life expectany can be affected by family history, marital status, economic status,
physique, exercise, diet, drug use including smoking and alcohol consumption, disposition, education, environment, sleep, climate, and health care.
Proportion of the population aged 60+ who are in receipt of
the Guaranteed part of Pension Credit5 (2012)
10%
Social rented as a percentage of all households2 (2011)
Index of Multiple Deprivation (IMD)8 (2010)
Proportion of the working age population who are in receipt
of a key out-of-work benefit5 (2012)
Lone Parent Households as a percentage of all households
with children2 (2011)
Pension Credit is an income related benefit made up of 2 parts - Guarantee Credit and Savings Credit. The guaranteed part tops up weekly income if it’s below £142.70 (single people) or £217.90 (couples) so those who
receive this are on a low income. This statistic only covers people living in private households, and not residential institutions (such as nursing homes).
50% least deprived
The proportion of children in families in receipr of either out of work benefits or tax credits where their reported income is less than 60% median income. Poor children may be excluded from participating in society. They may be unable to afford school
trips and activities; school uniforms or warm winter clothes, be unable to go swimming, have friends round for tea or celebrate their birthdays. Many will never have a holiday. Children who grow up poor are more likely to leave school without
qualifications, have lower employment chances, thus restricting their ability to get a good job and financially contribute to society.
50% least deprived
15% 50% least deprived
DEPRIVATION AND KEY ISSUES AFFECTING PARISHIONERS
Score
79
10% least deprived88
3%
Deprivation is considered to be a multi-dimensional problem, encompassing a range of domains such as financial, health, education, services or crime. continuous measure of relative deprivation therefore there is no definitive point on the scale below
which areas are considered to be deprived and above which they are not.While being in the most deprived 10% may indicate financial disadvantage, it could equally be due to isolated living.
Number of people aged 16 to State Pension age claiming: Jobseeker’s Allowance (JSA), Employment and Support Allowance (ESA), Incapacity Benefit (IB), Income Support (IS) (as a lone parent or in the “other” category),
Other income related benefits.
Social housing is housing that is let at low rents and on a secure basis to people in housing need. It is generally provided by councils and not-for-profit organisations such as housing associations. Vulnerable groups are often
concentrated in the social housing sector, with low rates of employment and low income levels
Children in single parent families have a much higher risk of living in poverty than children in couple families. Single parents may rely on informal childcare.
What are the particular issues that affect your parish? Are you doing anything to address these?
50% least deprived
Deprivation Indicator Diocesan Position National Position
A low-level of skill or educational attainment is one indicator of social disadvantage. Qualifications may make it easier to find employment. Learning also helps promote active citizenship and combat social exclusion.
11%
50% least deprived
50% most deprived
50% least deprived
50% most deprived
50% most deprived
50% least deprived
50% least deprived
Research
&
Statistics

16
0
0.2 50% most deprived 0
0
0
50% most deprived
50% most deprived
10% most deprived
50% least deprived
50% most deprived
10% most deprived
0 0 0
50% most deprived
50% least deprived 50% least deprived
00 0
0
0
0
0
0
50% least deprived
50% most deprived
50% least deprived
50% most deprived
50% most deprived
50% least deprived
10% least deprived
50% least deprived
0 0 0
0Skills Sub-domain 6.5
0
1
0
0
00 0
0
0
0
0
0
0
0
0
0
0
0 0
0
0 0
0
0
0
1
0
0
0
0
1
0
0.1
0.0
5%
0 0
00050% most deprived
0
0
0
0
0
0
0
4.8
1
10% least deprived
50% least deprived
0
00
50% least deprived 0
0
50% least deprived 0
50% least deprived 0
Number of LSOAs amongst
least deprived*Diocesan position National position
HEALTH DEPRIVATION AND
DISABILITY-0.4
Average
Score for
parishIMD Subdomains8 (2010)
INCOME
EMPLOYMENT
Number of LSOAs amongst
most deprived*
1%
0
Income Deprivation Affecting
Children Index0.1
CRIME AND DISORDER
LIVING ENVIRONMENT
Indoors Sub-domain
Outdoors Sub-domain
0
0
Geographical Barriers Sub-domain
28.6
10% most deprived
EDUCATION SKILLS AND TRAINING
BARRIERS TO HOUSING AND SERVICES10% most deprived
Wider Barriers Sub-domain
Children/Young People Sub-domain3.1 0 0
0
0
50% least deprived 50% least deprived
1
0
0
0
0
-1.2
050% most deprived
2.3
87.5
12.8
19.8
50.2
50% most deprived 50% most deprived
10% 1%
DEPRIVATION AND KEY ISSUES AFFECTING PARISHIONERSIt is important to note that these statistics are a measure of deprivation, not affluence, and to recognise that not every person in a highly deprived area will themselves be
deprived. Equally, there will be some deprived people living in the least deprived areas.
Deprivation covers a broad range of issues and refers to unmet needs caused by a lack of resources of all kinds, not just financial. The English Indices of Deprivation
attempt to measure a broader concept of multiple deprivation, made up of several distinct dimensions, or domains, of deprivation. Seven domains of deprivation are
combined to produce the overall Index of Multiple Deprivation. Each domain contains a number of component indicators. The English Indices of Deprivation are a
continuous measure of relative deprivation therefore there is no definitive point on the scale below which areas are considered to be deprived and above which they are
not. Deprived areas have been defined in this release as those containing LSOAs that are amongst the 10 per cent most deprived in England according to the overall Index
of Multiple Deprivation.
Overall IMD 0 000
5% 10%
13.3 50% most deprived
00
00 0
*There is 1 full or partial LSOA included in this parish
0 0
What are the particular issues that affect your parish? Are you doing anything to address these?
Income Deprivation Affecting Older
People Index
0
Research
&
Statistics
17
This spotlight has given you some information about your parish both in terms of your own church congregations and your local community. This is not an
end in itself, but rather a starting place for you to explore further. Questions to consider might include:
• What does our congregation look like?
• How does it compare to the local population?
• What other churches are there in the area? What parts of the community do they reach? Which parts of the community are being missed?
• What other local organisations or centres are there, that might bring people into our parish? Examples might be Hospitals or health centres, prisons, job
centres, homeless shelters, schools, charities, mother and toddler groups, uniformed organisations, community centres, libraries, shops, offices, stations?
How can we interact with these people?
• What areas of our parish do we know well or less well?
• How does the local community change between weekdays and weekends? How do our services and events fit with the shifting local population?
• Is our website/'A Church Near You' profile up to date?
• Are our records up to date?
****************************************************************************************************************************
What to do next?
Your notes
WHAT TO DO NEXT Research
&
Statistics

18
Sources of further information
Public Health Observatories - APHO JSNA Datasets (The datasets are intended to cover a
range of issues, focused on underlying determinants of health and conditions which account
for substantial numbers of preventable diseases and deaths.)
A Church Near You
www.achurchnearyou.com
UpMyStreet - UK house prices, property, crime, local neighbourhood & schools
London Street Gangs - Territory maps and background information
http://www.londonstreetgangs.com/
Hint: Scroll to the bottom of the "Gang Maps" page to see boundaries.
AboutMyArea - The local interactive site - news, reviews, what's on, events, businesses
Research & Statistics GIS
http://www.churchofengland.org/about-us/facts-stats/research-statistics/census-2011.aspx
Church Urban Fund
www.cuf.org.uk
Homeless Pages - Information, Research and Publications on homelessness
http://www.homelesspages.org.uk/
http://www.upmystreet.com/
Hint: Use the "My Neighbourhood" tab
The network of Public Health Observatories - Health Profiles
www.apho.org.uk/resource/view.aspx?RID=91736
The Poverty Site - Geographic Analysis
www.poverty.org.uk/summary/regional.shtml
http://www.apho.org.uk/default.aspx?QN=HP_FINDSEARCH2011
MurderMap - London Homicide Reported Direct from The Old Bailey
Police.uk - Local crime and policing information for England and Wales
http://www.police.uk/
ONS - Neighbourhood Statistics
http://www.aboutmyarea.co.uk/
http://neighbourhood.statistics.gov.uk/
Hint: Use the summary box
http://www.murdermap.co.uk/
Research
&
Statistics

19
Proportion of the population aged 60+ who are in receipt of the Guaranteed part of Pension Credit (August 2012)
Estimated using LSOA level data sourced from http://83.244.183.180/NESS/BEN/iben.htm
Proportion of the working age population who are in receipt of a key out-of-work benefit (Q3 2012)
Life Expectancy at birth (boys) (1999-2003)
Estimated using ward level data from ONS.
Life expectancy at birth (girls) (1999-2003)
Estimated using ward level data from ONS.
Percentage of Children under 16 in Poverty (2009)
Estimated using LSOA level data from http://www.hmrc.gov.uk/statistics/child-poverty-stats.htm
IMD (2010)
Methodology: Government data is published on government boundaries that do not match ecclesiastical boundaries. In order to produce parish population and demographic
estimates we have worked with the ONS to use a best fit modelling process. As such, these statistics can only be considered estimates and, particularly in very diverse areas, are
best used in the context of local knowledge. Where parish populations are sparse the figures for government areas overlapping the parish are used.
Parish estimates from the census have been calculated using the census output area data published by the ONS. These are provisional estimates, and when more granular data at
postcode level is available, will be revised. Estimates have been modelled by allocating the population weighted centroid of each output area to the parish within which it falls.
This means that some parishes have not been allocated population, however proportions for demographic variables have been calculated based on the output areas overlaying
the parish.
For further information about this process, please contact [email protected].
Contains public sector information licensed under the Open Government Licence v1.0 http://www.nationalarchives.gov.uk/doc/open-government-licence/
Estimated using OA level data sourced from ONS Census Data 2011, ONS
Estimated using OA level data sourced from ONS Census Data 2001, ONS
When analysing data, it is important to consider that some parishes are very small and proportions may be very large even where very few cases meet the criteria.
ABOUT THIS DATA
http://www.churchofengland.org/about-us/facts-stats/research-statistics/clergydiversityaudit2005linkpage.aspx
Estimated using OA level data from DWP Information, Governance and Security Directorate from
http://statistics.dwp.gov.uk/asd/asd1/tabtools/census_output_area_data/index.php?page=census_output_area_data
Annual parochial returns
ONS Census data 2011
ONS Census data 2001
2007 Church Diversity Survey
DWP
ONS
HMRC
Department for Communities and Local Government
1
2
3
4
5
6
7
8
These have been collected annually between 2007 and 2011 by the Research and Statistics team, Archbishops’ Council
When quoting figures derived from this data, care should be taken with the level of accuracy quoted.
Estimated using LSOA level data from Communities and Local Government, 2010.
https://www.gov.uk/government/uploads/system/uploads/attachment_data/file/6320/1870718.pdf
Research
&
Statistics

1
Getting to know your parish
What is this spotlight?
How should I use it?
Questions
Contents
This short spotlight brings together a range of information about your parish,
both in terms of your congregations, but also the wider community living in
your area. It covers areas such as Christian affiliation, population age and
ethnicity profiles, household structures, deprivation, employment, schools
and qualifications, alongside church statistics such as attendance and giving.
There is information at the end of the spotlight about where this data comes
from and how it was calculated. If you have any further queries then please
do contact the Research and Statistics team at
This spotlight is not an end in itself, but rather a starting place for you to
explore further. You may want to discuss it at a PCC meeting or with
leadership teams. We’ve included some questions on each page to help you
to think about the information, however some things will be of more
relevance in some areas than others, and these are just suggestions to get
you started. We’ve also included some bigger questions about what to do
next at the end of the spotlight on page 17. There’s space for you to write
some notes here. It might be helpful to write a short paragraph to
summarise your community profile or note down anything that has struck
you as particularly important. There are also details at the end for where
you can find further information should you want to dig a little deeper.
1. Summary: a brief overview of your parish, including what look to be 5 of
the most pressing social issues in your area
2. Age: age profile of your community
3. Ethnicity: ethnicity profile of your community
4. Integration: English language speaking and length of UK residency in your
community
5. Religious affiliation: religious affiliation in your community
6. Households: families, dependents, one person households, temporary
residents and housing tenure
7. Marital and civil partnership status
8. Employment: occupations, benefits and mobility in your community
9. Education: CofE schools and qualification levels in your community
10. Health: people with health problems and carers in your community
11. Deprivation: different types of deprivation in your community
Research
&
Statistics

2
Parishioners at glance
Fritwell: St Olave
2011 Tax Efficient Planned
Giving/person/week1
2011 Electoral
Roll1
Housing Conditions
Housing Access
Housing Costs
82%
70%
Issues to look out for in your parish
£10
Annual Parochial Returns
Oct
ob
er W
eekl
y
Att
end
ance
1
0-4
5-15
2011 Parish
Share Paid1
32
PARISH OVERVIEW
14%
Parish
10%
15%
62%
Age Profile (20112)700
Proportion Christian
Sorry, no Fresh Expressions listed for this parish.Fresh Expressions
700
BICESTER & ISLIP
OXFORD
16-64
Age
Gro
up
Diocese
627042
Deanery
Archdeaconry
20013
20112
20013
20112
Included Churches
Oxford
Population
Education
Parish of: Fritwell
Parish Code: 270042
65 +
£7,400
Local Amenities
Research
&
Statistics
0
20
40
60
80
100
120
2007 2008 2009 2010 2011
Highestweek
Average
LowestWeek

3
Parish 20112 Deanery 20112 Diocese 20112
Demographics: AGE PROFILE AND ATTENDANCE AT SERVICES
Does the age profile of your congregation match that of your parish? Are you engaging with the
parish's largest demographic: those aged 30 - 44?
40% 30% 20% 10% 0% 10% 20% 30%
0 - 4
5 - 7
8 - 9
10 - 14
15
16 - 17
18 - 19
20 - 24
25 - 29
30 - 44
45 - 59
60 - 64
65 - 74
75 - 84
85 - 89
90 & overAge profile of parish populations 20013 & 20112
Parish2011
Parish2001
0% 10% 20% 30%
0 - 14
15 - 29
30 - 44
45 - 59
60 - 74
75 - 89
90 & over
0% 10% 20% 30%
0 - 14
15 - 29
30 - 44
45 - 59
60 - 74
75 - 89
90 & over
0% 5% 10% 15% 20% 25%
0 - 14
15 - 29
30 - 44
45 - 59
60 - 74
75 - 89
90 & over
Research
&
Statistics

4
15%
Diocesan Congregation4 (2007)
Parish Population2 (2011)
(nearest 50)
Demographics: AGE PROFILE AND ATTENDANCE AT SERVICES
Comparable Age profile of Adults
25%
65 +
40%
Age
50
100
18 - 44
22% 38%
450
100
0 - 4
5 - 15
16 - 64
Diocesan Core Congregation Age Profile4 (2007)
Diocesan Population2 (2011) 37%
45 - 64
Does the age profile of your congregation match that of your parish?
65 +
Infant Baptisms
20111
4
Highest Weeks
Attendance 20111
-
66
9%
13%
16%
22%
40%
0% 10% 20% 30% 40% 50%
Research
&
Statistics

5
Detailed Parish Ethnicity2 2011
Parish Ethnicity2 2011 Parish Ethnicity3 2001 Diocese Ethnicity2 2011
Arab Other Ethnic Group
0%<1%
Indian Bangladeshi Chinese
African Caribbean
Parish
Percentage
ME: 2%
Other Asian
<1%
Does the ethnicity profile of your congregation match that of your parish? Are you engaging with the parish's
largest demographics: those describing themselves as White or Mixed/Multiple ethnic group?
0%
3%
0%<1% 0%
<1%
<1%0%
Demographics: ETHNICITY
<1%
94%
Other White
3%
White & Asian Other Mixed
1%
<1%
0%
British
White & Black
Caribbean
Diocesan Population2 (2011)
Diocesan Core Congregation4 (aged 18+ only) (2007)
Percentage Minority Ethnic Background
15%
<1%
Irish
Pakistani
0%
Other Black
Gypsy or Irish
Traveller
White & Black
African
Research
&
Statistics
White
Mixed/Multipleethnic group
Asian/Asian British
Black or BlackBritish
Other ethnicgroup

6
Cannot speak English well or cannot speak
English Can speak English well or very well
0% 1%Have English as their main language (English or
Welsh if in Wales)
99%2Percentage of people who
Demographics: Integration
10 years or more
94%
2 years or more but less
than 5 years
Born in the UK
Less than 2 years
1% 1% 5%
5 years or more but less
than 10 years
Are services in your parish accessible to all residents? Do you offer any services in foreign
languages? What can you offer those who may not have been in the UK for long?
2Resident in UK:
<1%
Research
&
Statistics

7
In your parish 70% of the population (that is 600 people) declared themselves as Christian in 2011
0
Statistics from the Annual
Parochial Returns 2011
Easter Communicants1
Easter Day Attendance1
Christmas Communicants1
Christmas Attendance1
Christians in your Parish
RELIGIOUS AFFILIATION
0
0
0
How has the religious affiliation of those living in your parish changed over the past decade? How closely does
it match that of the Diocese as a whole? Are Christians in your parish engaging with your churches? How are
you engaging with other faith groups?
0% 10% 20% 30% 40% 50% 60% 70% 80% 90% 100%
Parish 2001
Parish 2011
Diocese 2011
Christian Buddhist Hindu Jewish Muslim Sikh Other religions No religion Religion not stated
2
3
National Average Percentage Christian2 (59.4%)
Research
&
Statistics
2
2

8
Household Spaces2 2011
With at least one usual resident i.e. not vacant 98%
0%Caravan or other mobile or temporary structure
200 <50 <50
Who lives in your parish? Are there issues with access to housing? How permenant are your
parishioners?
Tenure2
Social rented as a percentage of all households2 17%
Social Rented householdsOwner occupied households
(including shared ownership)
Private Rented households
(including those living rent free)
HOUSEHOLDS, LIFESTYLE AND THE COMMUNITY I Research
&
Statistics

9
Household composition in your parish2 All
percentages are of the total number of
households with residents. The smaller pie
charts show the breakdown of a section of
the larger ones. You can use the colours to
match.
Lone Parent
Households as a
percentage of all
households with
children2
15%
Who lives in your parish? Are there a lot of households with children? What about lone parent
households? Are there a lot of people living alone?
HOUSEHOLDS, LIFESTYLE AND THE COMMUNITY II
Aged 65 and over 11% Other 13%
One Person 23%
One family 71%
Other households
6%
Dependent children 2%
All aged 65 and over
<1%
Other 4%
Aged 65 and over 8%
Married or same-sex civil partnership couple 44%
Cohabiting couple 11%
Lone parent 8%
No children 12%
Dependent children 26%
Non-dependent children 6%
No children 7%
Dependent children 3%
Non-dependent
children <1%
Dependent children 6%
Non-dependent children 3%
Research
&
Statistics
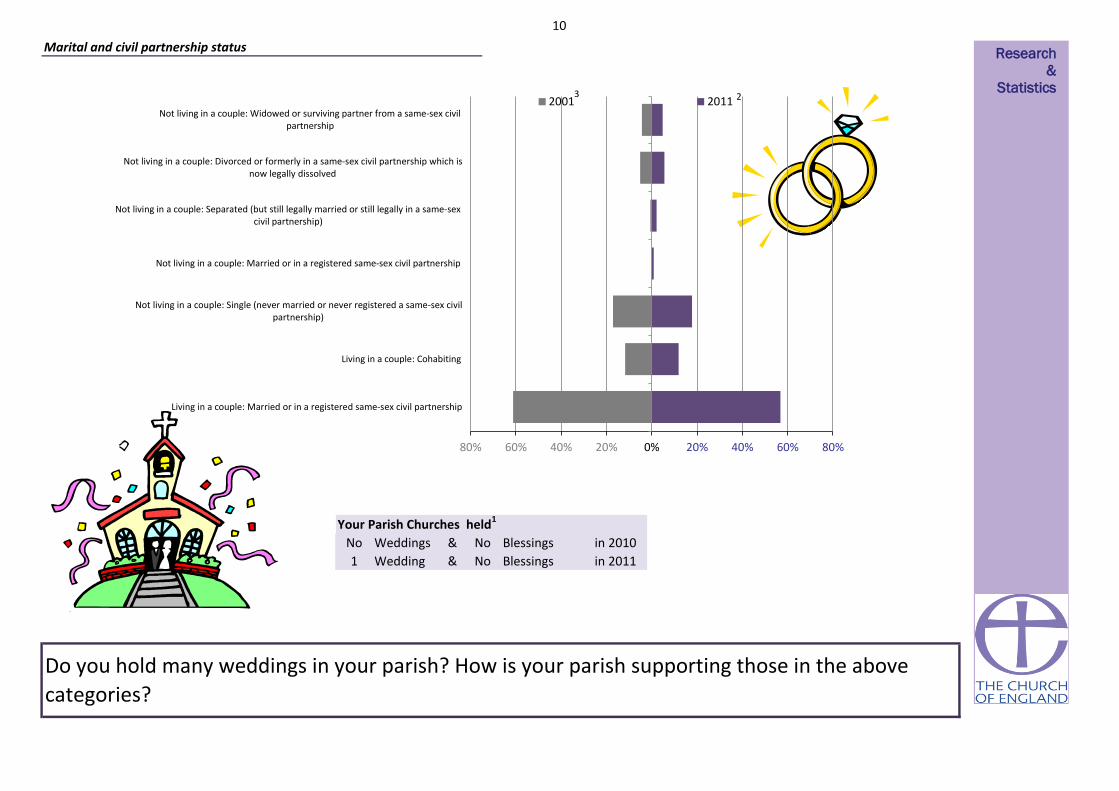
10
Weddings & Blessings in 2010
Wedding & Blessings in 20111 No
Your Parish Churches held1
Do you hold many weddings in your parish? How is your parish supporting those in the above
categories?
No No
Marital and civil partnership status
80% 60% 40% 20% 0% 20% 40% 60% 80%
Living in a couple: Married or in a registered same-sex civil partnership
Living in a couple: Cohabiting
Not living in a couple: Single (never married or never registered a same-sex civilpartnership)
Not living in a couple: Married or in a registered same-sex civil partnership
Not living in a couple: Separated (but still legally married or still legally in a same-sexcivil partnership)
Not living in a couple: Divorced or formerly in a same-sex civil partnership which isnow legally dissolved
Not living in a couple: Widowed or surviving partner from a same-sex civilpartnership
2001 2011
Research
&
Statistics 2 3

11
£0
£0
£0
£0
£0
£0
Parish Expenditure1
TEPG/PERSON/WEEK1
Other/person/week1Other planned giving1
How are your parish finances? How does this compare to your community profile?
£8,544
£14,300
EMPLOYMENT AND SOCIAL GRADE, LIFESTYLE
The National Statistics Socio-economic Classification (NS-SeC) is an occupationally
based classification but has rules to provide coverage of the whole adult population.
The NS-SeC provides an indication of socio-economic position based on occupation.
It is an Office for National Statistics standard classification. To assign a person aged
16 to 74 to an NS-SeC category their occupation title is combined with information
about their employment status, whether they are employed or self-employed and
whether or not they supervise other employees. Full-time students are recorded in
the' full-time students' category regardless of whether they are economically active
or not.Parish Share Assessed1
Parish Share Paid1
£0
£0
£14,760
£13,660
£7,400
£10
£0Tax Efficient Planned Giving (TEPG)1
Finance Returns 2010
NS-SeC of Household Reference Person2
£0Parish Income12011
Research
&
Statistics
0% 5% 10% 15% 20% 25% 30%
Higher managerial, administrative and professional occupations
Lower managerial, administrative and professional occupations
Intermediate occupations
Small employers and own account workers
Lower supervisory and technical occupations
Semi-routine occupations
Routine occupations
Never worked and long-term unemployed
Not classified (Full-time students or not classifiable for other reasons)

12
9%
91%
Households
4%
EMPLOYMENT AND SOCIAL GRADE, LIFESTYLE
How much free time do residents of your parish have? How accessible are your churches to those
with/without cars?
Access to at least 1 car or van
Household Mobility2
Proportion of population aged 60+ who are in
receipt of the Guaranteed part of Pension
Credit5
11%
Proportion of working age persons (16-74) with
no qualifications2 18%
Proportion of working age population who are
in receipt of a key out-of-work benefit5
No access to a car or van
Part-time: 15 hours or less
worked 7%
Part-time: 16 to 30 hours worked
18%
Full-time: 31 to 48 hours worked
54%
Full-time: 49 or more hours
worked 21%
Hours Worked2
Part-time: 15 hours or less worked Part-time: 16 to 30 hours worked
Full-time: 31 to 48 hours worked Full-time: 49 or more hours worked
Research
&
Statistics
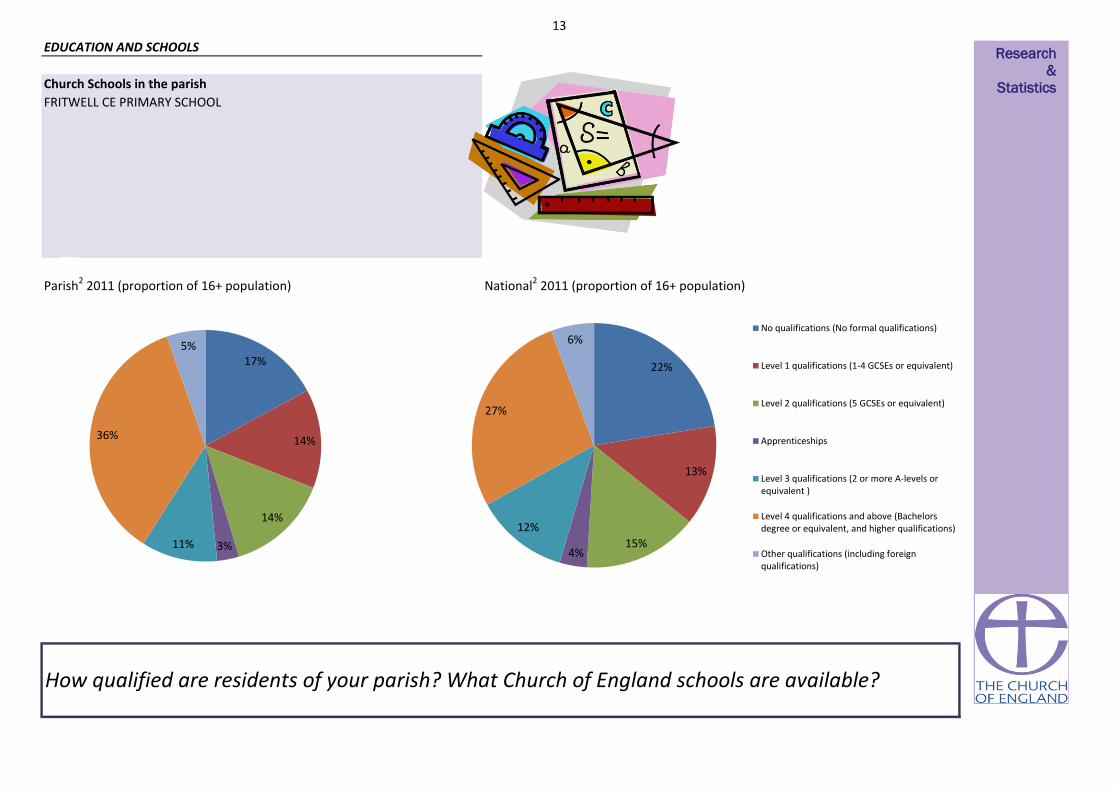
13
Church Schools in the parish
FRITWELL CE PRIMARY SCHOOL
Parish2 2011 (proportion of 16+ population) National2 2011 (proportion of 16+ population)
EDUCATION AND SCHOOLS
How qualified are residents of your parish? What Church of England schools are available?
17%
14%
14%
3% 11%
36%
5%
22%
13%
15% 4%
12%
27%
6% No qualifications (No formal qualifications)
Level 1 qualifications (1-4 GCSEs or equivalent)
Level 2 qualifications (5 GCSEs or equivalent)
Apprenticeships
Level 3 qualifications (2 or more A-levels orequivalent )
Level 4 qualifications and above (Bachelorsdegree or equivalent, and higher qualifications)
Other qualifications (including foreignqualifications)
Research
&
Statistics
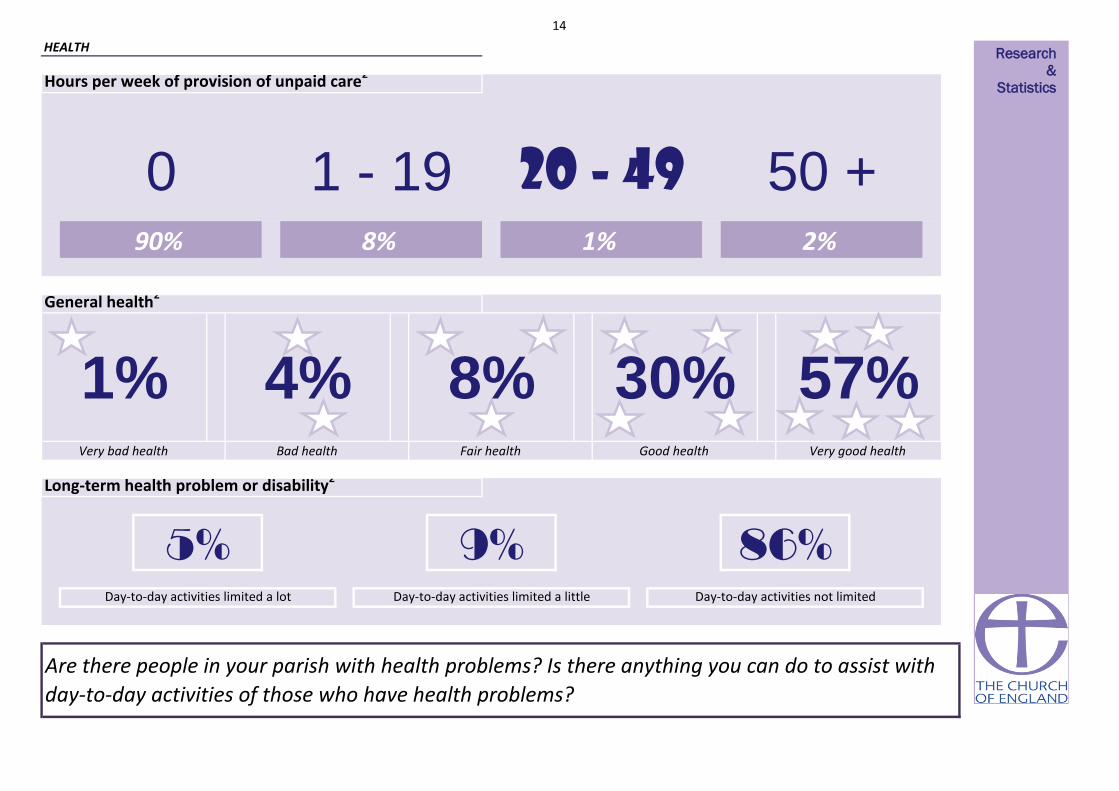
14
Hours per week of provision of unpaid care2
1% 2%
Very bad health Bad health Fair health
1 - 19
Are there people in your parish with health problems? Is there anything you can do to assist with
day-to-day activities of those who have health problems?
HEALTH
0
Long-term health problem or disability2
50 +90% 8%
Good health Very good health
1%
Day-to-day activities limited a lot Day-to-day activities limited a little Day-to-day activities not limited
5% 9% 86%
4% 8% 30% 57%
General health2
20 - 49
Research
&
Statistics

15
You parish can be categorised as in the most or least deprived 10% or 50% of all parishes within the diocese and of all parishes nationally
50% least deprived 50% least deprived
Life expectancy at birth (girls)6 (1999-2003)
Life Expectancy at birth (boys)6 (1999-2003)
17%
11.1
50% most deprived11% 50% least deprived
50% most deprivedPercentage of Children under 16 in Poverty7 (2010)
Percentage of working age persons (16-74) with no
qualifications2 (2011)
10% least deprived
Life expectancy at birth can give an idea of overall quality of life. Life expectancy is an average. Women tend to have greater life expectancy. Life expectany can be affected by family history, marital status, economic status,
physique, exercise, diet, drug use including smoking and alcohol consumption, disposition, education, environment, sleep, climate, and health care.
Proportion of the population aged 60+ who are in receipt of
the Guaranteed part of Pension Credit5 (2012)
11%
Social rented as a percentage of all households2 (2011)
Index of Multiple Deprivation (IMD)8 (2010)
Proportion of the working age population who are in receipt
of a key out-of-work benefit5 (2012)
Lone Parent Households as a percentage of all households
with children2 (2011)
Pension Credit is an income related benefit made up of 2 parts - Guarantee Credit and Savings Credit. The guaranteed part tops up weekly income if it’s below £142.70 (single people) or £217.90 (couples) so those who
receive this are on a low income. This statistic only covers people living in private households, and not residential institutions (such as nursing homes).
50% least deprived
The proportion of children in families in receipr of either out of work benefits or tax credits where their reported income is less than 60% median income. Poor children may be excluded from participating in society. They may be unable to afford school
trips and activities; school uniforms or warm winter clothes, be unable to go swimming, have friends round for tea or celebrate their birthdays. Many will never have a holiday. Children who grow up poor are more likely to leave school without
qualifications, have lower employment chances, thus restricting their ability to get a good job and financially contribute to society.
50% most deprived
18% 50% most deprived
DEPRIVATION AND KEY ISSUES AFFECTING PARISHIONERS
Score
79
10% least deprived86
4%
Deprivation is considered to be a multi-dimensional problem, encompassing a range of domains such as financial, health, education, services or crime. continuous measure of relative deprivation therefore there is no definitive point on the scale below
which areas are considered to be deprived and above which they are not.While being in the most deprived 10% may indicate financial disadvantage, it could equally be due to isolated living.
Number of people aged 16 to State Pension age claiming: Jobseeker’s Allowance (JSA), Employment and Support Allowance (ESA), Incapacity Benefit (IB), Income Support (IS) (as a lone parent or in the “other” category),
Other income related benefits.
Social housing is housing that is let at low rents and on a secure basis to people in housing need. It is generally provided by councils and not-for-profit organisations such as housing associations. Vulnerable groups are often
concentrated in the social housing sector, with low rates of employment and low income levels
Children in single parent families have a much higher risk of living in poverty than children in couple families. Single parents may rely on informal childcare.
What are the particular issues that affect your parish? Are you doing anything to address these?
50% least deprived
Deprivation Indicator Diocesan Position National Position
A low-level of skill or educational attainment is one indicator of social disadvantage. Qualifications may make it easier to find employment. Learning also helps promote active citizenship and combat social exclusion.
15%
50% least deprived
50% most deprived
50% least deprived
50% most deprived
50% most deprived
50% most deprived
50% most deprived
Research
&
Statistics

16
0
0.1 50% least deprived 0
0
1
50% least deprived
50% most deprived
50% most deprived
50% least deprived
50% most deprived
50% most deprived
0 0 0
50% most deprived
50% least deprived 50% least deprived
00 0
0
0
0
0
0
50% least deprived
50% most deprived
50% least deprived
50% most deprived
50% most deprived
50% most deprived
50% least deprived
50% least deprived
0 0 0
0Skills Sub-domain 5.0
0
0
0
0
00 0
0
0
0
0
0
0
0
0
0
0
0 0
0
0 0
0
0
0
0
0
0
0
0
0
0
0.1
0.0
5%
0 0
00050% least deprived
0
0
0
1
0
0
0
10.9
0
50% most deprived
50% most deprived
0
00
50% least deprived 0
0
50% most deprived 0
50% least deprived 0
Number of LSOAs amongst
least deprived*Diocesan position National position
HEALTH DEPRIVATION AND
DISABILITY-0.9
Average
Score for
parishIMD Subdomains8 (2010)
INCOME
EMPLOYMENT
Number of LSOAs amongst
most deprived*
1%
0
Income Deprivation Affecting
Children Index0.1
CRIME AND DISORDER
LIVING ENVIRONMENT
Indoors Sub-domain
Outdoors Sub-domain
0
0
Geographical Barriers Sub-domain
25.3
50% most deprived
EDUCATION SKILLS AND TRAINING
BARRIERS TO HOUSING AND SERVICES50% most deprived
Wider Barriers Sub-domain
Children/Young People Sub-domain16.8 0 0
0
0
50% most deprived 50% most deprived
0
0
0
0
0
-0.4
050% most deprived
5.8
65.7
12.4
18.8
39.0
50% most deprived 50% least deprived
10% 1%
DEPRIVATION AND KEY ISSUES AFFECTING PARISHIONERSIt is important to note that these statistics are a measure of deprivation, not affluence, and to recognise that not every person in a highly deprived area will themselves be
deprived. Equally, there will be some deprived people living in the least deprived areas.
Deprivation covers a broad range of issues and refers to unmet needs caused by a lack of resources of all kinds, not just financial. The English Indices of Deprivation
attempt to measure a broader concept of multiple deprivation, made up of several distinct dimensions, or domains, of deprivation. Seven domains of deprivation are
combined to produce the overall Index of Multiple Deprivation. Each domain contains a number of component indicators. The English Indices of Deprivation are a
continuous measure of relative deprivation therefore there is no definitive point on the scale below which areas are considered to be deprived and above which they are
not. Deprived areas have been defined in this release as those containing LSOAs that are amongst the 10 per cent most deprived in England according to the overall Index
of Multiple Deprivation.
Overall IMD 0 000
5% 10%
11.1 50% most deprived
00
00 0
*There is 1 full or partial LSOA included in this parish
0 0
What are the particular issues that affect your parish? Are you doing anything to address these?
Income Deprivation Affecting Older
People Index
0
Research
&
Statistics

17
This spotlight has given you some information about your parish both in terms of your own church congregations and your local community. This is not an
end in itself, but rather a starting place for you to explore further. Questions to consider might include:
• What does our congregation look like?
• How does it compare to the local population?
• What other churches are there in the area? What parts of the community do they reach? Which parts of the community are being missed?
• What other local organisations or centres are there, that might bring people into our parish? Examples might be Hospitals or health centres, prisons, job
centres, homeless shelters, schools, charities, mother and toddler groups, uniformed organisations, community centres, libraries, shops, offices, stations?
How can we interact with these people?
• What areas of our parish do we know well or less well?
• How does the local community change between weekdays and weekends? How do our services and events fit with the shifting local population?
• Is our website/'A Church Near You' profile up to date?
• Are our records up to date?
****************************************************************************************************************************
What to do next?
Your notes
WHAT TO DO NEXT Research
&
Statistics

18
Sources of further information
Public Health Observatories - APHO JSNA Datasets (The datasets are intended to cover a
range of issues, focused on underlying determinants of health and conditions which account
for substantial numbers of preventable diseases and deaths.)
A Church Near You
www.achurchnearyou.com
UpMyStreet - UK house prices, property, crime, local neighbourhood & schools
London Street Gangs - Territory maps and background information
http://www.londonstreetgangs.com/
Hint: Scroll to the bottom of the "Gang Maps" page to see boundaries.
AboutMyArea - The local interactive site - news, reviews, what's on, events, businesses
Research & Statistics GIS
http://www.churchofengland.org/about-us/facts-stats/research-statistics/census-2011.aspx
Church Urban Fund
www.cuf.org.uk
Homeless Pages - Information, Research and Publications on homelessness
http://www.homelesspages.org.uk/
http://www.upmystreet.com/
Hint: Use the "My Neighbourhood" tab
The network of Public Health Observatories - Health Profiles
www.apho.org.uk/resource/view.aspx?RID=91736
The Poverty Site - Geographic Analysis
www.poverty.org.uk/summary/regional.shtml
http://www.apho.org.uk/default.aspx?QN=HP_FINDSEARCH2011
MurderMap - London Homicide Reported Direct from The Old Bailey
Police.uk - Local crime and policing information for England and Wales
http://www.police.uk/
ONS - Neighbourhood Statistics
http://www.aboutmyarea.co.uk/
http://neighbourhood.statistics.gov.uk/
Hint: Use the summary box
http://www.murdermap.co.uk/
Research
&
Statistics

19
Proportion of the population aged 60+ who are in receipt of the Guaranteed part of Pension Credit (August 2012)
Estimated using LSOA level data sourced from http://83.244.183.180/NESS/BEN/iben.htm
Proportion of the working age population who are in receipt of a key out-of-work benefit (Q3 2012)
Life Expectancy at birth (boys) (1999-2003)
Estimated using ward level data from ONS.
Life expectancy at birth (girls) (1999-2003)
Estimated using ward level data from ONS.
Percentage of Children under 16 in Poverty (2009)
Estimated using LSOA level data from http://www.hmrc.gov.uk/statistics/child-poverty-stats.htm
IMD (2010)
Methodology: Government data is published on government boundaries that do not match ecclesiastical boundaries. In order to produce parish population and demographic
estimates we have worked with the ONS to use a best fit modelling process. As such, these statistics can only be considered estimates and, particularly in very diverse areas, are
best used in the context of local knowledge. Where parish populations are sparse the figures for government areas overlapping the parish are used.
Parish estimates from the census have been calculated using the census output area data published by the ONS. These are provisional estimates, and when more granular data at
postcode level is available, will be revised. Estimates have been modelled by allocating the population weighted centroid of each output area to the parish within which it falls.
This means that some parishes have not been allocated population, however proportions for demographic variables have been calculated based on the output areas overlaying
the parish.
For further information about this process, please contact [email protected].
Contains public sector information licensed under the Open Government Licence v1.0 http://www.nationalarchives.gov.uk/doc/open-government-licence/
Estimated using OA level data sourced from ONS Census Data 2011, ONS
Estimated using OA level data sourced from ONS Census Data 2001, ONS
When analysing data, it is important to consider that some parishes are very small and proportions may be very large even where very few cases meet the criteria.
ABOUT THIS DATA
http://www.churchofengland.org/about-us/facts-stats/research-statistics/clergydiversityaudit2005linkpage.aspx
Estimated using OA level data from DWP Information, Governance and Security Directorate from
http://statistics.dwp.gov.uk/asd/asd1/tabtools/census_output_area_data/index.php?page=census_output_area_data
Annual parochial returns
ONS Census data 2011
ONS Census data 2001
2007 Church Diversity Survey
DWP
ONS
HMRC
Department for Communities and Local Government
1
2
3
4
5
6
7
8
These have been collected annually between 2007 and 2011 by the Research and Statistics team, Archbishops’ Council
When quoting figures derived from this data, care should be taken with the level of accuracy quoted.
Estimated using LSOA level data from Communities and Local Government, 2010.
https://www.gov.uk/government/uploads/system/uploads/attachment_data/file/6320/1870718.pdf
Research
&
Statistics

1
Contents
This short spotlight brings together a range of information about your parish,
both in terms of your congregations, but also the wider community living in
your area. It covers areas such as Christian affiliation, population age and
ethnicity profiles, household structures, deprivation, employment, schools
and qualifications, alongside church statistics such as attendance and giving.
There is information at the end of the spotlight about where this data comes
from and how it was calculated. If you have any further queries then please
do contact the Research and Statistics team at
This spotlight is not an end in itself, but rather a starting place for you to
explore further. You may want to discuss it at a PCC meeting or with
leadership teams. We’ve included some questions on each page to help you
to think about the information, however some things will be of more
relevance in some areas than others, and these are just suggestions to get
you started. We’ve also included some bigger questions about what to do
next at the end of the spotlight on page 17. There’s space for you to write
some notes here. It might be helpful to write a short paragraph to
summarise your community profile or note down anything that has struck
you as particularly important. There are also details at the end for where
you can find further information should you want to dig a little deeper.
1. Summary: a brief overview of your parish, including what look to be 5 of
the most pressing social issues in your area
2. Age: age profile of your community
3. Ethnicity: ethnicity profile of your community
4. Integration: English language speaking and length of UK residency in your
community
5. Religious affiliation: religious affiliation in your community
6. Households: families, dependents, one person households, temporary
residents and housing tenure
7. Marital and civil partnership status
8. Employment: occupations, benefits and mobility in your community
9. Education: CofE schools and qualification levels in your community
10. Health: people with health problems and carers in your community
11. Deprivation: different types of deprivation in your community
Getting to know your parish
What is this spotlight?
How should I use it?
Questions
Research
&
Statistics
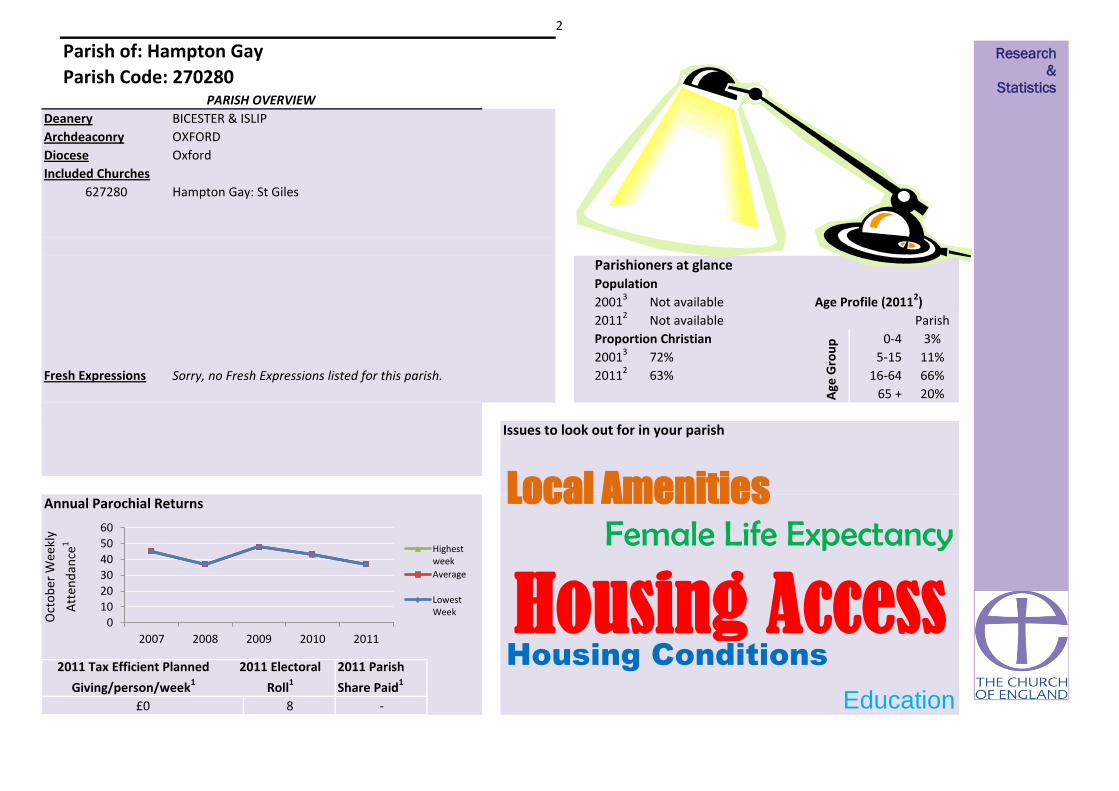
2
Parishioners at glance
Parish of: Hampton Gay
Parish Code: 270280
65 +
-
20013
20112
Population
Female Life ExpectancyLocal Amenities
Diocese
627280
Deanery
PARISH OVERVIEW
20%
Archdeaconry
16-64
Age
Gro
up
20013 Not available
20112 Not available
Hampton Gay: St Giles
Included Churches
Oxford
Education
Housing Conditions
Housing Access
72%
63%
Issues to look out for in your parish
£0
Annual Parochial Returns
Oct
ob
er W
eekl
y
Att
end
ance
1
3%
11%
66%
Age Profile (20112)
Proportion Christian
Sorry, no Fresh Expressions listed for this parish.Fresh Expressions
BICESTER & ISLIP
OXFORD
0-4
5-15
2011 Parish
Share Paid1
8
Parish
2011 Tax Efficient Planned
Giving/person/week1
2011 Electoral
Roll1
Research
&
Statistics
0
10
20
30
40
50
60
2007 2008 2009 2010 2011
Highestweek
Average
LowestWeek

3
Parish 20112 Deanery 20112 Diocese 20112
Does the age profile of your congregation match that of your parish? Are you engaging with the
parish's largest demographic: those aged 45 - 59?
Demographics: AGE PROFILE AND ATTENDANCE AT SERVICES
30% 20% 10% 0% 10% 20% 30%
0 - 4
5 - 7
8 - 9
10 - 14
15
16 - 17
18 - 19
20 - 24
25 - 29
30 - 44
45 - 59
60 - 64
65 - 74
75 - 84
85 - 89
90 & overAge profile of parish populations 20013 & 20112
Parish2011
Parish2001
0% 5% 10% 15% 20% 25%
0 - 14
15 - 29
30 - 44
45 - 59
60 - 74
75 - 89
90 & over
0% 10% 20% 30%
0 - 14
15 - 29
30 - 44
45 - 59
60 - 74
75 - 89
90 & over
0% 5% 10% 15% 20% 25%
0 - 14
15 - 29
30 - 44
45 - 59
60 - 74
75 - 89
90 & over
Research
&
Statistics

4
29
Infant Baptisms
20111Comparable Age profile of Adults
15%
Diocesan Congregation4 (2007)
Parish Population2 (2011)
(nearest 50)
Demographics: AGE PROFILE AND ATTENDANCE AT SERVICES
37%
45 - 64
Does the age profile of your congregation match that of your parish?
65 +
1
Highest Weeks
Attendance 20111
8 3%
11%
66%
20%
0 - 4
5 - 15
16 - 64
Diocesan Core Congregation Age Profile4 (2007)
Diocesan Population2 (2011) 25%
65 +
40%
Age18 - 44
22% 38%
9%
13%
16%
22%
40%
0% 10% 20% 30% 40% 50%
Research
&
Statistics

5
Detailed Parish Ethnicity2 2011
Other Black
Gypsy or Irish
Traveller
White & Black
African
1%
Irish
Pakistani
5%
Diocesan Population2 (2011)
Diocesan Core Congregation4 (aged 18+ only) (2007)
Percentage Minority Ethnic Background
15%
British
White & Black
Caribbean
IndianParish
Percentage
ME: 5%
Other Asian
<1%
<1%
White & Asian Other Mixed
<1%
<1%
0%
<1%
89%
Other White
4%
3%
<1%
Does the ethnicity profile of your congregation match that of your parish? Are you engaging with the parish's
largest demographics: those describing themselves as White or Asian/Asian British?
Arab Other Ethnic Group
0%<1%
0%
0%
<1%<1%
Demographics: ETHNICITY
<1%
Bangladeshi Chinese
African Caribbean
Parish Ethnicity2 2011 Parish Ethnicity3 2001 Diocese Ethnicity2 2011
Research
&
Statistics
White
Mixed/Multipleethnic group
Asian/Asian British
Black or BlackBritish
Other ethnicgroup

6
<1% 8%
5 years or more but less
than 10 years
Are services in your parish accessible to all residents? Do you offer any services in foreign
languages? What can you offer those who may not have been in the UK for long?
2Resident in UK:
1%
Have English as their main language (English or
Welsh if in Wales)
10 years or more
91%
2 years or more but less
than 5 years
Born in the UK
Less than 2 years
1%
1% 1% 99%2Percentage of people who
Demographics: Integration
Cannot speak English well or cannot speak
English Can speak English well or very well
Research
&
Statistics
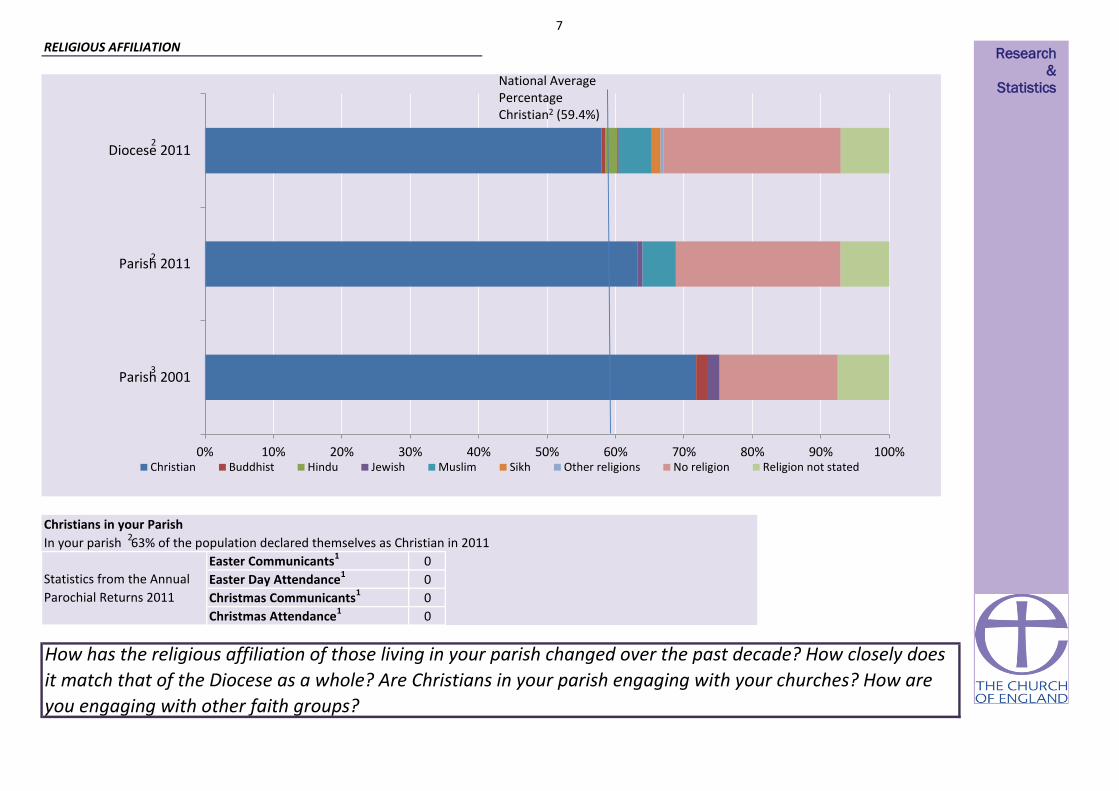
7
0
0
0
RELIGIOUS AFFILIATION
In your parish 63% of the population declared themselves as Christian in 2011
How has the religious affiliation of those living in your parish changed over the past decade? How closely does
it match that of the Diocese as a whole? Are Christians in your parish engaging with your churches? How are
you engaging with other faith groups?
0
Statistics from the Annual
Parochial Returns 2011
Easter Communicants1
Easter Day Attendance1
Christmas Communicants1
Christmas Attendance1
Christians in your Parish
0% 10% 20% 30% 40% 50% 60% 70% 80% 90% 100%
Parish 2001
Parish 2011
Diocese 2011
Christian Buddhist Hindu Jewish Muslim Sikh Other religions No religion Religion not stated
2
3
National Average Percentage Christian2 (59.4%)
Research
&
Statistics
2
2

8
HOUSEHOLDS, LIFESTYLE AND THE COMMUNITY I
Social Rented householdsOwner occupied households
(including shared ownership)
Private Rented households
(including those living rent free)
Household Spaces2 2011
With at least one usual resident i.e. not vacant 90%
<1%Caravan or other mobile or temporary structure
84% 12% 4%
Who lives in your parish? Are there issues with access to housing? How permenant are your
parishioners?
Tenure2
Social rented as a percentage of all households2 4%
Research
&
Statistics
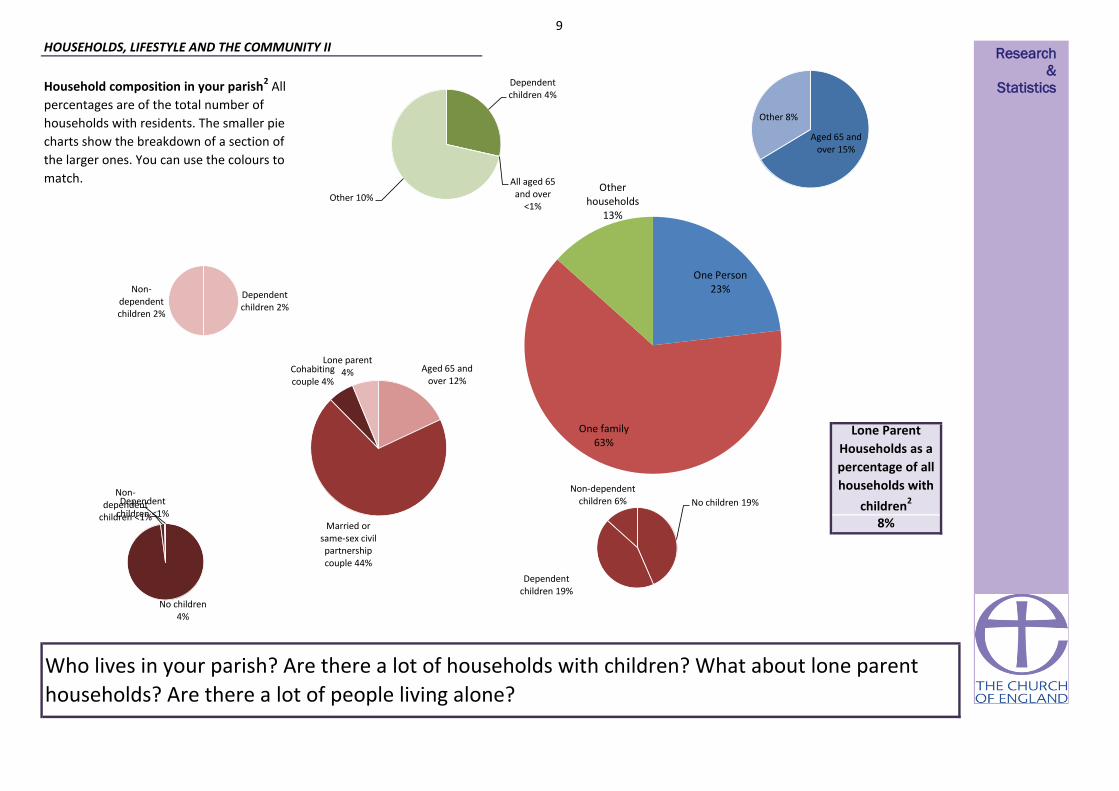
9
Who lives in your parish? Are there a lot of households with children? What about lone parent
households? Are there a lot of people living alone?
HOUSEHOLDS, LIFESTYLE AND THE COMMUNITY II
Household composition in your parish2 All
percentages are of the total number of
households with residents. The smaller pie
charts show the breakdown of a section of
the larger ones. You can use the colours to
match.
Lone Parent
Households as a
percentage of all
households with
children2
8%
Aged 65 and over 15%
Other 8%
One Person 23%
One family 63%
Other households
13%
Dependent children 4%
All aged 65 and over
<1% Other 10%
Aged 65 and over 12%
Married or same-sex civil partnership couple 44%
Cohabiting couple 4%
Lone parent 4%
No children 19%
Dependent children 19%
Non-dependent children 6%
No children 4%
Dependent children <1%
Non-dependent
children <1%
Dependent children 2%
Non-dependent children 2%
Research
&
Statistics
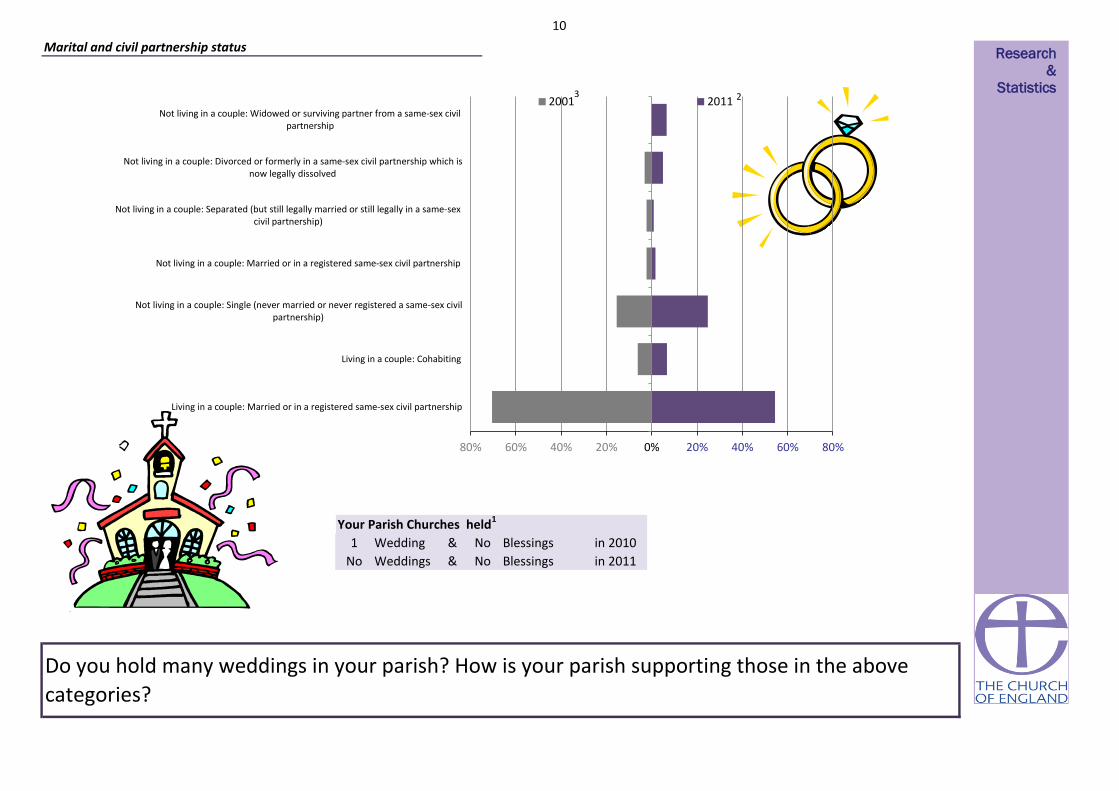
10
Wedding & Blessings in 2010
Weddings & Blessings in 2011
1 No
Marital and civil partnership status
No No
Your Parish Churches held1
Do you hold many weddings in your parish? How is your parish supporting those in the above
categories?
80% 60% 40% 20% 0% 20% 40% 60% 80%
Living in a couple: Married or in a registered same-sex civil partnership
Living in a couple: Cohabiting
Not living in a couple: Single (never married or never registered a same-sex civilpartnership)
Not living in a couple: Married or in a registered same-sex civil partnership
Not living in a couple: Separated (but still legally married or still legally in a same-sexcivil partnership)
Not living in a couple: Divorced or formerly in a same-sex civil partnership which isnow legally dissolved
Not living in a couple: Widowed or surviving partner from a same-sex civilpartnership
2001 2011
Research
&
Statistics 2 3
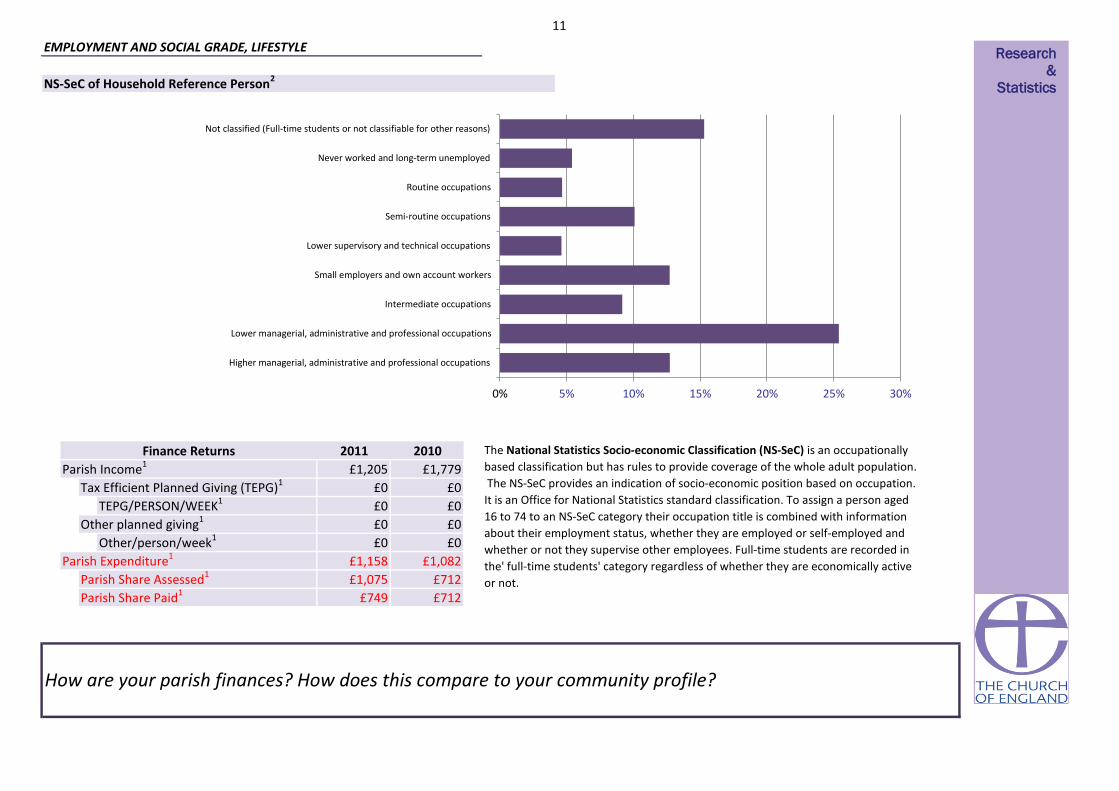
11
NS-SeC of Household Reference Person2
£1,779Parish Income12011
£0
£1,205
EMPLOYMENT AND SOCIAL GRADE, LIFESTYLE
The National Statistics Socio-economic Classification (NS-SeC) is an occupationally
based classification but has rules to provide coverage of the whole adult population.
The NS-SeC provides an indication of socio-economic position based on occupation.
It is an Office for National Statistics standard classification. To assign a person aged
16 to 74 to an NS-SeC category their occupation title is combined with information
about their employment status, whether they are employed or self-employed and
whether or not they supervise other employees. Full-time students are recorded in
the' full-time students' category regardless of whether they are economically active
or not.Parish Share Assessed1
Parish Share Paid1
£0
£0
£1,158
£1,075
£749
£0
£0Tax Efficient Planned Giving (TEPG)1
Finance Returns 2010
£0
£0
£0
£1,082
£712
£712
Parish Expenditure1
TEPG/PERSON/WEEK1
Other/person/week1Other planned giving1
How are your parish finances? How does this compare to your community profile?
Research
&
Statistics
0% 5% 10% 15% 20% 25% 30%
Higher managerial, administrative and professional occupations
Lower managerial, administrative and professional occupations
Intermediate occupations
Small employers and own account workers
Lower supervisory and technical occupations
Semi-routine occupations
Routine occupations
Never worked and long-term unemployed
Not classified (Full-time students or not classifiable for other reasons)

12
Proportion of population aged 60+ who are in
receipt of the Guaranteed part of Pension
Credit5
15%
Proportion of working age persons (16-74) with
no qualifications2 13%
Proportion of working age population who are
in receipt of a key out-of-work benefit5
No access to a car or van
EMPLOYMENT AND SOCIAL GRADE, LIFESTYLE
How much free time do residents of your parish have? How accessible are your churches to those
with/without cars?
Access to at least 1 car or van
Household Mobility2
<1%
6%
94%
Households
Part-time: 15 hours or less
worked 13%
Part-time: 16 to 30 hours worked
21%
Full-time: 31 to 48 hours worked
47%
Full-time: 49 or more hours
worked 19%
Hours Worked2
Part-time: 15 hours or less worked Part-time: 16 to 30 hours worked
Full-time: 31 to 48 hours worked Full-time: 49 or more hours worked
Research
&
Statistics

13
Church Schools in the parish
Sorry, we do not currently have
any Church Schools listed for this
parish.
EDUCATION AND SCHOOLS
How qualified are residents of your parish? What Church of England schools are available?
Parish2 2011 (proportion of 16+ population) National2 2011 (proportion of 16+ population)
12%
15%
16%
5% 9%
43%
1%
22%
13%
15% 4%
12%
27%
6% No qualifications (No formal qualifications)
Level 1 qualifications (1-4 GCSEs or equivalent)
Level 2 qualifications (5 GCSEs or equivalent)
Apprenticeships
Level 3 qualifications (2 or more A-levels orequivalent )
Level 4 qualifications and above (Bachelorsdegree or equivalent, and higher qualifications)
Other qualifications (including foreignqualifications)
Research
&
Statistics

14
Hours per week of provision of unpaid care2
General health2
20 - 49 50 +87% 11%
Good health Very good health
<1%
Day-to-day activities limited a lot Day-to-day activities limited a little Day-to-day activities not limited
3% 11% 86%
1% 15% 33% 51%
Are there people in your parish with health problems? Is there anything you can do to assist with
day-to-day activities of those who have health problems?
HEALTH
0
Long-term health problem or disability2
1 - 191% 1%
Very bad health Bad health Fair health
Research
&
Statistics

15
A low-level of skill or educational attainment is one indicator of social disadvantage. Qualifications may make it easier to find employment. Learning also helps promote active citizenship and combat social exclusion.
8%
50% most deprived
50% least deprived
10% least deprived
50% most deprived
50% least deprived
10% least deprived
50% least deprived
Deprivation Indicator Diocesan Position National Position
50% most deprived80
<1%
Deprivation is considered to be a multi-dimensional problem, encompassing a range of domains such as financial, health, education, services or crime. continuous measure of relative deprivation therefore there is no definitive point on the scale below
which areas are considered to be deprived and above which they are not.While being in the most deprived 10% may indicate financial disadvantage, it could equally be due to isolated living.
Number of people aged 16 to State Pension age claiming: Jobseeker’s Allowance (JSA), Employment and Support Allowance (ESA), Incapacity Benefit (IB), Income Support (IS) (as a lone parent or in the “other” category),
Other income related benefits.
Social housing is housing that is let at low rents and on a secure basis to people in housing need. It is generally provided by councils and not-for-profit organisations such as housing associations. Vulnerable groups are often
concentrated in the social housing sector, with low rates of employment and low income levels
Children in single parent families have a much higher risk of living in poverty than children in couple families. Single parents may rely on informal childcare.
What are the particular issues that affect your parish? Are you doing anything to address these?
10% least deprived
The proportion of children in families in receipr of either out of work benefits or tax credits where their reported income is less than 60% median income. Poor children may be excluded from participating in society. They may be unable to afford school
trips and activities; school uniforms or warm winter clothes, be unable to go swimming, have friends round for tea or celebrate their birthdays. Many will never have a holiday. Children who grow up poor are more likely to leave school without
qualifications, have lower employment chances, thus restricting their ability to get a good job and financially contribute to society.
50% least deprived
13% 50% least deprived
DEPRIVATION AND KEY ISSUES AFFECTING PARISHIONERS
Score
76
Lone Parent Households as a percentage of all households
with children2 (2011)
Pension Credit is an income related benefit made up of 2 parts - Guarantee Credit and Savings Credit. The guaranteed part tops up weekly income if it’s below £142.70 (single people) or £217.90 (couples) so those who
receive this are on a low income. This statistic only covers people living in private households, and not residential institutions (such as nursing homes).
10% least deprived
4%
15.9
50% most deprived15% 50% most deprived
50% most deprivedPercentage of Children under 16 in Poverty7 (2010)
Percentage of working age persons (16-74) with no
qualifications2 (2011)
50% most deprived
Life expectancy at birth can give an idea of overall quality of life. Life expectancy is an average. Women tend to have greater life expectancy. Life expectany can be affected by family history, marital status, economic status,
physique, exercise, diet, drug use including smoking and alcohol consumption, disposition, education, environment, sleep, climate, and health care.
Proportion of the population aged 60+ who are in receipt of
the Guaranteed part of Pension Credit5 (2012)
8%
Social rented as a percentage of all households2 (2011)
Index of Multiple Deprivation (IMD)8 (2010)
Proportion of the working age population who are in receipt
of a key out-of-work benefit5 (2012)
You parish can be categorised as in the most or least deprived 10% or 50% of all parishes within the diocese and of all parishes nationally
50% most deprived 50% most deprived
Life expectancy at birth (girls)6 (1999-2003)
Life Expectancy at birth (boys)6 (1999-2003)
Research
&
Statistics

16
0
00 0
*There are 5 full or partial LSOAs included in this parish
0 0
What are the particular issues that affect your parish? Are you doing anything to address these?
Income Deprivation Affecting Older
People Index
00
50% most deprived 50% most deprived
10% 1%
DEPRIVATION AND KEY ISSUES AFFECTING PARISHIONERSIt is important to note that these statistics are a measure of deprivation, not affluence, and to recognise that not every person in a highly deprived area will themselves be
deprived. Equally, there will be some deprived people living in the least deprived areas.
Deprivation covers a broad range of issues and refers to unmet needs caused by a lack of resources of all kinds, not just financial. The English Indices of Deprivation
attempt to measure a broader concept of multiple deprivation, made up of several distinct dimensions, or domains, of deprivation. Seven domains of deprivation are
combined to produce the overall Index of Multiple Deprivation. Each domain contains a number of component indicators. The English Indices of Deprivation are a
continuous measure of relative deprivation therefore there is no definitive point on the scale below which areas are considered to be deprived and above which they are
not. Deprived areas have been defined in this release as those containing LSOAs that are amongst the 10 per cent most deprived in England according to the overall Index
of Multiple Deprivation.
Overall IMD 0 000
5% 10%
15.9 50% most deprived
BARRIERS TO HOUSING AND SERVICES10% most deprived
Wider Barriers Sub-domain
Children/Young People Sub-domain16.9 0 0
0
0
50% most deprived 50% most deprived
0
0
0
0
0
-0.3
050% most deprived
3.3
73.2
22.1
22.0
47.7
Income Deprivation Affecting
Children Index0.1
CRIME AND DISORDER
LIVING ENVIRONMENT
Indoors Sub-domain
Outdoors Sub-domain
0
0
Geographical Barriers Sub-domain
31.4
50% most deprived
EDUCATION SKILLS AND TRAINING
50% most deprived 0
Number of LSOAs amongst
least deprived*Diocesan position National position
HEALTH DEPRIVATION AND
DISABILITY-0.3
Average
Score for
parishIMD Subdomains8 (2010)
INCOME
EMPLOYMENT 50% least deprived 0
Number of LSOAs amongst
most deprived*
1%
0
0
0
0
1
0
0
0
15.9
4
50% most deprived
50% most deprived
0
00
0
1
0
0.1
0.0
5%
0 0
100
0
0
0
0 0
0
0 0
0
0
0
0
0
0
0
50% most deprived
50% most deprived
50% most deprived
50% least deprived
50% least deprived
0 0 1
0Skills Sub-domain 14.9
0
0
0
0
00 0
0
0
0
0
0
0
0
00 0
0
0
0
0
0
50% least deprived
10% most deprived
50% least deprived
50% most deprived
50% most deprived 0
0
0
0.1 50% least deprived 0
0
5
10% most deprived
50% most deprived
50% most deprived
50% most deprived
50% most deprived
50% most deprived
0 0 0
50% most deprived
50% least deprived 50% least deprived
Research
&
Statistics

17
What to do next?
Your notes
WHAT TO DO NEXT
This spotlight has given you some information about your parish both in terms of your own church congregations and your local community. This is not an
end in itself, but rather a starting place for you to explore further. Questions to consider might include:
• What does our congregation look like?
• How does it compare to the local population?
• What other churches are there in the area? What parts of the community to they reach? Which parts of the community are being missed?
• What other local organisations or centres are there, that might bring people into our parish? Examples might be Hospitals or health centres, prisons, job
centres, homeless shelters, schools, charities, mother and toddler groups, uniformed organisations, community centres, libraries, shops, offices, stations?
How can we interact with these people?
• What areas of our parish do we know well or less well?
• How does the local community change between weekdays and weekends? How do our services and events fit with the shifting local population?
• Is our website/'A Church Near You' profile up to date?
• Are our records up to date?
****************************************************************************************************************************
Research
&
Statistics

18
http://www.londonstreetgangs.com/
Hint: Scroll to the bottom of the "Gang Maps" page to see boundaries.
AboutMyArea - The local interactive site - news, reviews, what's on, events, businesses
Research & Statistics GIS
http://www.churchofengland.org/about-us/facts-stats/research-statistics/census-2011.aspx
Church Urban Fund
www.cuf.org.uk
Homeless Pages - Information, Research and Publications on homelessness
http://www.homelesspages.org.uk/
http://www.upmystreet.com/
Hint: Use the "My Neighbourhood" tab
The network of Public Health Observatories - Health Profiles
www.apho.org.uk/resource/view.aspx?RID=91736
The Poverty Site - Geographic Analysis
www.poverty.org.uk/summary/regional.shtml
http://www.apho.org.uk/default.aspx?QN=HP_FINDSEARCH2011
MurderMap - London Homicide Reported Direct from The Old Bailey
Police.uk - Local crime and policing information for England and Wales
http://www.police.uk/
ONS - Neighbourhood Statistics
http://www.aboutmyarea.co.uk/
http://neighbourhood.statistics.gov.uk/
Hint: Use the summary box
http://www.murdermap.co.uk/
London Street Gangs - Territory maps and background information
UpMyStreet - UK house prices, property, crime, local neighbourhood & schools
Sources of further information
Public Health Observatories - APHO JSNA Datasets (The datasets are intended to cover a
range of issues, focused on underlying determinants of health and conditions which account
for substantial numbers of preventable diseases and deaths.)
A Church Near You
www.achurchnearyou.com
Research
&
Statistics

19
Proportion of the population aged 60+ who are in receipt of the Guaranteed part of Pension Credit (August 2012)
Estimated using LSOA level data sourced from http://83.244.183.180/NESS/BEN/iben.htm
Proportion of the working age population who are in receipt of a key out-of-work benefit (Q3 2012)
Life Expectancy at birth (boys) (1999-2003)
Estimated using ward level data from ONS.
Life expectancy at birth (girls) (1999-2003)
Estimated using ward level data from ONS.
Percentage of Children under 16 in Poverty (2009)
Estimated using LSOA level data from http://www.hmrc.gov.uk/statistics/child-poverty-stats.htm
IMD (2010)
Estimated using LSOA level data from Communities and Local Government, 2010.
https://www.gov.uk/government/uploads/system/uploads/attachment_data/file/6320/1870718.pdf
When quoting figures derived from this data, care should be taken with the level of accuracy quoted.
2007 Church Diversity Survey
DWP
ONS
HMRC
Department for Communities and Local Government
1
2
3
4
5
6
7
8
These have been collected annually between 2007 and 2011 by the Research and Statistics team, Archbishops’ Council
Methodology: Government data is published on government boundaries that do not match ecclesiastical boundaries. In order to produce parish population and demographic
estimates we have worked with the ONS to use a best fit modelling process. As such, these statistics can only be considered estimates and, particularly in very diverse areas, are
best used in the context of local knowledge. Where parish populations are sparse the figures for government areas overlapping the parish are used.
Parish estimates from the census have been calculated using the census output area data published by the ONS. These are provisional estimates, and when more granular data at
postcode level is available, will be revised. Estimates have been modelled by allocating the population weighted centroid of each output area to the parish within which it falls.
This means that some parishes have not been allocated population, however proportions for demographic variables have been calculated based on the output areas
overlaying the parish.
For further information about this process, please contact [email protected].
Contains public sector information licensed under the Open Government Licence v1.0 http://www.nationalarchives.gov.uk/doc/open-government-licence/
Estimated using OA level data sourced from ONS Census Data 2011, ONS
Estimated using OA level data sourced from ONS Census Data 2001, ONS
When analysing data, it is important to consider that some parishes are very small and proportions may be very large even where very few cases meet the criteria.
ABOUT THIS DATA
http://www.churchofengland.org/about-us/facts-stats/research-statistics/clergydiversityaudit2005linkpage.aspx
Estimated using OA level data from DWP Information, Governance and Security Directorate from
http://statistics.dwp.gov.uk/asd/asd1/tabtools/census_output_area_data/index.php?page=census_output_area_data
Annual parochial returns
ONS Census data 2011
ONS Census data 2001
Research
&
Statistics

1
Getting to know your parish
What is this spotlight?
How should I use it?
Questions
Contents
This short spotlight brings together a range of information about your parish,
both in terms of your congregations, but also the wider community living in
your area. It covers areas such as Christian affiliation, population age and
ethnicity profiles, household structures, deprivation, employment, schools
and qualifications, alongside church statistics such as attendance and giving.
There is information at the end of the spotlight about where this data comes
from and how it was calculated. If you have any further queries then please
do contact the Research and Statistics team at
This spotlight is not an end in itself, but rather a starting place for you to
explore further. You may want to discuss it at a PCC meeting or with
leadership teams. We’ve included some questions on each page to help you
to think about the information, however some things will be of more
relevance in some areas than others, and these are just suggestions to get
you started. We’ve also included some bigger questions about what to do
next at the end of the spotlight on page 17. There’s space for you to write
some notes here. It might be helpful to write a short paragraph to
summarise your community profile or note down anything that has struck
you as particularly important. There are also details at the end for where
you can find further information should you want to dig a little deeper.
1. Summary: a brief overview of your parish, including what look to be 5 of
the most pressing social issues in your area
2. Age: age profile of your community
3. Ethnicity: ethnicity profile of your community
4. Integration: English language speaking and length of UK residency in your
community
5. Religious affiliation: religious affiliation in your community
6. Households: families, dependents, one person households, temporary
residents and housing tenure
7. Marital and civil partnership status
8. Employment: occupations, benefits and mobility in your community
9. Education: CofE schools and qualification levels in your community
10. Health: people with health problems and carers in your community
11. Deprivation: different types of deprivation in your community
Research
&
Statistics
2
Parishioners at glance
Hethe: St Edmund & St George
2011 Tax Efficient Planned
Giving/person/week1
2011 Electoral
Roll1
Housing Access
Housing Conditions
Local Amenities
79%
73%
Issues to look out for in your parish
£3
Annual Parochial Returns
Oct
ob
er W
eekl
y
Att
end
ance
1
0-4
5-15
2011 Parish
Share Paid1
26
PARISH OVERVIEW
18%
Parish
5%
12%
65%
Age Profile (20112)300
Proportion Christian
Sorry, no Fresh Expressions listed for this parish.Fresh Expressions
300
BICESTER & ISLIP
OXFORD
16-64
Age
Gro
up
Diocese
627041
Deanery
Archdeaconry
20013
20112
20013
20112
Included Churches
Oxford
Population
Elderly Deprivation
Parish of: Hethe
Parish Code: 270041
65 +
£5,229
Housing Costs
Research
&
Statistics
0
10
20
30
40
2007 2008 2009 2010 2011
Highestweek
Average
LowestWeek
3
Parish 20112 Deanery 20112 Diocese 20112
Demographics: AGE PROFILE AND ATTENDANCE AT SERVICES
Does the age profile of your congregation match that of your parish? Are you engaging with the
parish's largest demographic: those aged 45 - 59?
30% 20% 10% 0% 10% 20% 30%
0 - 4
5 - 7
8 - 9
10 - 14
15
16 - 17
18 - 19
20 - 24
25 - 29
30 - 44
45 - 59
60 - 64
65 - 74
75 - 84
85 - 89
90 & overAge profile of parish populations 20013 & 20112
Parish2011
Parish2001
0% 10% 20% 30%
0 - 14
15 - 29
30 - 44
45 - 59
60 - 74
75 - 89
90 & over
0% 10% 20% 30%
0 - 14
15 - 29
30 - 44
45 - 59
60 - 74
75 - 89
90 & over
0% 5% 10% 15% 20% 25%
0 - 14
15 - 29
30 - 44
45 - 59
60 - 74
75 - 89
90 & over
Research
&
Statistics

4
15%
Diocesan Congregation4 (2007)
Parish Population2 (2011)
(nearest 50)
Demographics: AGE PROFILE AND ATTENDANCE AT SERVICES
Comparable Age profile of Adults
25%
65 +
40%
Age
-
50
18 - 44
22% 38%
200
50
0 - 4
5 - 15
16 - 64
Diocesan Core Congregation Age Profile4 (2007)
Diocesan Population2 (2011) 37%
45 - 64
Does the age profile of your congregation match that of your parish?
65 +
Infant Baptisms
20111
1
Highest Weeks
Attendance 20111
10
25
9%
13%
16%
22%
40%
0% 10% 20% 30% 40% 50%
Research
&
Statistics

5
Detailed Parish Ethnicity2 2011
Parish Ethnicity2 2011 Parish Ethnicity3 2001 Diocese Ethnicity2 2011
Arab Other Ethnic Group
0%0%
Indian Bangladeshi Chinese
African Caribbean
Parish
Percentage
ME: 0%
Other Asian
0%
Does the ethnicity profile of your congregation match that of your parish? Are you engaging with the parish's
largest demographics: those describing themselves as White or Mixed/Multiple ethnic group?
0%
3%
0%0% 0%
<1%
0%0%
Demographics: ETHNICITY
0%
99%
Other White
<1%
White & Asian Other Mixed
0%
0%
0%
British
White & Black
Caribbean
Diocesan Population2 (2011)
Diocesan Core Congregation4 (aged 18+ only) (2007)
Percentage Minority Ethnic Background
15%
0%
Irish
Pakistani
0%
Other Black
Gypsy or Irish
Traveller
White & Black
African
Research
&
Statistics
White
Mixed/Multipleethnic group
Asian/Asian British
Black or BlackBritish
Other ethnicgroup

6
Cannot speak English well or cannot speak
English Can speak English well or very well
0% <1%Have English as their main language (English or
Welsh if in Wales)
100%2Percentage of people who
Demographics: Integration
10 years or more
97%
2 years or more but less
than 5 years
Born in the UK
Less than 2 years
0% <1% 1%
5 years or more but less
than 10 years
Are services in your parish accessible to all residents? Do you offer any services in foreign
languages? What can you offer those who may not have been in the UK for long?
2Resident in UK:
1%
Research
&
Statistics

7
In your parish 73% of the population (that is 200 people) declared themselves as Christian in 2011
51
Statistics from the Annual
Parochial Returns 2011
Easter Communicants1
Easter Day Attendance1
Christmas Communicants1
Christmas Attendance1
Christians in your Parish
RELIGIOUS AFFILIATION
0
27
0
How has the religious affiliation of those living in your parish changed over the past decade? How closely does
it match that of the Diocese as a whole? Are Christians in your parish engaging with your churches? How are
you engaging with other faith groups?
0% 10% 20% 30% 40% 50% 60% 70% 80% 90% 100%
Parish 2001
Parish 2011
Diocese 2011
Christian Buddhist Hindu Jewish Muslim Sikh Other religions No religion Religion not stated
2
3
National Average Percentage Christian2 (59.4%)
Research
&
Statistics
2
2

8
Household Spaces2 2011
With at least one usual resident i.e. not vacant 92%
0%Caravan or other mobile or temporary structure
100 <50 <50
Who lives in your parish? Are there issues with access to housing? How permenant are your
parishioners?
Tenure2
Social rented as a percentage of all households2 18%
Social Rented householdsOwner occupied households
(including shared ownership)
Private Rented households
(including those living rent free)
HOUSEHOLDS, LIFESTYLE AND THE COMMUNITY I Research
&
Statistics

9
Household composition in your parish2 All
percentages are of the total number of
households with residents. The smaller pie
charts show the breakdown of a section of
the larger ones. You can use the colours to
match.
Lone Parent
Households as a
percentage of all
households with
children2
13%
Who lives in your parish? Are there a lot of households with children? What about lone parent
households? Are there a lot of people living alone?
HOUSEHOLDS, LIFESTYLE AND THE COMMUNITY II
Aged 65 and over 12% Other 13%
One Person 26%
One family 67%
Other households
7%
Dependent children 4%
Other 4%
Aged 65 and over 12%
Married or same-sex civil partnership couple 36%
Cohabiting couple 12%
Lone parent 7%
No children 12%
Dependent children 16%
Non-dependent children 8%
No children 6% Dependent
children 5%
Non-dependent
children <1%
Dependent children 4%
Non-dependent children 4%
Research
&
Statistics
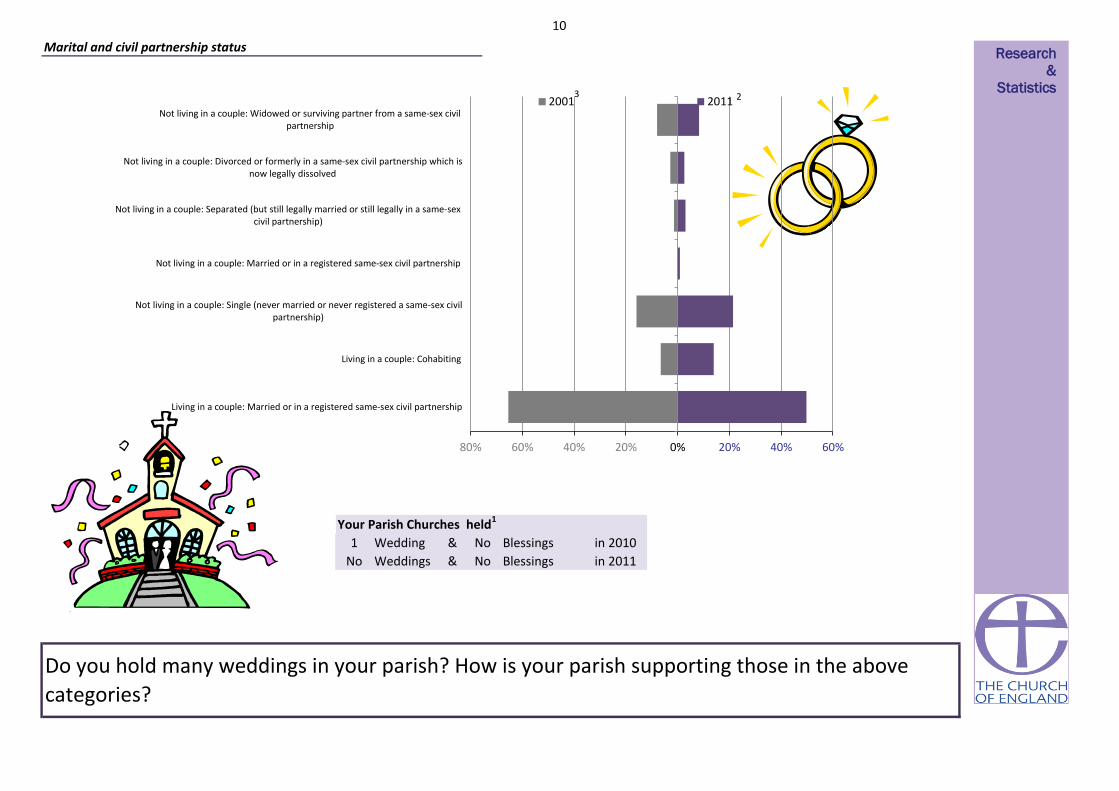
10
Wedding & Blessings in 2010
Weddings & Blessings in 2011No No
Your Parish Churches held1
Do you hold many weddings in your parish? How is your parish supporting those in the above
categories?
1 No
Marital and civil partnership status
80% 60% 40% 20% 0% 20% 40% 60%
Living in a couple: Married or in a registered same-sex civil partnership
Living in a couple: Cohabiting
Not living in a couple: Single (never married or never registered a same-sex civilpartnership)
Not living in a couple: Married or in a registered same-sex civil partnership
Not living in a couple: Separated (but still legally married or still legally in a same-sexcivil partnership)
Not living in a couple: Divorced or formerly in a same-sex civil partnership which isnow legally dissolved
Not living in a couple: Widowed or surviving partner from a same-sex civilpartnership
2001 2011
Research
&
Statistics 2 3
11
£3
£0
£0
£8,639
£4,936
£4,936
Parish Expenditure1
TEPG/PERSON/WEEK1
Other/person/week1Other planned giving1
How are your parish finances? How does this compare to your community profile?
£1,830
£6,386
EMPLOYMENT AND SOCIAL GRADE, LIFESTYLE
The National Statistics Socio-economic Classification (NS-SeC) is an occupationally
based classification but has rules to provide coverage of the whole adult population.
The NS-SeC provides an indication of socio-economic position based on occupation.
It is an Office for National Statistics standard classification. To assign a person aged
16 to 74 to an NS-SeC category their occupation title is combined with information
about their employment status, whether they are employed or self-employed and
whether or not they supervise other employees. Full-time students are recorded in
the' full-time students' category regardless of whether they are economically active
or not.Parish Share Assessed1
Parish Share Paid1
£0
£0
£7,820
£5,555
£5,229
£3
£1,760Tax Efficient Planned Giving (TEPG)1
Finance Returns 2010
NS-SeC of Household Reference Person2
£13,949Parish Income12011
Research
&
Statistics
0% 5% 10% 15% 20% 25%
Higher managerial, administrative and professional occupations
Lower managerial, administrative and professional occupations
Intermediate occupations
Small employers and own account workers
Lower supervisory and technical occupations
Semi-routine occupations
Routine occupations
Never worked and long-term unemployed
Not classified (Full-time students or not classifiable for other reasons)

12
15%
85%
Households
5%
EMPLOYMENT AND SOCIAL GRADE, LIFESTYLE
How much free time do residents of your parish have? How accessible are your churches to those
with/without cars?
Access to at least 1 car or van
Household Mobility2
Proportion of population aged 60+ who are in
receipt of the Guaranteed part of Pension
Credit5
13%
Proportion of working age persons (16-74) with
no qualifications2 25%
Proportion of working age population who are
in receipt of a key out-of-work benefit5
No access to a car or van
Part-time: 15 hours or less
worked 13%
Part-time: 16 to 30 hours worked
17%
Full-time: 31 to 48 hours worked
54%
Full-time: 49 or more hours
worked 17%
Hours Worked2
Part-time: 15 hours or less worked Part-time: 16 to 30 hours worked
Full-time: 31 to 48 hours worked Full-time: 49 or more hours worked
Research
&
Statistics

13
Church Schools in the parish
Parish2 2011 (proportion of 16+ population) National2 2011 (proportion of 16+ population)
EDUCATION AND SCHOOLS
How qualified are residents of your parish? What Church of England schools are available?
Sorry, we do not currently have
any Church Schools listed for this
parish.
22%
13%
19% 3%
9%
31%
3%
22%
13%
15% 4%
12%
27%
6% No qualifications (No formal qualifications)
Level 1 qualifications (1-4 GCSEs or equivalent)
Level 2 qualifications (5 GCSEs or equivalent)
Apprenticeships
Level 3 qualifications (2 or more A-levels orequivalent )
Level 4 qualifications and above (Bachelorsdegree or equivalent, and higher qualifications)
Other qualifications (including foreignqualifications)
Research
&
Statistics

14
Hours per week of provision of unpaid care2
1% 3%
Very bad health Bad health Fair health
1 - 19
Are there people in your parish with health problems? Is there anything you can do to assist with
day-to-day activities of those who have health problems?
HEALTH
0
Long-term health problem or disability2
50 +89% 7%
Good health Very good health
1%
Day-to-day activities limited a lot Day-to-day activities limited a little Day-to-day activities not limited
7% 7% 86%
3% 9% 30% 57%
General health2
20 - 49
Research
&
Statistics

15
You parish can be categorised as in the most or least deprived 10% or 50% of all parishes within the diocese and of all parishes nationally
50% least deprived 50% least deprived
Life expectancy at birth (girls)6 (1999-2003)
Life Expectancy at birth (boys)6 (1999-2003)
18%
13.3
50% most deprived13% 50% most deprived
50% most deprivedPercentage of Children under 16 in Poverty7 (2010)
Percentage of working age persons (16-74) with no
qualifications2 (2011)
10% least deprived
Life expectancy at birth can give an idea of overall quality of life. Life expectancy is an average. Women tend to have greater life expectancy. Life expectany can be affected by family history, marital status, economic status,
physique, exercise, diet, drug use including smoking and alcohol consumption, disposition, education, environment, sleep, climate, and health care.
Proportion of the population aged 60+ who are in receipt of
the Guaranteed part of Pension Credit5 (2012)
10%
Social rented as a percentage of all households2 (2011)
Index of Multiple Deprivation (IMD)8 (2010)
Proportion of the working age population who are in receipt
of a key out-of-work benefit5 (2012)
Lone Parent Households as a percentage of all households
with children2 (2011)
Pension Credit is an income related benefit made up of 2 parts - Guarantee Credit and Savings Credit. The guaranteed part tops up weekly income if it’s below £142.70 (single people) or £217.90 (couples) so those who
receive this are on a low income. This statistic only covers people living in private households, and not residential institutions (such as nursing homes).
50% most deprived
The proportion of children in families in receipr of either out of work benefits or tax credits where their reported income is less than 60% median income. Poor children may be excluded from participating in society. They may be unable to afford school
trips and activities; school uniforms or warm winter clothes, be unable to go swimming, have friends round for tea or celebrate their birthdays. Many will never have a holiday. Children who grow up poor are more likely to leave school without
qualifications, have lower employment chances, thus restricting their ability to get a good job and financially contribute to society.
50% least deprived
25% 10% most deprived
DEPRIVATION AND KEY ISSUES AFFECTING PARISHIONERS
Score
79
10% least deprived88
5%
Deprivation is considered to be a multi-dimensional problem, encompassing a range of domains such as financial, health, education, services or crime. continuous measure of relative deprivation therefore there is no definitive point on the scale below
which areas are considered to be deprived and above which they are not.While being in the most deprived 10% may indicate financial disadvantage, it could equally be due to isolated living.
Number of people aged 16 to State Pension age claiming: Jobseeker’s Allowance (JSA), Employment and Support Allowance (ESA), Incapacity Benefit (IB), Income Support (IS) (as a lone parent or in the “other” category),
Other income related benefits.
Social housing is housing that is let at low rents and on a secure basis to people in housing need. It is generally provided by councils and not-for-profit organisations such as housing associations. Vulnerable groups are often
concentrated in the social housing sector, with low rates of employment and low income levels
Children in single parent families have a much higher risk of living in poverty than children in couple families. Single parents may rely on informal childcare.
What are the particular issues that affect your parish? Are you doing anything to address these?
50% least deprived
Deprivation Indicator Diocesan Position National Position
A low-level of skill or educational attainment is one indicator of social disadvantage. Qualifications may make it easier to find employment. Learning also helps promote active citizenship and combat social exclusion.
13%
50% least deprived
50% most deprived
50% least deprived
50% most deprived
50% most deprived
50% most deprived
50% least deprived
Research
&
Statistics

16
0
0.2 50% most deprived 0
0
0
50% most deprived
50% most deprived
10% most deprived
50% least deprived
50% most deprived
10% most deprived
0 0 0
50% most deprived
50% least deprived 50% least deprived
00 0
0
0
0
0
0
50% least deprived
50% most deprived
50% least deprived
50% most deprived
50% most deprived
50% least deprived
10% least deprived
50% least deprived
0 0 0
0Skills Sub-domain 6.5
0
1
0
0
00 0
0
0
0
0
0
0
0
0
0
0
0 0
0
0 0
0
0
0
1
0
0
0
0
1
0
0.1
0.0
5%
0 0
00050% most deprived
0
0
0
0
0
0
0
4.8
1
10% least deprived
50% least deprived
0
00
50% least deprived 0
0
50% least deprived 0
50% least deprived 0
Number of LSOAs amongst
least deprived*Diocesan position National position
HEALTH DEPRIVATION AND
DISABILITY-0.4
Average
Score for
parishIMD Subdomains8 (2010)
INCOME
EMPLOYMENT
Number of LSOAs amongst
most deprived*
1%
0
Income Deprivation Affecting
Children Index0.1
CRIME AND DISORDER
LIVING ENVIRONMENT
Indoors Sub-domain
Outdoors Sub-domain
0
0
Geographical Barriers Sub-domain
28.6
10% most deprived
EDUCATION SKILLS AND TRAINING
BARRIERS TO HOUSING AND SERVICES10% most deprived
Wider Barriers Sub-domain
Children/Young People Sub-domain3.1 0 0
0
0
50% least deprived 50% least deprived
1
0
0
0
0
-1.2
050% most deprived
2.3
87.5
12.8
19.8
50.2
50% most deprived 50% most deprived
10% 1%
DEPRIVATION AND KEY ISSUES AFFECTING PARISHIONERSIt is important to note that these statistics are a measure of deprivation, not affluence, and to recognise that not every person in a highly deprived area will themselves be
deprived. Equally, there will be some deprived people living in the least deprived areas.
Deprivation covers a broad range of issues and refers to unmet needs caused by a lack of resources of all kinds, not just financial. The English Indices of Deprivation
attempt to measure a broader concept of multiple deprivation, made up of several distinct dimensions, or domains, of deprivation. Seven domains of deprivation are
combined to produce the overall Index of Multiple Deprivation. Each domain contains a number of component indicators. The English Indices of Deprivation are a
continuous measure of relative deprivation therefore there is no definitive point on the scale below which areas are considered to be deprived and above which they are
not. Deprived areas have been defined in this release as those containing LSOAs that are amongst the 10 per cent most deprived in England according to the overall Index
of Multiple Deprivation.
Overall IMD 0 000
5% 10%
13.3 50% most deprived
00
00 0
*There is 1 full or partial LSOA included in this parish
0 0
What are the particular issues that affect your parish? Are you doing anything to address these?
Income Deprivation Affecting Older
People Index
0
Research
&
Statistics

17
This spotlight has given you some information about your parish both in terms of your own church congregations and your local community. This is not an
end in itself, but rather a starting place for you to explore further. Questions to consider might include:
• What does our congregation look like?
• How does it compare to the local population?
• What other churches are there in the area? What parts of the community do they reach? Which parts of the community are being missed?
• What other local organisations or centres are there, that might bring people into our parish? Examples might be Hospitals or health centres, prisons, job
centres, homeless shelters, schools, charities, mother and toddler groups, uniformed organisations, community centres, libraries, shops, offices, stations?
How can we interact with these people?
• What areas of our parish do we know well or less well?
• How does the local community change between weekdays and weekends? How do our services and events fit with the shifting local population?
• Is our website/'A Church Near You' profile up to date?
• Are our records up to date?
****************************************************************************************************************************
What to do next?
Your notes
WHAT TO DO NEXT Research
&
Statistics

18
Sources of further information
Public Health Observatories - APHO JSNA Datasets (The datasets are intended to cover a
range of issues, focused on underlying determinants of health and conditions which account
for substantial numbers of preventable diseases and deaths.)
A Church Near You
www.achurchnearyou.com
UpMyStreet - UK house prices, property, crime, local neighbourhood & schools
London Street Gangs - Territory maps and background information
http://www.londonstreetgangs.com/
Hint: Scroll to the bottom of the "Gang Maps" page to see boundaries.
AboutMyArea - The local interactive site - news, reviews, what's on, events, businesses
Research & Statistics GIS
http://www.churchofengland.org/about-us/facts-stats/research-statistics/census-2011.aspx
Church Urban Fund
www.cuf.org.uk
Homeless Pages - Information, Research and Publications on homelessness
http://www.homelesspages.org.uk/
http://www.upmystreet.com/
Hint: Use the "My Neighbourhood" tab
The network of Public Health Observatories - Health Profiles
www.apho.org.uk/resource/view.aspx?RID=91736
The Poverty Site - Geographic Analysis
www.poverty.org.uk/summary/regional.shtml
http://www.apho.org.uk/default.aspx?QN=HP_FINDSEARCH2011
MurderMap - London Homicide Reported Direct from The Old Bailey
Police.uk - Local crime and policing information for England and Wales
http://www.police.uk/
ONS - Neighbourhood Statistics
http://www.aboutmyarea.co.uk/
http://neighbourhood.statistics.gov.uk/
Hint: Use the summary box
http://www.murdermap.co.uk/
Research
&
Statistics

19
Proportion of the population aged 60+ who are in receipt of the Guaranteed part of Pension Credit (August 2012)
Estimated using LSOA level data sourced from http://83.244.183.180/NESS/BEN/iben.htm
Proportion of the working age population who are in receipt of a key out-of-work benefit (Q3 2012)
Life Expectancy at birth (boys) (1999-2003)
Estimated using ward level data from ONS.
Life expectancy at birth (girls) (1999-2003)
Estimated using ward level data from ONS.
Percentage of Children under 16 in Poverty (2009)
Estimated using LSOA level data from http://www.hmrc.gov.uk/statistics/child-poverty-stats.htm
IMD (2010)
Methodology: Government data is published on government boundaries that do not match ecclesiastical boundaries. In order to produce parish population and demographic
estimates we have worked with the ONS to use a best fit modelling process. As such, these statistics can only be considered estimates and, particularly in very diverse areas, are
best used in the context of local knowledge. Where parish populations are sparse the figures for government areas overlapping the parish are used.
Parish estimates from the census have been calculated using the census output area data published by the ONS. These are provisional estimates, and when more granular data at
postcode level is available, will be revised. Estimates have been modelled by allocating the population weighted centroid of each output area to the parish within which it falls.
This means that some parishes have not been allocated population, however proportions for demographic variables have been calculated based on the output areas overlaying
the parish.
For further information about this process, please contact [email protected].
Contains public sector information licensed under the Open Government Licence v1.0 http://www.nationalarchives.gov.uk/doc/open-government-licence/
Estimated using OA level data sourced from ONS Census Data 2011, ONS
Estimated using OA level data sourced from ONS Census Data 2001, ONS
When analysing data, it is important to consider that some parishes are very small and proportions may be very large even where very few cases meet the criteria.
ABOUT THIS DATA
http://www.churchofengland.org/about-us/facts-stats/research-statistics/clergydiversityaudit2005linkpage.aspx
Estimated using OA level data from DWP Information, Governance and Security Directorate from
http://statistics.dwp.gov.uk/asd/asd1/tabtools/census_output_area_data/index.php?page=census_output_area_data
Annual parochial returns
ONS Census data 2011
ONS Census data 2001
2007 Church Diversity Survey
DWP
ONS
HMRC
Department for Communities and Local Government
1
2
3
4
5
6
7
8
These have been collected annually between 2007 and 2011 by the Research and Statistics team, Archbishops’ Council
When quoting figures derived from this data, care should be taken with the level of accuracy quoted.
Estimated using LSOA level data from Communities and Local Government, 2010.
https://www.gov.uk/government/uploads/system/uploads/attachment_data/file/6320/1870718.pdf
Research
&
Statistics

1
Contents
This short spotlight brings together a range of information about your parish,
both in terms of your congregations, but also the wider community living in
your area. It covers areas such as Christian affiliation, population age and
ethnicity profiles, household structures, deprivation, employment, schools
and qualifications, alongside church statistics such as attendance and giving.
There is information at the end of the spotlight about where this data comes
from and how it was calculated. If you have any further queries then please
do contact the Research and Statistics team at
This spotlight is not an end in itself, but rather a starting place for you to
explore further. You may want to discuss it at a PCC meeting or with
leadership teams. We’ve included some questions on each page to help you
to think about the information, however some things will be of more
relevance in some areas than others, and these are just suggestions to get
you started. We’ve also included some bigger questions about what to do
next at the end of the spotlight on page 17. There’s space for you to write
some notes here. It might be helpful to write a short paragraph to
summarise your community profile or note down anything that has struck
you as particularly important. There are also details at the end for where
you can find further information should you want to dig a little deeper.
1. Summary: a brief overview of your parish, including what look to be 5 of
the most pressing social issues in your area
2. Age: age profile of your community
3. Ethnicity: ethnicity profile of your community
4. Integration: English language speaking and length of UK residency in your
community
5. Religious affiliation: religious affiliation in your community
6. Households: families, dependents, one person households, temporary
residents and housing tenure
7. Marital and civil partnership status
8. Employment: occupations, benefits and mobility in your community
9. Education: CofE schools and qualification levels in your community
10. Health: people with health problems and carers in your community
11. Deprivation: different types of deprivation in your community
Getting to know your parish
What is this spotlight?
How should I use it?
Questions
Research
&
Statistics

2
Parishioners at glance
Parish of: Heythrop
Parish Code: 270081
65 +
-
20013
20112
Population
Female Life ExpectancyLocal Amenities
Diocese
627081
Deanery
PARISH OVERVIEW
24%
Archdeaconry
16-64
Age
Gro
up
20013 200
20112 Not available
Heythrop: St Nicholas
Included Churches
Oxford
Housing Access
Male Life expectancy
Housing Conditions
76%
73%
Issues to look out for in your parish
£7
Annual Parochial Returns
Oct
ob
er W
eekl
y
Att
end
ance
1
4%
14%
58%
Age Profile (20112)
Proportion Christian
Sorry, no Fresh Expressions listed for this parish.Fresh Expressions
CHIPPING NORTON
OXFORD
0-4
5-15
2011 Parish
Share Paid1
13
Parish
2011 Tax Efficient Planned
Giving/person/week1
2011 Electoral
Roll1
Research
&
Statistics
0
5
10
15
20
25
2007 2008 2009 2010 2011
Highestweek
Average
LowestWeek
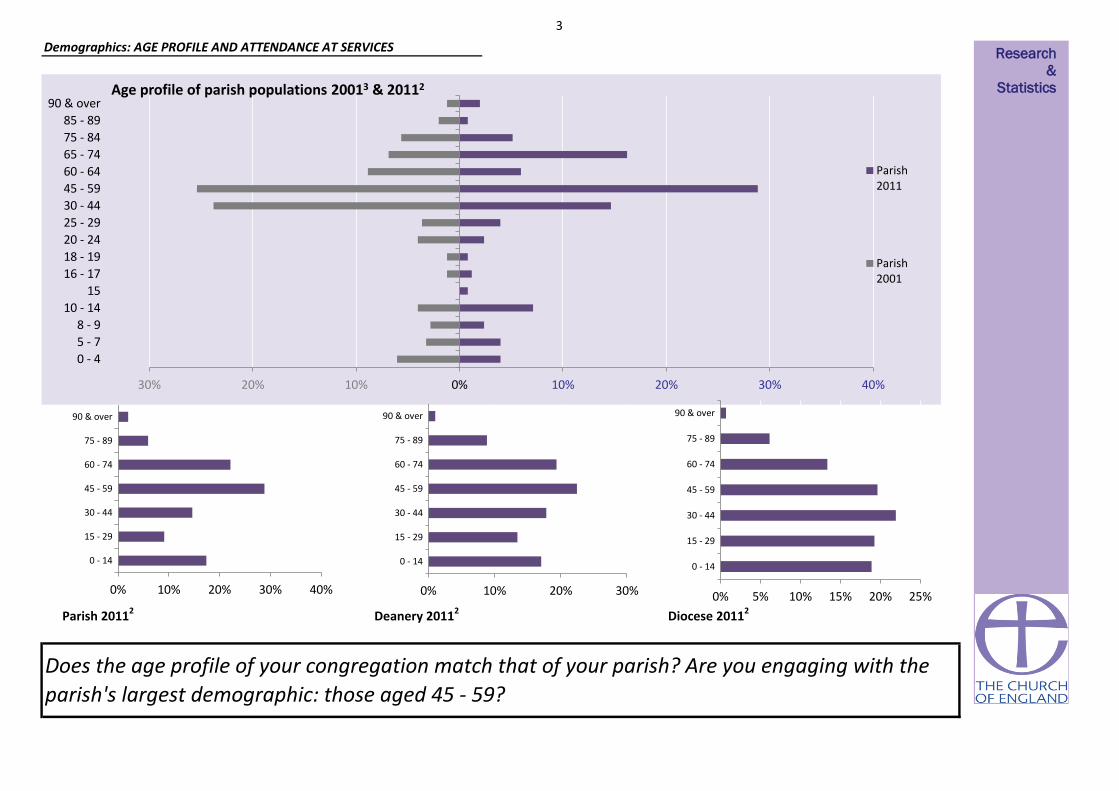
3
Parish 20112 Deanery 20112 Diocese 20112
Does the age profile of your congregation match that of your parish? Are you engaging with the
parish's largest demographic: those aged 45 - 59?
Demographics: AGE PROFILE AND ATTENDANCE AT SERVICES
30% 20% 10% 0% 10% 20% 30% 40%
0 - 4
5 - 7
8 - 9
10 - 14
15
16 - 17
18 - 19
20 - 24
25 - 29
30 - 44
45 - 59
60 - 64
65 - 74
75 - 84
85 - 89
90 & overAge profile of parish populations 20013 & 20112
Parish2011
Parish2001
0% 10% 20% 30% 40%
0 - 14
15 - 29
30 - 44
45 - 59
60 - 74
75 - 89
90 & over
0% 10% 20% 30%
0 - 14
15 - 29
30 - 44
45 - 59
60 - 74
75 - 89
90 & over
0% 5% 10% 15% 20% 25%
0 - 14
15 - 29
30 - 44
45 - 59
60 - 74
75 - 89
90 & over
Research
&
Statistics

4
-
Infant Baptisms
20111Comparable Age profile of Adults
15%
Diocesan Congregation4 (2007)
Parish Population2 (2011)
(nearest 50)
Demographics: AGE PROFILE AND ATTENDANCE AT SERVICES
37%
45 - 64
Does the age profile of your congregation match that of your parish?
65 +
0
Highest Weeks
Attendance 20111
- 4%
14%
58%
24%
0 - 4
5 - 15
16 - 64
Diocesan Core Congregation Age Profile4 (2007)
Diocesan Population2 (2011) 25%
65 +
40%
Age18 - 44
22% 38%
9%
13%
16%
22%
40%
0% 10% 20% 30% 40% 50%
Research
&
Statistics

5
Detailed Parish Ethnicity2 2011
Other Black
Gypsy or Irish
Traveller
White & Black
African
1%
Irish
Pakistani
0%
Diocesan Population2 (2011)
Diocesan Core Congregation4 (aged 18+ only) (2007)
Percentage Minority Ethnic Background
15%
British
White & Black
Caribbean
IndianParish
Percentage
ME: <1%
Other Asian
<1%
0%
White & Asian Other Mixed
<1%
0%
<1%
<1%
94%
Other White
5%
3%
<1%
Does the ethnicity profile of your congregation match that of your parish? Are you engaging with the parish's
largest demographics: those describing themselves as White or Asian/Asian British?
Arab Other Ethnic Group
0%0%
<1%
<1%
<1%<1%
Demographics: ETHNICITY
<1%
Bangladeshi Chinese
African Caribbean
Parish Ethnicity2 2011 Parish Ethnicity3 2001 Diocese Ethnicity2 2011
Research
&
Statistics
White
Mixed/Multipleethnic group
Asian/Asian British
Black or BlackBritish
Other ethnicgroup

6
1% 8%
5 years or more but less
than 10 years
Are services in your parish accessible to all residents? Do you offer any services in foreign
languages? What can you offer those who may not have been in the UK for long?
2Resident in UK:
1%
Have English as their main language (English or
Welsh if in Wales)
10 years or more
90%
2 years or more but less
than 5 years
Born in the UK
Less than 2 years
1%
<1% 2% 98%2Percentage of people who
Demographics: Integration
Cannot speak English well or cannot speak
English Can speak English well or very well
Research
&
Statistics

7
0
0
0
RELIGIOUS AFFILIATION
In your parish 73% of the population declared themselves as Christian in 2011
How has the religious affiliation of those living in your parish changed over the past decade? How closely does
it match that of the Diocese as a whole? Are Christians in your parish engaging with your churches? How are
you engaging with other faith groups?
0
Statistics from the Annual
Parochial Returns 2011
Easter Communicants1
Easter Day Attendance1
Christmas Communicants1
Christmas Attendance1
Christians in your Parish
0% 10% 20% 30% 40% 50% 60% 70% 80% 90% 100%
Parish 2001
Parish 2011
Diocese 2011
Christian Buddhist Hindu Jewish Muslim Sikh Other religions No religion Religion not stated
2
3
National Average Percentage Christian2 (59.4%)
Research
&
Statistics
2
2

8
HOUSEHOLDS, LIFESTYLE AND THE COMMUNITY I
Social Rented householdsOwner occupied households
(including shared ownership)
Private Rented households
(including those living rent free)
Household Spaces2 2011
With at least one usual resident i.e. not vacant 81%
1%Caravan or other mobile or temporary structure
63% 37% <1%
Who lives in your parish? Are there issues with access to housing? How permenant are your
parishioners?
Tenure2
Social rented as a percentage of all households2 <1%
Research
&
Statistics
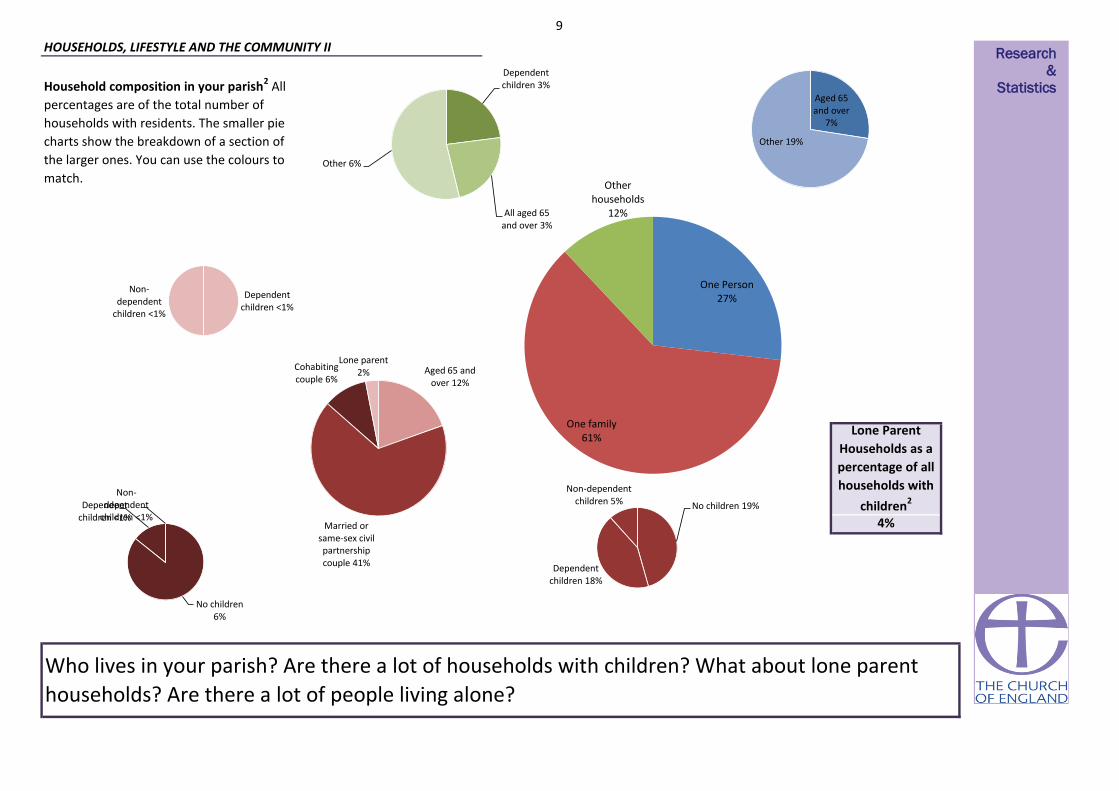
9
Who lives in your parish? Are there a lot of households with children? What about lone parent
households? Are there a lot of people living alone?
HOUSEHOLDS, LIFESTYLE AND THE COMMUNITY II
Household composition in your parish2 All
percentages are of the total number of
households with residents. The smaller pie
charts show the breakdown of a section of
the larger ones. You can use the colours to
match.
Lone Parent
Households as a
percentage of all
households with
children2
4%
Aged 65 and over
7%
Other 19%
One Person 27%
One family 61%
Other households
12%
Dependent children 3%
All aged 65 and over 3%
Other 6%
Aged 65 and over 12%
Married or same-sex civil partnership couple 41%
Cohabiting couple 6%
Lone parent 2%
No children 19%
Dependent children 18%
Non-dependent children 5%
No children 6%
Dependent children <1%
Non-dependent
children <1%
Dependent children <1%
Non-dependent
children <1%
Research
&
Statistics

10
Weddings & Blessings in 2010
Weddings & Blessings in 2011
3 No
Marital and civil partnership status
No No
Your Parish Churches held1
Do you hold many weddings in your parish? How is your parish supporting those in the above
categories?
80% 60% 40% 20% 0% 20% 40% 60% 80%
Living in a couple: Married or in a registered same-sex civil partnership
Living in a couple: Cohabiting
Not living in a couple: Single (never married or never registered a same-sex civilpartnership)
Not living in a couple: Married or in a registered same-sex civil partnership
Not living in a couple: Separated (but still legally married or still legally in a same-sexcivil partnership)
Not living in a couple: Divorced or formerly in a same-sex civil partnership which isnow legally dissolved
Not living in a couple: Widowed or surviving partner from a same-sex civilpartnership
2001 2011
Research
&
Statistics 2 3

11
NS-SeC of Household Reference Person2
£9,745Parish Income12011
£4,906
£8,967
EMPLOYMENT AND SOCIAL GRADE, LIFESTYLE
The National Statistics Socio-economic Classification (NS-SeC) is an occupationally
based classification but has rules to provide coverage of the whole adult population.
The NS-SeC provides an indication of socio-economic position based on occupation.
It is an Office for National Statistics standard classification. To assign a person aged
16 to 74 to an NS-SeC category their occupation title is combined with information
about their employment status, whether they are employed or self-employed and
whether or not they supervise other employees. Full-time students are recorded in
the' full-time students' category regardless of whether they are economically active
or not.Parish Share Assessed1
Parish Share Paid1
£1,370
£26
£6,033
£4,422
£3,598
£7
£5,032Tax Efficient Planned Giving (TEPG)1
Finance Returns 2010
£7
£0
£0
£11,226
£4,161
£3,416
Parish Expenditure1
TEPG/PERSON/WEEK1
Other/person/week1Other planned giving1
How are your parish finances? How does this compare to your community profile?
Research
&
Statistics
0% 5% 10% 15% 20% 25% 30% 35% 40%
Higher managerial, administrative and professional occupations
Lower managerial, administrative and professional occupations
Intermediate occupations
Small employers and own account workers
Lower supervisory and technical occupations
Semi-routine occupations
Routine occupations
Never worked and long-term unemployed
Not classified (Full-time students or not classifiable for other reasons)
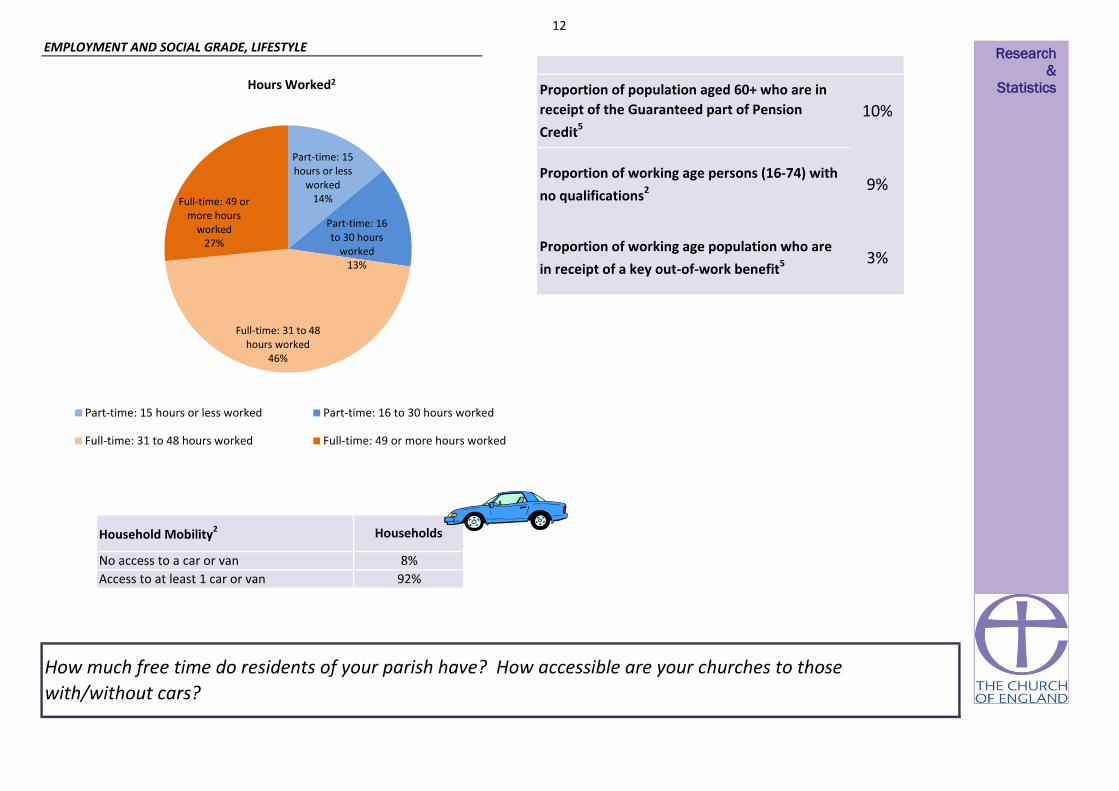
12
Proportion of population aged 60+ who are in
receipt of the Guaranteed part of Pension
Credit5
10%
Proportion of working age persons (16-74) with
no qualifications2 9%
Proportion of working age population who are
in receipt of a key out-of-work benefit5
No access to a car or van
EMPLOYMENT AND SOCIAL GRADE, LIFESTYLE
How much free time do residents of your parish have? How accessible are your churches to those
with/without cars?
Access to at least 1 car or van
Household Mobility2
3%
8%
92%
Households
Part-time: 15 hours or less
worked 14%
Part-time: 16 to 30 hours
worked 13%
Full-time: 31 to 48 hours worked
46%
Full-time: 49 or more hours
worked 27%
Hours Worked2
Part-time: 15 hours or less worked Part-time: 16 to 30 hours worked
Full-time: 31 to 48 hours worked Full-time: 49 or more hours worked
Research
&
Statistics

13
Church Schools in the parish
Sorry, we do not currently have
any Church Schools listed for this
parish.
EDUCATION AND SCHOOLS
How qualified are residents of your parish? What Church of England schools are available?
Parish2 2011 (proportion of 16+ population) National2 2011 (proportion of 16+ population)
8%
12%
12%
1% 11%
52%
4%
22%
13%
15% 4%
12%
27%
6% No qualifications (No formal qualifications)
Level 1 qualifications (1-4 GCSEs or equivalent)
Level 2 qualifications (5 GCSEs or equivalent)
Apprenticeships
Level 3 qualifications (2 or more A-levels orequivalent )
Level 4 qualifications and above (Bachelorsdegree or equivalent, and higher qualifications)
Other qualifications (including foreignqualifications)
Research
&
Statistics
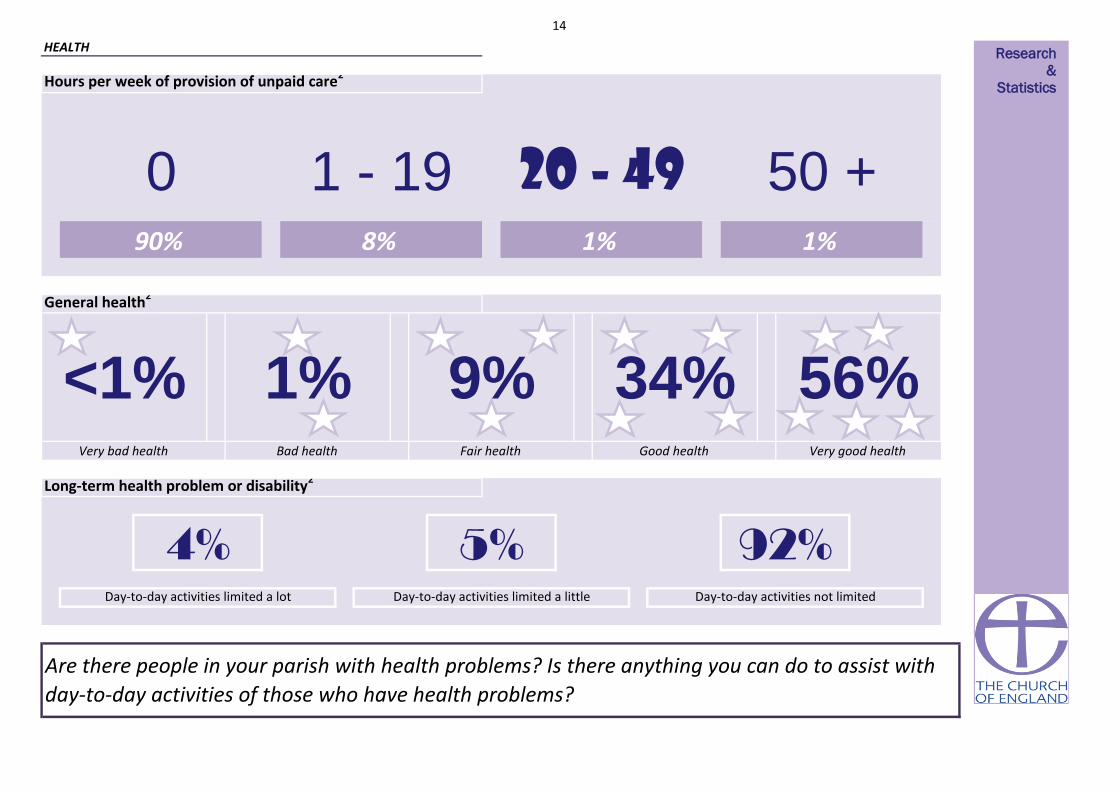
14
Hours per week of provision of unpaid care2
General health2
20 - 49 50 +90% 8%
Good health Very good health
<1%
Day-to-day activities limited a lot Day-to-day activities limited a little Day-to-day activities not limited
4% 5% 92%
1% 9% 34% 56%
Are there people in your parish with health problems? Is there anything you can do to assist with
day-to-day activities of those who have health problems?
HEALTH
0
Long-term health problem or disability2
1 - 191% 1%
Very bad health Bad health Fair health
Research
&
Statistics

15
A low-level of skill or educational attainment is one indicator of social disadvantage. Qualifications may make it easier to find employment. Learning also helps promote active citizenship and combat social exclusion.
4%
50% least deprived
10% least deprived
50% least deprived
50% most deprived
10% least deprived
50% least deprived
10% least deprived
Deprivation Indicator Diocesan Position National Position
50% most deprived80
3%
Deprivation is considered to be a multi-dimensional problem, encompassing a range of domains such as financial, health, education, services or crime. continuous measure of relative deprivation therefore there is no definitive point on the scale below
which areas are considered to be deprived and above which they are not.While being in the most deprived 10% may indicate financial disadvantage, it could equally be due to isolated living.
Number of people aged 16 to State Pension age claiming: Jobseeker’s Allowance (JSA), Employment and Support Allowance (ESA), Incapacity Benefit (IB), Income Support (IS) (as a lone parent or in the “other” category),
Other income related benefits.
Social housing is housing that is let at low rents and on a secure basis to people in housing need. It is generally provided by councils and not-for-profit organisations such as housing associations. Vulnerable groups are often
concentrated in the social housing sector, with low rates of employment and low income levels
Children in single parent families have a much higher risk of living in poverty than children in couple families. Single parents may rely on informal childcare.
What are the particular issues that affect your parish? Are you doing anything to address these?
10% least deprived
The proportion of children in families in receipr of either out of work benefits or tax credits where their reported income is less than 60% median income. Poor children may be excluded from participating in society. They may be unable to afford school
trips and activities; school uniforms or warm winter clothes, be unable to go swimming, have friends round for tea or celebrate their birthdays. Many will never have a holiday. Children who grow up poor are more likely to leave school without
qualifications, have lower employment chances, thus restricting their ability to get a good job and financially contribute to society.
50% least deprived
9% 10% least deprived
DEPRIVATION AND KEY ISSUES AFFECTING PARISHIONERS
Score
76
Lone Parent Households as a percentage of all households
with children2 (2011)
Pension Credit is an income related benefit made up of 2 parts - Guarantee Credit and Savings Credit. The guaranteed part tops up weekly income if it’s below £142.70 (single people) or £217.90 (couples) so those who
receive this are on a low income. This statistic only covers people living in private households, and not residential institutions (such as nursing homes).
10% least deprived
<1%
11.7
50% most deprived10% 50% least deprived
50% least deprivedPercentage of Children under 16 in Poverty7 (2010)
Percentage of working age persons (16-74) with no
qualifications2 (2011)
50% most deprived
Life expectancy at birth can give an idea of overall quality of life. Life expectancy is an average. Women tend to have greater life expectancy. Life expectany can be affected by family history, marital status, economic status,
physique, exercise, diet, drug use including smoking and alcohol consumption, disposition, education, environment, sleep, climate, and health care.
Proportion of the population aged 60+ who are in receipt of
the Guaranteed part of Pension Credit5 (2012)
6%
Social rented as a percentage of all households2 (2011)
Index of Multiple Deprivation (IMD)8 (2010)
Proportion of the working age population who are in receipt
of a key out-of-work benefit5 (2012)
You parish can be categorised as in the most or least deprived 10% or 50% of all parishes within the diocese and of all parishes nationally
50% most deprived 50% most deprived
Life expectancy at birth (girls)6 (1999-2003)
Life Expectancy at birth (boys)6 (1999-2003)
Research
&
Statistics

16
0
00 0
*There are 4 full or partial LSOAs included in this parish
0 0
What are the particular issues that affect your parish? Are you doing anything to address these?
Income Deprivation Affecting Older
People Index
00
50% least deprived 50% least deprived
10% 1%
DEPRIVATION AND KEY ISSUES AFFECTING PARISHIONERSIt is important to note that these statistics are a measure of deprivation, not affluence, and to recognise that not every person in a highly deprived area will themselves be
deprived. Equally, there will be some deprived people living in the least deprived areas.
Deprivation covers a broad range of issues and refers to unmet needs caused by a lack of resources of all kinds, not just financial. The English Indices of Deprivation
attempt to measure a broader concept of multiple deprivation, made up of several distinct dimensions, or domains, of deprivation. Seven domains of deprivation are
combined to produce the overall Index of Multiple Deprivation. Each domain contains a number of component indicators. The English Indices of Deprivation are a
continuous measure of relative deprivation therefore there is no definitive point on the scale below which areas are considered to be deprived and above which they are
not. Deprived areas have been defined in this release as those containing LSOAs that are amongst the 10 per cent most deprived in England according to the overall Index
of Multiple Deprivation.
Overall IMD 0 100
5% 10%
11.7 50% most deprived
BARRIERS TO HOUSING AND SERVICES50% most deprived
Wider Barriers Sub-domain
Children/Young People Sub-domain5.1 0 0
0
0
50% least deprived 50% least deprived
0
0
0
0
0
-0.8
010% most deprived
0.2
76.0
9.1
29.2
42.5
Income Deprivation Affecting
Children Index0.1
CRIME AND DISORDER
LIVING ENVIRONMENT
Indoors Sub-domain
Outdoors Sub-domain
0
0
Geographical Barriers Sub-domain
43.7
50% most deprived
EDUCATION SKILLS AND TRAINING
50% least deprived 0
Number of LSOAs amongst
least deprived*Diocesan position National position
HEALTH DEPRIVATION AND
DISABILITY-1.1
Average
Score for
parishIMD Subdomains8 (2010)
INCOME
EMPLOYMENT 50% least deprived 3
Number of LSOAs amongst
most deprived*
1%
0
0
0
0
2
0
0
0
5.3
0
50% least deprived
50% least deprived
0
00
0
0
0
0.1
0.0
5%
0 0
000
0
0
0
0 0
0
0 0
0
0
0
0
0
0
0
50% most deprived
50% most deprived
50% least deprived
10% least deprived
50% least deprived
0 1 0
0Skills Sub-domain 5.5
0
1
0
0
00 0
0
2
0
0
0
0
0
00 0
0
0
0
0
0
10% least deprived
10% most deprived
10% least deprived
50% most deprived
50% least deprived 0
0
0
0.1 50% least deprived 0
0
2
50% most deprived
50% least deprived
50% most deprived
50% least deprived
50% least deprived
50% most deprived
0 0 0
50% most deprived
50% most deprived 50% least deprived
Research
&
Statistics

17
What to do next?
Your notes
WHAT TO DO NEXT
This spotlight has given you some information about your parish both in terms of your own church congregations and your local community. This is not an
end in itself, but rather a starting place for you to explore further. Questions to consider might include:
• What does our congregation look like?
• How does it compare to the local population?
• What other churches are there in the area? What parts of the community to they reach? Which parts of the community are being missed?
• What other local organisations or centres are there, that might bring people into our parish? Examples might be Hospitals or health centres, prisons, job
centres, homeless shelters, schools, charities, mother and toddler groups, uniformed organisations, community centres, libraries, shops, offices, stations?
How can we interact with these people?
• What areas of our parish do we know well or less well?
• How does the local community change between weekdays and weekends? How do our services and events fit with the shifting local population?
• Is our website/'A Church Near You' profile up to date?
• Are our records up to date?
****************************************************************************************************************************
Research
&
Statistics

18
http://www.londonstreetgangs.com/
Hint: Scroll to the bottom of the "Gang Maps" page to see boundaries.
AboutMyArea - The local interactive site - news, reviews, what's on, events, businesses
Research & Statistics GIS
http://www.churchofengland.org/about-us/facts-stats/research-statistics/census-2011.aspx
Church Urban Fund
www.cuf.org.uk
Homeless Pages - Information, Research and Publications on homelessness
http://www.homelesspages.org.uk/
http://www.upmystreet.com/
Hint: Use the "My Neighbourhood" tab
The network of Public Health Observatories - Health Profiles
www.apho.org.uk/resource/view.aspx?RID=91736
The Poverty Site - Geographic Analysis
www.poverty.org.uk/summary/regional.shtml
http://www.apho.org.uk/default.aspx?QN=HP_FINDSEARCH2011
MurderMap - London Homicide Reported Direct from The Old Bailey
Police.uk - Local crime and policing information for England and Wales
http://www.police.uk/
ONS - Neighbourhood Statistics
http://www.aboutmyarea.co.uk/
http://neighbourhood.statistics.gov.uk/
Hint: Use the summary box
http://www.murdermap.co.uk/
London Street Gangs - Territory maps and background information
UpMyStreet - UK house prices, property, crime, local neighbourhood & schools
Sources of further information
Public Health Observatories - APHO JSNA Datasets (The datasets are intended to cover a
range of issues, focused on underlying determinants of health and conditions which account
for substantial numbers of preventable diseases and deaths.)
A Church Near You
www.achurchnearyou.com
Research
&
Statistics

19
Proportion of the population aged 60+ who are in receipt of the Guaranteed part of Pension Credit (August 2012)
Estimated using LSOA level data sourced from http://83.244.183.180/NESS/BEN/iben.htm
Proportion of the working age population who are in receipt of a key out-of-work benefit (Q3 2012)
Life Expectancy at birth (boys) (1999-2003)
Estimated using ward level data from ONS.
Life expectancy at birth (girls) (1999-2003)
Estimated using ward level data from ONS.
Percentage of Children under 16 in Poverty (2009)
Estimated using LSOA level data from http://www.hmrc.gov.uk/statistics/child-poverty-stats.htm
IMD (2010)
Estimated using LSOA level data from Communities and Local Government, 2010.
https://www.gov.uk/government/uploads/system/uploads/attachment_data/file/6320/1870718.pdf
When quoting figures derived from this data, care should be taken with the level of accuracy quoted.
2007 Church Diversity Survey
DWP
ONS
HMRC
Department for Communities and Local Government
1
2
3
4
5
6
7
8
These have been collected annually between 2007 and 2011 by the Research and Statistics team, Archbishops’ Council
Methodology: Government data is published on government boundaries that do not match ecclesiastical boundaries. In order to produce parish population and demographic
estimates we have worked with the ONS to use a best fit modelling process. As such, these statistics can only be considered estimates and, particularly in very diverse areas, are
best used in the context of local knowledge. Where parish populations are sparse the figures for government areas overlapping the parish are used.
Parish estimates from the census have been calculated using the census output area data published by the ONS. These are provisional estimates, and when more granular data at
postcode level is available, will be revised. Estimates have been modelled by allocating the population weighted centroid of each output area to the parish within which it falls.
This means that some parishes have not been allocated population, however proportions for demographic variables have been calculated based on the output areas
overlaying the parish.
For further information about this process, please contact [email protected].
Contains public sector information licensed under the Open Government Licence v1.0 http://www.nationalarchives.gov.uk/doc/open-government-licence/
Estimated using OA level data sourced from ONS Census Data 2011, ONS
Estimated using OA level data sourced from ONS Census Data 2001, ONS
When analysing data, it is important to consider that some parishes are very small and proportions may be very large even where very few cases meet the criteria.
ABOUT THIS DATA
http://www.churchofengland.org/about-us/facts-stats/research-statistics/clergydiversityaudit2005linkpage.aspx
Estimated using OA level data from DWP Information, Governance and Security Directorate from
http://statistics.dwp.gov.uk/asd/asd1/tabtools/census_output_area_data/index.php?page=census_output_area_data
Annual parochial returns
ONS Census data 2011
ONS Census data 2001
Research
&
Statistics

1
Getting to know your parish
What is this spotlight?
How should I use it?
Questions
Contents
This short spotlight brings together a range of information about your parish,
both in terms of your congregations, but also the wider community living in
your area. It covers areas such as Christian affiliation, population age and
ethnicity profiles, household structures, deprivation, employment, schools
and qualifications, alongside church statistics such as attendance and giving.
There is information at the end of the spotlight about where this data comes
from and how it was calculated. If you have any further queries then please
do contact the Research and Statistics team at
This spotlight is not an end in itself, but rather a starting place for you to
explore further. You may want to discuss it at a PCC meeting or with
leadership teams. We’ve included some questions on each page to help you
to think about the information, however some things will be of more
relevance in some areas than others, and these are just suggestions to get
you started. We’ve also included some bigger questions about what to do
next at the end of the spotlight on page 17. There’s space for you to write
some notes here. It might be helpful to write a short paragraph to
summarise your community profile or note down anything that has struck
you as particularly important. There are also details at the end for where
you can find further information should you want to dig a little deeper.
1. Summary: a brief overview of your parish, including what look to be 5 of
the most pressing social issues in your area
2. Age: age profile of your community
3. Ethnicity: ethnicity profile of your community
4. Integration: English language speaking and length of UK residency in your
community
5. Religious affiliation: religious affiliation in your community
6. Households: families, dependents, one person households, temporary
residents and housing tenure
7. Marital and civil partnership status
8. Employment: occupations, benefits and mobility in your community
9. Education: CofE schools and qualification levels in your community
10. Health: people with health problems and carers in your community
11. Deprivation: different types of deprivation in your community
Research
&
Statistics

2
Parishioners at glance
Islip: St Nicholas
2011 Tax Efficient Planned
Giving/person/week1
2011 Electoral
Roll1
Housing Access
Environment
Male Life expectancy
73%
66%
Issues to look out for in your parish
£12
Annual Parochial Returns
Oct
ob
er W
eekl
y
Att
end
ance
1
0-4
5-15
2011 Parish
Share Paid1
75
PARISH OVERVIEW
17%
Parish
6%
13%
63%
Age Profile (20112)600
Proportion Christian
Sorry, no Fresh Expressions listed for this parish.Fresh Expressions
700
BICESTER & ISLIP
OXFORD
16-64
Age
Gro
up
Diocese
627048
Deanery
Archdeaconry
20013
20112
20013
20112
Included Churches
Oxford
Population
Housing Conditions
Parish of: Islip
Parish Code: 270048
65 +
£16,713
Female Life Expectancy
Research
&
Statistics
0
20
40
60
80
100
120
2007 2008 2009 2010 2011
Highestweek
Average
LowestWeek

3
Parish 20112 Deanery 20112 Diocese 20112
Demographics: AGE PROFILE AND ATTENDANCE AT SERVICES
Does the age profile of your congregation match that of your parish? Are you engaging with the
parish's largest demographic: those aged 45 - 59?
30% 20% 10% 0% 10% 20% 30%
0 - 4
5 - 7
8 - 9
10 - 14
15
16 - 17
18 - 19
20 - 24
25 - 29
30 - 44
45 - 59
60 - 64
65 - 74
75 - 84
85 - 89
90 & overAge profile of parish populations 20013 & 20112
Parish2011
Parish2001
0% 10% 20% 30%
0 - 14
15 - 29
30 - 44
45 - 59
60 - 74
75 - 89
90 & over
0% 10% 20% 30%
0 - 14
15 - 29
30 - 44
45 - 59
60 - 74
75 - 89
90 & over
0% 5% 10% 15% 20% 25%
0 - 14
15 - 29
30 - 44
45 - 59
60 - 74
75 - 89
90 & over
Research
&
Statistics

4
15%
Diocesan Congregation4 (2007)
Parish Population2 (2011)
(nearest 50)
Demographics: AGE PROFILE AND ATTENDANCE AT SERVICES
Comparable Age profile of Adults
25%
65 +
40%
Age
50
100
18 - 44
22% 38%
400
100
0 - 4
5 - 15
16 - 64
Diocesan Core Congregation Age Profile4 (2007)
Diocesan Population2 (2011) 37%
45 - 64
Does the age profile of your congregation match that of your parish?
65 +
Infant Baptisms
20111
7
Highest Weeks
Attendance 20111
11
88
9%
13%
16%
22%
40%
0% 10% 20% 30% 40% 50%
Research
&
Statistics

5
Detailed Parish Ethnicity2 2011
Parish Ethnicity2 2011 Parish Ethnicity3 2001 Diocese Ethnicity2 2011
Arab Other Ethnic Group
0%0%
Indian Bangladeshi Chinese
African Caribbean
Parish
Percentage
ME: 4%
Other Asian
1%
Does the ethnicity profile of your congregation match that of your parish? Are you engaging with the parish's
largest demographics: those describing themselves as White or Asian/Asian British?
<1%
3%
<1%1% 1%
<1%
<1%0%
Demographics: ETHNICITY
<1%
90%
Other White
6%
White & Asian Other Mixed
1%
0%
0%
British
White & Black
Caribbean
Diocesan Population2 (2011)
Diocesan Core Congregation4 (aged 18+ only) (2007)
Percentage Minority Ethnic Background
15%
1%
Irish
Pakistani
<1%
Other Black
Gypsy or Irish
Traveller
White & Black
African
Research
&
Statistics
White
Mixed/Multipleethnic group
Asian/Asian British
Black or BlackBritish
Other ethnicgroup

6
Cannot speak English well or cannot speak
English Can speak English well or very well
<1% 2%Have English as their main language (English or
Welsh if in Wales)
98%2Percentage of people who
Demographics: Integration
10 years or more
88%
2 years or more but less
than 5 years
Born in the UK
Less than 2 years
1% 3% 7%
5 years or more but less
than 10 years
Are services in your parish accessible to all residents? Do you offer any services in foreign
languages? What can you offer those who may not have been in the UK for long?
2Resident in UK:
<1%
Research
&
Statistics

7
In your parish 66% of the population (that is 500 people) declared themselves as Christian in 2011
250
Statistics from the Annual
Parochial Returns 2011
Easter Communicants1
Easter Day Attendance1
Christmas Communicants1
Christmas Attendance1
Christians in your Parish
RELIGIOUS AFFILIATION
72
93
122
How has the religious affiliation of those living in your parish changed over the past decade? How closely does
it match that of the Diocese as a whole? Are Christians in your parish engaging with your churches? How are
you engaging with other faith groups?
0% 10% 20% 30% 40% 50% 60% 70% 80% 90% 100%
Parish 2001
Parish 2011
Diocese 2011
Christian Buddhist Hindu Jewish Muslim Sikh Other religions No religion Religion not stated
2
3
National Average Percentage Christian2 (59.4%)
Research
&
Statistics
2
2

8
Household Spaces2 2011
With at least one usual resident i.e. not vacant 94%
0%Caravan or other mobile or temporary structure
200 <50 <50
Who lives in your parish? Are there issues with access to housing? How permenant are your
parishioners?
Tenure2
Social rented as a percentage of all households2 5%
Social Rented householdsOwner occupied households
(including shared ownership)
Private Rented households
(including those living rent free)
HOUSEHOLDS, LIFESTYLE AND THE COMMUNITY I Research
&
Statistics
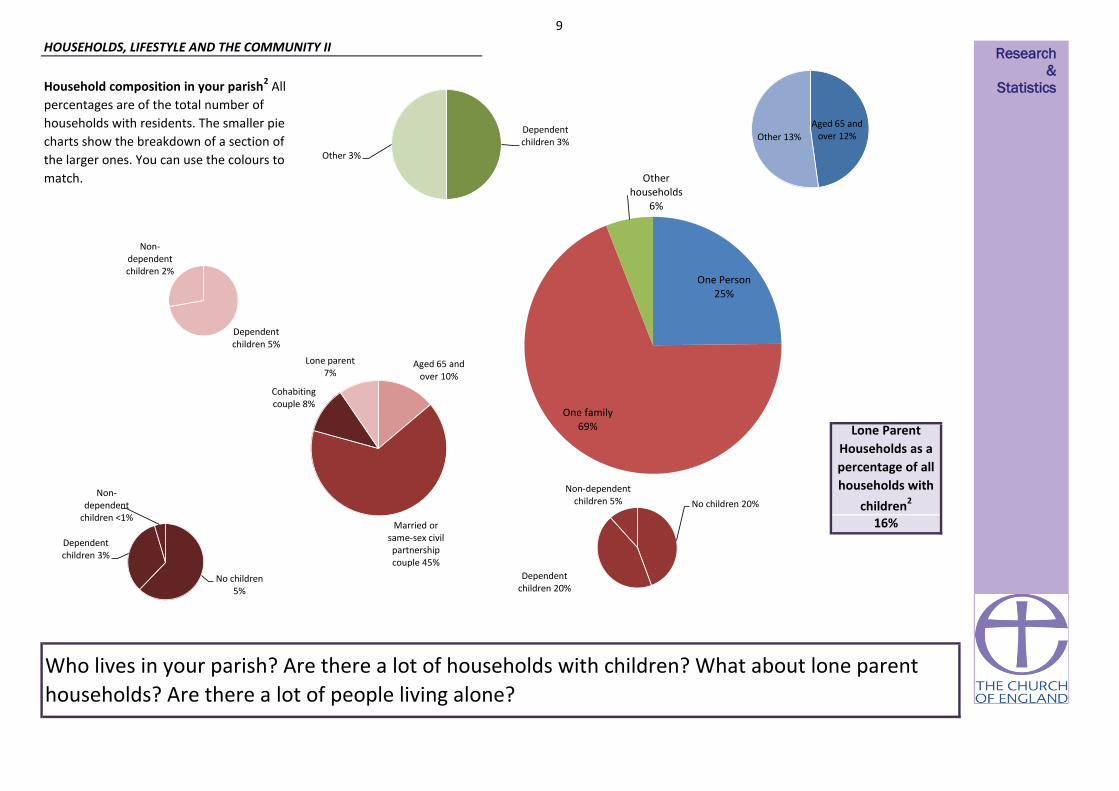
9
Household composition in your parish2 All
percentages are of the total number of
households with residents. The smaller pie
charts show the breakdown of a section of
the larger ones. You can use the colours to
match.
Lone Parent
Households as a
percentage of all
households with
children2
16%
Who lives in your parish? Are there a lot of households with children? What about lone parent
households? Are there a lot of people living alone?
HOUSEHOLDS, LIFESTYLE AND THE COMMUNITY II
Aged 65 and over 12% Other 13%
One Person 25%
One family 69%
Other households
6%
Dependent children 3%
Other 3%
Aged 65 and over 10%
Married or same-sex civil partnership couple 45%
Cohabiting couple 8%
Lone parent 7%
No children 20%
Dependent children 20%
Non-dependent children 5%
No children 5%
Dependent children 3%
Non-dependent
children <1%
Dependent children 5%
Non-dependent children 2%
Research
&
Statistics

10
Weddings & Blessings in 2010
Weddings & Blessings in 20113 No
Your Parish Churches held1
Do you hold many weddings in your parish? How is your parish supporting those in the above
categories?
3 No
Marital and civil partnership status
60% 40% 20% 0% 20% 40% 60% 80%
Living in a couple: Married or in a registered same-sex civil partnership
Living in a couple: Cohabiting
Not living in a couple: Single (never married or never registered a same-sex civilpartnership)
Not living in a couple: Married or in a registered same-sex civil partnership
Not living in a couple: Separated (but still legally married or still legally in a same-sexcivil partnership)
Not living in a couple: Divorced or formerly in a same-sex civil partnership which isnow legally dissolved
Not living in a couple: Widowed or surviving partner from a same-sex civilpartnership
2001 2011
Research
&
Statistics 2 3
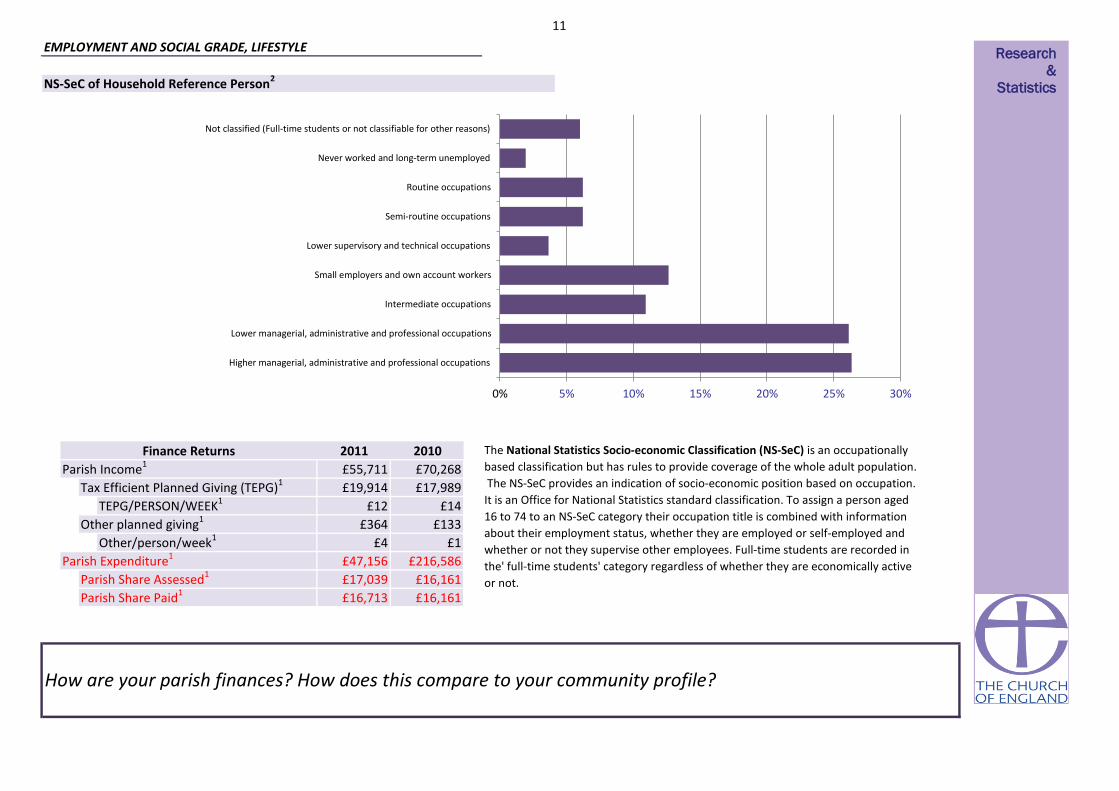
11
£14
£133
£1
£216,586
£16,161
£16,161
Parish Expenditure1
TEPG/PERSON/WEEK1
Other/person/week1Other planned giving1
How are your parish finances? How does this compare to your community profile?
£19,914
£55,711
EMPLOYMENT AND SOCIAL GRADE, LIFESTYLE
The National Statistics Socio-economic Classification (NS-SeC) is an occupationally
based classification but has rules to provide coverage of the whole adult population.
The NS-SeC provides an indication of socio-economic position based on occupation.
It is an Office for National Statistics standard classification. To assign a person aged
16 to 74 to an NS-SeC category their occupation title is combined with information
about their employment status, whether they are employed or self-employed and
whether or not they supervise other employees. Full-time students are recorded in
the' full-time students' category regardless of whether they are economically active
or not.Parish Share Assessed1
Parish Share Paid1
£364
£4
£47,156
£17,039
£16,713
£12
£17,989Tax Efficient Planned Giving (TEPG)1
Finance Returns 2010
NS-SeC of Household Reference Person2
£70,268Parish Income12011
Research
&
Statistics
0% 5% 10% 15% 20% 25% 30%
Higher managerial, administrative and professional occupations
Lower managerial, administrative and professional occupations
Intermediate occupations
Small employers and own account workers
Lower supervisory and technical occupations
Semi-routine occupations
Routine occupations
Never worked and long-term unemployed
Not classified (Full-time students or not classifiable for other reasons)

12
9%
91%
Households
2%
EMPLOYMENT AND SOCIAL GRADE, LIFESTYLE
How much free time do residents of your parish have? How accessible are your churches to those
with/without cars?
Access to at least 1 car or van
Household Mobility2
Proportion of population aged 60+ who are in
receipt of the Guaranteed part of Pension
Credit5
8%
Proportion of working age persons (16-74) with
no qualifications2 16%
Proportion of working age population who are
in receipt of a key out-of-work benefit5
No access to a car or van
Part-time: 15 hours or less
worked 13%
Part-time: 16 to 30 hours worked
18%
Full-time: 31 to 48 hours worked
51%
Full-time: 49 or more hours
worked 19%
Hours Worked2
Part-time: 15 hours or less worked Part-time: 16 to 30 hours worked
Full-time: 31 to 48 hours worked Full-time: 49 or more hours worked
Research
&
Statistics
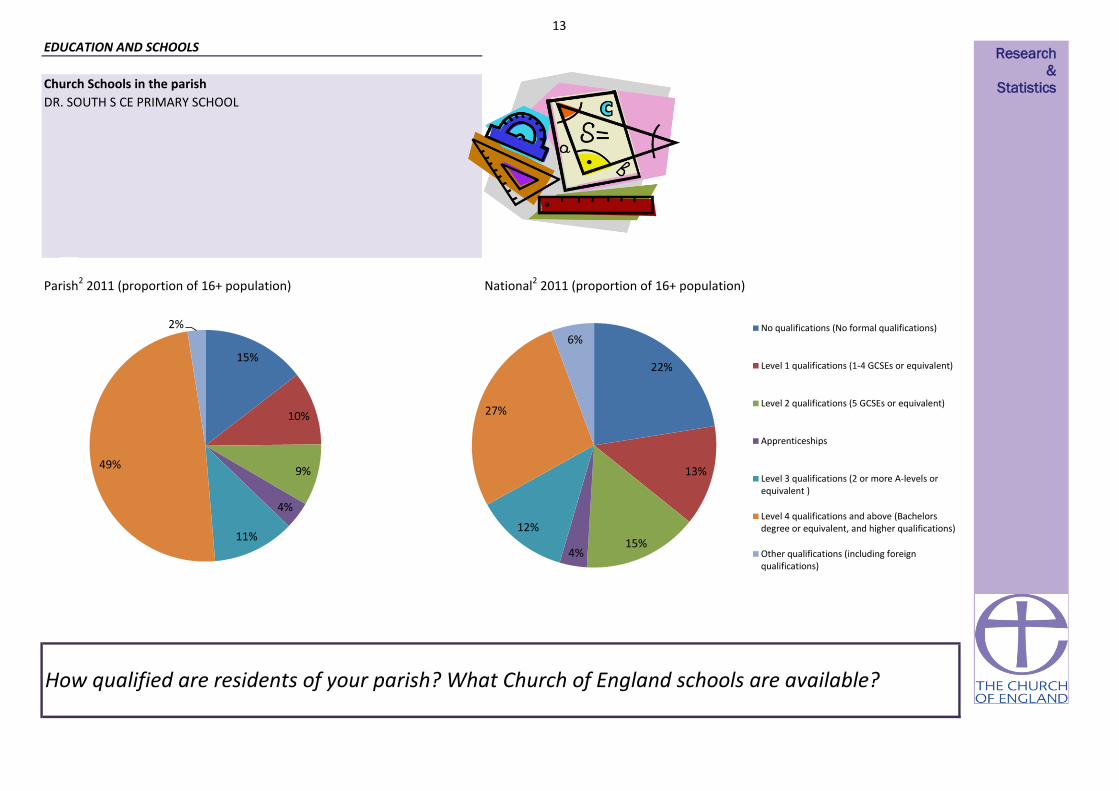
13
Church Schools in the parish
DR. SOUTH S CE PRIMARY SCHOOL
Parish2 2011 (proportion of 16+ population) National2 2011 (proportion of 16+ population)
EDUCATION AND SCHOOLS
How qualified are residents of your parish? What Church of England schools are available?
15%
10%
9%
4%
11%
49%
2%
22%
13%
15% 4%
12%
27%
6% No qualifications (No formal qualifications)
Level 1 qualifications (1-4 GCSEs or equivalent)
Level 2 qualifications (5 GCSEs or equivalent)
Apprenticeships
Level 3 qualifications (2 or more A-levels orequivalent )
Level 4 qualifications and above (Bachelorsdegree or equivalent, and higher qualifications)
Other qualifications (including foreignqualifications)
Research
&
Statistics
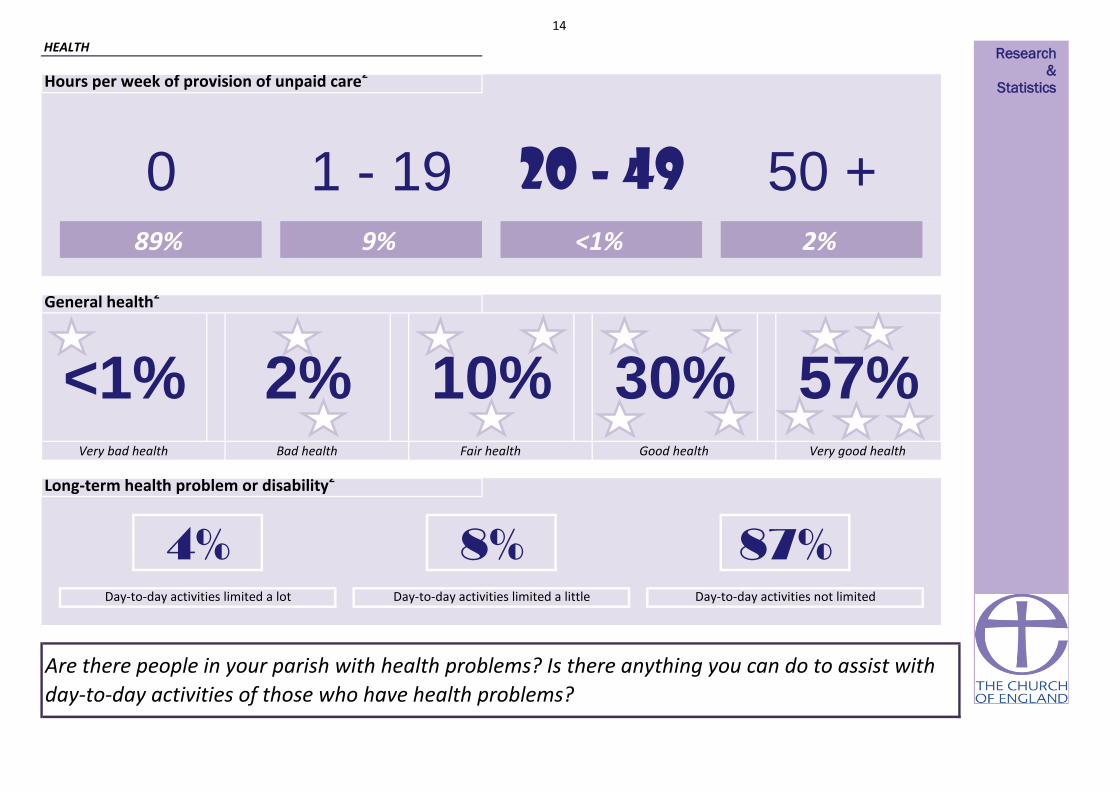
14
Hours per week of provision of unpaid care2
<1% 2%
Very bad health Bad health Fair health
1 - 19
Are there people in your parish with health problems? Is there anything you can do to assist with
day-to-day activities of those who have health problems?
HEALTH
0
Long-term health problem or disability2
50 +89% 9%
Good health Very good health
<1%
Day-to-day activities limited a lot Day-to-day activities limited a little Day-to-day activities not limited
4% 8% 87%
2% 10% 30% 57%
General health2
20 - 49
Research
&
Statistics

15
You parish can be categorised as in the most or least deprived 10% or 50% of all parishes within the diocese and of all parishes nationally
10% most deprived 10% most deprived
Life expectancy at birth (girls)6 (1999-2003)
Life Expectancy at birth (boys)6 (1999-2003)
5%
5.0
50% least deprived8% 50% least deprived
10% least deprivedPercentage of Children under 16 in Poverty7 (2010)
Percentage of working age persons (16-74) with no
qualifications2 (2011)
10% most deprived
Life expectancy at birth can give an idea of overall quality of life. Life expectancy is an average. Women tend to have greater life expectancy. Life expectany can be affected by family history, marital status, economic status,
physique, exercise, diet, drug use including smoking and alcohol consumption, disposition, education, environment, sleep, climate, and health care.
Proportion of the population aged 60+ who are in receipt of
the Guaranteed part of Pension Credit5 (2012)
2%
Social rented as a percentage of all households2 (2011)
Index of Multiple Deprivation (IMD)8 (2010)
Proportion of the working age population who are in receipt
of a key out-of-work benefit5 (2012)
Lone Parent Households as a percentage of all households
with children2 (2011)
Pension Credit is an income related benefit made up of 2 parts - Guarantee Credit and Savings Credit. The guaranteed part tops up weekly income if it’s below £142.70 (single people) or £217.90 (couples) so those who
receive this are on a low income. This statistic only covers people living in private households, and not residential institutions (such as nursing homes).
50% least deprived
The proportion of children in families in receipr of either out of work benefits or tax credits where their reported income is less than 60% median income. Poor children may be excluded from participating in society. They may be unable to afford school
trips and activities; school uniforms or warm winter clothes, be unable to go swimming, have friends round for tea or celebrate their birthdays. Many will never have a holiday. Children who grow up poor are more likely to leave school without
qualifications, have lower employment chances, thus restricting their ability to get a good job and financially contribute to society.
10% least deprived
16% 50% least deprived
DEPRIVATION AND KEY ISSUES AFFECTING PARISHIONERS
Score
72
50% most deprived79
2%
Deprivation is considered to be a multi-dimensional problem, encompassing a range of domains such as financial, health, education, services or crime. continuous measure of relative deprivation therefore there is no definitive point on the scale below
which areas are considered to be deprived and above which they are not.While being in the most deprived 10% may indicate financial disadvantage, it could equally be due to isolated living.
Number of people aged 16 to State Pension age claiming: Jobseeker’s Allowance (JSA), Employment and Support Allowance (ESA), Incapacity Benefit (IB), Income Support (IS) (as a lone parent or in the “other” category),
Other income related benefits.
Social housing is housing that is let at low rents and on a secure basis to people in housing need. It is generally provided by councils and not-for-profit organisations such as housing associations. Vulnerable groups are often
concentrated in the social housing sector, with low rates of employment and low income levels
Children in single parent families have a much higher risk of living in poverty than children in couple families. Single parents may rely on informal childcare.
What are the particular issues that affect your parish? Are you doing anything to address these?
50% least deprived
Deprivation Indicator Diocesan Position National Position
A low-level of skill or educational attainment is one indicator of social disadvantage. Qualifications may make it easier to find employment. Learning also helps promote active citizenship and combat social exclusion.
16%
10% least deprived
50% least deprived
10% least deprived
10% least deprived
50% least deprived
50% least deprived
50% most deprived
Research
&
Statistics

16
0
0.1 50% least deprived 0
0
0
10% least deprived
50% least deprived
50% least deprived
10% least deprived
50% most deprived
50% least deprived
0 0 0
50% least deprived
10% least deprived 10% least deprived
00 0
0
0
0
0
0
50% most deprived
10% most deprived
50% most deprived
50% most deprived
50% most deprived
50% least deprived
10% least deprived
10% least deprived
0 1 0
0Skills Sub-domain 1.9
0
0
0
0
10 0
0
0
0
0
0
0
0
0
0
0
0 0
0
0 0
0
0
0
1
0
0
0
0
1
0
0.0
0.0
5%
0 0
01050% least deprived
0
0
0
0
0
0
0
6.0
0
10% least deprived
50% most deprived
0
00
50% least deprived 0
0
10% least deprived 0
10% least deprived 0
Number of LSOAs amongst
least deprived*Diocesan position National position
HEALTH DEPRIVATION AND
DISABILITY-0.8
Average
Score for
parishIMD Subdomains8 (2010)
INCOME
EMPLOYMENT
Number of LSOAs amongst
most deprived*
1%
0
Income Deprivation Affecting
Children Index0.0
CRIME AND DISORDER
LIVING ENVIRONMENT
Indoors Sub-domain
Outdoors Sub-domain
0
0
Geographical Barriers Sub-domain
32.9
50% least deprived
EDUCATION SKILLS AND TRAINING
BARRIERS TO HOUSING AND SERVICES10% least deprived
Wider Barriers Sub-domain
Children/Young People Sub-domain10.1 0 0
0
0
50% most deprived 50% least deprived
0
0
0
0
0
-1.3
010% most deprived
12.6
20.9
10.2
26.1
15.5
50% most deprived 50% least deprived
10% 1%
DEPRIVATION AND KEY ISSUES AFFECTING PARISHIONERSIt is important to note that these statistics are a measure of deprivation, not affluence, and to recognise that not every person in a highly deprived area will themselves be
deprived. Equally, there will be some deprived people living in the least deprived areas.
Deprivation covers a broad range of issues and refers to unmet needs caused by a lack of resources of all kinds, not just financial. The English Indices of Deprivation
attempt to measure a broader concept of multiple deprivation, made up of several distinct dimensions, or domains, of deprivation. Seven domains of deprivation are
combined to produce the overall Index of Multiple Deprivation. Each domain contains a number of component indicators. The English Indices of Deprivation are a
continuous measure of relative deprivation therefore there is no definitive point on the scale below which areas are considered to be deprived and above which they are
not. Deprived areas have been defined in this release as those containing LSOAs that are amongst the 10 per cent most deprived in England according to the overall Index
of Multiple Deprivation.
Overall IMD 0 100
5% 10%
5.0 10% least deprived
00
00 0
*There is 1 full or partial LSOA included in this parish
0 0
What are the particular issues that affect your parish? Are you doing anything to address these?
Income Deprivation Affecting Older
People Index
0
Research
&
Statistics

17
This spotlight has given you some information about your parish both in terms of your own church congregations and your local community. This is not an
end in itself, but rather a starting place for you to explore further. Questions to consider might include:
• What does our congregation look like?
• How does it compare to the local population?
• What other churches are there in the area? What parts of the community do they reach? Which parts of the community are being missed?
• What other local organisations or centres are there, that might bring people into our parish? Examples might be Hospitals or health centres, prisons, job
centres, homeless shelters, schools, charities, mother and toddler groups, uniformed organisations, community centres, libraries, shops, offices, stations?
How can we interact with these people?
• What areas of our parish do we know well or less well?
• How does the local community change between weekdays and weekends? How do our services and events fit with the shifting local population?
• Is our website/'A Church Near You' profile up to date?
• Are our records up to date?
****************************************************************************************************************************
What to do next?
Your notes
WHAT TO DO NEXT Research
&
Statistics

18
Sources of further information
Public Health Observatories - APHO JSNA Datasets (The datasets are intended to cover a
range of issues, focused on underlying determinants of health and conditions which account
for substantial numbers of preventable diseases and deaths.)
A Church Near You
www.achurchnearyou.com
UpMyStreet - UK house prices, property, crime, local neighbourhood & schools
London Street Gangs - Territory maps and background information
http://www.londonstreetgangs.com/
Hint: Scroll to the bottom of the "Gang Maps" page to see boundaries.
AboutMyArea - The local interactive site - news, reviews, what's on, events, businesses
Research & Statistics GIS
http://www.churchofengland.org/about-us/facts-stats/research-statistics/census-2011.aspx
Church Urban Fund
www.cuf.org.uk
Homeless Pages - Information, Research and Publications on homelessness
http://www.homelesspages.org.uk/
http://www.upmystreet.com/
Hint: Use the "My Neighbourhood" tab
The network of Public Health Observatories - Health Profiles
www.apho.org.uk/resource/view.aspx?RID=91736
The Poverty Site - Geographic Analysis
www.poverty.org.uk/summary/regional.shtml
http://www.apho.org.uk/default.aspx?QN=HP_FINDSEARCH2011
MurderMap - London Homicide Reported Direct from The Old Bailey
Police.uk - Local crime and policing information for England and Wales
http://www.police.uk/
ONS - Neighbourhood Statistics
http://www.aboutmyarea.co.uk/
http://neighbourhood.statistics.gov.uk/
Hint: Use the summary box
http://www.murdermap.co.uk/
Research
&
Statistics

19
Proportion of the population aged 60+ who are in receipt of the Guaranteed part of Pension Credit (August 2012)
Estimated using LSOA level data sourced from http://83.244.183.180/NESS/BEN/iben.htm
Proportion of the working age population who are in receipt of a key out-of-work benefit (Q3 2012)
Life Expectancy at birth (boys) (1999-2003)
Estimated using ward level data from ONS.
Life expectancy at birth (girls) (1999-2003)
Estimated using ward level data from ONS.
Percentage of Children under 16 in Poverty (2009)
Estimated using LSOA level data from http://www.hmrc.gov.uk/statistics/child-poverty-stats.htm
IMD (2010)
Methodology: Government data is published on government boundaries that do not match ecclesiastical boundaries. In order to produce parish population and demographic
estimates we have worked with the ONS to use a best fit modelling process. As such, these statistics can only be considered estimates and, particularly in very diverse areas, are
best used in the context of local knowledge. Where parish populations are sparse the figures for government areas overlapping the parish are used.
Parish estimates from the census have been calculated using the census output area data published by the ONS. These are provisional estimates, and when more granular data at
postcode level is available, will be revised. Estimates have been modelled by allocating the population weighted centroid of each output area to the parish within which it falls.
This means that some parishes have not been allocated population, however proportions for demographic variables have been calculated based on the output areas overlaying
the parish.
For further information about this process, please contact [email protected].
Contains public sector information licensed under the Open Government Licence v1.0 http://www.nationalarchives.gov.uk/doc/open-government-licence/
Estimated using OA level data sourced from ONS Census Data 2011, ONS
Estimated using OA level data sourced from ONS Census Data 2001, ONS
When analysing data, it is important to consider that some parishes are very small and proportions may be very large even where very few cases meet the criteria.
ABOUT THIS DATA
http://www.churchofengland.org/about-us/facts-stats/research-statistics/clergydiversityaudit2005linkpage.aspx
Estimated using OA level data from DWP Information, Governance and Security Directorate from
http://statistics.dwp.gov.uk/asd/asd1/tabtools/census_output_area_data/index.php?page=census_output_area_data
Annual parochial returns
ONS Census data 2011
ONS Census data 2001
2007 Church Diversity Survey
DWP
ONS
HMRC
Department for Communities and Local Government
1
2
3
4
5
6
7
8
These have been collected annually between 2007 and 2011 by the Research and Statistics team, Archbishops’ Council
When quoting figures derived from this data, care should be taken with the level of accuracy quoted.
Estimated using LSOA level data from Communities and Local Government, 2010.
https://www.gov.uk/government/uploads/system/uploads/attachment_data/file/6320/1870718.pdf
Research
&
Statistics

1
Getting to know your parish
What is this spotlight?
How should I use it?
Questions
Contents
This short spotlight brings together a range of information about your parish,
both in terms of your congregations, but also the wider community living in
your area. It covers areas such as Christian affiliation, population age and
ethnicity profiles, household structures, deprivation, employment, schools
and qualifications, alongside church statistics such as attendance and giving.
There is information at the end of the spotlight about where this data comes
from and how it was calculated. If you have any further queries then please
do contact the Research and Statistics team at
This spotlight is not an end in itself, but rather a starting place for you to
explore further. You may want to discuss it at a PCC meeting or with
leadership teams. We’ve included some questions on each page to help you
to think about the information, however some things will be of more
relevance in some areas than others, and these are just suggestions to get
you started. We’ve also included some bigger questions about what to do
next at the end of the spotlight on page 17. There’s space for you to write
some notes here. It might be helpful to write a short paragraph to
summarise your community profile or note down anything that has struck
you as particularly important. There are also details at the end for where
you can find further information should you want to dig a little deeper.
1. Summary: a brief overview of your parish, including what look to be 5 of
the most pressing social issues in your area
2. Age: age profile of your community
3. Ethnicity: ethnicity profile of your community
4. Integration: English language speaking and length of UK residency in your
community
5. Religious affiliation: religious affiliation in your community
6. Households: families, dependents, one person households, temporary
residents and housing tenure
7. Marital and civil partnership status
8. Employment: occupations, benefits and mobility in your community
9. Education: CofE schools and qualification levels in your community
10. Health: people with health problems and carers in your community
11. Deprivation: different types of deprivation in your community
Research
&
Statistics
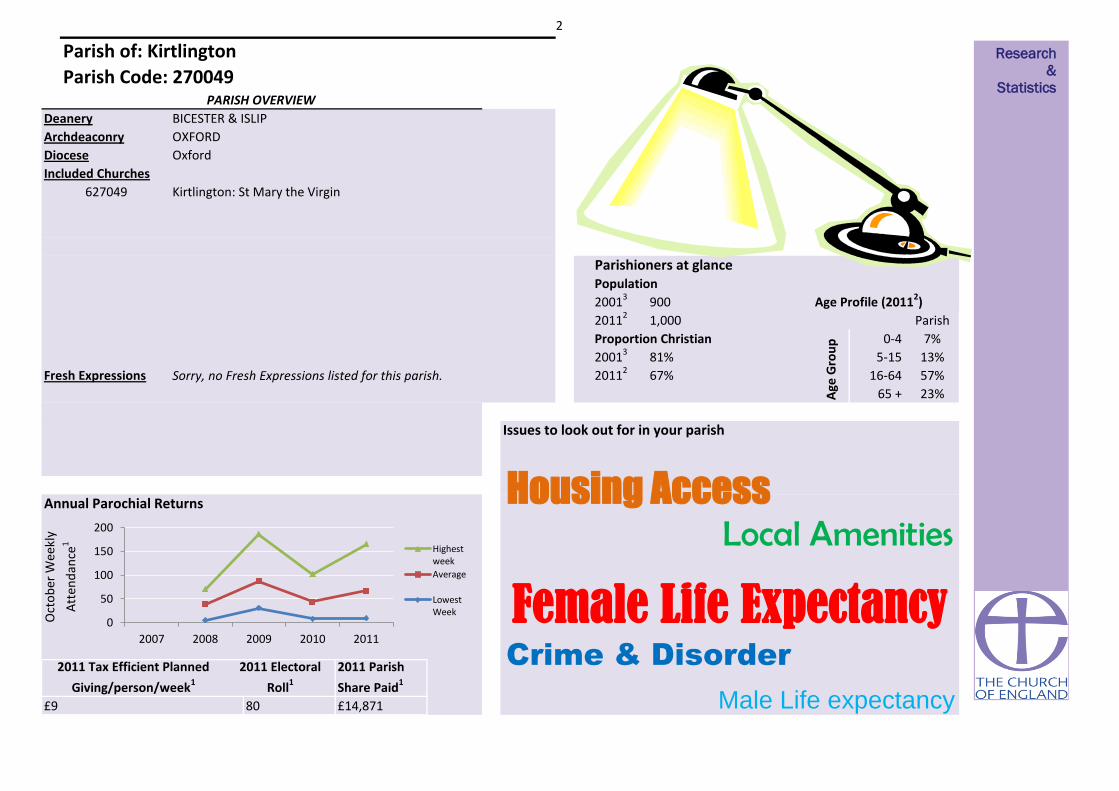
2
Parishioners at glance
Kirtlington: St Mary the Virgin
2011 Tax Efficient Planned
Giving/person/week1
2011 Electoral
Roll1
Male Life expectancy
Crime & Disorder
Female Life Expectancy
81%
67%
Issues to look out for in your parish
£9
Annual Parochial Returns
Oct
ob
er W
eekl
y
Att
end
ance
1
0-4
5-15
2011 Parish
Share Paid1
80
PARISH OVERVIEW
23%
Parish
7%
13%
57%
Age Profile (20112)900
Proportion Christian
Sorry, no Fresh Expressions listed for this parish.Fresh Expressions
1,000
BICESTER & ISLIP
OXFORD
16-64
Age
Gro
up
Diocese
627049
Deanery
Archdeaconry
20013
20112
20013
20112
Included Churches
Oxford
Population
Local Amenities
Parish of: Kirtlington
Parish Code: 270049
65 +
£14,871
Housing Access
Research
&
Statistics
0
50
100
150
200
2007 2008 2009 2010 2011
Highestweek
Average
LowestWeek

3
Parish 20112 Deanery 20112 Diocese 20112
Demographics: AGE PROFILE AND ATTENDANCE AT SERVICES
Does the age profile of your congregation match that of your parish? Are you engaging with the
parish's largest demographic: those aged 30 - 44?
25% 20% 15% 10% 5% 0% 5% 10% 15% 20% 25%
0 - 4
5 - 7
8 - 9
10 - 14
15
16 - 17
18 - 19
20 - 24
25 - 29
30 - 44
45 - 59
60 - 64
65 - 74
75 - 84
85 - 89
90 & overAge profile of parish populations 20013 & 20112
Parish2011
Parish2001
0% 5% 10% 15% 20% 25%
0 - 14
15 - 29
30 - 44
45 - 59
60 - 74
75 - 89
90 & over
0% 10% 20% 30%
0 - 14
15 - 29
30 - 44
45 - 59
60 - 74
75 - 89
90 & over
0% 5% 10% 15% 20% 25%
0 - 14
15 - 29
30 - 44
45 - 59
60 - 74
75 - 89
90 & over
Research
&
Statistics

4
15%
Diocesan Congregation4 (2007)
Parish Population2 (2011)
(nearest 50)
Demographics: AGE PROFILE AND ATTENDANCE AT SERVICES
Comparable Age profile of Adults
25%
65 +
40%
Age
50
150
18 - 44
22% 38%
550
250
0 - 4
5 - 15
16 - 64
Diocesan Core Congregation Age Profile4 (2007)
Diocesan Population2 (2011) 37%
45 - 64
Does the age profile of your congregation match that of your parish?
65 +
Infant Baptisms
20111
1
Highest Weeks
Attendance 20111
99
66
9%
13%
16%
22%
40%
0% 10% 20% 30% 40% 50%
Research
&
Statistics

5
Detailed Parish Ethnicity2 2011
Parish Ethnicity2 2011 Parish Ethnicity3 2001 Diocese Ethnicity2 2011
Arab Other Ethnic Group
0%0%
Indian Bangladeshi Chinese
African Caribbean
Parish
Percentage
ME: 2%
Other Asian
0%
Does the ethnicity profile of your congregation match that of your parish? Are you engaging with the parish's
largest demographics: those describing themselves as White or Mixed/Multiple ethnic group?
0%
3%
<1%<1% 0%
0%
1%<1%
Demographics: ETHNICITY
0%
93%
Other White
4%
White & Asian Other Mixed
<1%
<1%
0%
British
White & Black
Caribbean
Diocesan Population2 (2011)
Diocesan Core Congregation4 (aged 18+ only) (2007)
Percentage Minority Ethnic Background
15%
1%
Irish
Pakistani
0%
Other Black
Gypsy or Irish
Traveller
White & Black
African
Research
&
Statistics
White
Mixed/Multipleethnic group
Asian/Asian British
Black or BlackBritish
Other ethnicgroup

6
Cannot speak English well or cannot speak
English Can speak English well or very well
0% 1%Have English as their main language (English or
Welsh if in Wales)
99%2Percentage of people who
Demographics: Integration
10 years or more
93%
2 years or more but less
than 5 years
Born in the UK
Less than 2 years
1% 1% 5%
5 years or more but less
than 10 years
Are services in your parish accessible to all residents? Do you offer any services in foreign
languages? What can you offer those who may not have been in the UK for long?
2Resident in UK:
<1%
Research
&
Statistics

7
In your parish 67% of the population (that is 800 people) declared themselves as Christian in 2011
120
Statistics from the Annual
Parochial Returns 2011
Easter Communicants1
Easter Day Attendance1
Christmas Communicants1
Christmas Attendance1
Christians in your Parish
RELIGIOUS AFFILIATION
40
97
74
How has the religious affiliation of those living in your parish changed over the past decade? How closely does
it match that of the Diocese as a whole? Are Christians in your parish engaging with your churches? How are
you engaging with other faith groups?
0% 10% 20% 30% 40% 50% 60% 70% 80% 90% 100%
Parish 2001
Parish 2011
Diocese 2011
Christian Buddhist Hindu Jewish Muslim Sikh Other religions No religion Religion not stated
2
3
National Average Percentage Christian2 (59.4%)
Research
&
Statistics
2
2
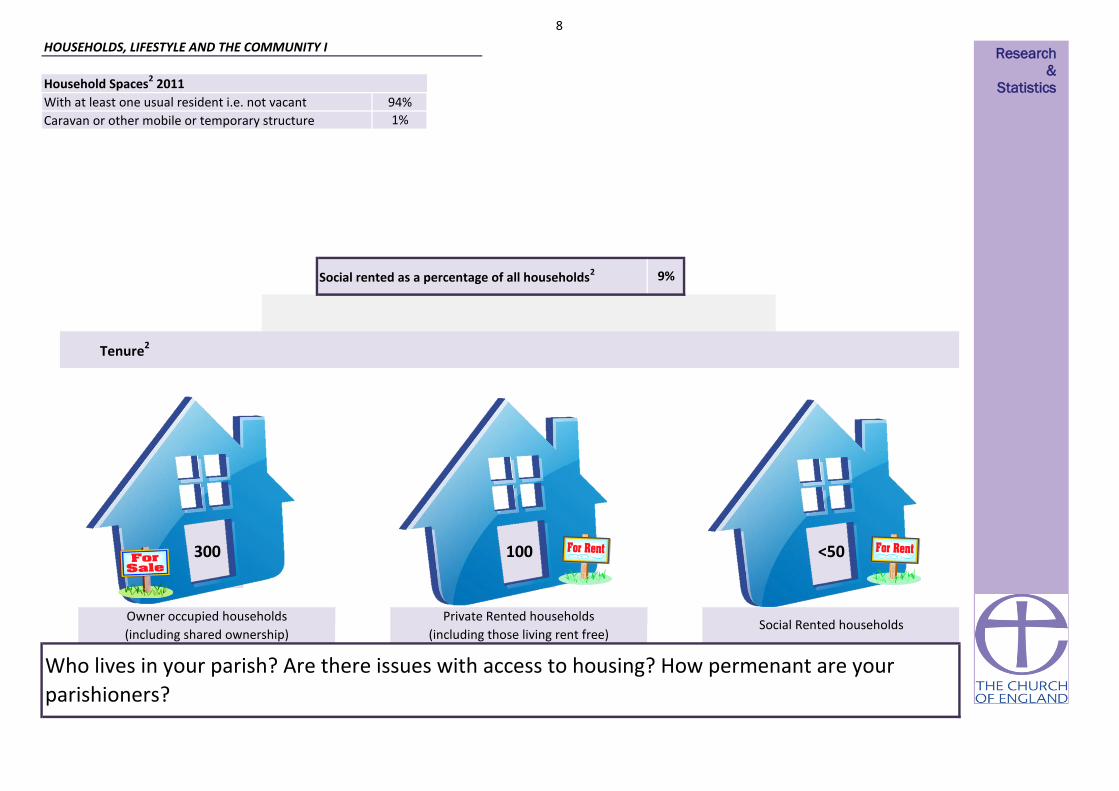
8
Household Spaces2 2011
With at least one usual resident i.e. not vacant 94%
1%Caravan or other mobile or temporary structure
300 100 <50
Who lives in your parish? Are there issues with access to housing? How permenant are your
parishioners?
Tenure2
Social rented as a percentage of all households2 9%
Social Rented householdsOwner occupied households
(including shared ownership)
Private Rented households
(including those living rent free)
HOUSEHOLDS, LIFESTYLE AND THE COMMUNITY I Research
&
Statistics

9
Household composition in your parish2 All
percentages are of the total number of
households with residents. The smaller pie
charts show the breakdown of a section of
the larger ones. You can use the colours to
match.
Lone Parent
Households as a
percentage of all
households with
children2
13%
Who lives in your parish? Are there a lot of households with children? What about lone parent
households? Are there a lot of people living alone?
HOUSEHOLDS, LIFESTYLE AND THE COMMUNITY II
Aged 65 and over 13%
Other 12%
One Person 25%
One family 71%
Other households
4%
Dependent children <1%
All aged 65 and over
<1%
Other 2%
Aged 65 and over 15%
Married or same-sex civil partnership couple 38%
Cohabiting couple 11%
Lone parent 7%
No children 13%
Dependent children 21%
Non-dependent children 4%
No children 6%
Dependent children 5%
Dependent children 4%
Non-dependent children 3%
Research
&
Statistics

10
Weddings & Blessings in 2010
Weddings & Blessings in 20113 No
Your Parish Churches held1
Do you hold many weddings in your parish? How is your parish supporting those in the above
categories?
2 No
Marital and civil partnership status
80% 60% 40% 20% 0% 20% 40% 60% 80%
Living in a couple: Married or in a registered same-sex civil partnership
Living in a couple: Cohabiting
Not living in a couple: Single (never married or never registered a same-sex civilpartnership)
Not living in a couple: Married or in a registered same-sex civil partnership
Not living in a couple: Separated (but still legally married or still legally in a same-sexcivil partnership)
Not living in a couple: Divorced or formerly in a same-sex civil partnership which isnow legally dissolved
Not living in a couple: Widowed or surviving partner from a same-sex civilpartnership
2001 2011
Research
&
Statistics 2 3
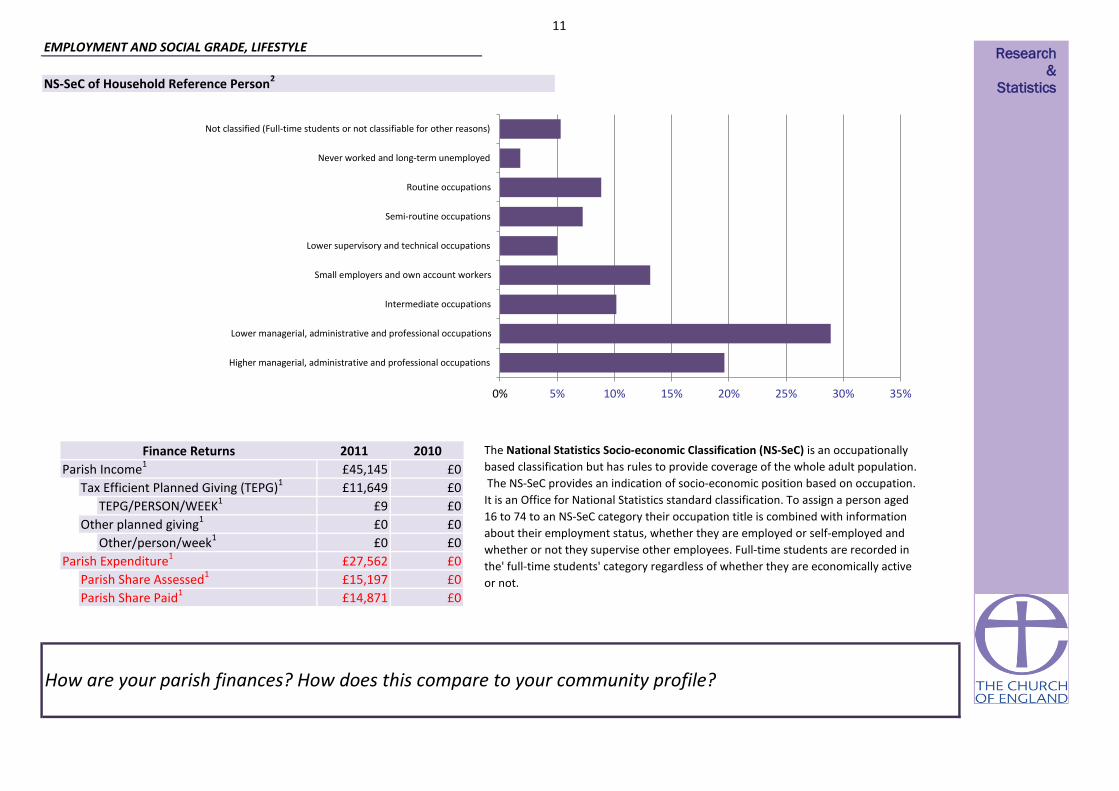
11
£0
£0
£0
£0
£0
£0
Parish Expenditure1
TEPG/PERSON/WEEK1
Other/person/week1Other planned giving1
How are your parish finances? How does this compare to your community profile?
£11,649
£45,145
EMPLOYMENT AND SOCIAL GRADE, LIFESTYLE
The National Statistics Socio-economic Classification (NS-SeC) is an occupationally
based classification but has rules to provide coverage of the whole adult population.
The NS-SeC provides an indication of socio-economic position based on occupation.
It is an Office for National Statistics standard classification. To assign a person aged
16 to 74 to an NS-SeC category their occupation title is combined with information
about their employment status, whether they are employed or self-employed and
whether or not they supervise other employees. Full-time students are recorded in
the' full-time students' category regardless of whether they are economically active
or not.Parish Share Assessed1
Parish Share Paid1
£0
£0
£27,562
£15,197
£14,871
£9
£0Tax Efficient Planned Giving (TEPG)1
Finance Returns 2010
NS-SeC of Household Reference Person2
£0Parish Income12011
Research
&
Statistics
0% 5% 10% 15% 20% 25% 30% 35%
Higher managerial, administrative and professional occupations
Lower managerial, administrative and professional occupations
Intermediate occupations
Small employers and own account workers
Lower supervisory and technical occupations
Semi-routine occupations
Routine occupations
Never worked and long-term unemployed
Not classified (Full-time students or not classifiable for other reasons)
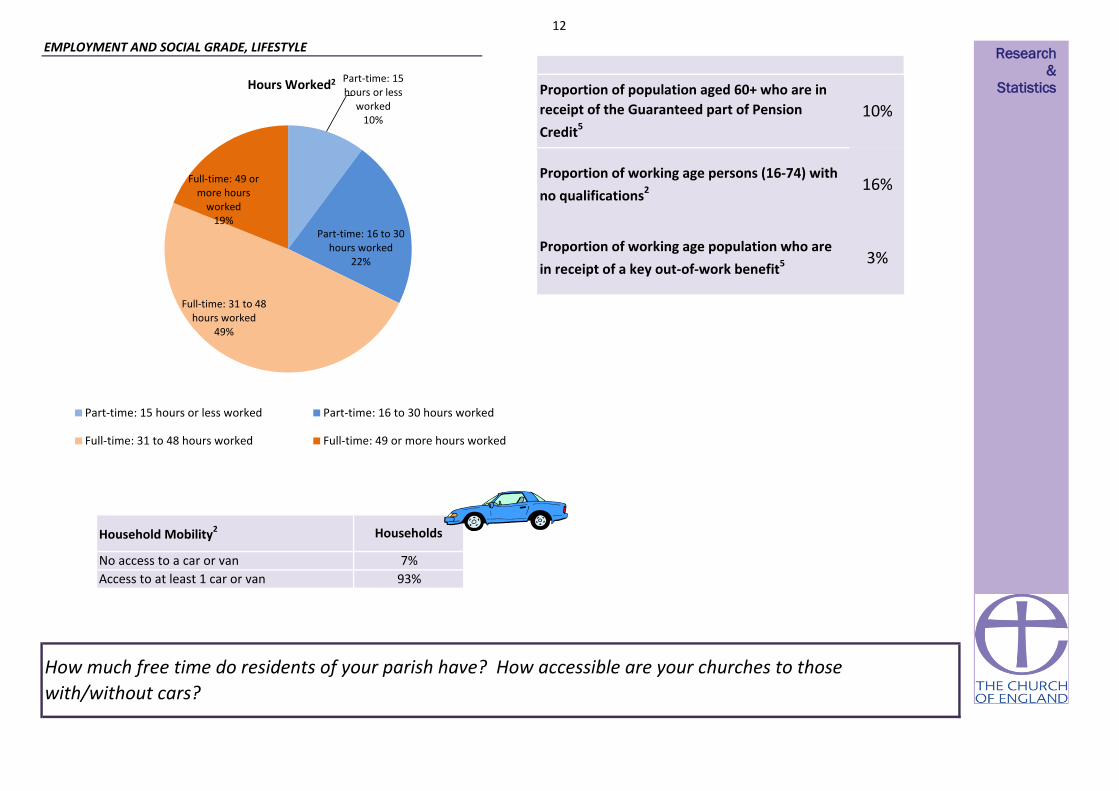
12
7%
93%
Households
3%
EMPLOYMENT AND SOCIAL GRADE, LIFESTYLE
How much free time do residents of your parish have? How accessible are your churches to those
with/without cars?
Access to at least 1 car or van
Household Mobility2
Proportion of population aged 60+ who are in
receipt of the Guaranteed part of Pension
Credit5
10%
Proportion of working age persons (16-74) with
no qualifications2 16%
Proportion of working age population who are
in receipt of a key out-of-work benefit5
No access to a car or van
Part-time: 15 hours or less
worked 10%
Part-time: 16 to 30 hours worked
22%
Full-time: 31 to 48 hours worked
49%
Full-time: 49 or more hours
worked 19%
Hours Worked2
Part-time: 15 hours or less worked Part-time: 16 to 30 hours worked
Full-time: 31 to 48 hours worked Full-time: 49 or more hours worked
Research
&
Statistics

13
Church Schools in the parish
KIRTLINGTON CE PRIMARY SCHOOL
Parish2 2011 (proportion of 16+ population) National2 2011 (proportion of 16+ population)
EDUCATION AND SCHOOLS
How qualified are residents of your parish? What Church of England schools are available?
14%
10%
14%
3% 12%
44%
4%
22%
13%
15% 4%
12%
27%
6% No qualifications (No formal qualifications)
Level 1 qualifications (1-4 GCSEs or equivalent)
Level 2 qualifications (5 GCSEs or equivalent)
Apprenticeships
Level 3 qualifications (2 or more A-levels orequivalent )
Level 4 qualifications and above (Bachelorsdegree or equivalent, and higher qualifications)
Other qualifications (including foreignqualifications)
Research
&
Statistics
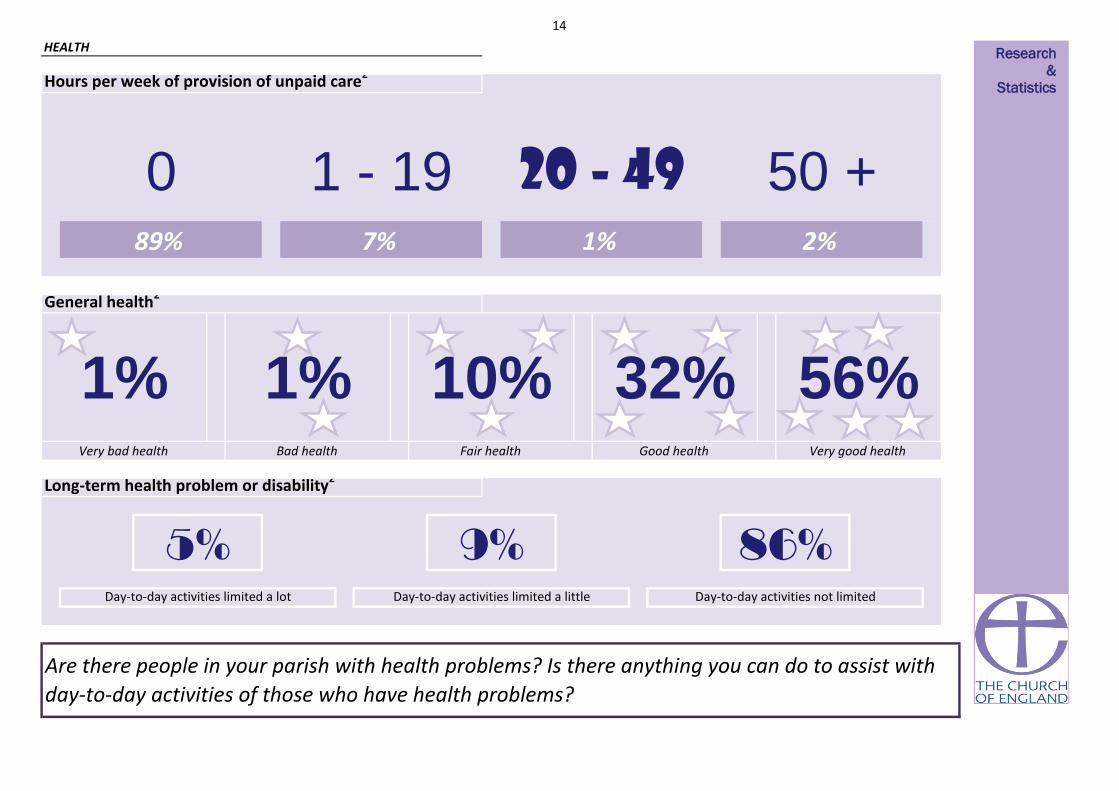
14
Hours per week of provision of unpaid care2
1% 2%
Very bad health Bad health Fair health
1 - 19
Are there people in your parish with health problems? Is there anything you can do to assist with
day-to-day activities of those who have health problems?
HEALTH
0
Long-term health problem or disability2
50 +89% 7%
Good health Very good health
1%
Day-to-day activities limited a lot Day-to-day activities limited a little Day-to-day activities not limited
5% 9% 86%
1% 10% 32% 56%
General health2
20 - 49
Research
&
Statistics

15
You parish can be categorised as in the most or least deprived 10% or 50% of all parishes within the diocese and of all parishes nationally
50% most deprived 50% most deprived
Life expectancy at birth (girls)6 (1999-2003)
Life Expectancy at birth (boys)6 (1999-2003)
9%
11.9
50% most deprived10% 50% least deprived
50% least deprivedPercentage of Children under 16 in Poverty7 (2010)
Percentage of working age persons (16-74) with no
qualifications2 (2011)
50% most deprived
Life expectancy at birth can give an idea of overall quality of life. Life expectancy is an average. Women tend to have greater life expectancy. Life expectany can be affected by family history, marital status, economic status,
physique, exercise, diet, drug use including smoking and alcohol consumption, disposition, education, environment, sleep, climate, and health care.
Proportion of the population aged 60+ who are in receipt of
the Guaranteed part of Pension Credit5 (2012)
6%
Social rented as a percentage of all households2 (2011)
Index of Multiple Deprivation (IMD)8 (2010)
Proportion of the working age population who are in receipt
of a key out-of-work benefit5 (2012)
Lone Parent Households as a percentage of all households
with children2 (2011)
Pension Credit is an income related benefit made up of 2 parts - Guarantee Credit and Savings Credit. The guaranteed part tops up weekly income if it’s below £142.70 (single people) or £217.90 (couples) so those who
receive this are on a low income. This statistic only covers people living in private households, and not residential institutions (such as nursing homes).
50% least deprived
The proportion of children in families in receipr of either out of work benefits or tax credits where their reported income is less than 60% median income. Poor children may be excluded from participating in society. They may be unable to afford school
trips and activities; school uniforms or warm winter clothes, be unable to go swimming, have friends round for tea or celebrate their birthdays. Many will never have a holiday. Children who grow up poor are more likely to leave school without
qualifications, have lower employment chances, thus restricting their ability to get a good job and financially contribute to society.
50% least deprived
16% 50% least deprived
DEPRIVATION AND KEY ISSUES AFFECTING PARISHIONERS
Score
76
50% most deprived80
3%
Deprivation is considered to be a multi-dimensional problem, encompassing a range of domains such as financial, health, education, services or crime. continuous measure of relative deprivation therefore there is no definitive point on the scale below
which areas are considered to be deprived and above which they are not.While being in the most deprived 10% may indicate financial disadvantage, it could equally be due to isolated living.
Number of people aged 16 to State Pension age claiming: Jobseeker’s Allowance (JSA), Employment and Support Allowance (ESA), Incapacity Benefit (IB), Income Support (IS) (as a lone parent or in the “other” category),
Other income related benefits.
Social housing is housing that is let at low rents and on a secure basis to people in housing need. It is generally provided by councils and not-for-profit organisations such as housing associations. Vulnerable groups are often
concentrated in the social housing sector, with low rates of employment and low income levels
Children in single parent families have a much higher risk of living in poverty than children in couple families. Single parents may rely on informal childcare.
What are the particular issues that affect your parish? Are you doing anything to address these?
50% least deprived
Deprivation Indicator Diocesan Position National Position
A low-level of skill or educational attainment is one indicator of social disadvantage. Qualifications may make it easier to find employment. Learning also helps promote active citizenship and combat social exclusion.
13%
50% least deprived
50% least deprived
50% least deprived
50% most deprived
50% least deprived
50% least deprived
50% least deprived
Research
&
Statistics

16
0
0.1 50% least deprived 0
0
2
50% most deprived
50% most deprived
50% most deprived
50% least deprived
50% most deprived
50% most deprived
0 0 0
50% least deprived
50% least deprived 10% least deprived
00 0
0
0
0
0
0
50% least deprived
50% most deprived
50% least deprived
50% most deprived
50% least deprived
50% most deprived
10% least deprived
10% least deprived
0 0 1
0Skills Sub-domain 7.7
0
0
0
0
00 0
0
0
0
0
0
0
0
0
0
0
0 0
0
0 0
0
0
0
0
0
0
0
0
1
0
0.0
0.0
5%
0 0
10050% least deprived
0
0
0
1
0
0
0
8.8
1
50% most deprived
50% most deprived
0
00
50% least deprived 0
0
50% least deprived 0
50% least deprived 0
Number of LSOAs amongst
least deprived*Diocesan position National position
HEALTH DEPRIVATION AND
DISABILITY-0.7
Average
Score for
parishIMD Subdomains8 (2010)
INCOME
EMPLOYMENT
Number of LSOAs amongst
most deprived*
1%
0
Income Deprivation Affecting
Children Index0.0
CRIME AND DISORDER
LIVING ENVIRONMENT
Indoors Sub-domain
Outdoors Sub-domain
0
0
Geographical Barriers Sub-domain
24.0
50% most deprived
EDUCATION SKILLS AND TRAINING
BARRIERS TO HOUSING AND SERVICES50% most deprived
Wider Barriers Sub-domain
Children/Young People Sub-domain9.9 0 0
0
0
50% most deprived 50% least deprived
0
0
0
0
0
-0.2
050% most deprived
5.4
68.8
18.2
17.8
43.5
50% most deprived 50% least deprived
10% 1%
DEPRIVATION AND KEY ISSUES AFFECTING PARISHIONERSIt is important to note that these statistics are a measure of deprivation, not affluence, and to recognise that not every person in a highly deprived area will themselves be
deprived. Equally, there will be some deprived people living in the least deprived areas.
Deprivation covers a broad range of issues and refers to unmet needs caused by a lack of resources of all kinds, not just financial. The English Indices of Deprivation
attempt to measure a broader concept of multiple deprivation, made up of several distinct dimensions, or domains, of deprivation. Seven domains of deprivation are
combined to produce the overall Index of Multiple Deprivation. Each domain contains a number of component indicators. The English Indices of Deprivation are a
continuous measure of relative deprivation therefore there is no definitive point on the scale below which areas are considered to be deprived and above which they are
not. Deprived areas have been defined in this release as those containing LSOAs that are amongst the 10 per cent most deprived in England according to the overall Index
of Multiple Deprivation.
Overall IMD 0 000
5% 10%
11.9 50% most deprived
00
00 0
*There are 2 full or partial LSOAs included in this parish
0 0
What are the particular issues that affect your parish? Are you doing anything to address these?
Income Deprivation Affecting Older
People Index
0
Research
&
Statistics

17
This spotlight has given you some information about your parish both in terms of your own church congregations and your local community. This is not an
end in itself, but rather a starting place for you to explore further. Questions to consider might include:
• What does our congregation look like?
• How does it compare to the local population?
• What other churches are there in the area? What parts of the community do they reach? Which parts of the community are being missed?
• What other local organisations or centres are there, that might bring people into our parish? Examples might be Hospitals or health centres, prisons, job
centres, homeless shelters, schools, charities, mother and toddler groups, uniformed organisations, community centres, libraries, shops, offices, stations?
How can we interact with these people?
• What areas of our parish do we know well or less well?
• How does the local community change between weekdays and weekends? How do our services and events fit with the shifting local population?
• Is our website/'A Church Near You' profile up to date?
• Are our records up to date?
****************************************************************************************************************************
What to do next?
Your notes
WHAT TO DO NEXT Research
&
Statistics

18
Sources of further information
Public Health Observatories - APHO JSNA Datasets (The datasets are intended to cover a
range of issues, focused on underlying determinants of health and conditions which account
for substantial numbers of preventable diseases and deaths.)
A Church Near You
www.achurchnearyou.com
UpMyStreet - UK house prices, property, crime, local neighbourhood & schools
London Street Gangs - Territory maps and background information
http://www.londonstreetgangs.com/
Hint: Scroll to the bottom of the "Gang Maps" page to see boundaries.
AboutMyArea - The local interactive site - news, reviews, what's on, events, businesses
Research & Statistics GIS
http://www.churchofengland.org/about-us/facts-stats/research-statistics/census-2011.aspx
Church Urban Fund
www.cuf.org.uk
Homeless Pages - Information, Research and Publications on homelessness
http://www.homelesspages.org.uk/
http://www.upmystreet.com/
Hint: Use the "My Neighbourhood" tab
The network of Public Health Observatories - Health Profiles
www.apho.org.uk/resource/view.aspx?RID=91736
The Poverty Site - Geographic Analysis
www.poverty.org.uk/summary/regional.shtml
http://www.apho.org.uk/default.aspx?QN=HP_FINDSEARCH2011
MurderMap - London Homicide Reported Direct from The Old Bailey
Police.uk - Local crime and policing information for England and Wales
http://www.police.uk/
ONS - Neighbourhood Statistics
http://www.aboutmyarea.co.uk/
http://neighbourhood.statistics.gov.uk/
Hint: Use the summary box
http://www.murdermap.co.uk/
Research
&
Statistics

19
Proportion of the population aged 60+ who are in receipt of the Guaranteed part of Pension Credit (August 2012)
Estimated using LSOA level data sourced from http://83.244.183.180/NESS/BEN/iben.htm
Proportion of the working age population who are in receipt of a key out-of-work benefit (Q3 2012)
Life Expectancy at birth (boys) (1999-2003)
Estimated using ward level data from ONS.
Life expectancy at birth (girls) (1999-2003)
Estimated using ward level data from ONS.
Percentage of Children under 16 in Poverty (2009)
Estimated using LSOA level data from http://www.hmrc.gov.uk/statistics/child-poverty-stats.htm
IMD (2010)
Methodology: Government data is published on government boundaries that do not match ecclesiastical boundaries. In order to produce parish population and demographic
estimates we have worked with the ONS to use a best fit modelling process. As such, these statistics can only be considered estimates and, particularly in very diverse areas, are
best used in the context of local knowledge. Where parish populations are sparse the figures for government areas overlapping the parish are used.
Parish estimates from the census have been calculated using the census output area data published by the ONS. These are provisional estimates, and when more granular data at
postcode level is available, will be revised. Estimates have been modelled by allocating the population weighted centroid of each output area to the parish within which it falls.
This means that some parishes have not been allocated population, however proportions for demographic variables have been calculated based on the output areas overlaying
the parish.
For further information about this process, please contact [email protected].
Contains public sector information licensed under the Open Government Licence v1.0 http://www.nationalarchives.gov.uk/doc/open-government-licence/
Estimated using OA level data sourced from ONS Census Data 2011, ONS
Estimated using OA level data sourced from ONS Census Data 2001, ONS
When analysing data, it is important to consider that some parishes are very small and proportions may be very large even where very few cases meet the criteria.
ABOUT THIS DATA
http://www.churchofengland.org/about-us/facts-stats/research-statistics/clergydiversityaudit2005linkpage.aspx
Estimated using OA level data from DWP Information, Governance and Security Directorate from
http://statistics.dwp.gov.uk/asd/asd1/tabtools/census_output_area_data/index.php?page=census_output_area_data
Annual parochial returns
ONS Census data 2011
ONS Census data 2001
2007 Church Diversity Survey
DWP
ONS
HMRC
Department for Communities and Local Government
1
2
3
4
5
6
7
8
These have been collected annually between 2007 and 2011 by the Research and Statistics team, Archbishops’ Council
When quoting figures derived from this data, care should be taken with the level of accuracy quoted.
Estimated using LSOA level data from Communities and Local Government, 2010.
https://www.gov.uk/government/uploads/system/uploads/attachment_data/file/6320/1870718.pdf
Research
&
Statistics

1
Contents
This short spotlight brings together a range of information about your parish,
both in terms of your congregations, but also the wider community living in
your area. It covers areas such as Christian affiliation, population age and
ethnicity profiles, household structures, deprivation, employment, schools
and qualifications, alongside church statistics such as attendance and giving.
There is information at the end of the spotlight about where this data comes
from and how it was calculated. If you have any further queries then please
do contact the Research and Statistics team at
This spotlight is not an end in itself, but rather a starting place for you to
explore further. You may want to discuss it at a PCC meeting or with
leadership teams. We’ve included some questions on each page to help you
to think about the information, however some things will be of more
relevance in some areas than others, and these are just suggestions to get
you started. We’ve also included some bigger questions about what to do
next at the end of the spotlight on page 17. There’s space for you to write
some notes here. It might be helpful to write a short paragraph to
summarise your community profile or note down anything that has struck
you as particularly important. There are also details at the end for where
you can find further information should you want to dig a little deeper.
1. Summary: a brief overview of your parish, including what look to be 5 of
the most pressing social issues in your area
2. Age: age profile of your community
3. Ethnicity: ethnicity profile of your community
4. Integration: English language speaking and length of UK residency in your
community
5. Religious affiliation: religious affiliation in your community
6. Households: families, dependents, one person households, temporary
residents and housing tenure
7. Marital and civil partnership status
8. Employment: occupations, benefits and mobility in your community
9. Education: CofE schools and qualification levels in your community
10. Health: people with health problems and carers in your community
11. Deprivation: different types of deprivation in your community
Getting to know your parish
What is this spotlight?
How should I use it?
Questions
Research
&
Statistics

2
Parishioners at glance
Parish of: Lands common to Cottisford and Hethe Extra
Parochial Place
65 +
-
20013
20112
Population
Housing ConditionsElderly Deprivation
Diocese
Deanery
PARISH OVERVIEW
22%
Archdeaconry
16-64
Age
Gro
up
20013 Not available
20112 Not available
Included Churches
Oxford
Pensioner Poverty
Housing Access
Local Amenities
74%
73%
Issues to look out for in your parish
-
Annual Parochial Returns
Oct
ob
er W
eekl
y
Att
end
ance
1
6%
10%
62%
Age Profile (20112)
Proportion Christian
Sorry, no Fresh Expressions listed for this parish.Fresh Expressions
C'dral, Unkn or Extra-Paroch
-
0-4
5-15
2011 Parish
Share Paid1
-
Parish
2011 Tax Efficient Planned
Giving/person/week1
2011 Electoral
Roll1
Research
&
Statistics
0
0.2
0.4
0.6
0.8
1
1.2
2007 2008 2009 2010 2011
Highestweek
Average
LowestWeek
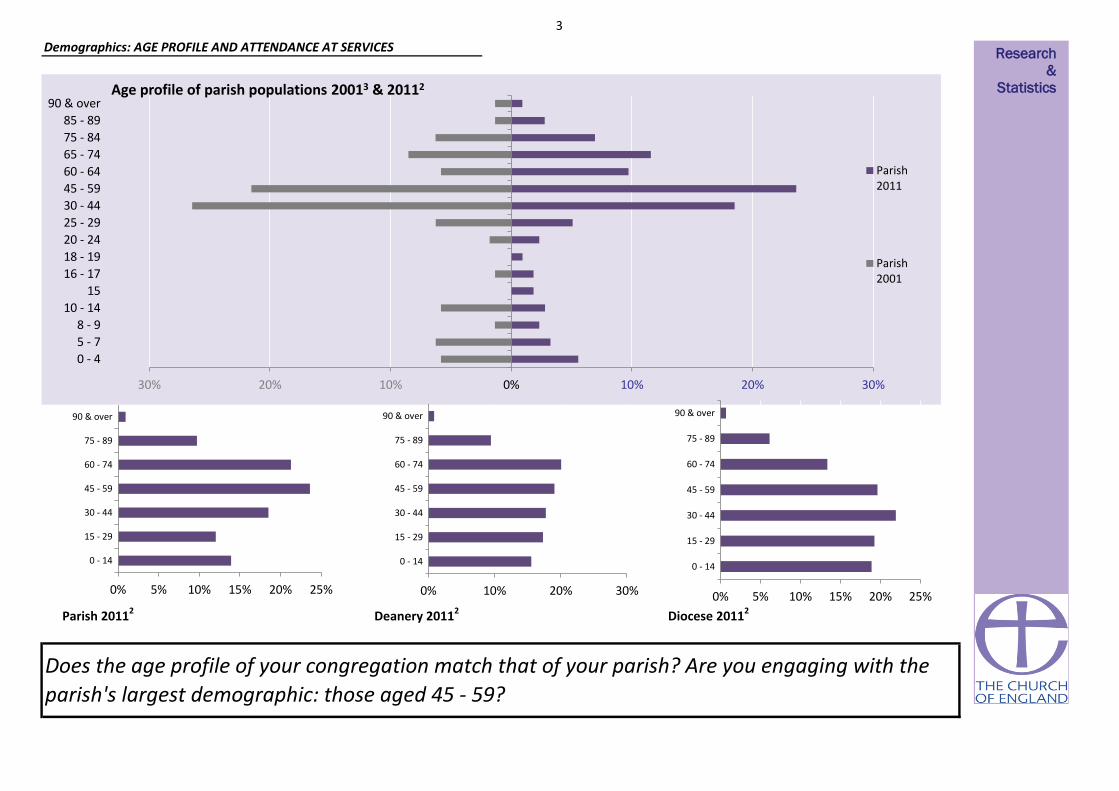
3
Parish 20112 Deanery 20112 Diocese 20112
Does the age profile of your congregation match that of your parish? Are you engaging with the
parish's largest demographic: those aged 45 - 59?
Demographics: AGE PROFILE AND ATTENDANCE AT SERVICES
30% 20% 10% 0% 10% 20% 30%
0 - 4
5 - 7
8 - 9
10 - 14
15
16 - 17
18 - 19
20 - 24
25 - 29
30 - 44
45 - 59
60 - 64
65 - 74
75 - 84
85 - 89
90 & overAge profile of parish populations 20013 & 20112
Parish2011
Parish2001
0% 5% 10% 15% 20% 25%
0 - 14
15 - 29
30 - 44
45 - 59
60 - 74
75 - 89
90 & over
0% 10% 20% 30%
0 - 14
15 - 29
30 - 44
45 - 59
60 - 74
75 - 89
90 & over
0% 5% 10% 15% 20% 25%
0 - 14
15 - 29
30 - 44
45 - 59
60 - 74
75 - 89
90 & over
Research
&
Statistics
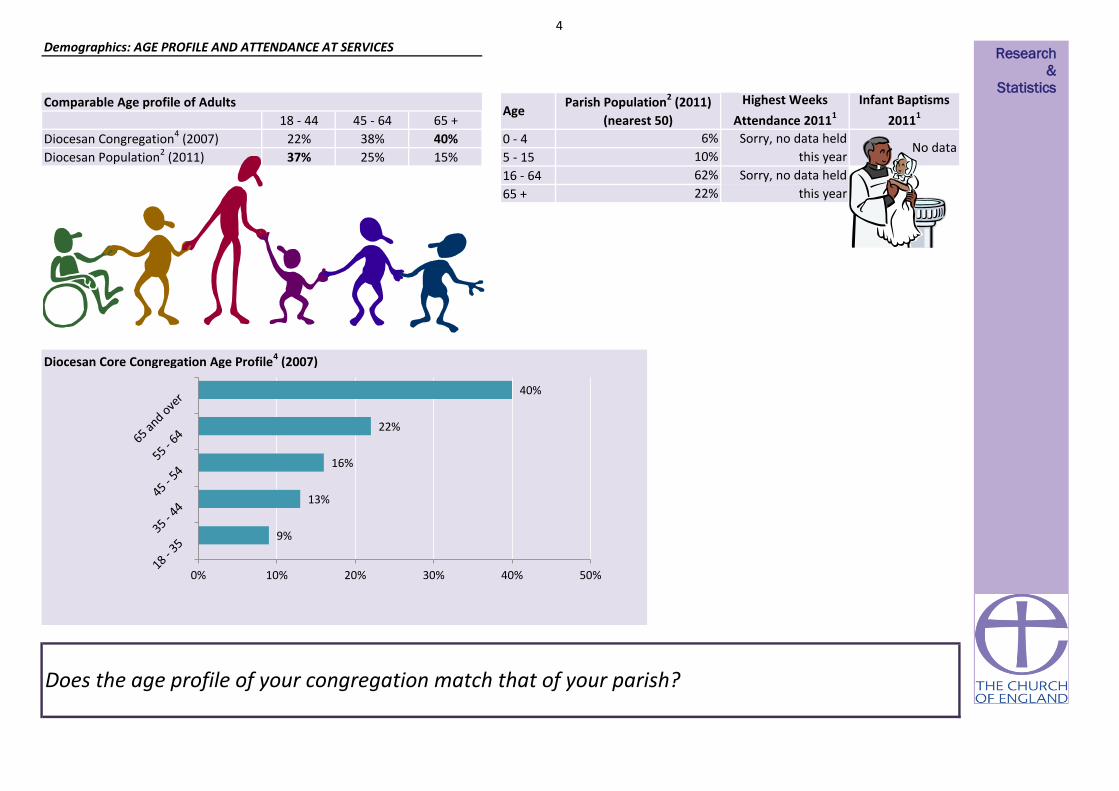
4
Sorry, no data held
this year
Infant Baptisms
20111Comparable Age profile of Adults
15%
Diocesan Congregation4 (2007)
Parish Population2 (2011)
(nearest 50)
Demographics: AGE PROFILE AND ATTENDANCE AT SERVICES
37%
45 - 64
Does the age profile of your congregation match that of your parish?
65 +
No data
Highest Weeks
Attendance 20111
Sorry, no data held
this year
6%
10%
62%
22%
0 - 4
5 - 15
16 - 64
Diocesan Core Congregation Age Profile4 (2007)
Diocesan Population2 (2011) 25%
65 +
40%
Age18 - 44
22% 38%
9%
13%
16%
22%
40%
0% 10% 20% 30% 40% 50%
Research
&
Statistics

5
Detailed Parish Ethnicity2 2011
Other Black
Gypsy or Irish
Traveller
White & Black
African
<1%
Irish
Pakistani
<1%
Diocesan Population2 (2011)
Diocesan Core Congregation4 (aged 18+ only) (2007)
Percentage Minority Ethnic Background
15%
British
White & Black
Caribbean
IndianParish
Percentage
ME: 3%
Other Asian
<1%
<1%
White & Asian Other Mixed
<1%
<1%
0%
0%
94%
Other White
3%
3%
<1%
Does the ethnicity profile of your congregation match that of your parish? Are you engaging with the parish's
largest demographics: those describing themselves as White or Mixed/Multiple ethnic group?
Arab Other Ethnic Group
1%0%
0%
<1%
<1%<1%
Demographics: ETHNICITY
<1%
Bangladeshi Chinese
African Caribbean
Parish Ethnicity2 2011 Parish Ethnicity3 2001 Diocese Ethnicity2 2011
Research
&
Statistics
White
Mixed/Multipleethnic group
Asian/Asian British
Black or BlackBritish
Other ethnicgroup

6
<1% 6%
5 years or more but less
than 10 years
Are services in your parish accessible to all residents? Do you offer any services in foreign
languages? What can you offer those who may not have been in the UK for long?
2Resident in UK:
<1%
Have English as their main language (English or
Welsh if in Wales)
10 years or more
93%
2 years or more but less
than 5 years
Born in the UK
Less than 2 years
1%
0% 1% 99%2Percentage of people who
Demographics: Integration
Cannot speak English well or cannot speak
English Can speak English well or very well
Research
&
Statistics
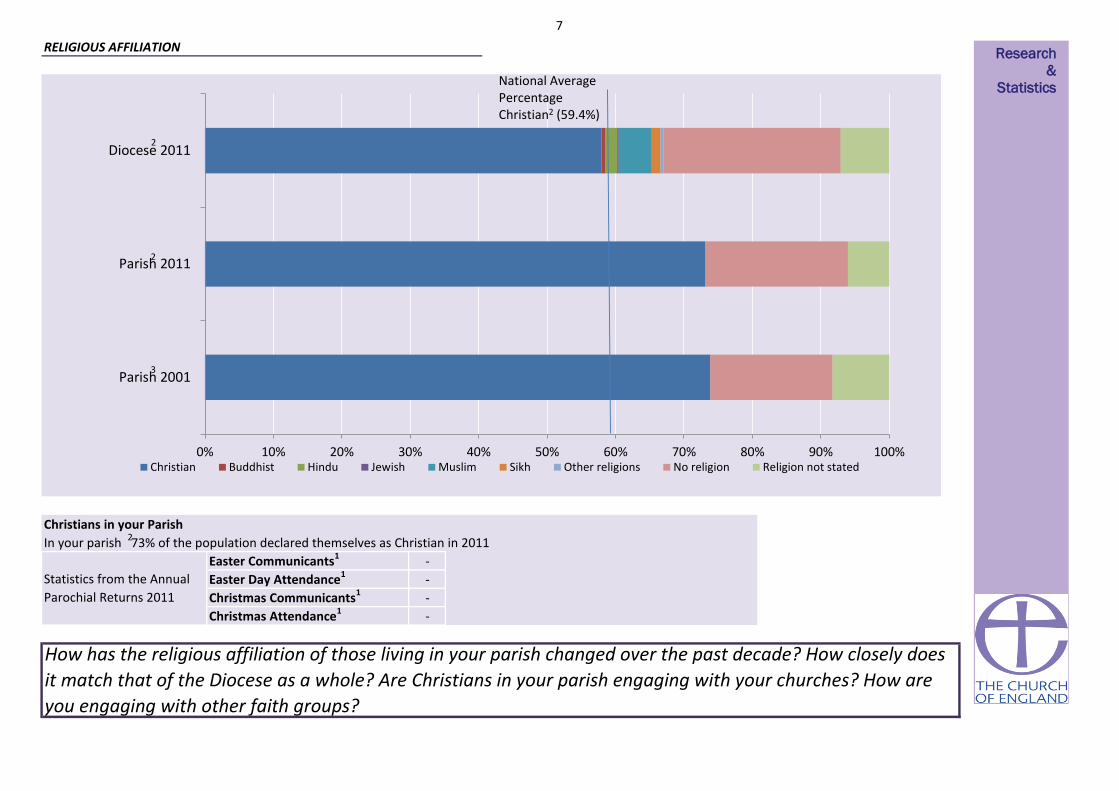
7
-
-
-
RELIGIOUS AFFILIATION
In your parish 73% of the population declared themselves as Christian in 2011
How has the religious affiliation of those living in your parish changed over the past decade? How closely does
it match that of the Diocese as a whole? Are Christians in your parish engaging with your churches? How are
you engaging with other faith groups?
-
Statistics from the Annual
Parochial Returns 2011
Easter Communicants1
Easter Day Attendance1
Christmas Communicants1
Christmas Attendance1
Christians in your Parish
0% 10% 20% 30% 40% 50% 60% 70% 80% 90% 100%
Parish 2001
Parish 2011
Diocese 2011
Christian Buddhist Hindu Jewish Muslim Sikh Other religions No religion Religion not stated
2
3
National Average Percentage Christian2 (59.4%)
Research
&
Statistics
2
2

8
HOUSEHOLDS, LIFESTYLE AND THE COMMUNITY I
Social Rented householdsOwner occupied households
(including shared ownership)
Private Rented households
(including those living rent free)
Household Spaces2 2011
With at least one usual resident i.e. not vacant 91%
0%Caravan or other mobile or temporary structure
67% 32% 1%
Who lives in your parish? Are there issues with access to housing? How permenant are your
parishioners?
Tenure2
Social rented as a percentage of all households2 1%
Research
&
Statistics

9
Who lives in your parish? Are there a lot of households with children? What about lone parent
households? Are there a lot of people living alone?
HOUSEHOLDS, LIFESTYLE AND THE COMMUNITY II
Household composition in your parish2 All
percentages are of the total number of
households with residents. The smaller pie
charts show the breakdown of a section of
the larger ones. You can use the colours to
match.
Lone Parent
Households as a
percentage of all
households with
children2
5%
Aged 65 and over 8% Other 12%
One Person 19%
One family 75%
Other households
5%
Dependent children <1%
All aged 65 and over
<1%
Other 5%
Aged 65 and over 16%
Married or same-sex civil partnership couple 46%
Cohabiting couple 12%
Lone parent 1%
No children 20%
Dependent children 19%
Non-dependent children 6%
No children 10%
Dependent children 2%
Dependent children 1%
Non-dependent children
<1%
Research
&
Statistics

10
Weddings & Blessings in 2010
Weddings & Blessings in 2011
No No
Marital and civil partnership status
No No
Your Parish Churches held1
Do you hold many weddings in your parish? How is your parish supporting those in the above
categories?
100% 80% 60% 40% 20% 0% 20% 40% 60% 80%
Living in a couple: Married or in a registered same-sex civil partnership
Living in a couple: Cohabiting
Not living in a couple: Single (never married or never registered a same-sex civilpartnership)
Not living in a couple: Married or in a registered same-sex civil partnership
Not living in a couple: Separated (but still legally married or still legally in a same-sexcivil partnership)
Not living in a couple: Divorced or formerly in a same-sex civil partnership which isnow legally dissolved
Not living in a couple: Widowed or surviving partner from a same-sex civilpartnership
2001 2011
Research
&
Statistics 2 3

11
NS-SeC of Household Reference Person2
Parish Income12011
EMPLOYMENT AND SOCIAL GRADE, LIFESTYLE
The National Statistics Socio-economic Classification (NS-SeC) is an occupationally
based classification but has rules to provide coverage of the whole adult population.
The NS-SeC provides an indication of socio-economic position based on occupation.
It is an Office for National Statistics standard classification. To assign a person aged
16 to 74 to an NS-SeC category their occupation title is combined with information
about their employment status, whether they are employed or self-employed and
whether or not they supervise other employees. Full-time students are recorded in
the' full-time students' category regardless of whether they are economically active
or not.Parish Share Assessed1
Parish Share Paid1
Tax Efficient Planned Giving (TEPG)1
Finance Returns 2010
Parish Expenditure1
TEPG/PERSON/WEEK1
Other/person/week1Other planned giving1
How are your parish finances? How does this compare to your community profile?
Research
&
Statistics
0% 5% 10% 15% 20% 25% 30%
Higher managerial, administrative and professional occupations
Lower managerial, administrative and professional occupations
Intermediate occupations
Small employers and own account workers
Lower supervisory and technical occupations
Semi-routine occupations
Routine occupations
Never worked and long-term unemployed
Not classified (Full-time students or not classifiable for other reasons)
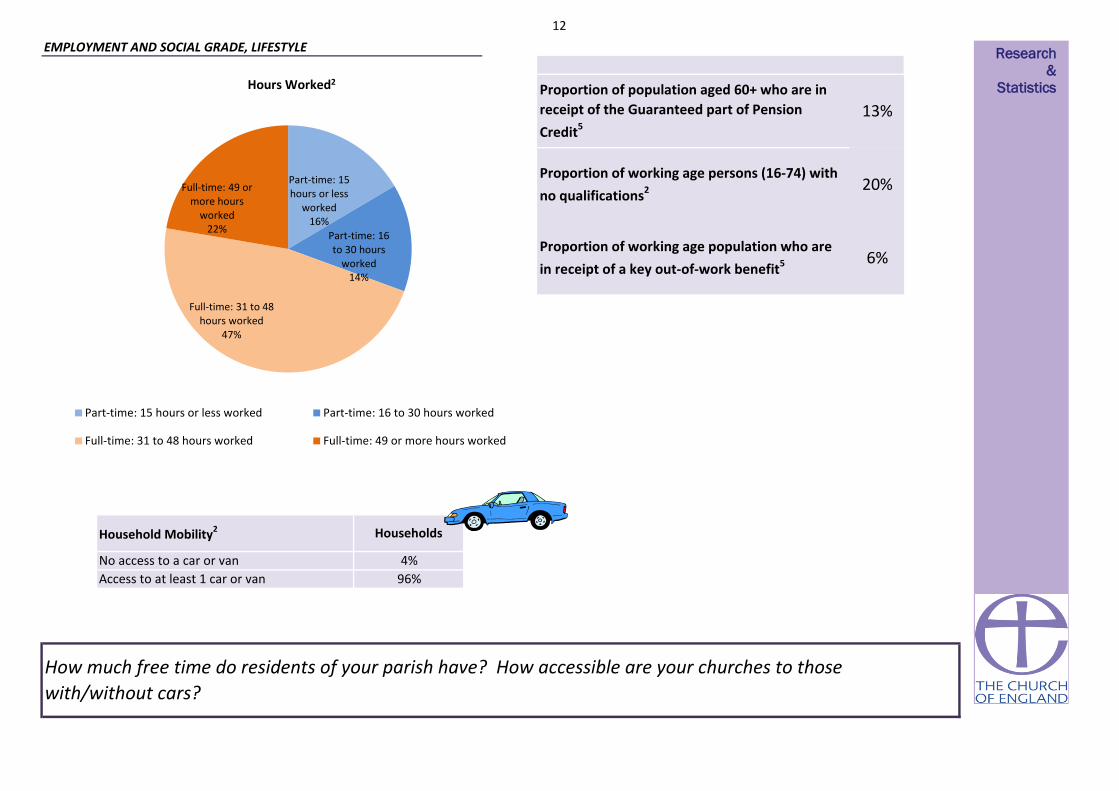
12
Proportion of population aged 60+ who are in
receipt of the Guaranteed part of Pension
Credit5
13%
Proportion of working age persons (16-74) with
no qualifications2 20%
Proportion of working age population who are
in receipt of a key out-of-work benefit5
No access to a car or van
EMPLOYMENT AND SOCIAL GRADE, LIFESTYLE
How much free time do residents of your parish have? How accessible are your churches to those
with/without cars?
Access to at least 1 car or van
Household Mobility2
6%
4%
96%
Households
Part-time: 15 hours or less
worked 16%
Part-time: 16 to 30 hours
worked 14%
Full-time: 31 to 48 hours worked
47%
Full-time: 49 or more hours
worked 22%
Hours Worked2
Part-time: 15 hours or less worked Part-time: 16 to 30 hours worked
Full-time: 31 to 48 hours worked Full-time: 49 or more hours worked
Research
&
Statistics

13
Church Schools in the parish
Sorry, we do not currently have
any Church Schools listed for this
parish.
EDUCATION AND SCHOOLS
How qualified are residents of your parish? What Church of England schools are available?
Parish2 2011 (proportion of 16+ population) National2 2011 (proportion of 16+ population)
18%
7%
25%
2%
10%
35%
3%
22%
13%
15% 4%
12%
27%
6% No qualifications (No formal qualifications)
Level 1 qualifications (1-4 GCSEs or equivalent)
Level 2 qualifications (5 GCSEs or equivalent)
Apprenticeships
Level 3 qualifications (2 or more A-levels orequivalent )
Level 4 qualifications and above (Bachelorsdegree or equivalent, and higher qualifications)
Other qualifications (including foreignqualifications)
Research
&
Statistics
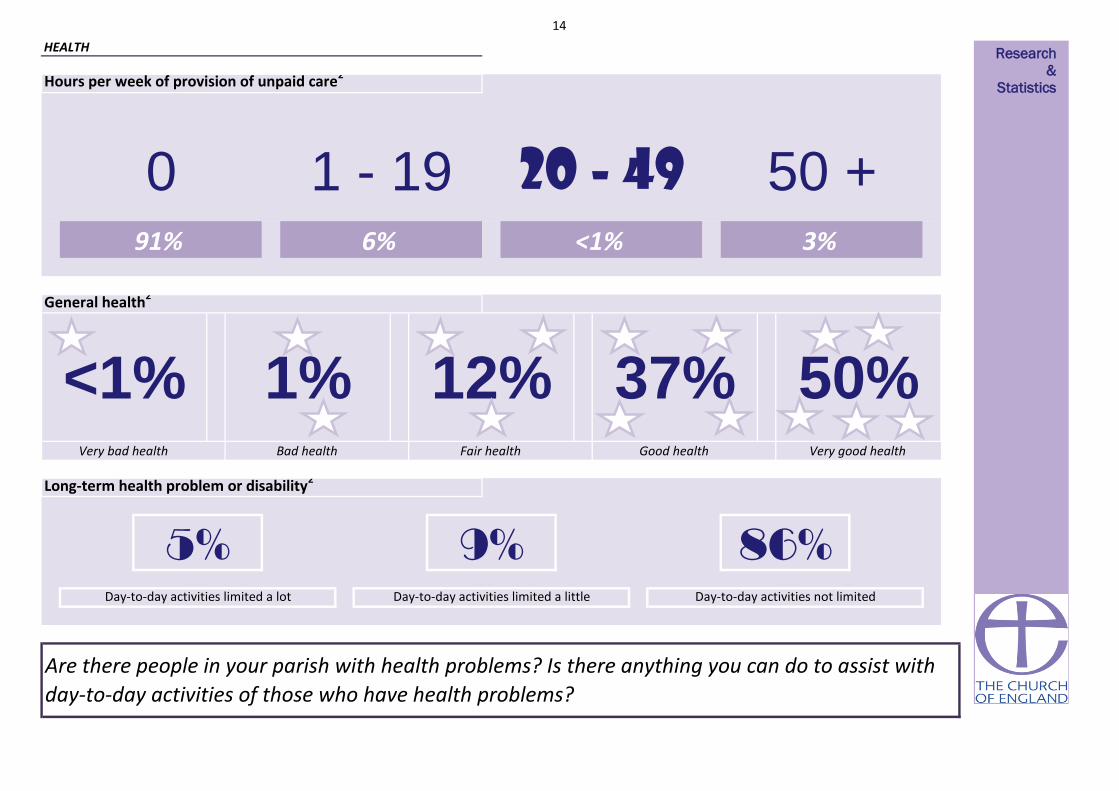
14
Hours per week of provision of unpaid care2
General health2
20 - 49 50 +91% 6%
Good health Very good health
<1%
Day-to-day activities limited a lot Day-to-day activities limited a little Day-to-day activities not limited
5% 9% 86%
1% 12% 37% 50%
Are there people in your parish with health problems? Is there anything you can do to assist with
day-to-day activities of those who have health problems?
HEALTH
0
Long-term health problem or disability2
1 - 19<1% 3%
Very bad health Bad health Fair health
Research
&
Statistics

15
A low-level of skill or educational attainment is one indicator of social disadvantage. Qualifications may make it easier to find employment. Learning also helps promote active citizenship and combat social exclusion.
5%
50% least deprived
10% least deprived
50% most deprived
50% most deprived
10% least deprived
50% most deprived
10% least deprived
Deprivation Indicator Diocesan Position National Position
10% least deprived88
6%
Deprivation is considered to be a multi-dimensional problem, encompassing a range of domains such as financial, health, education, services or crime. continuous measure of relative deprivation therefore there is no definitive point on the scale below
which areas are considered to be deprived and above which they are not.While being in the most deprived 10% may indicate financial disadvantage, it could equally be due to isolated living.
Number of people aged 16 to State Pension age claiming: Jobseeker’s Allowance (JSA), Employment and Support Allowance (ESA), Incapacity Benefit (IB), Income Support (IS) (as a lone parent or in the “other” category),
Other income related benefits.
Social housing is housing that is let at low rents and on a secure basis to people in housing need. It is generally provided by councils and not-for-profit organisations such as housing associations. Vulnerable groups are often
concentrated in the social housing sector, with low rates of employment and low income levels
Children in single parent families have a much higher risk of living in poverty than children in couple families. Single parents may rely on informal childcare.
What are the particular issues that affect your parish? Are you doing anything to address these?
10% least deprived
The proportion of children in families in receipr of either out of work benefits or tax credits where their reported income is less than 60% median income. Poor children may be excluded from participating in society. They may be unable to afford school
trips and activities; school uniforms or warm winter clothes, be unable to go swimming, have friends round for tea or celebrate their birthdays. Many will never have a holiday. Children who grow up poor are more likely to leave school without
qualifications, have lower employment chances, thus restricting their ability to get a good job and financially contribute to society.
50% least deprived
20% 50% most deprived
DEPRIVATION AND KEY ISSUES AFFECTING PARISHIONERS
Score
79
Lone Parent Households as a percentage of all households
with children2 (2011)
Pension Credit is an income related benefit made up of 2 parts - Guarantee Credit and Savings Credit. The guaranteed part tops up weekly income if it’s below £142.70 (single people) or £217.90 (couples) so those who
receive this are on a low income. This statistic only covers people living in private households, and not residential institutions (such as nursing homes).
50% least deprived
1%
13.3
50% most deprived13% 50% most deprived
50% most deprivedPercentage of Children under 16 in Poverty7 (2010)
Percentage of working age persons (16-74) with no
qualifications2 (2011)
10% least deprived
Life expectancy at birth can give an idea of overall quality of life. Life expectancy is an average. Women tend to have greater life expectancy. Life expectany can be affected by family history, marital status, economic status,
physique, exercise, diet, drug use including smoking and alcohol consumption, disposition, education, environment, sleep, climate, and health care.
Proportion of the population aged 60+ who are in receipt of
the Guaranteed part of Pension Credit5 (2012)
10%
Social rented as a percentage of all households2 (2011)
Index of Multiple Deprivation (IMD)8 (2010)
Proportion of the working age population who are in receipt
of a key out-of-work benefit5 (2012)
You parish can be categorised as in the most or least deprived 10% or 50% of all parishes within the diocese and of all parishes nationally
50% least deprived 50% least deprived
Life expectancy at birth (girls)6 (1999-2003)
Life Expectancy at birth (boys)6 (1999-2003)
Research
&
Statistics

16
0
10 0
*There are 3 full or partial LSOAs included in this parish
0 0
What are the particular issues that affect your parish? Are you doing anything to address these?
Income Deprivation Affecting Older
People Index
00
50% most deprived 50% most deprived
10% 1%
DEPRIVATION AND KEY ISSUES AFFECTING PARISHIONERSIt is important to note that these statistics are a measure of deprivation, not affluence, and to recognise that not every person in a highly deprived area will themselves be
deprived. Equally, there will be some deprived people living in the least deprived areas.
Deprivation covers a broad range of issues and refers to unmet needs caused by a lack of resources of all kinds, not just financial. The English Indices of Deprivation
attempt to measure a broader concept of multiple deprivation, made up of several distinct dimensions, or domains, of deprivation. Seven domains of deprivation are
combined to produce the overall Index of Multiple Deprivation. Each domain contains a number of component indicators. The English Indices of Deprivation are a
continuous measure of relative deprivation therefore there is no definitive point on the scale below which areas are considered to be deprived and above which they are
not. Deprived areas have been defined in this release as those containing LSOAs that are amongst the 10 per cent most deprived in England according to the overall Index
of Multiple Deprivation.
Overall IMD 0 000
5% 10%
13.3 50% most deprived
BARRIERS TO HOUSING AND SERVICES10% most deprived
Wider Barriers Sub-domain
Children/Young People Sub-domain3.1 0 0
0
0
50% least deprived 50% least deprived
1
0
0
0
0
-1.2
050% most deprived
2.2
87.5
12.7
19.8
50.1
Income Deprivation Affecting
Children Index0.0
CRIME AND DISORDER
LIVING ENVIRONMENT
Indoors Sub-domain
Outdoors Sub-domain
0
0
Geographical Barriers Sub-domain
28.6
10% most deprived
EDUCATION SKILLS AND TRAINING
50% least deprived 0
Number of LSOAs amongst
least deprived*Diocesan position National position
HEALTH DEPRIVATION AND
DISABILITY-0.4
Average
Score for
parishIMD Subdomains8 (2010)
INCOME
EMPLOYMENT 50% least deprived 0
Number of LSOAs amongst
most deprived*
1%
0
0
0
0
1
0
0
0
4.8
2
10% least deprived
50% least deprived
0
00
0
3
0
0.1
0.0
5%
0 0
200
0
0
0
0 0
1
0 1
0
0
0
3
0
0
0
50% most deprived
50% most deprived
50% least deprived
10% least deprived
50% least deprived
0 0 1
0Skills Sub-domain 6.5
0
2
0
0
00 0
0
0
0
0
0
1
0
10 0
0
0
0
0
0
50% least deprived
50% most deprived
50% least deprived
50% most deprived
50% least deprived 0
0
0
0.1 50% most deprived 0
0
2
50% most deprived
50% most deprived
10% most deprived
50% least deprived
50% most deprived
10% most deprived
0 0 0
50% most deprived
50% least deprived 10% least deprived
Research
&
Statistics

17
What to do next?
Your notes
WHAT TO DO NEXT
This spotlight has given you some information about your parish both in terms of your own church congregations and your local community. This is not an
end in itself, but rather a starting place for you to explore further. Questions to consider might include:
• What does our congregation look like?
• How does it compare to the local population?
• What other churches are there in the area? What parts of the community to they reach? Which parts of the community are being missed?
• What other local organisations or centres are there, that might bring people into our parish? Examples might be Hospitals or health centres, prisons, job
centres, homeless shelters, schools, charities, mother and toddler groups, uniformed organisations, community centres, libraries, shops, offices, stations?
How can we interact with these people?
• What areas of our parish do we know well or less well?
• How does the local community change between weekdays and weekends? How do our services and events fit with the shifting local population?
• Is our website/'A Church Near You' profile up to date?
• Are our records up to date?
****************************************************************************************************************************
Research
&
Statistics
18
http://www.londonstreetgangs.com/
Hint: Scroll to the bottom of the "Gang Maps" page to see boundaries.
AboutMyArea - The local interactive site - news, reviews, what's on, events, businesses
Research & Statistics GIS
http://www.churchofengland.org/about-us/facts-stats/research-statistics/census-2011.aspx
Church Urban Fund
www.cuf.org.uk
Homeless Pages - Information, Research and Publications on homelessness
http://www.homelesspages.org.uk/
http://www.upmystreet.com/
Hint: Use the "My Neighbourhood" tab
The network of Public Health Observatories - Health Profiles
www.apho.org.uk/resource/view.aspx?RID=91736
The Poverty Site - Geographic Analysis
www.poverty.org.uk/summary/regional.shtml
http://www.apho.org.uk/default.aspx?QN=HP_FINDSEARCH2011
MurderMap - London Homicide Reported Direct from The Old Bailey
Police.uk - Local crime and policing information for England and Wales
http://www.police.uk/
ONS - Neighbourhood Statistics
http://www.aboutmyarea.co.uk/
http://neighbourhood.statistics.gov.uk/
Hint: Use the summary box
http://www.murdermap.co.uk/
London Street Gangs - Territory maps and background information
UpMyStreet - UK house prices, property, crime, local neighbourhood & schools
Sources of further information
Public Health Observatories - APHO JSNA Datasets (The datasets are intended to cover a
range of issues, focused on underlying determinants of health and conditions which account
for substantial numbers of preventable diseases and deaths.)
A Church Near You
www.achurchnearyou.com
Research
&
Statistics

19
Proportion of the population aged 60+ who are in receipt of the Guaranteed part of Pension Credit (August 2012)
Estimated using LSOA level data sourced from http://83.244.183.180/NESS/BEN/iben.htm
Proportion of the working age population who are in receipt of a key out-of-work benefit (Q3 2012)
Life Expectancy at birth (boys) (1999-2003)
Estimated using ward level data from ONS.
Life expectancy at birth (girls) (1999-2003)
Estimated using ward level data from ONS.
Percentage of Children under 16 in Poverty (2009)
Estimated using LSOA level data from http://www.hmrc.gov.uk/statistics/child-poverty-stats.htm
IMD (2010)
Estimated using LSOA level data from Communities and Local Government, 2010.
https://www.gov.uk/government/uploads/system/uploads/attachment_data/file/6320/1870718.pdf
When quoting figures derived from this data, care should be taken with the level of accuracy quoted.
2007 Church Diversity Survey
DWP
ONS
HMRC
Department for Communities and Local Government
1
2
3
4
5
6
7
8
These have been collected annually between 2007 and 2011 by the Research and Statistics team, Archbishops’ Council
Methodology: Government data is published on government boundaries that do not match ecclesiastical boundaries. In order to produce parish population and demographic
estimates we have worked with the ONS to use a best fit modelling process. As such, these statistics can only be considered estimates and, particularly in very diverse areas, are
best used in the context of local knowledge. Where parish populations are sparse the figures for government areas overlapping the parish are used.
Parish estimates from the census have been calculated using the census output area data published by the ONS. These are provisional estimates, and when more granular data at
postcode level is available, will be revised. Estimates have been modelled by allocating the population weighted centroid of each output area to the parish within which it falls.
This means that some parishes have not been allocated population, however proportions for demographic variables have been calculated based on the output areas
overlaying the parish.
For further information about this process, please contact [email protected].
Contains public sector information licensed under the Open Government Licence v1.0 http://www.nationalarchives.gov.uk/doc/open-government-licence/
Estimated using OA level data sourced from ONS Census Data 2011, ONS
Estimated using OA level data sourced from ONS Census Data 2001, ONS
When analysing data, it is important to consider that some parishes are very small and proportions may be very large even where very few cases meet the criteria.
ABOUT THIS DATA
http://www.churchofengland.org/about-us/facts-stats/research-statistics/clergydiversityaudit2005linkpage.aspx
Estimated using OA level data from DWP Information, Governance and Security Directorate from
http://statistics.dwp.gov.uk/asd/asd1/tabtools/census_output_area_data/index.php?page=census_output_area_data
Annual parochial returns
ONS Census data 2011
ONS Census data 2001
Research
&
Statistics

1
Getting to know your parish
What is this spotlight?
How should I use it?
Questions
Contents
This short spotlight brings together a range of information about your parish,
both in terms of your congregations, but also the wider community living in
your area. It covers areas such as Christian affiliation, population age and
ethnicity profiles, household structures, deprivation, employment, schools
and qualifications, alongside church statistics such as attendance and giving.
There is information at the end of the spotlight about where this data comes
from and how it was calculated. If you have any further queries then please
do contact the Research and Statistics team at
This spotlight is not an end in itself, but rather a starting place for you to
explore further. You may want to discuss it at a PCC meeting or with
leadership teams. We’ve included some questions on each page to help you
to think about the information, however some things will be of more
relevance in some areas than others, and these are just suggestions to get
you started. We’ve also included some bigger questions about what to do
next at the end of the spotlight on page 17. There’s space for you to write
some notes here. It might be helpful to write a short paragraph to
summarise your community profile or note down anything that has struck
you as particularly important. There are also details at the end for where
you can find further information should you want to dig a little deeper.
1. Summary: a brief overview of your parish, including what look to be 5 of
the most pressing social issues in your area
2. Age: age profile of your community
3. Ethnicity: ethnicity profile of your community
4. Integration: English language speaking and length of UK residency in your
community
5. Religious affiliation: religious affiliation in your community
6. Households: families, dependents, one person households, temporary
residents and housing tenure
7. Marital and civil partnership status
8. Employment: occupations, benefits and mobility in your community
9. Education: CofE schools and qualification levels in your community
10. Health: people with health problems and carers in your community
11. Deprivation: different types of deprivation in your community
Research
&
Statistics
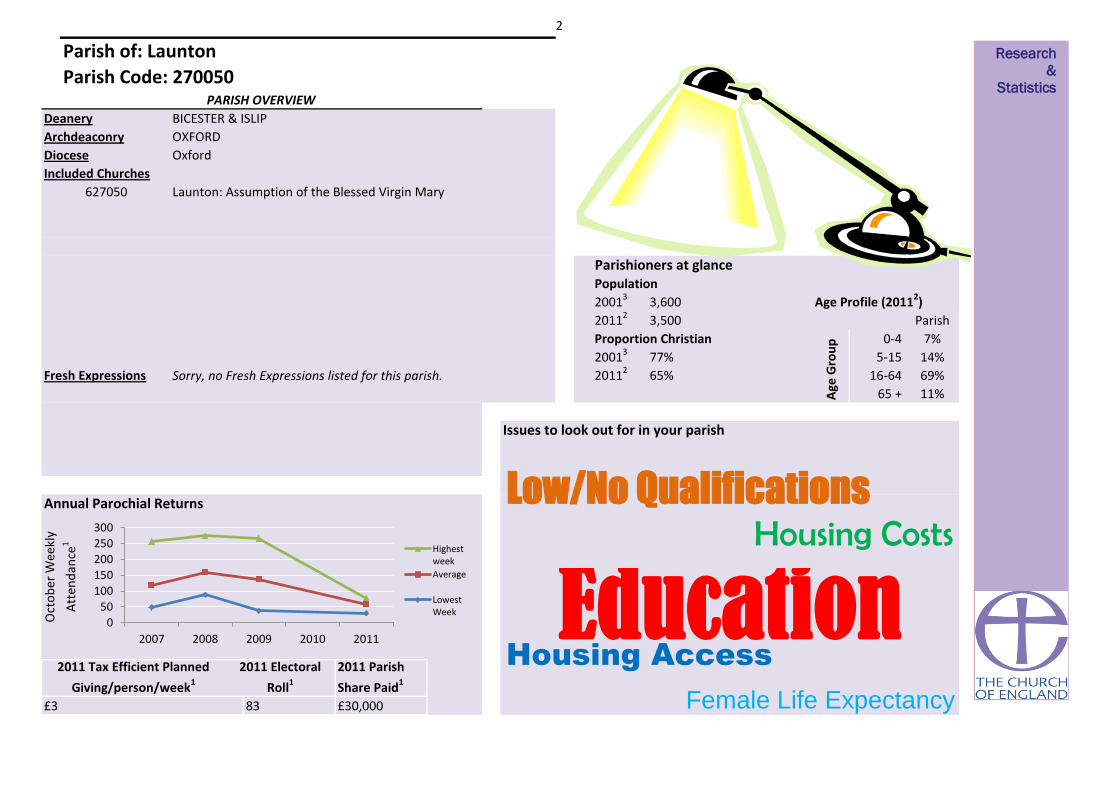
2
Parishioners at glance
Launton: Assumption of the Blessed Virgin Mary
2011 Tax Efficient Planned
Giving/person/week1
2011 Electoral
Roll1
Female Life Expectancy
Housing Access
Education
77%
65%
Issues to look out for in your parish
£3
Annual Parochial Returns
Oct
ob
er W
eekl
y
Att
end
ance
1
0-4
5-15
2011 Parish
Share Paid1
83
PARISH OVERVIEW
11%
Parish
7%
14%
69%
Age Profile (20112)3,600
Proportion Christian
Sorry, no Fresh Expressions listed for this parish.Fresh Expressions
3,500
BICESTER & ISLIP
OXFORD
16-64
Age
Gro
up
Diocese
627050
Deanery
Archdeaconry
20013
20112
20013
20112
Included Churches
Oxford
Population
Housing Costs
Parish of: Launton
Parish Code: 270050
65 +
£30,000
Low/No Qualifications
Research
&
Statistics
0
50
100
150
200
250
300
2007 2008 2009 2010 2011
Highestweek
Average
LowestWeek

3
Parish 20112 Deanery 20112 Diocese 20112
Demographics: AGE PROFILE AND ATTENDANCE AT SERVICES
Does the age profile of your congregation match that of your parish? Are you engaging with the
parish's largest demographic: those aged 30 - 44?
40% 30% 20% 10% 0% 10% 20% 30%
0 - 4
5 - 7
8 - 9
10 - 14
15
16 - 17
18 - 19
20 - 24
25 - 29
30 - 44
45 - 59
60 - 64
65 - 74
75 - 84
85 - 89
90 & overAge profile of parish populations 20013 & 20112
Parish2011
Parish2001
0% 5% 10% 15% 20% 25%
0 - 14
15 - 29
30 - 44
45 - 59
60 - 74
75 - 89
90 & over
0% 10% 20% 30%
0 - 14
15 - 29
30 - 44
45 - 59
60 - 74
75 - 89
90 & over
0% 5% 10% 15% 20% 25%
0 - 14
15 - 29
30 - 44
45 - 59
60 - 74
75 - 89
90 & over
Research
&
Statistics

4
15%
Diocesan Congregation4 (2007)
Parish Population2 (2011)
(nearest 50)
Demographics: AGE PROFILE AND ATTENDANCE AT SERVICES
Comparable Age profile of Adults
25%
65 +
40%
Age
250
500
18 - 44
22% 38%
2,450
400
0 - 4
5 - 15
16 - 64
Diocesan Core Congregation Age Profile4 (2007)
Diocesan Population2 (2011) 37%
45 - 64
Does the age profile of your congregation match that of your parish?
65 +
Infant Baptisms
20111
20
Highest Weeks
Attendance 20111
25
62
9%
13%
16%
22%
40%
0% 10% 20% 30% 40% 50%
Research
&
Statistics

5
Detailed Parish Ethnicity2 2011
Parish Ethnicity2 2011 Parish Ethnicity3 2001 Diocese Ethnicity2 2011
Arab Other Ethnic Group
<1%<1%
Indian Bangladeshi Chinese
African Caribbean
Parish
Percentage
ME: 4%
Other Asian
1%
Does the ethnicity profile of your congregation match that of your parish? Are you engaging with the parish's
largest demographics: those describing themselves as White or Mixed/Multiple ethnic group?
<1%
3%
<1%<1% <1%
0%
<1%<1%
Demographics: ETHNICITY
<1%
92%
Other White
4%
White & Asian Other Mixed
1%
1%
<1%
British
White & Black
Caribbean
Diocesan Population2 (2011)
Diocesan Core Congregation4 (aged 18+ only) (2007)
Percentage Minority Ethnic Background
15%
<1%
Irish
Pakistani
<1%
Other Black
Gypsy or Irish
Traveller
White & Black
African
Research
&
Statistics
White
Mixed/Multipleethnic group
Asian/Asian British
Black or BlackBritish
Other ethnicgroup

6
Cannot speak English well or cannot speak
English Can speak English well or very well
<1% 3%Have English as their main language (English or
Welsh if in Wales)
97%2Percentage of people who
Demographics: Integration
10 years or more
92%
2 years or more but less
than 5 years
Born in the UK
Less than 2 years
1% 2% 5%
5 years or more but less
than 10 years
Are services in your parish accessible to all residents? Do you offer any services in foreign
languages? What can you offer those who may not have been in the UK for long?
2Resident in UK:
1%
Research
&
Statistics

7
In your parish 65% of the population (that is 2,700 people) declared themselves as Christian in 2011
234
Statistics from the Annual
Parochial Returns 2011
Easter Communicants1
Easter Day Attendance1
Christmas Communicants1
Christmas Attendance1
Christians in your Parish
RELIGIOUS AFFILIATION
33
62
73
How has the religious affiliation of those living in your parish changed over the past decade? How closely does
it match that of the Diocese as a whole? Are Christians in your parish engaging with your churches? How are
you engaging with other faith groups?
0% 10% 20% 30% 40% 50% 60% 70% 80% 90% 100%
Parish 2001
Parish 2011
Diocese 2011
Christian Buddhist Hindu Jewish Muslim Sikh Other religions No religion Religion not stated
2
3
National Average Percentage Christian2 (59.4%)
Research
&
Statistics
2
2

8
Household Spaces2 2011
With at least one usual resident i.e. not vacant 98%
<1%Caravan or other mobile or temporary structure
1050 150 200
Who lives in your parish? Are there issues with access to housing? How permenant are your
parishioners?
Tenure2
Social rented as a percentage of all households2 15%
Social Rented householdsOwner occupied households
(including shared ownership)
Private Rented households
(including those living rent free)
HOUSEHOLDS, LIFESTYLE AND THE COMMUNITY I Research
&
Statistics
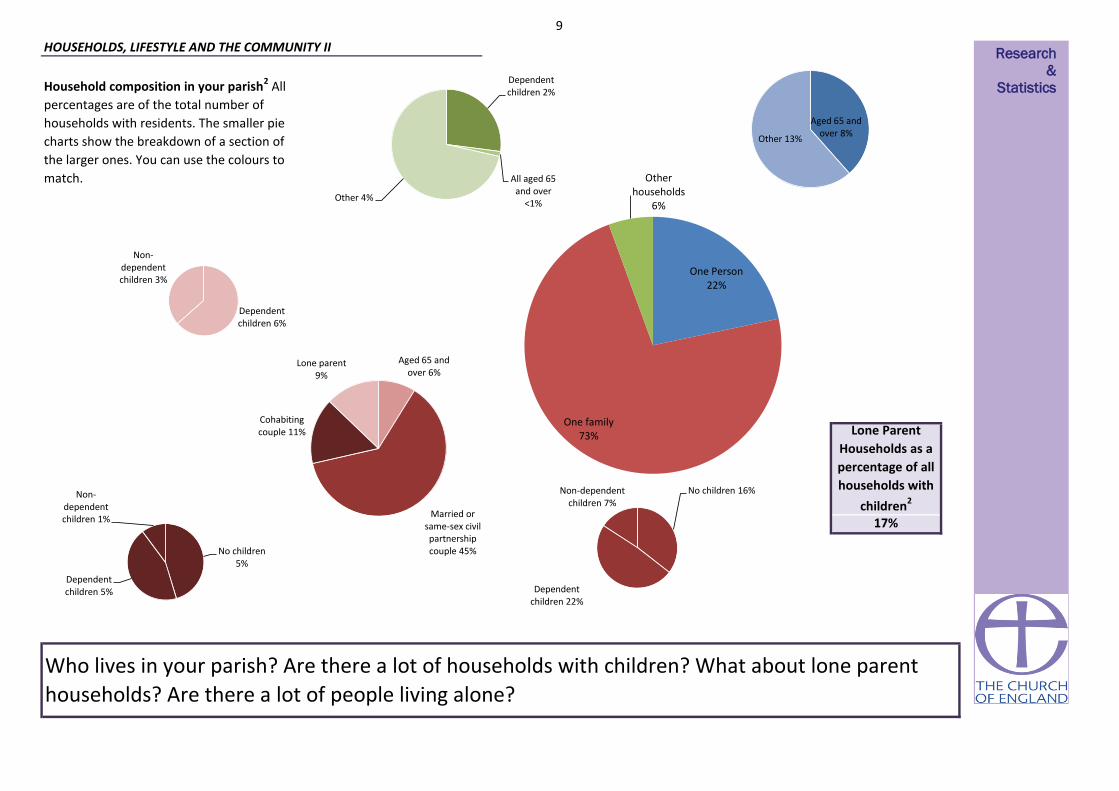
9
Household composition in your parish2 All
percentages are of the total number of
households with residents. The smaller pie
charts show the breakdown of a section of
the larger ones. You can use the colours to
match.
Lone Parent
Households as a
percentage of all
households with
children2
17%
Who lives in your parish? Are there a lot of households with children? What about lone parent
households? Are there a lot of people living alone?
HOUSEHOLDS, LIFESTYLE AND THE COMMUNITY II
Aged 65 and over 8%
Other 13%
One Person 22%
One family 73%
Other households
6%
Dependent children 2%
All aged 65 and over
<1% Other 4%
Aged 65 and over 6%
Married or same-sex civil partnership couple 45%
Cohabiting couple 11%
Lone parent 9%
No children 16%
Dependent children 22%
Non-dependent children 7%
No children 5%
Dependent children 5%
Non-dependent children 1%
Dependent children 6%
Non-dependent children 3%
Research
&
Statistics

10
Weddings & Blessings in 2010
Weddings & Blessings in 201117 6
Your Parish Churches held1
Do you hold many weddings in your parish? How is your parish supporting those in the above
categories?
No No
Marital and civil partnership status
80% 60% 40% 20% 0% 20% 40% 60%
Living in a couple: Married or in a registered same-sex civil partnership
Living in a couple: Cohabiting
Not living in a couple: Single (never married or never registered a same-sex civilpartnership)
Not living in a couple: Married or in a registered same-sex civil partnership
Not living in a couple: Separated (but still legally married or still legally in a same-sexcivil partnership)
Not living in a couple: Divorced or formerly in a same-sex civil partnership which isnow legally dissolved
Not living in a couple: Widowed or surviving partner from a same-sex civilpartnership
2001 2011
Research
&
Statistics 2 3

11
£12
£0
£0
£59,137
£26,500
£26,500
Parish Expenditure1
TEPG/PERSON/WEEK1
Other/person/week1Other planned giving1
How are your parish finances? How does this compare to your community profile?
£9,641
£34,002
EMPLOYMENT AND SOCIAL GRADE, LIFESTYLE
The National Statistics Socio-economic Classification (NS-SeC) is an occupationally
based classification but has rules to provide coverage of the whole adult population.
The NS-SeC provides an indication of socio-economic position based on occupation.
It is an Office for National Statistics standard classification. To assign a person aged
16 to 74 to an NS-SeC category their occupation title is combined with information
about their employment status, whether they are employed or self-employed and
whether or not they supervise other employees. Full-time students are recorded in
the' full-time students' category regardless of whether they are economically active
or not.Parish Share Assessed1
Parish Share Paid1
£0
£0
£45,093
£20,192
£30,000
£3
£11,354Tax Efficient Planned Giving (TEPG)1
Finance Returns 2010
NS-SeC of Household Reference Person2
£64,698Parish Income12011
Research
&
Statistics
0% 5% 10% 15% 20% 25%
Higher managerial, administrative and professional occupations
Lower managerial, administrative and professional occupations
Intermediate occupations
Small employers and own account workers
Lower supervisory and technical occupations
Semi-routine occupations
Routine occupations
Never worked and long-term unemployed
Not classified (Full-time students or not classifiable for other reasons)

12
12%
88%
Households
6%
EMPLOYMENT AND SOCIAL GRADE, LIFESTYLE
How much free time do residents of your parish have? How accessible are your churches to those
with/without cars?
Access to at least 1 car or van
Household Mobility2
Proportion of population aged 60+ who are in
receipt of the Guaranteed part of Pension
Credit5
12%
Proportion of working age persons (16-74) with
no qualifications2 18%
Proportion of working age population who are
in receipt of a key out-of-work benefit5
No access to a car or van
Part-time: 15 hours or less
worked 9%
Part-time: 16 to 30 hours
worked 16%
Full-time: 31 to 48 hours worked
61%
Full-time: 49 or more hours
worked 13%
Hours Worked2
Part-time: 15 hours or less worked Part-time: 16 to 30 hours worked
Full-time: 31 to 48 hours worked Full-time: 49 or more hours worked
Research
&
Statistics
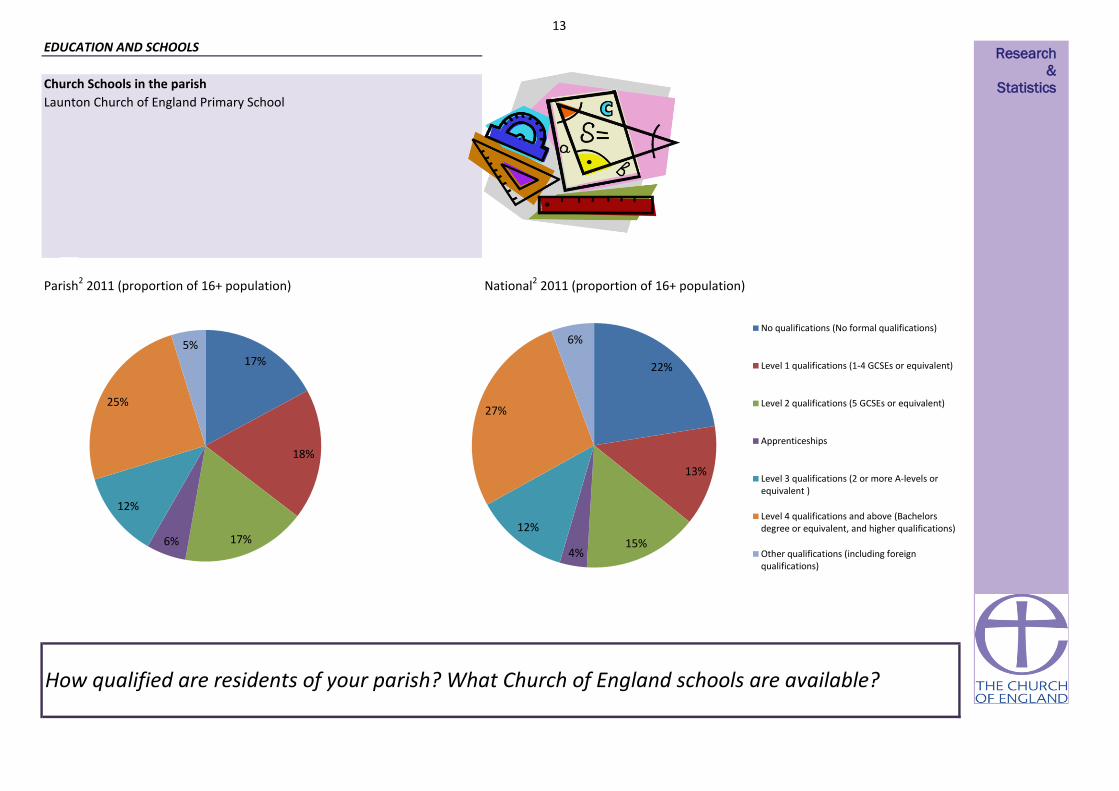
13
Church Schools in the parish
Launton Church of England Primary School
Parish2 2011 (proportion of 16+ population) National2 2011 (proportion of 16+ population)
EDUCATION AND SCHOOLS
How qualified are residents of your parish? What Church of England schools are available?
17%
18%
17% 6%
12%
25%
5%
22%
13%
15% 4%
12%
27%
6% No qualifications (No formal qualifications)
Level 1 qualifications (1-4 GCSEs or equivalent)
Level 2 qualifications (5 GCSEs or equivalent)
Apprenticeships
Level 3 qualifications (2 or more A-levels orequivalent )
Level 4 qualifications and above (Bachelorsdegree or equivalent, and higher qualifications)
Other qualifications (including foreignqualifications)
Research
&
Statistics

14
Hours per week of provision of unpaid care2
1% 2%
Very bad health Bad health Fair health
1 - 19
Are there people in your parish with health problems? Is there anything you can do to assist with
day-to-day activities of those who have health problems?
HEALTH
0
Long-term health problem or disability2
50 +91% 6%
Good health Very good health
1%
Day-to-day activities limited a lot Day-to-day activities limited a little Day-to-day activities not limited
6% 7% 87%
2% 10% 36% 51%
General health2
20 - 49
Research
&
Statistics
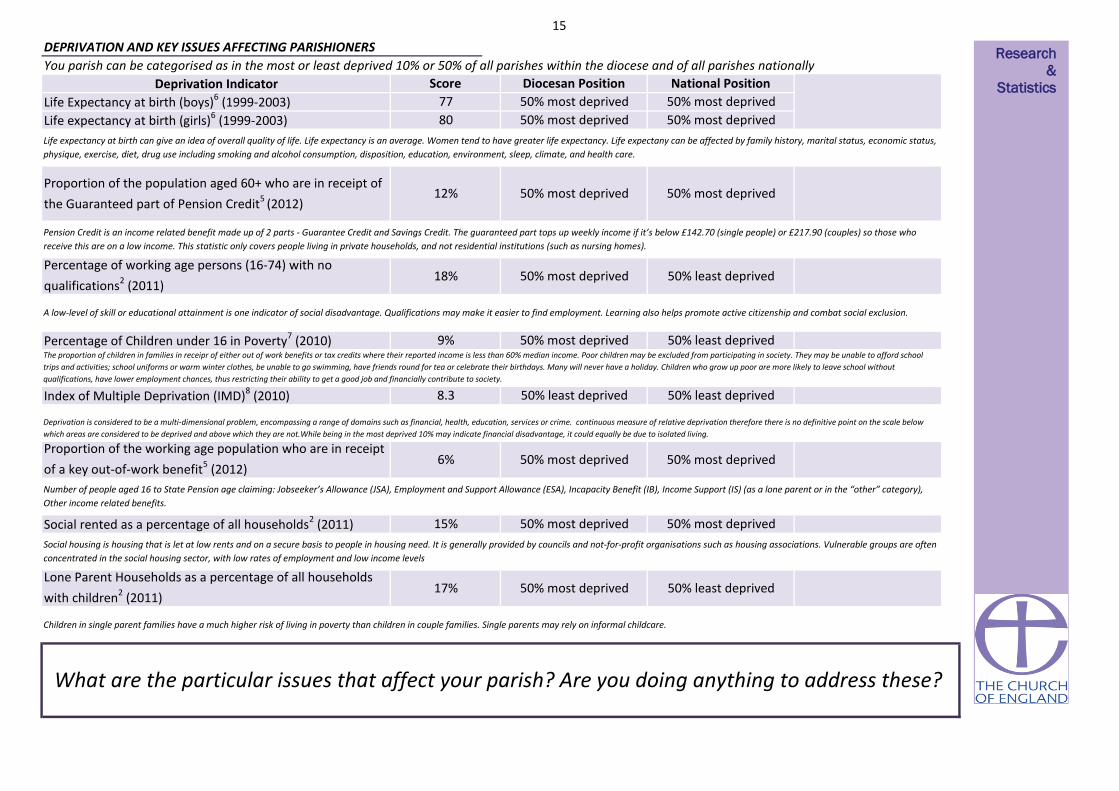
15
You parish can be categorised as in the most or least deprived 10% or 50% of all parishes within the diocese and of all parishes nationally
50% most deprived 50% most deprived
Life expectancy at birth (girls)6 (1999-2003)
Life Expectancy at birth (boys)6 (1999-2003)
15%
8.3
50% most deprived12% 50% most deprived
50% most deprivedPercentage of Children under 16 in Poverty7 (2010)
Percentage of working age persons (16-74) with no
qualifications2 (2011)
50% most deprived
Life expectancy at birth can give an idea of overall quality of life. Life expectancy is an average. Women tend to have greater life expectancy. Life expectany can be affected by family history, marital status, economic status,
physique, exercise, diet, drug use including smoking and alcohol consumption, disposition, education, environment, sleep, climate, and health care.
Proportion of the population aged 60+ who are in receipt of
the Guaranteed part of Pension Credit5 (2012)
9%
Social rented as a percentage of all households2 (2011)
Index of Multiple Deprivation (IMD)8 (2010)
Proportion of the working age population who are in receipt
of a key out-of-work benefit5 (2012)
Lone Parent Households as a percentage of all households
with children2 (2011)
Pension Credit is an income related benefit made up of 2 parts - Guarantee Credit and Savings Credit. The guaranteed part tops up weekly income if it’s below £142.70 (single people) or £217.90 (couples) so those who
receive this are on a low income. This statistic only covers people living in private households, and not residential institutions (such as nursing homes).
50% least deprived
The proportion of children in families in receipr of either out of work benefits or tax credits where their reported income is less than 60% median income. Poor children may be excluded from participating in society. They may be unable to afford school
trips and activities; school uniforms or warm winter clothes, be unable to go swimming, have friends round for tea or celebrate their birthdays. Many will never have a holiday. Children who grow up poor are more likely to leave school without
qualifications, have lower employment chances, thus restricting their ability to get a good job and financially contribute to society.
50% least deprived
18% 50% most deprived
DEPRIVATION AND KEY ISSUES AFFECTING PARISHIONERS
Score
77
50% most deprived80
6%
Deprivation is considered to be a multi-dimensional problem, encompassing a range of domains such as financial, health, education, services or crime. continuous measure of relative deprivation therefore there is no definitive point on the scale below
which areas are considered to be deprived and above which they are not.While being in the most deprived 10% may indicate financial disadvantage, it could equally be due to isolated living.
Number of people aged 16 to State Pension age claiming: Jobseeker’s Allowance (JSA), Employment and Support Allowance (ESA), Incapacity Benefit (IB), Income Support (IS) (as a lone parent or in the “other” category),
Other income related benefits.
Social housing is housing that is let at low rents and on a secure basis to people in housing need. It is generally provided by councils and not-for-profit organisations such as housing associations. Vulnerable groups are often
concentrated in the social housing sector, with low rates of employment and low income levels
Children in single parent families have a much higher risk of living in poverty than children in couple families. Single parents may rely on informal childcare.
What are the particular issues that affect your parish? Are you doing anything to address these?
50% least deprived
Deprivation Indicator Diocesan Position National Position
A low-level of skill or educational attainment is one indicator of social disadvantage. Qualifications may make it easier to find employment. Learning also helps promote active citizenship and combat social exclusion.
17%
50% least deprived
50% most deprived
50% most deprived
50% least deprived
50% most deprived
50% most deprived
50% most deprived
Research
&
Statistics

16
0
0.1 50% least deprived 0
0
0
10% most deprived
50% most deprived
50% least deprived
50% most deprived
50% most deprived
50% least deprived
0 0 0
50% most deprived
50% most deprived 50% least deprived
00 0
0
0
0
0
0
50% least deprived
50% least deprived
50% least deprived
10% least deprived
10% least deprived
50% least deprived
50% least deprived
50% least deprived
0 0 0
0Skills Sub-domain 20.5
0
0
0
0
00 0
0
0
0
0
1
1
0
0
0
0
0 0
0
0 0
0
1
0
1
0
0
0
0
0
0
0.1
0.0
5%
0 0
10050% most deprived
0
0
0
0
0
0
0
21.2
0
50% least deprived
10% most deprived
0
00
50% most deprived 0
0
50% most deprived 1
50% least deprived 0
Number of LSOAs amongst
least deprived*Diocesan position National position
HEALTH DEPRIVATION AND
DISABILITY-0.7
Average
Score for
parishIMD Subdomains8 (2010)
INCOME
EMPLOYMENT
Number of LSOAs amongst
most deprived*
1%
0
Income Deprivation Affecting
Children Index0.1
CRIME AND DISORDER
LIVING ENVIRONMENT
Indoors Sub-domain
Outdoors Sub-domain
0
0
Geographical Barriers Sub-domain
6.4
50% least deprived
EDUCATION SKILLS AND TRAINING
BARRIERS TO HOUSING AND SERVICES50% least deprived
Wider Barriers Sub-domain
Children/Young People Sub-domain21.8 0 0
0
0
50% most deprived 50% most deprived
0
0
0
0
0
-0.8
010% least deprived
3.5
26.3
16.5
5.4
21.4
50% most deprived 50% least deprived
10% 1%
DEPRIVATION AND KEY ISSUES AFFECTING PARISHIONERSIt is important to note that these statistics are a measure of deprivation, not affluence, and to recognise that not every person in a highly deprived area will themselves be
deprived. Equally, there will be some deprived people living in the least deprived areas.
Deprivation covers a broad range of issues and refers to unmet needs caused by a lack of resources of all kinds, not just financial. The English Indices of Deprivation
attempt to measure a broader concept of multiple deprivation, made up of several distinct dimensions, or domains, of deprivation. Seven domains of deprivation are
combined to produce the overall Index of Multiple Deprivation. Each domain contains a number of component indicators. The English Indices of Deprivation are a
continuous measure of relative deprivation therefore there is no definitive point on the scale below which areas are considered to be deprived and above which they are
not. Deprived areas have been defined in this release as those containing LSOAs that are amongst the 10 per cent most deprived in England according to the overall Index
of Multiple Deprivation.
Overall IMD 0 000
5% 10%
8.3 50% least deprived
00
00 0
*There are 3 full or partial LSOAs included in this parish
0 0
What are the particular issues that affect your parish? Are you doing anything to address these?
Income Deprivation Affecting Older
People Index
0
Research
&
Statistics

17
This spotlight has given you some information about your parish both in terms of your own church congregations and your local community. This is not an
end in itself, but rather a starting place for you to explore further. Questions to consider might include:
• What does our congregation look like?
• How does it compare to the local population?
• What other churches are there in the area? What parts of the community do they reach? Which parts of the community are being missed?
• What other local organisations or centres are there, that might bring people into our parish? Examples might be Hospitals or health centres, prisons, job
centres, homeless shelters, schools, charities, mother and toddler groups, uniformed organisations, community centres, libraries, shops, offices, stations?
How can we interact with these people?
• What areas of our parish do we know well or less well?
• How does the local community change between weekdays and weekends? How do our services and events fit with the shifting local population?
• Is our website/'A Church Near You' profile up to date?
• Are our records up to date?
****************************************************************************************************************************
What to do next?
Your notes
WHAT TO DO NEXT Research
&
Statistics

18
Sources of further information
Public Health Observatories - APHO JSNA Datasets (The datasets are intended to cover a
range of issues, focused on underlying determinants of health and conditions which account
for substantial numbers of preventable diseases and deaths.)
A Church Near You
www.achurchnearyou.com
UpMyStreet - UK house prices, property, crime, local neighbourhood & schools
London Street Gangs - Territory maps and background information
http://www.londonstreetgangs.com/
Hint: Scroll to the bottom of the "Gang Maps" page to see boundaries.
AboutMyArea - The local interactive site - news, reviews, what's on, events, businesses
Research & Statistics GIS
http://www.churchofengland.org/about-us/facts-stats/research-statistics/census-2011.aspx
Church Urban Fund
www.cuf.org.uk
Homeless Pages - Information, Research and Publications on homelessness
http://www.homelesspages.org.uk/
http://www.upmystreet.com/
Hint: Use the "My Neighbourhood" tab
The network of Public Health Observatories - Health Profiles
www.apho.org.uk/resource/view.aspx?RID=91736
The Poverty Site - Geographic Analysis
www.poverty.org.uk/summary/regional.shtml
http://www.apho.org.uk/default.aspx?QN=HP_FINDSEARCH2011
MurderMap - London Homicide Reported Direct from The Old Bailey
Police.uk - Local crime and policing information for England and Wales
http://www.police.uk/
ONS - Neighbourhood Statistics
http://www.aboutmyarea.co.uk/
http://neighbourhood.statistics.gov.uk/
Hint: Use the summary box
http://www.murdermap.co.uk/
Research
&
Statistics

19
Proportion of the population aged 60+ who are in receipt of the Guaranteed part of Pension Credit (August 2012)
Estimated using LSOA level data sourced from http://83.244.183.180/NESS/BEN/iben.htm
Proportion of the working age population who are in receipt of a key out-of-work benefit (Q3 2012)
Life Expectancy at birth (boys) (1999-2003)
Estimated using ward level data from ONS.
Life expectancy at birth (girls) (1999-2003)
Estimated using ward level data from ONS.
Percentage of Children under 16 in Poverty (2009)
Estimated using LSOA level data from http://www.hmrc.gov.uk/statistics/child-poverty-stats.htm
IMD (2010)
Methodology: Government data is published on government boundaries that do not match ecclesiastical boundaries. In order to produce parish population and demographic
estimates we have worked with the ONS to use a best fit modelling process. As such, these statistics can only be considered estimates and, particularly in very diverse areas, are
best used in the context of local knowledge. Where parish populations are sparse the figures for government areas overlapping the parish are used.
Parish estimates from the census have been calculated using the census output area data published by the ONS. These are provisional estimates, and when more granular data at
postcode level is available, will be revised. Estimates have been modelled by allocating the population weighted centroid of each output area to the parish within which it falls.
This means that some parishes have not been allocated population, however proportions for demographic variables have been calculated based on the output areas overlaying
the parish.
For further information about this process, please contact [email protected].
Contains public sector information licensed under the Open Government Licence v1.0 http://www.nationalarchives.gov.uk/doc/open-government-licence/
Estimated using OA level data sourced from ONS Census Data 2011, ONS
Estimated using OA level data sourced from ONS Census Data 2001, ONS
When analysing data, it is important to consider that some parishes are very small and proportions may be very large even where very few cases meet the criteria.
ABOUT THIS DATA
http://www.churchofengland.org/about-us/facts-stats/research-statistics/clergydiversityaudit2005linkpage.aspx
Estimated using OA level data from DWP Information, Governance and Security Directorate from
http://statistics.dwp.gov.uk/asd/asd1/tabtools/census_output_area_data/index.php?page=census_output_area_data
Annual parochial returns
ONS Census data 2011
ONS Census data 2001
2007 Church Diversity Survey
DWP
ONS
HMRC
Department for Communities and Local Government
1
2
3
4
5
6
7
8
These have been collected annually between 2007 and 2011 by the Research and Statistics team, Archbishops’ Council
When quoting figures derived from this data, care should be taken with the level of accuracy quoted.
Estimated using LSOA level data from Communities and Local Government, 2010.
https://www.gov.uk/government/uploads/system/uploads/attachment_data/file/6320/1870718.pdf
Research
&
Statistics

1
Getting to know your parish
What is this spotlight?
How should I use it?
Questions
Contents
This short spotlight brings together a range of information about your parish,
both in terms of your congregations, but also the wider community living in
your area. It covers areas such as Christian affiliation, population age and
ethnicity profiles, household structures, deprivation, employment, schools
and qualifications, alongside church statistics such as attendance and giving.
There is information at the end of the spotlight about where this data comes
from and how it was calculated. If you have any further queries then please
do contact the Research and Statistics team at
This spotlight is not an end in itself, but rather a starting place for you to
explore further. You may want to discuss it at a PCC meeting or with
leadership teams. We’ve included some questions on each page to help you
to think about the information, however some things will be of more
relevance in some areas than others, and these are just suggestions to get
you started. We’ve also included some bigger questions about what to do
next at the end of the spotlight on page 17. There’s space for you to write
some notes here. It might be helpful to write a short paragraph to
summarise your community profile or note down anything that has struck
you as particularly important. There are also details at the end for where
you can find further information should you want to dig a little deeper.
1. Summary: a brief overview of your parish, including what look to be 5 of
the most pressing social issues in your area
2. Age: age profile of your community
3. Ethnicity: ethnicity profile of your community
4. Integration: English language speaking and length of UK residency in your
community
5. Religious affiliation: religious affiliation in your community
6. Households: families, dependents, one person households, temporary
residents and housing tenure
7. Marital and civil partnership status
8. Employment: occupations, benefits and mobility in your community
9. Education: CofE schools and qualification levels in your community
10. Health: people with health problems and carers in your community
11. Deprivation: different types of deprivation in your community
Research
&
Statistics

2
Parishioners at glance
Lower Heyford: St Mary
2011 Tax Efficient Planned
Giving/person/week1
2011 Electoral
Roll1
Housing Access
Pensioner Poverty
Education
77%
67%
Issues to look out for in your parish
£2
Annual Parochial Returns
Oct
ob
er W
eekl
y
Att
end
ance
1
0-4
5-15
2011 Parish
Share Paid1
26
PARISH OVERVIEW
21%
Parish
7%
12%
61%
Age Profile (20112)500
Proportion Christian
Sorry, no Fresh Expressions listed for this parish.Fresh Expressions
500
BICESTER & ISLIP
OXFORD
16-64
Age
Gro
up
Diocese
627046
Deanery
Archdeaconry
20013
20112
20013
20112
Included Churches
Oxford
Population
Elderly Deprivation
Parish of: Lower Heyford
Parish Code: 270046
65 +
£13,000
Local Amenities
Research
&
Statistics
0
20
40
60
80
100
2007 2008 2009 2010 2011
Highestweek
Average
LowestWeek

3
Parish 20112 Deanery 20112 Diocese 20112
Demographics: AGE PROFILE AND ATTENDANCE AT SERVICES
Does the age profile of your congregation match that of your parish? Are you engaging with the
parish's largest demographic: those aged 45 - 59?
30% 20% 10% 0% 10% 20% 30%
0 - 4
5 - 7
8 - 9
10 - 14
15
16 - 17
18 - 19
20 - 24
25 - 29
30 - 44
45 - 59
60 - 64
65 - 74
75 - 84
85 - 89
90 & overAge profile of parish populations 20013 & 20112
Parish2011
Parish2001
0% 10% 20% 30%
0 - 14
15 - 29
30 - 44
45 - 59
60 - 74
75 - 89
90 & over
0% 10% 20% 30%
0 - 14
15 - 29
30 - 44
45 - 59
60 - 74
75 - 89
90 & over
0% 5% 10% 15% 20% 25%
0 - 14
15 - 29
30 - 44
45 - 59
60 - 74
75 - 89
90 & over
Research
&
Statistics

4
15%
Diocesan Congregation4 (2007)
Parish Population2 (2011)
(nearest 50)
Demographics: AGE PROFILE AND ATTENDANCE AT SERVICES
Comparable Age profile of Adults
25%
65 +
40%
Age
50
50
18 - 44
22% 38%
300
100
0 - 4
5 - 15
16 - 64
Diocesan Core Congregation Age Profile4 (2007)
Diocesan Population2 (2011) 37%
45 - 64
Does the age profile of your congregation match that of your parish?
65 +
Infant Baptisms
20111
5
Highest Weeks
Attendance 20111
5
16
9%
13%
16%
22%
40%
0% 10% 20% 30% 40% 50%
Research
&
Statistics

5
Detailed Parish Ethnicity2 2011
Parish Ethnicity2 2011 Parish Ethnicity3 2001 Diocese Ethnicity2 2011
Arab Other Ethnic Group
0%<1%
Indian Bangladeshi Chinese
African Caribbean
Parish
Percentage
ME: 2%
Other Asian
0%
Does the ethnicity profile of your congregation match that of your parish? Are you engaging with the parish's
largest demographics: those describing themselves as White or Mixed/Multiple ethnic group?
0%
3%
0%0% 0%
0%
<1%0%
Demographics: ETHNICITY
<1%
93%
Other White
5%
White & Asian Other Mixed
1%
<1%
0%
British
White & Black
Caribbean
Diocesan Population2 (2011)
Diocesan Core Congregation4 (aged 18+ only) (2007)
Percentage Minority Ethnic Background
15%
<1%
Irish
Pakistani
0%
Other Black
Gypsy or Irish
Traveller
White & Black
African
Research
&
Statistics
White
Mixed/Multipleethnic group
Asian/Asian British
Black or BlackBritish
Other ethnicgroup

6
Cannot speak English well or cannot speak
English Can speak English well or very well
0% 2%Have English as their main language (English or
Welsh if in Wales)
98%2Percentage of people who
Demographics: Integration
10 years or more
92%
2 years or more but less
than 5 years
Born in the UK
Less than 2 years
1% 1% 6%
5 years or more but less
than 10 years
Are services in your parish accessible to all residents? Do you offer any services in foreign
languages? What can you offer those who may not have been in the UK for long?
2Resident in UK:
<1%
Research
&
Statistics

7
In your parish 67% of the population (that is 400 people) declared themselves as Christian in 2011
82
Statistics from the Annual
Parochial Returns 2011
Easter Communicants1
Easter Day Attendance1
Christmas Communicants1
Christmas Attendance1
Christians in your Parish
RELIGIOUS AFFILIATION
43
60
42
How has the religious affiliation of those living in your parish changed over the past decade? How closely does
it match that of the Diocese as a whole? Are Christians in your parish engaging with your churches? How are
you engaging with other faith groups?
0% 10% 20% 30% 40% 50% 60% 70% 80% 90% 100%
Parish 2001
Parish 2011
Diocese 2011
Christian Buddhist Hindu Jewish Muslim Sikh Other religions No religion Religion not stated
2
3
National Average Percentage Christian2 (59.4%)
Research
&
Statistics
2
2

8
Household Spaces2 2011
With at least one usual resident i.e. not vacant 96%
<1%Caravan or other mobile or temporary structure
150 <50 <50
Who lives in your parish? Are there issues with access to housing? How permenant are your
parishioners?
Tenure2
Social rented as a percentage of all households2 11%
Social Rented householdsOwner occupied households
(including shared ownership)
Private Rented households
(including those living rent free)
HOUSEHOLDS, LIFESTYLE AND THE COMMUNITY I Research
&
Statistics

9
Household composition in your parish2 All
percentages are of the total number of
households with residents. The smaller pie
charts show the breakdown of a section of
the larger ones. You can use the colours to
match.
Lone Parent
Households as a
percentage of all
households with
children2
19%
Who lives in your parish? Are there a lot of households with children? What about lone parent
households? Are there a lot of people living alone?
HOUSEHOLDS, LIFESTYLE AND THE COMMUNITY II
Aged 65 and over 11% Other 13%
One Person 24%
One family 71%
Other households
5%
Dependent children 3%
All full-time students
<1%
Other 2%
Aged 65 and over 11%
Married or same-sex civil partnership couple 42%
Cohabiting couple 8%
Lone parent 9%
No children 19%
Dependent children 18%
Non-dependent children 5%
No children 5%
Dependent children 3%
Dependent children 6%
Non-dependent children 3%
Research
&
Statistics

10
Wedding & Blessings in 2010
Weddings & Blessings in 20113 No
Your Parish Churches held1
Do you hold many weddings in your parish? How is your parish supporting those in the above
categories?
1 No
Marital and civil partnership status
80% 60% 40% 20% 0% 20% 40% 60% 80%
Living in a couple: Married or in a registered same-sex civil partnership
Living in a couple: Cohabiting
Not living in a couple: Single (never married or never registered a same-sex civilpartnership)
Not living in a couple: Married or in a registered same-sex civil partnership
Not living in a couple: Separated (but still legally married or still legally in a same-sexcivil partnership)
Not living in a couple: Divorced or formerly in a same-sex civil partnership which isnow legally dissolved
Not living in a couple: Widowed or surviving partner from a same-sex civilpartnership
2001 2011
Research
&
Statistics 2 3

11
£2
£0
£0
£36,735
£14,531
£14,500
Parish Expenditure1
TEPG/PERSON/WEEK1
Other/person/week1Other planned giving1
How are your parish finances? How does this compare to your community profile?
£16,139
£23,559
EMPLOYMENT AND SOCIAL GRADE, LIFESTYLE
The National Statistics Socio-economic Classification (NS-SeC) is an occupationally
based classification but has rules to provide coverage of the whole adult population.
The NS-SeC provides an indication of socio-economic position based on occupation.
It is an Office for National Statistics standard classification. To assign a person aged
16 to 74 to an NS-SeC category their occupation title is combined with information
about their employment status, whether they are employed or self-employed and
whether or not they supervise other employees. Full-time students are recorded in
the' full-time students' category regardless of whether they are economically active
or not.Parish Share Assessed1
Parish Share Paid1
£0
£0
£26,577
£13,659
£13,000
£2
£12,589Tax Efficient Planned Giving (TEPG)1
Finance Returns 2010
NS-SeC of Household Reference Person2
£19,094Parish Income12011
Research
&
Statistics
0% 5% 10% 15% 20% 25% 30%
Higher managerial, administrative and professional occupations
Lower managerial, administrative and professional occupations
Intermediate occupations
Small employers and own account workers
Lower supervisory and technical occupations
Semi-routine occupations
Routine occupations
Never worked and long-term unemployed
Not classified (Full-time students or not classifiable for other reasons)

12
8%
92%
Households
3%
EMPLOYMENT AND SOCIAL GRADE, LIFESTYLE
How much free time do residents of your parish have? How accessible are your churches to those
with/without cars?
Access to at least 1 car or van
Household Mobility2
Proportion of population aged 60+ who are in
receipt of the Guaranteed part of Pension
Credit5
17%
Proportion of working age persons (16-74) with
no qualifications2 21%
Proportion of working age population who are
in receipt of a key out-of-work benefit5
No access to a car or van
Part-time: 15 hours or less
worked 7%
Part-time: 16 to 30 hours worked
17%
Full-time: 31 to 48 hours worked
54%
Full-time: 49 or more hours
worked 21%
Hours Worked2
Part-time: 15 hours or less worked Part-time: 16 to 30 hours worked
Full-time: 31 to 48 hours worked Full-time: 49 or more hours worked
Research
&
Statistics
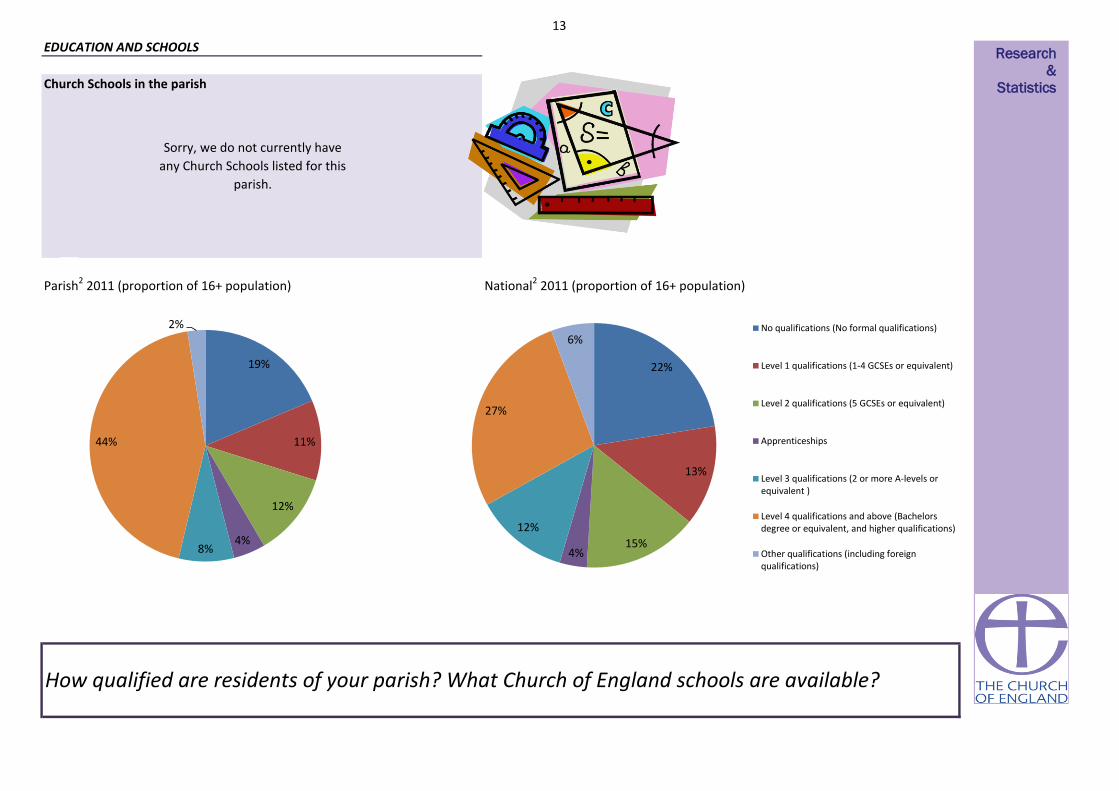
13
Church Schools in the parish
Parish2 2011 (proportion of 16+ population) National2 2011 (proportion of 16+ population)
EDUCATION AND SCHOOLS
How qualified are residents of your parish? What Church of England schools are available?
Sorry, we do not currently have
any Church Schools listed for this
parish.
19%
11%
12%
4% 8%
44%
2%
22%
13%
15% 4%
12%
27%
6% No qualifications (No formal qualifications)
Level 1 qualifications (1-4 GCSEs or equivalent)
Level 2 qualifications (5 GCSEs or equivalent)
Apprenticeships
Level 3 qualifications (2 or more A-levels orequivalent )
Level 4 qualifications and above (Bachelorsdegree or equivalent, and higher qualifications)
Other qualifications (including foreignqualifications)
Research
&
Statistics
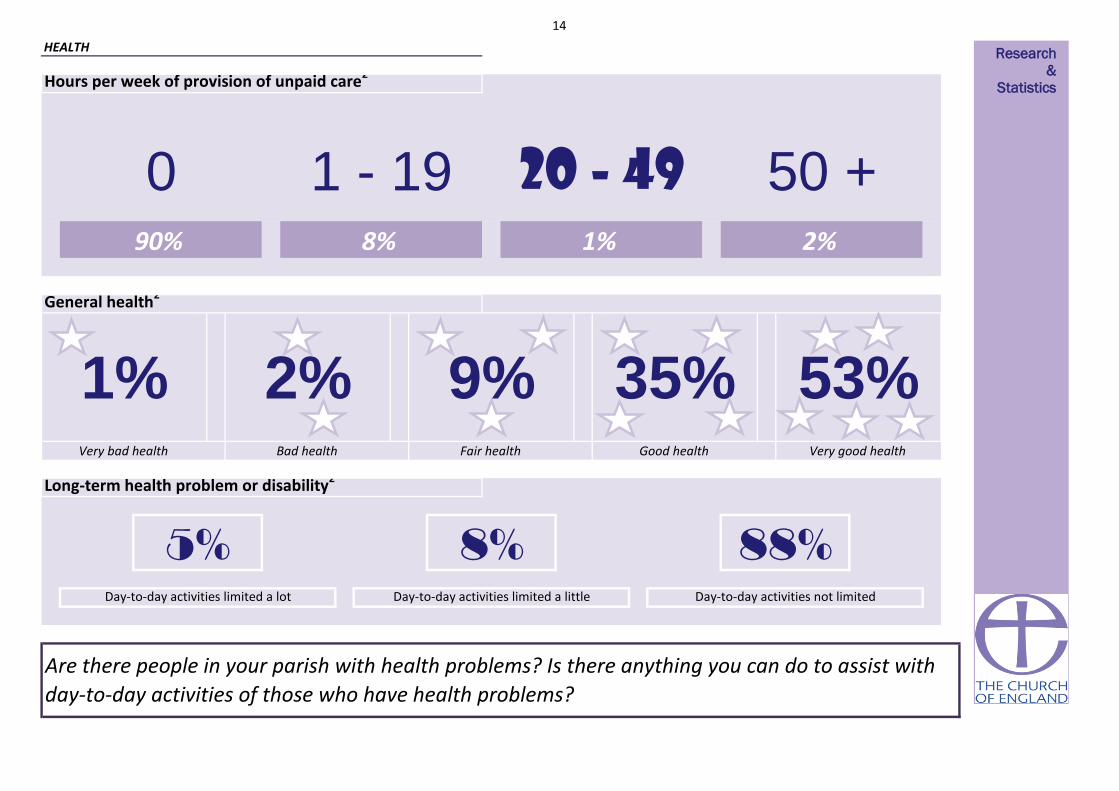
14
Hours per week of provision of unpaid care2
1% 2%
Very bad health Bad health Fair health
1 - 19
Are there people in your parish with health problems? Is there anything you can do to assist with
day-to-day activities of those who have health problems?
HEALTH
0
Long-term health problem or disability2
50 +90% 8%
Good health Very good health
1%
Day-to-day activities limited a lot Day-to-day activities limited a little Day-to-day activities not limited
5% 8% 88%
2% 9% 35% 53%
General health2
20 - 49
Research
&
Statistics

15
You parish can be categorised as in the most or least deprived 10% or 50% of all parishes within the diocese and of all parishes nationally
50% least deprived 50% least deprived
Life expectancy at birth (girls)6 (1999-2003)
Life Expectancy at birth (boys)6 (1999-2003)
11%
16.2
10% most deprived17% 50% most deprived
50% most deprivedPercentage of Children under 16 in Poverty7 (2010)
Percentage of working age persons (16-74) with no
qualifications2 (2011)
10% least deprived
Life expectancy at birth can give an idea of overall quality of life. Life expectancy is an average. Women tend to have greater life expectancy. Life expectany can be affected by family history, marital status, economic status,
physique, exercise, diet, drug use including smoking and alcohol consumption, disposition, education, environment, sleep, climate, and health care.
Proportion of the population aged 60+ who are in receipt of
the Guaranteed part of Pension Credit5 (2012)
13%
Social rented as a percentage of all households2 (2011)
Index of Multiple Deprivation (IMD)8 (2010)
Proportion of the working age population who are in receipt
of a key out-of-work benefit5 (2012)
Lone Parent Households as a percentage of all households
with children2 (2011)
Pension Credit is an income related benefit made up of 2 parts - Guarantee Credit and Savings Credit. The guaranteed part tops up weekly income if it’s below £142.70 (single people) or £217.90 (couples) so those who
receive this are on a low income. This statistic only covers people living in private households, and not residential institutions (such as nursing homes).
50% least deprived
The proportion of children in families in receipr of either out of work benefits or tax credits where their reported income is less than 60% median income. Poor children may be excluded from participating in society. They may be unable to afford school
trips and activities; school uniforms or warm winter clothes, be unable to go swimming, have friends round for tea or celebrate their birthdays. Many will never have a holiday. Children who grow up poor are more likely to leave school without
qualifications, have lower employment chances, thus restricting their ability to get a good job and financially contribute to society.
50% most deprived
21% 50% most deprived
DEPRIVATION AND KEY ISSUES AFFECTING PARISHIONERS
Score
79
10% least deprived86
3%
Deprivation is considered to be a multi-dimensional problem, encompassing a range of domains such as financial, health, education, services or crime. continuous measure of relative deprivation therefore there is no definitive point on the scale below
which areas are considered to be deprived and above which they are not.While being in the most deprived 10% may indicate financial disadvantage, it could equally be due to isolated living.
Number of people aged 16 to State Pension age claiming: Jobseeker’s Allowance (JSA), Employment and Support Allowance (ESA), Incapacity Benefit (IB), Income Support (IS) (as a lone parent or in the “other” category),
Other income related benefits.
Social housing is housing that is let at low rents and on a secure basis to people in housing need. It is generally provided by councils and not-for-profit organisations such as housing associations. Vulnerable groups are often
concentrated in the social housing sector, with low rates of employment and low income levels
Children in single parent families have a much higher risk of living in poverty than children in couple families. Single parents may rely on informal childcare.
What are the particular issues that affect your parish? Are you doing anything to address these?
50% most deprived
Deprivation Indicator Diocesan Position National Position
A low-level of skill or educational attainment is one indicator of social disadvantage. Qualifications may make it easier to find employment. Learning also helps promote active citizenship and combat social exclusion.
19%
50% most deprived
50% most deprived
50% least deprived
10% most deprived
50% most deprived
50% least deprived
50% most deprived
Research
&
Statistics

16
0
0.2 50% most deprived 0
0
1
50% most deprived
50% most deprived
50% most deprived
50% most deprived
50% most deprived
50% most deprived
0 0 0
10% most deprived
50% most deprived 50% most deprived
00 0
0
0
0
0
0
50% least deprived
50% most deprived
50% least deprived
50% most deprived
50% least deprived
50% least deprived
50% least deprived
50% most deprived
0 0 0
0Skills Sub-domain 13.4
0
1
0
0
00 0
0
0
0
0
0
0
0
0
0
0
0 0
0
0 0
0
0
0
0
0
0
0
0
0
0
0.1
0.1
5%
0 0
00050% most deprived
0
0
0
0
0
0
0
23.5
1
50% least deprived
10% most deprived
0
00
50% most deprived 0
0
50% most deprived 0
50% most deprived 0
Number of LSOAs amongst
least deprived*Diocesan position National position
HEALTH DEPRIVATION AND
DISABILITY-1.0
Average
Score for
parishIMD Subdomains8 (2010)
INCOME
EMPLOYMENT
Number of LSOAs amongst
most deprived*
1%
0
Income Deprivation Affecting
Children Index0.1
CRIME AND DISORDER
LIVING ENVIRONMENT
Indoors Sub-domain
Outdoors Sub-domain
0
0
Geographical Barriers Sub-domain
24.8
50% most deprived
EDUCATION SKILLS AND TRAINING
BARRIERS TO HOUSING AND SERVICES10% most deprived
Wider Barriers Sub-domain
Children/Young People Sub-domain33.5 0 0
0
0
10% most deprived 10% most deprived
0
0
0
0
0
-0.9
050% most deprived
1.3
80.5
14.8
17.0
47.6
50% most deprived 50% least deprived
10% 1%
DEPRIVATION AND KEY ISSUES AFFECTING PARISHIONERSIt is important to note that these statistics are a measure of deprivation, not affluence, and to recognise that not every person in a highly deprived area will themselves be
deprived. Equally, there will be some deprived people living in the least deprived areas.
Deprivation covers a broad range of issues and refers to unmet needs caused by a lack of resources of all kinds, not just financial. The English Indices of Deprivation
attempt to measure a broader concept of multiple deprivation, made up of several distinct dimensions, or domains, of deprivation. Seven domains of deprivation are
combined to produce the overall Index of Multiple Deprivation. Each domain contains a number of component indicators. The English Indices of Deprivation are a
continuous measure of relative deprivation therefore there is no definitive point on the scale below which areas are considered to be deprived and above which they are
not. Deprived areas have been defined in this release as those containing LSOAs that are amongst the 10 per cent most deprived in England according to the overall Index
of Multiple Deprivation.
Overall IMD 0 000
5% 10%
16.2 10% most deprived
00
00 0
*There is 1 full or partial LSOA included in this parish
0 0
What are the particular issues that affect your parish? Are you doing anything to address these?
Income Deprivation Affecting Older
People Index
0
Research
&
Statistics

17
This spotlight has given you some information about your parish both in terms of your own church congregations and your local community. This is not an
end in itself, but rather a starting place for you to explore further. Questions to consider might include:
• What does our congregation look like?
• How does it compare to the local population?
• What other churches are there in the area? What parts of the community do they reach? Which parts of the community are being missed?
• What other local organisations or centres are there, that might bring people into our parish? Examples might be Hospitals or health centres, prisons, job
centres, homeless shelters, schools, charities, mother and toddler groups, uniformed organisations, community centres, libraries, shops, offices, stations?
How can we interact with these people?
• What areas of our parish do we know well or less well?
• How does the local community change between weekdays and weekends? How do our services and events fit with the shifting local population?
• Is our website/'A Church Near You' profile up to date?
• Are our records up to date?
****************************************************************************************************************************
What to do next?
Your notes
WHAT TO DO NEXT Research
&
Statistics

18
Sources of further information
Public Health Observatories - APHO JSNA Datasets (The datasets are intended to cover a
range of issues, focused on underlying determinants of health and conditions which account
for substantial numbers of preventable diseases and deaths.)
A Church Near You
www.achurchnearyou.com
UpMyStreet - UK house prices, property, crime, local neighbourhood & schools
London Street Gangs - Territory maps and background information
http://www.londonstreetgangs.com/
Hint: Scroll to the bottom of the "Gang Maps" page to see boundaries.
AboutMyArea - The local interactive site - news, reviews, what's on, events, businesses
Research & Statistics GIS
http://www.churchofengland.org/about-us/facts-stats/research-statistics/census-2011.aspx
Church Urban Fund
www.cuf.org.uk
Homeless Pages - Information, Research and Publications on homelessness
http://www.homelesspages.org.uk/
http://www.upmystreet.com/
Hint: Use the "My Neighbourhood" tab
The network of Public Health Observatories - Health Profiles
www.apho.org.uk/resource/view.aspx?RID=91736
The Poverty Site - Geographic Analysis
www.poverty.org.uk/summary/regional.shtml
http://www.apho.org.uk/default.aspx?QN=HP_FINDSEARCH2011
MurderMap - London Homicide Reported Direct from The Old Bailey
Police.uk - Local crime and policing information for England and Wales
http://www.police.uk/
ONS - Neighbourhood Statistics
http://www.aboutmyarea.co.uk/
http://neighbourhood.statistics.gov.uk/
Hint: Use the summary box
http://www.murdermap.co.uk/
Research
&
Statistics
19
Proportion of the population aged 60+ who are in receipt of the Guaranteed part of Pension Credit (August 2012)
Estimated using LSOA level data sourced from http://83.244.183.180/NESS/BEN/iben.htm
Proportion of the working age population who are in receipt of a key out-of-work benefit (Q3 2012)
Life Expectancy at birth (boys) (1999-2003)
Estimated using ward level data from ONS.
Life expectancy at birth (girls) (1999-2003)
Estimated using ward level data from ONS.
Percentage of Children under 16 in Poverty (2009)
Estimated using LSOA level data from http://www.hmrc.gov.uk/statistics/child-poverty-stats.htm
IMD (2010)
Methodology: Government data is published on government boundaries that do not match ecclesiastical boundaries. In order to produce parish population and demographic
estimates we have worked with the ONS to use a best fit modelling process. As such, these statistics can only be considered estimates and, particularly in very diverse areas, are
best used in the context of local knowledge. Where parish populations are sparse the figures for government areas overlapping the parish are used.
Parish estimates from the census have been calculated using the census output area data published by the ONS. These are provisional estimates, and when more granular data at
postcode level is available, will be revised. Estimates have been modelled by allocating the population weighted centroid of each output area to the parish within which it falls.
This means that some parishes have not been allocated population, however proportions for demographic variables have been calculated based on the output areas overlaying
the parish.
For further information about this process, please contact [email protected].
Contains public sector information licensed under the Open Government Licence v1.0 http://www.nationalarchives.gov.uk/doc/open-government-licence/
Estimated using OA level data sourced from ONS Census Data 2011, ONS
Estimated using OA level data sourced from ONS Census Data 2001, ONS
When analysing data, it is important to consider that some parishes are very small and proportions may be very large even where very few cases meet the criteria.
ABOUT THIS DATA
http://www.churchofengland.org/about-us/facts-stats/research-statistics/clergydiversityaudit2005linkpage.aspx
Estimated using OA level data from DWP Information, Governance and Security Directorate from
http://statistics.dwp.gov.uk/asd/asd1/tabtools/census_output_area_data/index.php?page=census_output_area_data
Annual parochial returns
ONS Census data 2011
ONS Census data 2001
2007 Church Diversity Survey
DWP
ONS
HMRC
Department for Communities and Local Government
1
2
3
4
5
6
7
8
These have been collected annually between 2007 and 2011 by the Research and Statistics team, Archbishops’ Council
When quoting figures derived from this data, care should be taken with the level of accuracy quoted.
Estimated using LSOA level data from Communities and Local Government, 2010.
https://www.gov.uk/government/uploads/system/uploads/attachment_data/file/6320/1870718.pdf
Research
&
Statistics