Getting tangible about intangibles
40
Getting tangible about intangibles The future of growth and productivity? Discussion paper June 2021 Authors Eric Hazan, Paris Sven Smit, Amsterdam Jonathan Woetzel, Los Angeles and Shanghai Biljana Cvetanovski, London Mekala Krishnan, Boston Brian Gregg, San Francisco Jesko Perrey, Düsseldorf Klemens Hjartar, Copenhagen
Transcript of Getting tangible about intangibles

Getting tangible about intangiblesThe future of growth and productivity?
Discussion paperJune 2021
AuthorsEric Hazan, Paris Sven Smit, Amsterdam Jonathan Woetzel, Los Angeles and Shanghai Biljana Cvetanovski, London Mekala Krishnan, Boston Brian Gregg, San Francisco Jesko Perrey, Düsseldorf Klemens Hjartar, Copenhagen
McKinsey Global InstituteSince its founding in 1990, the McKinsey Global Institute (MGI) has sought to develop a deeper understanding of the evolving global economy. As the business and economics research arm of McKinsey & Company, MGI aims to help leaders in the commercial, public, and social sectors understand trends and forces shaping the global economy.
MGI research combines the disciplines of economics and management, employing the analytical tools of economics with the insights of business leaders. Our “micro-to-macro” methodology examines microeconomic industry trends to better understand the broad macroeconomic forces affecting business strategy and public policy. MGI’s in-depth reports have covered more than 20 countries and 30 industries. Current research focuses on six themes: productivity and growth, natural resources, labor markets, the evolution of global financial markets, the economic impact of technology and innovation, and urbanization. Recent reports have assessed the digital economy, the impact of AI and automation on employment, physical climate risk, global health, income inequality, the productivity puzzle, the economic benefits of tackling gender inequality, a new era of global competition, Chinese innovation, and digital and financial globalization.
MGI is led by three McKinsey & Company senior partners: co-chairs James Manyika and Sven Smit and director Jonathan Woetzel.
Michael Chui, Mekala Krishnan, Susan Lund, Anu Madgavkar, Jan Mischke, Jaana Remes, Jeongmin Seong, and Tilman Tacke are MGI partners. Project teams are led by the MGI partners and include consultants from McKinsey offices around the world. These teams draw on McKinsey’s global network of partners and industry and management experts.
The MGI Council is made up of McKinsey leaders and includes Hemant Ahlawaf, Michael Birshan, Andrés Cadena, Sandrine Devillard, André Dua, Kweilin Ellingrud, Katy George, Rajat Gupta, Eric Hazan, Solveigh Hieronimus, Acha Leke, Clarisse Magnin-Mallez, Jurica Novak, Gary Pinkus, Hamid Samandari, Sha Sha, Oliver Tonby, and Eckart Windhagen. The Council members help shape the research agenda, lead high-impact research, and share the findings with decision makers around the world. In addition, leading economists, including Nobel laureates, advise MGI research.
This report contributes to MGI’s mission to help business and policy leaders understand the forces transforming the global economy and prepare for the next wave of growth. As with all MGI research and reports, this work is independent and reflects our own views. This report was not commissioned or paid for by any business, government, or other institution, and it is not intended to promote the interests of McKinsey’s clients. For further information about MGI and to download reports, please visit www.mckinsey.com/mgi.
McKinsey Marketing & Sales PracticeThe mission of McKinsey’s marketing & sales practice is to help leaders of both consumer and business-to-business clients create growth that matters through meaningful transformations and marketing-driven profit. The practice helps its clients set their strategic direction, develop their marketing and sales capabilities, and connect their organization to realize the full potential of today’s omnichannel opportunities. Clients benefit from McKinsey’s experience in core areas of marketing such as branding, customer insights, marketing ROI, digital marketing, CLM pricing, and sales and channel management.
McKinsey Digital McKinsey Digital drives transformation and builds businesses by bringing together the capabilities needed to help organizations grow and thrive in the digital age. We help our clients harness the power of data and artificial intelligence, modernize core technology and capitalize on new technology, optimize and automate operations, fuel digital growth, create stunning digital experiences, and build digital talent and culture.

In brief
Getting tangible about intangibles
Investment in intangible assets that underpin the knowledge or learning economy, such as intellectual property, research, technology, software, and human capital, has risen inexorably over the past quarter century, and during the COVID‑19 pandemic there appears to have been an accelerated shift toward a dematerialized economy. Could investment in intangible assets now breathe new life into productivity growth and unlock new growth potential? This research uses sector-level data and a new survey of more than 860 executives to explore the correlation between intangibles investment and the performance of sectors, economies, and firms, and to discover the formula for the effective deployment of intangible assets to drive growth. Key findings include the following:
Even through economic disruptions, intangibles investments have increased. Over the past 25 years, the United States and ten European economies (Austria, Denmark, Finland, France, Germany, Italy, the Netherlands, Spain, Sweden, and the United Kingdom) achieved 63 percent growth in gross value added (GVA), a measure of economic growth. During this period, the investment share of intangibles increased by 29 percent. Rising investment in intangibles has been associated with increasing total factor productivity of entire economies. Growth in investment in intangibles slowed after the global financial crisis, and productivity growth decelerated, too, suggesting a link.
Investing in intangibles correlates with productivity and sector growth. In the past quarter century, intangibles investment has risen in all sectors, and data from INTAN‑Invest indicates that there is an observable link between investment in intangibles and GVA growth. It also indicates a strong association with total factor
productivity. Sectors that have invested the most in intangibles—more than 12 percent of their GVA—achieved 28 percent higher growth than other sectors in GVA, at more than 2.7 percent per year between 1995 and 2019. The relationship is strongest in knowledge-intensive services such as financial services and in innovation-driven services such as telecommunications, media, and technology. This apparent correlation reflects the synergistic nature of different types of intangibles. Companies with top-notch digital analytics attract the best talent, and that talent improves the quality and scope of the analytics. Reflecting such synergies, companies and sectors that invest across intangible categories post higher GVA than their peers.
Regardless of the sector, companies that invest more in intangibles grow more. The new survey indicates that top growers, defined as companies in the top quartile of GVA growth by sector in 2018–19 (whose median growth was 20 percent) are investing 2.6 times more in intangibles than low growers, defined as the bottom 50 percent of companies for GVA growth in 2018–19 (whose median growth was 3 percent). The gap increases to between five and seven times in sectors such as financial services where competitive advantage is anchored in knowledge.
Today’s top growers not only invest more in intangibles but take risks to deploy them and develop granular capabilities needed to accelerate impact. Both top and low growers are investing in intangibles, but top growers take the deployment of intangible capital to the next level. For example, it is not sufficient to invest in accessing data; companies also need to have a data strategy enabling them to succeed in transforming their analytics. Rigorous processes, real-
time data-driven decision making, flexible architectures, and using intangibles investment to embed data, talent, and innovation in day-to-day operations is needed. Top growers have a test-and-learn, risk-taking mindset. They understand the need to continually reexamine what type of intangibles are most likely to deliver on competitiveness and growth, can be scaled, and are most likely to deliver synergies.
Huge value is at stake, and executives and policy makers should ask themselves what it will take to realize the intangibles opportunity. If 10 percent more companies were to attain the same share of intangibles investment and GVA growth as top growers, this could produce an additional $1 trillion in GVA or a 2.7 percent increase across sectors in Organisation for Economic Co-operation and Development (OECD) economies. Given mounting evidence of the correlation between intangibles investment and GVA growth, there should be more focus on these assets. For companies, execution is key; top growers deploy these assets more effectively than other companies. Mindset matters: top growers tend to be more risk-taking and adopt a test-and-learn environment when deploying intangibles. As the intangible, digitized economy spreads, reskilling becomes even more urgent. Intangibles-heavy superstar firms employ relatively fewer people than less digitized businesses, but those people tend to be higher skilled and higher paid. If these businesses pull even further ahead, inequality could rise. Governments can play a key role in reskilling and in ensuring that the right knowledge infrastructure—including education, communications technology including internet, urban planning, and public science spending—is in place.
iGetting tangible about intangibles: The future of growth and productivity?


Getting tangible about intangibles
As attention necessarily turns toward the potential shape of the economic recovery when it comes, there will be a continuation—even an acceleration—of a shift toward growth based on skills, knowledge, digital and other technologies, and, notably, investment in intangible, rather than physical or tangible, assets in an increasingly dematerialized world. In the 19th century, the tools of growth were industrial machines; the tools of the knowledge or learning economy will be intangible assets, such as intellectual property (IP), research, technology and software, and human capital.1 Companies and countries that master the deployment of intangibles will be well positioned and are already displaying above-average growth rates.
The role of intangible assets is a very broad and complex topic that raises many questions, not least how they should be defined (see the discussion in the next section). Is this the start of a new stage in the history of capitalism based on learning, knowledge, and intellectual capital? After the pandemic, could a wave of investment in intangibles be the force that unlocks new growth potential? Could intangibles help to unleash renewed productivity growth and solve the Solow Paradox? 2 After a decade of rapid productivity gains enabled by widespread adoption of information technology (IT) and trends such as globalization, productivity growth crashed between 2005 and 2019 as these trends appeared to reach the point of diminishing returns, and the next wave of technology—digitization of processes, big data and analytics, cloud computing, the Internet of Things, and artificial intelligence—was not ready to fill the gap. This paper does not address these broad issues but focuses specifically on a link between intangibles investment and the performance of sectors, economies, and companies, and on how intangible capital differs from tangible capital and how its different characteristics heighten the imperative of effective deployment. We use the INTAN‑Invest database for a sector analysis and draw on a new survey of more than 860 executives to ascertain their views on which specific use cases they consider key to making the most out of the intangible capital deployed.3
Over the past 25 years, investment in intangible assets has risen steadily as a share of total investment in the United States and ten European economies—Austria, Denmark, Finland, France, Germany, Italy, the Netherlands, Spain, Sweden, and the United Kingdom. In 1995, the split was about 70:30 in favor of tangible investment; by 2019, the split was 60:40.4 It is notable that the intangibles share continued to increase even in the face of major economic disruptions; indeed, some evidence indicates that that trend may have accelerated during the COVID‑19 pandemic in 2020 and early 2021.
Companies riding this trend effectively are outperforming others. The new survey indicates that top growers, defined as companies in the top quartile of gross value added (GVA) growth by sector in 2018–19 (whose median growth in all sectors was 20 percent) are investing 2.6 times more in intangibles than low growers, defined as the bottom 50 percent of
1 Joseph E. Stigliz and Bruce C. Greenwald, Creating a learning society: A new approach to growth, development, and social progress, Columbia University Press, 2014; and Fritz Machlup, The production and distribution of knowledge in the United States, Princeton University Press, 1962.
2 In 1987, economist Robert Solow said that the computer age was everywhere except in the productivity statistics. The failure of innovation to boost productivity came to be known as the Solow Paradox. See Mekala Krishnan, Jan Mischke, and Jaana Remes, “Is the Solow Paradox back?” McKinsey Quarterly, June 2018. Also see Felix Roth, “Intangible capital and labor productivity growth: A review of the literature,” Hamburg Discussion Papers in International Economics, 2019, Number 4; and Carol Corrado et al., Intangible investment in the EU and US before and since the Great Recession and its contribution to productivity growth, EIB Working Papers number 2016/08, European Investment Bank, 2016.
3 INTAN‑Invest disseminates harmonized cross-country data on investment in intangibles by industry covering 15 EU countries and the United States from 1995 onward. See intaninvest.net. For full details of sources and methodology, see the technical appendix.
4 Data for 2015–2019 are extrapolated.
1Getting tangible about intangibles: The future of growth and productivity?

companies on GVA growth in 2018–19 (whose median growth was 3 percent in all sectors).5 The gap between them increases to between five and seven times in sectors such as financial services where competitive advantage is anchored in knowledge. This offers strong evidence that intangible capital is correlated with higher growth across sectors and companies.
Could intangibles be an important part of the formula needed for robust economic recovery from the COVID‑19 crisis, which not only has taken a terrible human toll but has been the deepest disruption to economies around the world since World War II? In 2020, GDP fell by 3.5 percent in the United States, 9.9 percent in the United Kingdom, and 11.0 percent in Spain, for instance. Meanwhile, the seeds of a different type of recovery were being sown. Under pressure from economic lockdowns and plunging demand, many firms accelerated digitization and, to a lesser extent, automation. A McKinsey executive survey conducted in December 2020 found that three-quarters of respondents in North America and Europe said that they expected investment in new technologies to accelerate in 2020–24, up from 55 percent who said they increased such investment in 2014–19. Intangibles investment as a share of total investment reported by national statistical offices rose in the United States and six large European economies in the first three quarters of 2020, for example, by as much as 2.8 percentage points in France and 1.9 in the United Kingdom.6
The shift toward intangibles has continued even in the face of major disruption, suggesting that it is a long-standing trend but one that is not fully reflected in traditional accounting. The full transformative power of intangibles has yet to be revealed. Amid the perennial discussion about the long-term structural decline in private investment, it may well be that companies, or at least large, high-performing companies, are, in fact, investing heavily—but more in intangibles than in tangibles.
What are intangibles and why are they important?As far back as the 1960s and 1970s when futurists were talking about the postindustrial time to come, the importance of intangibles began to be part of the conversation. Their role came to even greater prominence in the 1990s as the concepts of the “network society” and “weightless world” became common currency, as value chains and economies globalized, and as management practices and business processes improved.7 In the computer and internet age, appreciation of the importance of intangibles heightened further. After the bursting of the dot-com bubble in the 2000s, a period that included the 2008 global financial crisis and a decade of relative economic stagnation, their time had come. The emergence of mobile and cloud computing technologies turbocharged digitization, and firms fully realized intangibles as a key piece of the formula they need to deliver disproportionate returns. The ubiquity of computers and data today is enabling us to leverage accumulated knowledge and content in myriad ways. As economists Jonathan Haskel and Stian Westlake said in their 2017 book, the notion of “capitalism without capital” is now at center stage.8
Yet this new era is not showing up in national accounts or, indeed, corporate balance sheets, and it is likely that we are heavily underestimating the role they are playing in accelerating the development and spread of the knowledge economy (see Box 1, “A new look at intangibles”).
5 The survey was conducted in March 2021 in 16 countries in three regions covering 21 sectors. Of the 861 respondents, nearly 80 percent were C-suite executives. Of the companies represented, two-thirds had revenue of $500 million or more, and just over half had revenue of $1 billion or more. The main analyses were performed for the most important sectors by size of GVA, and we ensured that these sectors were represented in the survey. Of 861 respondents, 20 percent were in advanced manufacturing; 16 percent in telecommunications, media, and tech; 14 percent in retail trade; 13 percent in financial services; and 6 percent in energy and utilities. The survey results also enabled us to undertake analyses of approaches to intangibles at the firm level. The Organisation for Economic Co-operation and Development (OECD) defines gross value added as the value of output less the value of intermediate consumption; it is a measure of the contribution to GDP made by an individual producer, industry, or sector. See Glossary of statistical terms, OECD, stats.oecd.org/glossary/index.htm.
6 Will productivity and growth return after the COVID‑19 crisis? McKinsey Global Institute, March 2021, on McKinsey.com. 7 The term “network society” came to prominence in an influential book by Manuel Castells. See Manuel Castells, The rise of
the network society: Economy, society, and culture, Blackwell Publishing, 1996. The term “weightless world” was used as the title of a 1999 publication focused on the rise of the digital economy. See Diane Coyle, The weightless world: Strategies for managing the digital economy, The MIT Press, 1999.
8 Jonathan Haskel and Stian Westlake, Capitalism without capital: The rise of the intangible economy, Princeton University Press, 2017.
2 McKinsey Global Institute

Box 1.A new look at intangiblesCurrent definitions and accounting treatments of intangibles are not well suited to the realities of business in a growing knowledge economy. As intangibles spread and create value, this topic needs consideration if we are going to measure their value in a way that is useful for executives and economic policy makers. We have been working with economists to see how current definitions and approaches to intangibles might be adapted, and in this paper we attempt to broaden current definitions.
National statistics and corporates today broadly recognize the same categories of investment as intangible assets, including IP, R&D, goodwill, and computer software. However, they treat specific items differently. For instance, goodwill is reported as “intangible assets” by corporates but recognized as “financial” capital in national accounts when first created. The R in R&D is systematically recognized as an intangible asset by national accounts but not always by corporates. These nuances may result in differences in the measurement and scope of intangibles.
— The OECD defines an intangible as “something which is not a physical asset or a financial asset, which is capable of being owned or controlled for use in commercial activities, and whose use or transfer would be compensated had it occurred in a transaction between independent parties in comparable circumstances.” 1 In essence, the value of an intangible is dematerialized and becomes apparent only when, say, a company is sold and the market assigns a value to it. Specifically, national accounts compiled by statistical agencies usually include various types of IP, including patents, know-how and trade secrets, trademarks, trade names and brands, rights under contracts, and government licenses, as well as goodwill and ongoing concern value and investment in software.
— Corporates usually count as intangibles IP items including patents, copyrights, customer relationships, brands, and concession rights, as well as goodwill and investment in software. How they account for intangibles depends on a range of factors, including national tax codes, as well as accounting conventions and rules.
As a result, many types of expenditure that create multiyear valuable assets are simply expensed through the profit-and-loss account or considered intermediary expenditure in national accounts. When business leaders and, by extension, shareholders are “trapped” in accounting norms that are not necessarily fit-for-purpose and consider investments in intangibles as costs rather than assets, this can lead to suboptimal decisions. By adjusting accounting norms, the full value of intangibles could become clearer, which could lead to better decisions.
Jonathan Haskel and Stian Westlake highlighted three categories of intangibles in their influential book, Capitalism without capital: “intellectual property/innovative property,” which includes R&D, mineral licenses, design, financial innovation, and artistic originals; “computerized information,” including software and databases; and “economic competencies” such as advertising and brands, marketing research, organizational capital, and training. This broader definition and analysis of intangibles has more relevance than traditional categorization to the role they are increasingly playing in companies, sectors, and economies.
In this paper, we use the INTAN‑Invest database developed by Haskel and Westlake, further developing the three categories into four to include a broader set of capabilities (marketing, management, and digital) that are key to building future growth prospects. Those categories are also intangible: innovation capital; digital and analytics capital; human and relational capital, which includes two subcategories: organizational and managerial capital, and ecosystems and networks; and brand capital, such as customer insights and customer experience.
1 Guidance on transfer pricing aspects of intangibles, OECD/G20 Base Erosion and Profit Shifting Project, OECD, 2014.
3Getting tangible about intangibles: The future of growth and productivity?

Box 1 (continued)
Future work is needed to better capture the nature of investment in intangibles by revising and adjusting the accounting treatment of expenditures associated with these assets. Instead of showing up simply as in-year expenses or not being accounted for at all, spending on intangible assets could be capitalized—recognized as capital investment in an asset that will create value not only in the year of that investment but in future years, too (Exhibit 1). Looking at business investment and economies through the lens of intangibles enhances understanding of where and how they are increasingly creating value. Changing accounting norms is not theoretical but practical, and it is arguably the prerequisite for revealing the full value of intangible assets.
Exhibit 1
Corporate profitand loss
Potentially capitalized?
Capitalization factor1
Depreciation rate
Sales
Cost of goods sold
Gross margin
R&D 1.0× 0.15
Design 0.5× 0.20
Advertising 0.6× 0.55
Marketing research 0.6× 0.55
Training 1.0× 0.40
Digital n/a n/a
Other fixed costs
EBITDA
Expenses on intangibles could be capitalized to better reflect investments made in new growth potential.
Source: Corrado et al., 2012; McKinsey Global Institute analysis
Illustrative
BOX
1. Capitalization factor is the share of expenditure that is capitalized into the balance sheet.
4 McKinsey Global Institute
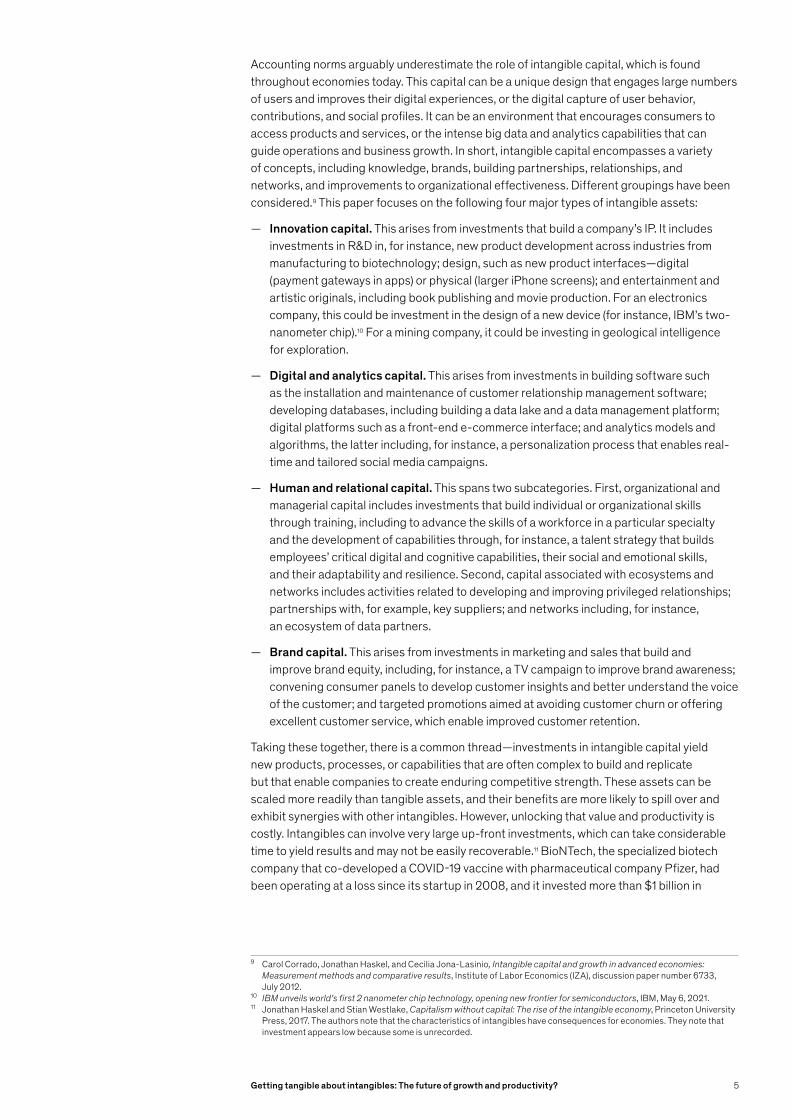
Accounting norms arguably underestimate the role of intangible capital, which is found throughout economies today. This capital can be a unique design that engages large numbers of users and improves their digital experiences, or the digital capture of user behavior, contributions, and social profiles. It can be an environment that encourages consumers to access products and services, or the intense big data and analytics capabilities that can guide operations and business growth. In short, intangible capital encompasses a variety of concepts, including knowledge, brands, building partnerships, relationships, and networks, and improvements to organizational effectiveness. Different groupings have been considered.9 This paper focuses on the following four major types of intangible assets:
— Innovation capital. This arises from investments that build a company’s IP. It includes investments in R&D in, for instance, new product development across industries from manufacturing to biotechnology; design, such as new product interfaces—digital (payment gateways in apps) or physical (larger iPhone screens); and entertainment and artistic originals, including book publishing and movie production. For an electronics company, this could be investment in the design of a new device (for instance, IBM’s two-nanometer chip).10 For a mining company, it could be investing in geological intelligence for exploration.
— Digital and analytics capital. This arises from investments in building software such as the installation and maintenance of customer relationship management software; developing databases, including building a data lake and a data management platform; digital platforms such as a front-end e-commerce interface; and analytics models and algorithms, the latter including, for instance, a personalization process that enables real-time and tailored social media campaigns.
— Human and relational capital. This spans two subcategories. First, organizational and managerial capital includes investments that build individual or organizational skills through training, including to advance the skills of a workforce in a particular specialty and the development of capabilities through, for instance, a talent strategy that builds employees’ critical digital and cognitive capabilities, their social and emotional skills, and their adaptability and resilience. Second, capital associated with ecosystems and networks includes activities related to developing and improving privileged relationships; partnerships with, for example, key suppliers; and networks including, for instance, an ecosystem of data partners.
— Brand capital. This arises from investments in marketing and sales that build and improve brand equity, including, for instance, a TV campaign to improve brand awareness; convening consumer panels to develop customer insights and better understand the voice of the customer; and targeted promotions aimed at avoiding customer churn or offering excellent customer service, which enable improved customer retention.
Taking these together, there is a common thread—investments in intangible capital yield new products, processes, or capabilities that are often complex to build and replicate but that enable companies to create enduring competitive strength. These assets can be scaled more readily than tangible assets, and their benefits are more likely to spill over and exhibit synergies with other intangibles. However, unlocking that value and productivity is costly. Intangibles can involve very large up-front investments, which can take considerable time to yield results and may not be easily recoverable.11 BioNTech, the specialized biotech company that co-developed a COVID‑19 vaccine with pharmaceutical company Pfizer, had been operating at a loss since its startup in 2008, and it invested more than $1 billion in
9 Carol Corrado, Jonathan Haskel, and Cecilia Jona-Lasinio, Intangible capital and growth in advanced economies: Measurement methods and comparative results, Institute of Labor Economics (IZA), discussion paper number 6733, July 2012.
10 IBM unveils world’s first 2 nanometer chip technology, opening new frontier for semiconductors, IBM, May 6, 2021.11 Jonathan Haskel and Stian Westlake, Capitalism without capital: The rise of the intangible economy, Princeton University
Press, 2017. The authors note that the characteristics of intangibles have consequences for economies. They note that investment appears low because some is unrecorded.
5Getting tangible about intangibles: The future of growth and productivity?

developing a mRNA technology platform.12 Because of widespread use of the BioNTech Pfizer COVID‑19 vaccine, BioNTech is today one of the most valuable companies in the biotech industry.
Both Amazon’s development of an internal search process that promotes next products to buy and Netflix’s efforts to fine-tune personal recommendations to increase video viewing and retain customers incurred considerable up-front costs, but those were also investments that contributed to building intangible assets that have been just as valuable as—and arguably more valuable than—building a factory 25 years ago. There is a risk that intangible assets can be copied or stolen from others. Think of smartphone features that are widely available across different brands. However, two characteristics make up-front investment worthwhile. First, intangibles can be scaled. Take Coca-Cola as an example; developing the brand together with a marketing and communications strategy takes a lot of money but, once developed, can be replicated anywhere in the world. Second, intangibles offer synergies. Google, for instance, invests heavily in developing human capital through training, which enables the company to attract and retain talent that, in turn, delivers an edge in highly valuable digital and analytical know-how.13
Importantly, ensuring that intangibles investments yield returns requires different capabilities and know-how, which we discuss in some depth in this paper. But they also help create new capabilities that can unlock considerable value.
Over the past 25 years, the investment share of intangibles increased by 29 percentOver the past 25 years, the United States and ten European focus economies achieved 63 percent growth in GVA, a measure of economic growth. This represents 73 percent growth in the United States and 51 percent growth in the ten European economies. During this period, the investment share of intangibles increased by 29 percent (see the technical appendix for full details of how intangibles are defined).
The European economies started from a lower base than the United States. US investment in intangibles was markedly higher as a share of investment than in Europe in 1995, 36 percent versus 25 percent. From 1995 to 2019, Europe’s share rose faster than the US share, but at the end of the period was still lower, at 36 percent compared with 42 percent. Over this period, the US economy grew at a rate of 2.3 percent but the ten European economies on average at 1.6 percent, indicating a broad relationship between level of intangibles investment and GVA growth rates.
It is notable that the share of intangibles in total investment has risen steadily even in the face of economic disruptions such as the bursting of the dot-com bubble in the late 1990s—although with some temporary periods of deceleration in that increasing share, as observed in the aftermath of the global financial crisis in 2008 (Exhibit 2). It picked up again after that and appears to have accelerated during the economic crisis triggered by the COVID‑19 pandemic. As social distancing necessitated remote working, digitization (and to a lesser extent automation) accelerated, and investment in intangibles was part of this story. Some evidence indicates that the rise in intangibles investment as a share of total investment quickened. In the United States, for example, the share of intangibles investment (as measured by gross fixed capital formation) increased by one percentage point between the first three quarters of 2019 and 2020 to reach 29 percent of total investment. The same trend was observed in European economies, some of which experienced even faster increases. In France, for example, the increase was 2.8 percentage points, while in the United Kingdom it was 1.9 percentage points.14
12 Harry Dempsey and Sarah Neville, “BioNTech to price vaccine ‘well below’ market rates,” Financial Times, November 10, 2020.
13 Paul Fain, Employers as educators, Inside Higher Ed, July 17, 2019.14 Will productivity and growth return after the COVID‑19 crisis? McKinsey Global Institute, March 2021, on McKinsey.com.
6 McKinsey Global Institute

Investment in intangibles may have been significant enough to have a positive impact on the GVA of entire economies—economies that have large intangible-rich sectors (Exhibit 3). Three economies stand out for having achieved both high investment in intangibles and robust growth in GVA: Sweden, the United Kingdom, and the United States. Sweden achieved annual 2.4 percent GVA between 1995 and 2020, the United States 2.3 percent, and the United Kingdom 2.2 percent. All three economies have larger shares of knowledge and innovation sectors, in which intangibles investment is prominent. Conversely, economies that posted lower rates of growth in GVA over this period were more exposed to resource- or labor-intensive sectors that tend to invest less in intangibles. Many other factors determine growth, of course, and they should be examined in detail, but there does appear to be a link between investment in intangibles and GVA growth at the whole-economy level.
An intangibles-rich economic model is not the only way for an economy to promote productivity and growth. Nevertheless, economies that are experiencing growth in intangibles investment are also posting growth in total factor productivity (Exhibit 4).15 This suggests that total factor productivity growth and growth in intangibles investment may be correlated—an increase in intangibles investment may trigger an increase in total factor productivity, and therefore long-term economic growth. Future research is needed to ascertain how strong this correlation is and what other factors may be in play.
15 Total factor productivity is a measure of the output of an economy relative to the size of all of its primary factor inputs (capital and labor). When the growth of a nation’s economic output over time is compared with the growth of its labor force and its capital stock (inputs), the former usually exceeds the latter. This is due to growth in total factor productivity, that is, the ability to combine the factors (labor and capital) more effectively over time. This can be due to changes in qualities (more appropriate skills or embedded technologies) or to better methods of organization. See Antonin Bergaud, Gilbert Cette, and Rémy Lecat, “Productivity trends in advanced countries between 1890 and 2012,” Review of Income and Wealth, 2016, Volume 62, Number 3.
Exhibit 2
The investment mix has shifted toward intangibles over the past 25 years.
Source: EU-KLEMS; Eurostat; INTAN-Invest; McKinsey Global Institute analysis
1. European countries are Austria, Denmark, Finland, France, Germany, Italy, Netherlands, Spain, Sweden, and United Kingdom.2. Data extrapolated for 2015–19 based on 2010–15 average growth.
Intangible/tangible investment mix, United States and 10 European countries, 1995–2019, %1
3140
6960
1995 152000 05 10 2019
TangiblesExamples Residential and
nonresidential buildings Transportation equipment Machinery equipment Communication equipment
IntangiblesExamples Intellectual/innovative
property Computerized information Economic competencies
Share growth
+29%
-13%
Extrapolated2
7Getting tangible about intangibles: The future of growth and productivity?
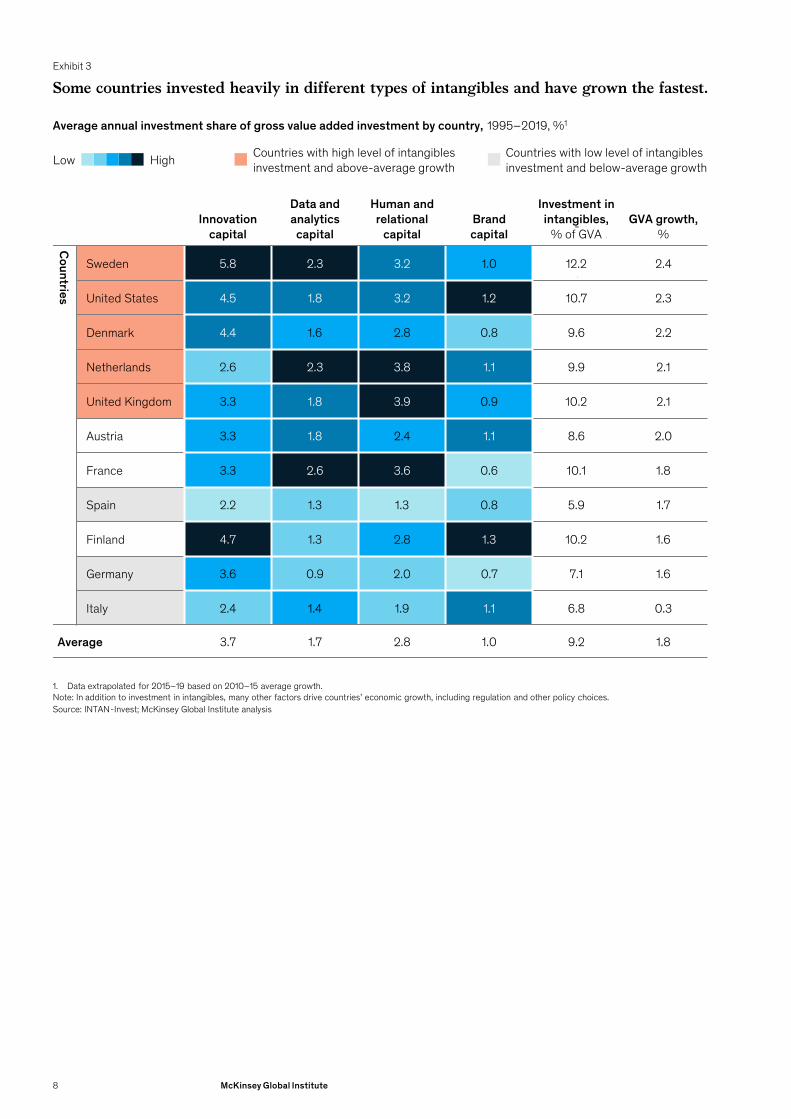
Exhibit 3
Some countries invested heavily in different types of intangibles and have grown the fastest.
Source: INTAN-Invest; McKinsey Global Institute analysis
1. Data extrapolated for 2015–19 based on 2010–15 average growth.Note: In addition to investment in intangibles, many other factors drive countries’ economic growth, including regulation and other policy choices.
HighLow
Average annual investment share of gross value added investment by country, 1995–2019, %1
Innovation capital
Data and analytics
capital
Human and relational
capitalBrand capital
Investment in intangibles,
% of GVAGVA growth,
%
Countries
Sweden 5.8 2.3 3.2 1.0 12.2 2.4
United States 4.5 1.8 3.2 1.2 10.7 2.3
Denmark 4.4 1.6 2.8 0.8 9.6 2.2
Netherlands 2.6 2.3 3.8 1.1 9.9 2.1
United Kingdom 3.3 1.8 3.9 0.9 10.2 2.1
Austria 3.3 1.8 2.4 1.1 8.6 2.0
France 3.3 2.6 3.6 0.6 10.1 1.8
Spain 2.2 1.3 1.3 0.8 5.9 1.7
Finland 4.7 1.3 2.8 1.3 10.2 1.6
Germany 3.6 0.9 2.0 0.7 7.1 1.6
Italy 2.4 1.4 1.9 1.1 6.8 0.3
Average 3.7 1.7 2.8 1.0 9.2 1.8
Countries with high level of intangibles investment and above-average growth
Countries with low level of intangibles investment and below-average growth
8 McKinsey Global Institute

Investing in intangibles correlates with sector growth A correlation between investment in intangibles and GVA growth is observable at the sector level. Based on the detailed sector data in the INTAN‑Invest database, we classified sectors into four groups based on their main source of competitive advantage. Broad correlations are discernible across sectors and in four groups of sectors identified based on their sources of competitive advantage: (1) innovation-driven services such as information and communications technology (ICT); (2) knowledge-intensive services, such as finance and insurance, and professional services; (3) labor-intensive services, such as wholesale trade, transportation and warehousing, accommodation and food services, construction, and healthcare; and (4) resource-intensive goods such as mining, manufacturing and utilities (Exhibit 5).
Sectors that have invested the most in intangibles—more than 12 percent of their GVA—have achieved higher growth in GVA, at more than 2.7 percent per year (28 percent higher than other sectors). However, the strength of this correlation is not uniform across sectors. Knowledge-intensive services appear to have deployed intangibles more effectively than other groups of sectors, investing 15 percent of their GVA and, on average, achieving above-average GVA growth of 3.0 percent a year. Innovation-driven services on average invested 17.4 percent of their GVA in intangibles and grew at 2.9 percent a year.
Exhibit 4
Productivity growth has historically been correlated with growth in intangibles investment across countries.
Source: INTAN-Invest; Bergeaud et al., 2016; McKinsey Global Institute analysis
1. 1999–2016 CAGR for United States.2. Excl Spain.Note: Figures show average annual growth rates, 1999–2017. Data are whole economy.
Growth in total factor productivity and intangibles investment, United States and 9 European countries, 1999–2017, compound annual growth rate (CAGR), %1
0.5 3.5-0.5
0 2.0 5.01.0 5.52.51.5 3.0 4.54.0 6.0 6.5
0
0.5
1.0
1.5
Finland
Austria
France
Denmark
Sweden
Spain
UnitedKingdom
UnitedStates
Italy
Netherlands
Growth in total factor productivity, CAGR, %
Growth in intangibles investment, CAGR, %
R2 = 55%2
9Getting tangible about intangibles: The future of growth and productivity?

Exhibit 5
Some sectors are intangible-intensive, invest in specific categories of intangibles, and have grown faster.
Source: INTAN-Invest; McKinsey Global Institute analysis
1. Data extrapolated for 2015–19 based on 2010–15 average growth. European countries are Austria, Denmark, Finland, France, Germany, Italy, Netherlands, Spain, Sweden, and United Kingdom.
2. Non-business sectors (eg, government and education) not considered because no data available for human and relational capital and brand capital.3. Includes other minor intangibles categories (<2 of total intangibles investment).4. Most investment in innovation capital in mining relates to mineral exploration, which is considered an intangible in national accounts. Note: Color coding realized for each intangible capital category independently.
HighLowAverage annual intangibles investment share of GVA by sector, 1995–2019, %1
Sector types Sectors2Innovation
capital
Data and analytics
capital
Human and relational
capitalBrand capital
Investment in intangibles, % of GVA3
GVA growth,
%
Innovation-driven services
ICT 8.1 6.1 4.5 2.5 21.1 2.8
Entertainment and recreation 5.3 0.8 5.1 1.9 13.7 3.0
Knowledge-intensive services
Finance and insurance 3.6 3.3 6.2 1.6 14.6 2.6
Professional services 3.8 3.2 6.2 1.6 14.9 3.4
Labor-intensive services
Wholesale trade 1.9 1.4 3.8 2.1 9.3 1.8
Transportation and warehousing 1.0 1.1 3.1 0.6 5.8 1.9
Accommodation and food services 0.7 0.3 3.2 1.5 5.7 2.8
Construction 1.5 0.4 3.0 0.3 5.1 1.7
Healthcare 0.6 0.6 0.0 0.0 1.1 2.9
Resource-intensive goods
Mining4 25.0 0.8 1.9 0.0 27.9 3.8
Manufacturing 8.8 1.8 3.5 1.3 15.3 0.9
Utilities 1.7 1.6 3.4 0.9 7.6 1.2
Average 5.2 1.8 3.7 1.2 11.9 2.4
10 McKinsey Global Institute
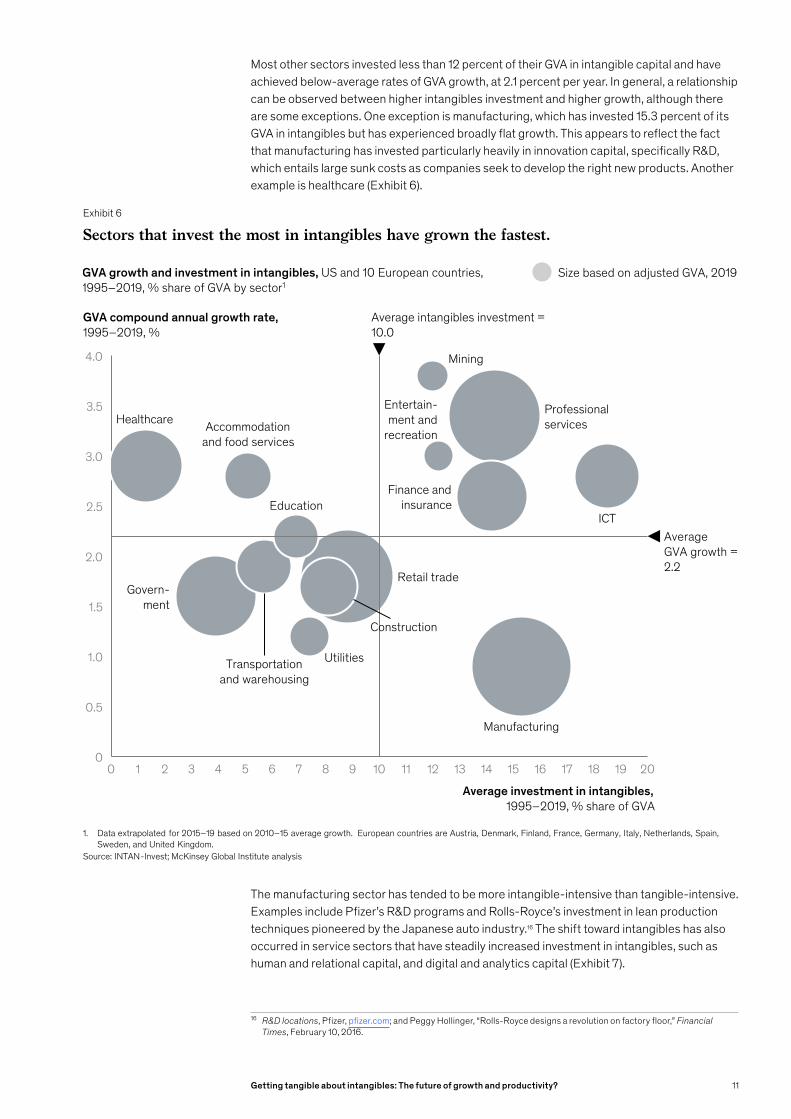
Most other sectors invested less than 12 percent of their GVA in intangible capital and have achieved below-average rates of GVA growth, at 2.1 percent per year. In general, a relationship can be observed between higher intangibles investment and higher growth, although there are some exceptions. One exception is manufacturing, which has invested 15.3 percent of its GVA in intangibles but has experienced broadly flat growth. This appears to reflect the fact that manufacturing has invested particularly heavily in innovation capital, specifically R&D, which entails large sunk costs as companies seek to develop the right new products. Another example is healthcare (Exhibit 6).
The manufacturing sector has tended to be more intangible-intensive than tangible-intensive. Examples include Pfizer’s R&D programs and Rolls-Royce’s investment in lean production techniques pioneered by the Japanese auto industry.16 The shift toward intangibles has also occurred in service sectors that have steadily increased investment in intangibles, such as human and relational capital, and digital and analytics capital (Exhibit 7).
16 R&D locations, Pfizer, pfizer.com; and Peggy Hollinger, “Rolls-Royce designs a revolution on factory floor,” Financial Times, February 10, 2016.
Exhibit 6
Sectors that invest the most in intangibles have grown the fastest.
Source: INTAN-Invest; McKinsey Global Institute analysis
1. Data extrapolated for 2015–19 based on 2010–15 average growth. European countries are Austria, Denmark, Finland, France, Germany, Italy, Netherlands, Spain, Sweden, and United Kingdom.
GVA growth and investment in intangibles, US and 10 European countries, 1995–2019, % share of GVA by sector1
GVA compound annual growth rate, 1995–2019, %
Average investment in intangibles, 1995–2019, % share of GVA
Size based on adjusted GVA, 2019
0 1 17632 5 1494 7
2.5
8 2010 11
3.5
4.0
1.0
12 13
3.0
15 16 18 190
0.5
1.5
2.0
ICTEducation
Mining
Utilities
Govern-ment
Construction
Professionalservices
Manufacturing
Retail trade
Healthcare
Transportationand warehousing
Accommodationand food services
Entertain-ment and
recreation
Finance andinsurance
Average intangibles investment =10.0
Average GVA growth =2.2
11Getting tangible about intangibles: The future of growth and productivity?
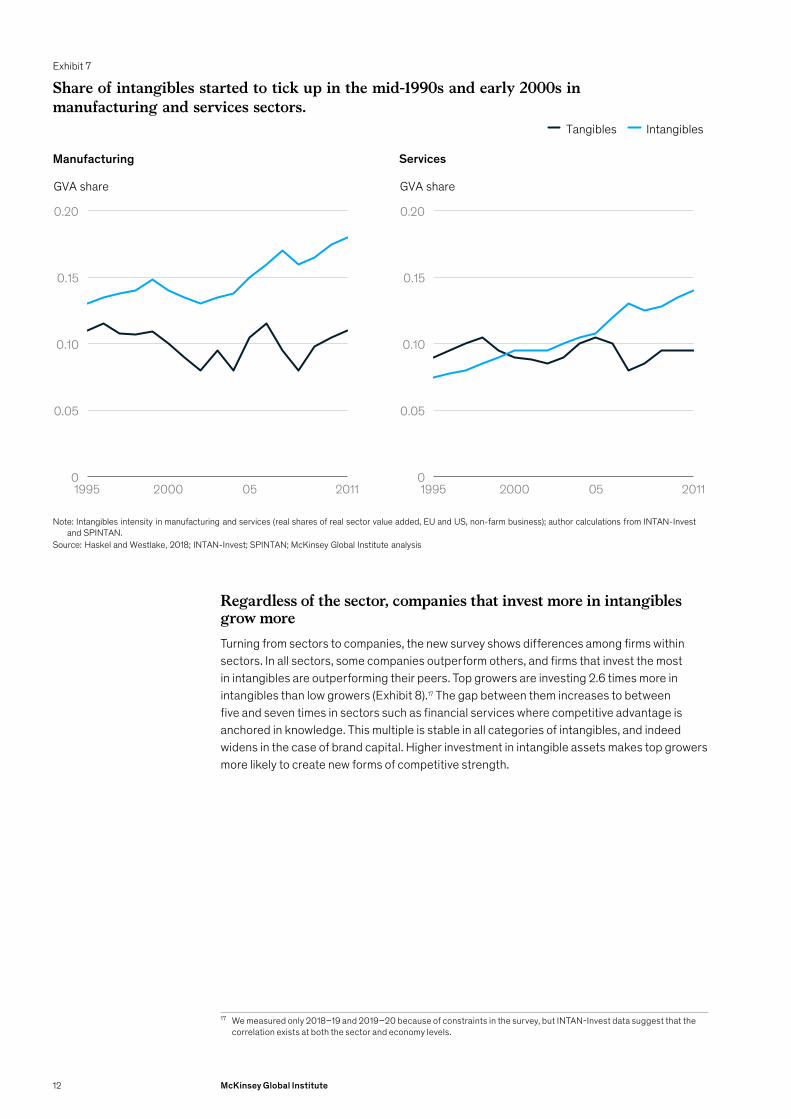
Regardless of the sector, companies that invest more in intangibles grow more Turning from sectors to companies, the new survey shows differences among firms within sectors. In all sectors, some companies outperform others, and firms that invest the most in intangibles are outperforming their peers. Top growers are investing 2.6 times more in intangibles than low growers (Exhibit 8).17 The gap between them increases to between five and seven times in sectors such as financial services where competitive advantage is anchored in knowledge. This multiple is stable in all categories of intangibles, and indeed widens in the case of brand capital. Higher investment in intangible assets makes top growers more likely to create new forms of competitive strength.
17 We measured only 2018–19 and 2019–20 because of constraints in the survey, but INTAN‑Invest data suggest that the correlation exists at both the sector and economy levels.
Exhibit 7
Share of intangibles started to tick up in the mid-1990s and early 2000s in manufacturing and services sectors.
Source: Haskel and Westlake, 2018; INTAN-Invest; SPINTAN; McKinsey Global Institute analysis
Note: Intangibles intensity in manufacturing and services (real shares of real sector value added, EU and US, non-farm business); author calculations from INTAN-Invest and SPINTAN.
Manufacturing
0.20
0
0.05
0.10
0.15
20001995
GVA share
05 2011
Tangibles Intangibles
Services
0.15
0.05
0
0.20
0.10
2000
GVA share
1995 05 2011
12 McKinsey Global Institute
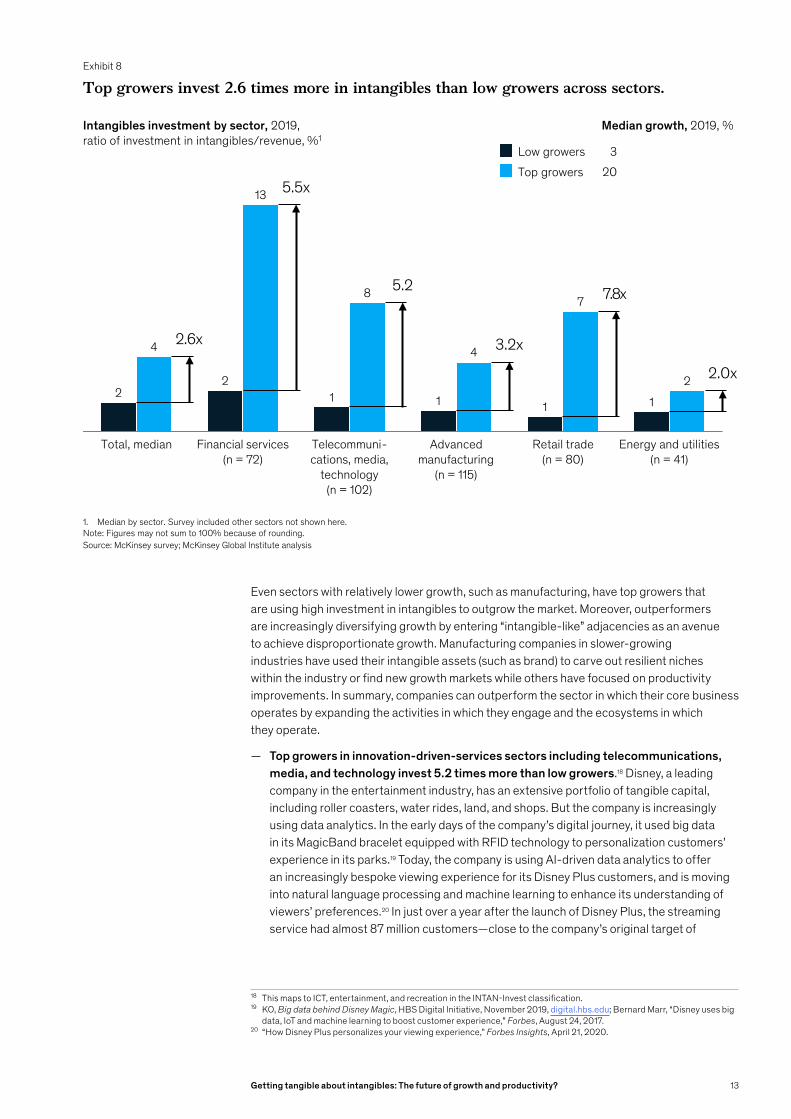
Even sectors with relatively lower growth, such as manufacturing, have top growers that are using high investment in intangibles to outgrow the market. Moreover, outperformers are increasingly diversifying growth by entering “intangible-like” adjacencies as an avenue to achieve disproportionate growth. Manufacturing companies in slower-growing industries have used their intangible assets (such as brand) to carve out resilient niches within the industry or find new growth markets while others have focused on productivity improvements. In summary, companies can outperform the sector in which their core business operates by expanding the activities in which they engage and the ecosystems in which they operate.
— Top growers in innovation-driven-services sectors including telecommunications, media, and technology invest 5.2 times more than low growers.18 Disney, a leading company in the entertainment industry, has an extensive portfolio of tangible capital, including roller coasters, water rides, land, and shops. But the company is increasingly using data analytics. In the early days of the company’s digital journey, it used big data in its MagicBand bracelet equipped with RFID technology to personalization customers’ experience in its parks.19 Today, the company is using AI-driven data analytics to offer an increasingly bespoke viewing experience for its Disney Plus customers, and is moving into natural language processing and machine learning to enhance its understanding of viewers’ preferences.20 In just over a year after the launch of Disney Plus, the streaming service had almost 87 million customers—close to the company’s original target of
18 This maps to ICT, entertainment, and recreation in the INTAN‑Invest classification.19 KO, Big data behind Disney Magic, HBS Digital Initiative, November 2019, digital.hbs.edu; Bernard Marr, “Disney uses big
data, IoT and machine learning to boost customer experience,” Forbes, August 24, 2017.20 “How Disney Plus personalizes your viewing experience,” Forbes Insights, April 21, 2020.
Exhibit 8
22
1 1 1 1
4
13
8
4
7
2
Total, median Financial services(n = 72)
Telecommuni-cations, media,
technology(n = 102)
Advanced manufacturing
(n = 115)
Retail trade(n = 80)
Energy and utilities(n = 41)
3.2x2.6x
5.5x
7.8x5.2
2.0x
Top growers invest 2.6 times more in intangibles than low growers across sectors.
Source: McKinsey survey; McKinsey Global Institute analysis
1. Median by sector. Survey included other sectors not shown here.Note: Figures may not sum to 100% because of rounding.
Low growersTop growers
Intangibles investment by sector, 2019, ratio of investment in intangibles/revenue, %1
Median growth, 2019, %
203
13Getting tangible about intangibles: The future of growth and productivity?

90 million in year four.21 By the second quarter of 2021, that total had risen to nearly 104 million.22
— Top growers in knowledge-intensive-services sectors such as financial services invest 5.4 times more than low growers. One major European bank had invested limited amounts in intangible capital and had limited access to data, a shortage of skills, and conflicting data strategies. In response, the bank sought to increase its access to data, invested heavily in organizational and managerial capital, and deployed an analytics transformation program covering the redesign of its organization, a talent strategy, the modernization of its data architecture, and building analytics capabilities across the organization. The transformation of the bank’s brand capital added the most value. The bank developed strong marketing intelligence capabilities for its retail branches, which enabled more granular customer segmentation and personalized pricing, and enhanced management of the entire customer journey. Finally, optimized data management and a new data architecture enabled enhanced analytics capabilities that the bank used to drive decision making, streamline reporting, and ensure immediate access to robust data.
— Top growers in retail trade, a labor-intensive-services sector, invest 8.0 times more in intangibles than low growers. In the past, US discount retailer Walmart relied on investments in tangibles to drive its revenue, opening new stores, optimizing the layout of shelves within stores, and expanding the size of its warehouses. However, in 2019, the company opened only ten additional stores in the United States, its most important market, as its focus turned to building an innovation culture. Among its initiatives were using new technologies to enable driver-free deliveries and developing a comprehensive ecosystem of partners in order to be competitive with e-commerce platforms. Enhancing its brand capital, the company offered customers a loyalty program with a focus on free delivery, more choice, and a personalized pricing system. Walmart also developed its human, organizational, and managerial capital, reskilling existing workers and attracting new talent. The company developed more than 40 new partnerships to improve customer convenience. Digital and analytics capital development played a key role in this new ecosystem, enabling the company to connect its partners, businesses it acquired, and customers on a single digital platform while embedding machine learning across many areas of its business. Investments in digital and analytics helped not only to build a stable technology platform but also to generate advertising revenues through detailed data gathering and analysis of customers’ shopping patterns.23
— Top growers in resource-intensive-goods sectors, such as advanced manufacturing, and energy and materials, invest 2.0 to 3.0 times more in intangibles than low growers. In these sectors, the gap in intangibles investment between top and low growers is limited in comparison with other sectors, indicating that these assets do not play as consequential a role in driving performance and growth differences among companies.24 In manufacturing and mining, for instance, companies deploy digital tools to engage their customers, suppliers, and partners, but digital penetration in their physical assets remains relatively low. Nevertheless, there are differences in the level of intangibles investment as top growers diversify into “intangible-like” adjacencies as an avenue to achieve disproportionate growth. One best-in-class European automotive industry player has embraced the disruptive shifts in its industry. The company still relies on designing and manufacturing parts and systems to electrify power trains, optimizing overall thermal management, and building advanced driving assistance systems. However, it
21 Todd Spangler, “Disney Plus to increase prices in early 2021, eyes up to 260M subscribers by end of 2024,” Variety, December 10, 2020.
22 Statista, Disney+’s number of subscribers worldwide from 1st quarter 2020 to 2nd quarter 2021, statista.com/.23 Timothy Green, Amazon spends more on advertising than Wal-Mart, Target, Best Buy, Home Depot, and Kroger
combined, The Motley Fool, February 2018; A. Guttmann, Walmart: Advertising spending 2015‑2020, Statista, September 2020; and Stewart Samuel, Walmart: investing to develop a global ecosystem, Retail Analysis, October 2018.
24 In the McKinsey survey, the energy and materials sector bundles mining and utilities companies, and the advanced manufacturing sector combines advanced electronics, automotive and assembly, aerospace and defense, and semiconductor players. These differences in classification from the INTAN‑Invest database make it more challenging to compare the survey results with INTAN‑Invest data than in other sectors.
14 McKinsey Global Institute

invests more in intangible capital, boosting its R&D investments. For instance, it has launched the first global research center in AI and deep learning dedicated to automotive applications, the aim being to develop high-performance sensors capable of perceiving and understanding a vehicle’s context, advanced automated driving functions in complex environments, smart interaction with users, and learning capabilities through connected cars.25 The company has estimated that its investment in innovation capital would enable it to outperform the rest of the automotive market by about five percentage points, increase earnings before interest, taxes, depreciation, and amortization to 15 percent of sales in 2022, and double its generation of free cash flow in 2020–22 versus 2017–19.26
The scalability of intangibles is already enabling large and profitable firms to emerge, and they could potentially pull further ahead, thereby widening the productivity and profit gaps between leaders and laggards.27 Previous MGI research found that a key distinguishing feature of “superstar” companies is their investment in intangibles. On an annual basis, superstar companies spend two to three times more on R&D than their peers, and their share of R&D spending has increased over the past 20 years. Superstar companies in the top 1 percent by economic profit are almost three times more R&D-intensive than median companies are, and nearly ten times more R&D-intensive than companies in the bottom decile. Capitalized spending on intangibles accounts for one-third of superstars’ invested capital, four times the share for bottom-decile companies.28
An increasing concentration of revenue and profit in a small group of successful firms risks increasing inequality. Intangibles-heavy superstar firms employ relatively fewer people than less digitized businesses, but they tend to be more highly skilled and paid. If these businesses pull even further ahead, the labor share of income—the percentage of national income that goes to worker compensation—could decline even more. Past MGI research showed that this phenomenon has been responsible for about 20 percent of the reduction in labor share in the United States since 2000, a period in which three-quarters of the decline since 1947 was registered.29 Jonathan Haskel and Stian Westlake have argued that the rise of intangibles explains several aspects of the long-term rise in inequality. Synergies and spillovers create inequality between competing companies, and this leads to inequalities in employees’ pay. Second, the rise of intangibles makes cities—the incubators of spillovers and synergies—even more attractive places to be, and this drives up property prices: inequality of wealth.30
25 Our strategy, Valeo, valeo.com.26 Valeo Investor Day 2019, Valeo Group, December 2019.27 Jonathan Haskel and Stian Westlake, Capitalism without capital: The rise of the intangible economy, Princeton University
Press, 2017. The authors argue that the scalability of intangibles enables large and profitable firms to emerge, raising the productivity and profits gap between leaders and laggards, and contributing to increased income inequality. Also see Productivity growth in the digital age, OECD, February 2019.
28 MGI analyzed 5,750 of the world’s largest public and private companies, each with annual revenue greater than $1 billion. Together, they made up 65 percent of global corporate pretax earnings (earnings before interest, taxes, depreciation, and amortization) from 1994 to 2016. The metric used for superstar companies was economic profit, a measure of a company’s invested capital times its return above its weighted cost of capital. Economic profit is used because it reflects the economic value created by a company’s operating activities and investments. See Superstars: The dynamics of firms, sectors, and cities leading the global economy, McKinsey Global Institute, October 2018; and “What every CEO needs to know about ‘superstar’ companies,” McKinsey Global Institute, April 2019, on McKinsey.com.
29 A new look at the declining labor share of income in the United States, McKinsey Global Institute, October 2018, on McKinsey.com.
30 Jonathan Haskel and Stian Westlake, Capitalism without capital: The rise of the intangible economy, Princeton University Press, November 28, 2017.
15Getting tangible about intangibles: The future of growth and productivity?
Companies that substantially invest in all four categories of intangible capital outperform their peers and develop resilience Intangibles are interdependent, and companies achieve greater synergies by investing in them all. Companies that have invested across all categories of intangibles are further ahead in their digitization journey, less likely to be disrupted because they are highly innovative, and highly likely to be able to attract and retain top talent. All of this can create value and, importantly, value that can be defended even amid a deep market and economic disruption.
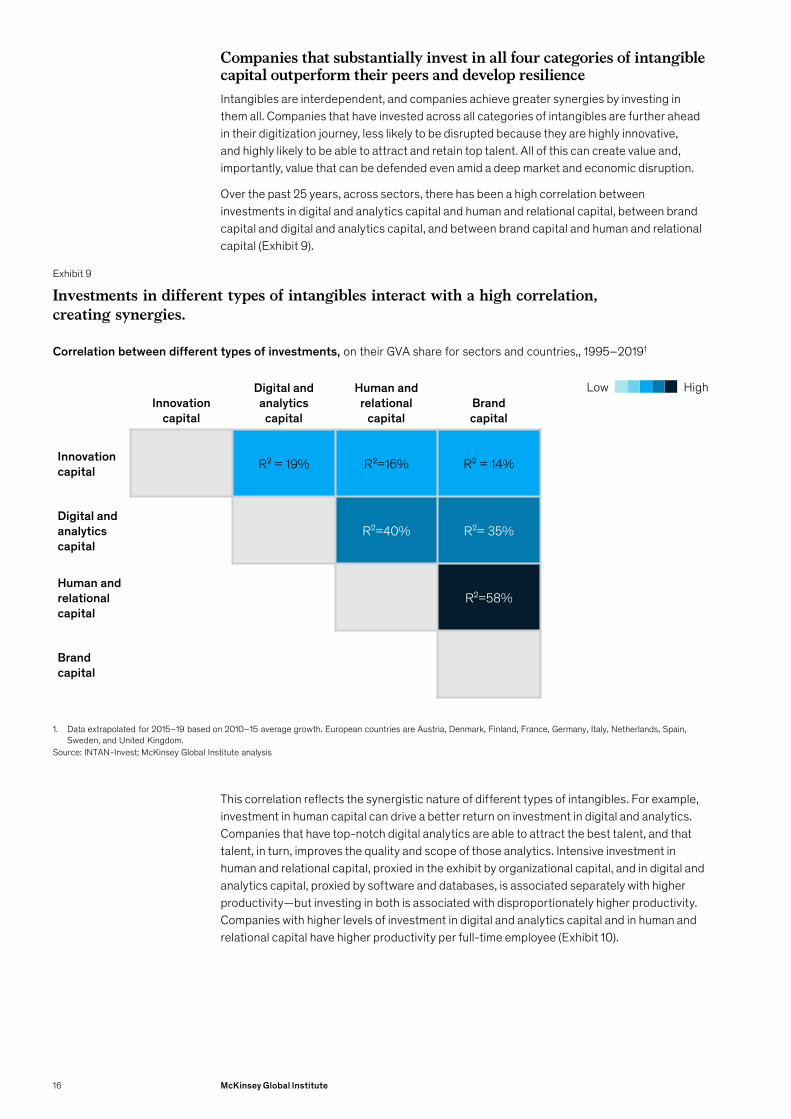
Over the past 25 years, across sectors, there has been a high correlation between investments in digital and analytics capital and human and relational capital, between brand capital and digital and analytics capital, and between brand capital and human and relational capital (Exhibit 9).
This correlation reflects the synergistic nature of different types of intangibles. For example, investment in human capital can drive a better return on investment in digital and analytics. Companies that have top-notch digital analytics are able to attract the best talent, and that talent, in turn, improves the quality and scope of those analytics. Intensive investment in human and relational capital, proxied in the exhibit by organizational capital, and in digital and analytics capital, proxied by software and databases, is associated separately with higher productivity—but investing in both is associated with disproportionately higher productivity. Companies with higher levels of investment in digital and analytics capital and in human and relational capital have higher productivity per full-time employee (Exhibit 10).
Exhibit 9
Investments in different types of intangibles interact with a high correlation, creating synergies.
Source: INTAN-Invest; McKinsey Global Institute analysis
1. Data extrapolated for 2015–19 based on 2010–15 average growth. European countries are Austria, Denmark, Finland, France, Germany, Italy, Netherlands, Spain, Sweden, and United Kingdom.
Correlation between different types of investments, on their GVA share for sectors and countries,, 1995–20191
HighLowInnovation
capital
Digital and analytics
capital
Human and relational
capitalBrand capital
Innovation capital R² = 19% R²=16% R² = 14%
Digital and analytics capital
R²=40% R²= 35%
Human and relational capital
R²=58%
Brand capital
16 McKinsey Global Institute

Likewise, companies that excel in marketing tend to be those that have invested not only in brand capital but also in digital and analytics capital, the latter being the key to enabling real-time and personalized marketing, which in turn enhances brand capital. We find the same synergies in the case of brand capital and innovation capital (Exhibit 11).
Exhibit 10
0 3500
260
Investments in digital and analytics capital and in human and relational capital appear to be highly complementary.
Source: EU KLEMS; INTAN-Invest; McKinsey Global Institute analysis
1. Proxied by investments in organizational and managerial capital, a subcategory of human and relational capital.Note: Deepnet model based on 12 countries, 11 sectors, and 14 asset types, 1995–2015.
Low productivity ($20 per hour) High productivity ($200 per hour)
Cumulative investment in human and relational capital, $ thousand per person employed1
Cumulative investment in digital and analytics capital,
$ thousand per person employed
17Getting tangible about intangibles: The future of growth and productivity?

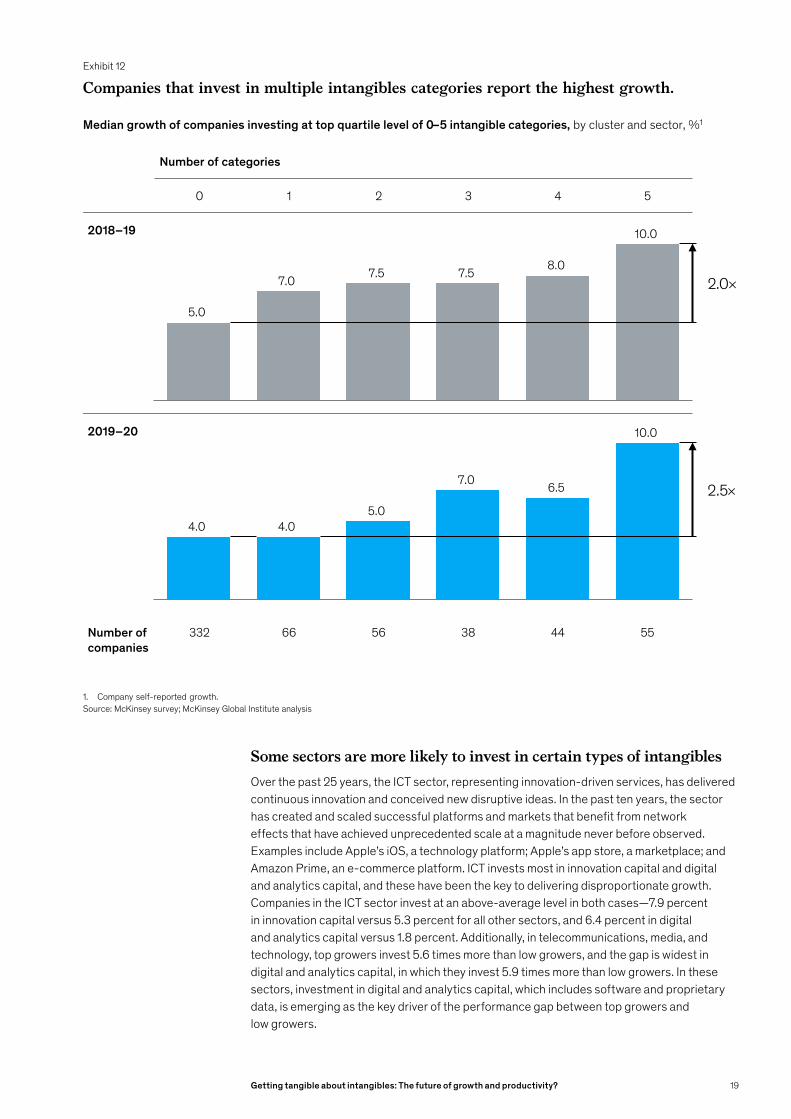
The survey indicates that a large majority, 81 percent, of companies invest in all types of intangible capital, and the evidence indicates that the more categories in which they invest substantially (in the top quartile), the higher their growth in GVA—proof of the power of synergies. Companies that are in the top quartile for investment in three intangible capital categories and the two subcategories of the fourth (human and relational capital) grow 2.0 to 2.5 times faster than companies that were not in the top quartile for investment in any intangible category. Across sectors in 2018–19, a company that was not in the top quartile for any intangible category grew at 5.0 percent, but a company in the top quartile for one category grew at 7.0 percent (median), rising to 7.5 percent for three categories, 8.0 percent for four, and 10.0 percent for five (Exhibit 12).
During the COVID‑19 pandemic (in the course of 2020), companies that invested significantly in the three intangible capital categories and the two subcategories of the fourth (human and relational capital) outperformed others; only firms investing substantially in all four categories of intangible asset (five, taking into account the two subcategories of human and relational capital) were able to maintain 2019 levels of growth. This indicates that breadth of investment in intangibles promotes resilience.
Exhibit 11
Similar complementarities appear in the case of investments in innovation capital and in brand capital.
Source: EU KLEMS; INTAN-Invest; McKinsey Global Institute analysis
1. Proxied by investments in organizational and managerial capital, a subcategory of human and relational capital.Note: Deepnet model based on 12 countries, 11 sectors, and 14 asset types, 1995–2015.
Cumulative investment in brand capital, $ thousand per person employed1
Cumulative investment in innovation capital,
$ thousand per person employed1
0 2600
90
Low productivity ($20 per hour) High productivity ($200 per hour)
18 McKinsey Global Institute
Some sectors are more likely to invest in certain types of intangiblesOver the past 25 years, the ICT sector, representing innovation-driven services, has delivered continuous innovation and conceived new disruptive ideas. In the past ten years, the sector has created and scaled successful platforms and markets that benefit from network effects that have achieved unprecedented scale at a magnitude never before observed. Examples include Apple’s iOS, a technology platform; Apple’s app store, a marketplace; and Amazon Prime, an e-commerce platform. ICT invests most in innovation capital and digital and analytics capital, and these have been the key to delivering disproportionate growth. Companies in the ICT sector invest at an above-average level in both cases—7.9 percent in innovation capital versus 5.3 percent for all other sectors, and 6.4 percent in digital and analytics capital versus 1.8 percent. Additionally, in telecommunications, media, and technology, top growers invest 5.6 times more than low growers, and the gap is widest in digital and analytics capital, in which they invest 5.9 times more than low growers. In these sectors, investment in digital and analytics capital, which includes software and proprietary data, is emerging as the key driver of the performance gap between top growers and low growers.
Exhibit 12
Number of categories
0 1 2 3 4 5
2018–19
2019–20
Number of companies
332 66 56 38 44 55
5.0
7.0 7.5 7.5 8.0
10.0
2.0×
Companies that invest in multiple intangibles categories report the highest growth.
Source: McKinsey survey; McKinsey Global Institute analysis 1. Company self-reported growth.
Median growth of companies investing at top quartile level of 0–5 intangible categories, by cluster and sector, %1
4.0 4.0 5.0
7.0 6.5
10.0
2.5×
19Getting tangible about intangibles: The future of growth and productivity?

Knowledge-intensive-services sectors prioritize human and relational capital in their intangibles investment; this category accounts for 6.0 percent of GVA, double the average share across sectors. The reason for favoring this type of intangibles investment is that it is perceived to deliver competitive advantages for companies in these sectors. For instance, in finance and insurance, managing digital talent is key to delivering an effective shift toward e-banking.31 McKinsey research in 2016 estimated that 43 percent of all working hours in banking activities will be automated in the future, necessitating a very large-scale shift in the type of skills needed, from basic cognitive skills to technological ones.32 This implies the need for significant investment in human and relational capital well into the future. These sectors also prioritize investment in brand capital as the key to driving the mass adoption of products and services. Again in the financial services industry, initially the emergence of e-banks didn’t convince a broad range of customers of their merits. Neo-banks including Revolut and N26 had to invest huge amounts in marketing to evangelize their products and spread adoption from early tech-savvy customers to millions of active consumers; in 2019, the two banks had ten million and seven million users, respectively.33 This resonates with the survey’s finding that the gap between top growers and low growers is largest for human and relational capital and brand capital. Top growers invest 10.2 times more than low growers in ecosystems and networks, a type of human and relational capital, and 7.9 times more in brand capital (Exhibit 13).
Labor-intensive services overall invest less than half the average share of GVA of other sectors—1.4 percent of GVA versus 3.0 percent. When they do invest in intangibles, they tend to prioritize human and relational capital, reflecting the fact that these sectors employ more people on average (as their name suggests) and still have a large element of in-person services. Within this category, retail trade also overindexes brand capital, which include activities such as brand equity, customer engagement, and customer acquisition. Retailers have increasingly focused on establishing direct-to-consumer channels as the route to increasing customer acquisition. One example of a brand success is Casper, a mattress company that achieved $750 million of revenue in four years thanks to a well-executed marketing strategy.34 To obtain more leads for its online store, the company set out to gain deep understanding of Google and Facebook advertising algorithms and then used that information to create relevant and targeted content for each stage of its funnel that convinced large numbers of consumers to adopt quickly. Again, this resonates with the survey’s findings that top growers appear to be driving above-average investment in these intangibles categories. Top growers invest 7.4 times more than low growers in brand capital and 6.2 times more in organizational and managerial capital, a subcategory of human and relational capital.
In resource-intensive goods, both mining and manufacturing have invested heavily in innovation capital, spending 26.1 percent and 9.2 percent of GVA, respectively, compared with the 5.3 percent average for all other sectors. The motivation was to accelerate and expand exploration in the case of the first, and to develop a rich pipeline of new products in the second. In addition, the manufacturing sector, which was under intense pressure to raise productivity, has invested above-average shares of GVA in digital and analytics capital (1.8 percent and 3.6 percent of GVA) and human and relational capital (1.8 percent and 3.7 percent) as companies have strived to spread automation, which necessitated investment in skills building.
31 Dana Maor, “A strategic blueprint for making the most of banking talent,” May 2019, McKinsey.com. 32 Michael Chui, James Manyika, and Mehdi Miremadi, “Where machines could replace humans—and where they can’t (yet),”
McKinsey Quarterly, June 2016, McKinsey.com. 33 5 killer fintech marketing campaigns, Content Works, February 2020, contentworks.agency; and Amy Lewin,
N26’s strategy to stand out in the UK’s sea of fintechs, Sifted, April 22, 2019. 34 Sam Thomas Davies, Casper Marketing: How a mattress company went from zero to $750 million in 4 years (case study),
Sleeknote, December 2020.
20 McKinsey Global Institute
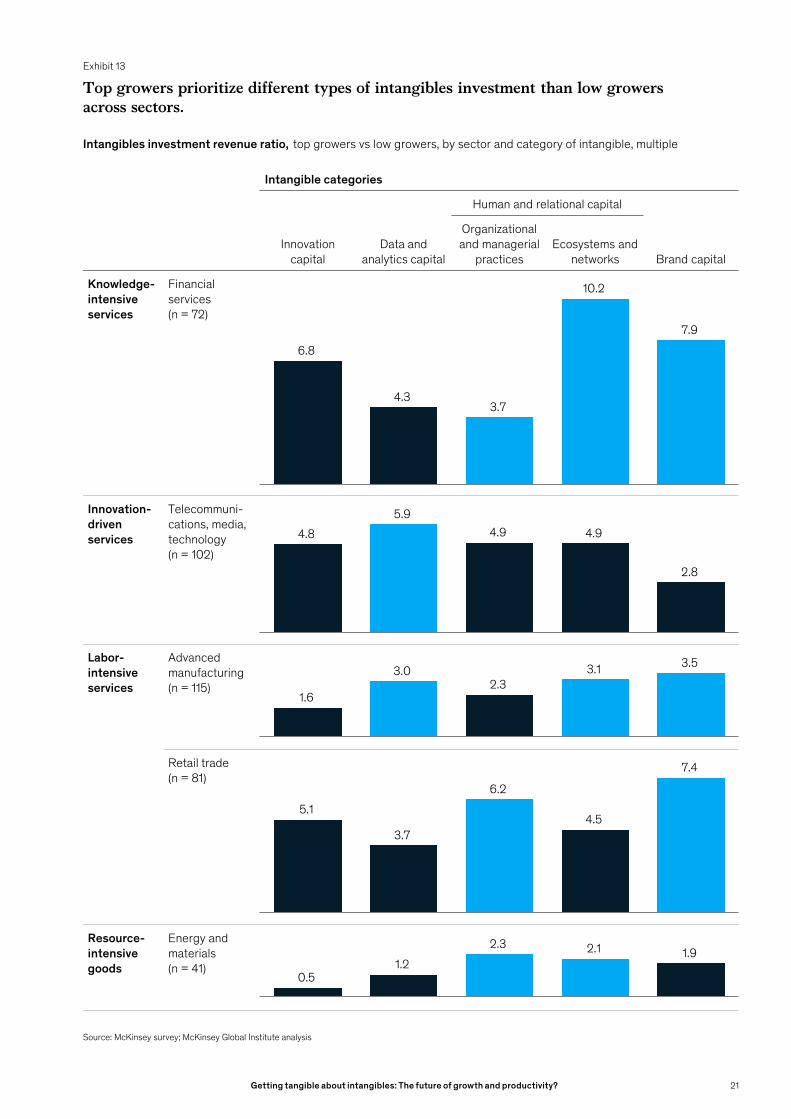
Exhibit 13
Top growers prioritize different types of intangibles investment than low growers across sectors.
Source: McKinsey survey; McKinsey Global Institute analysis
Intangibles investment revenue ratio, top growers vs low growers, by sector and category of intangible, multiple
Intangible categories
Innovation capital
Data and analytics capital
Human and relational capital
Brand capital
Organizational and managerial
practicesEcosystems and
networks
Knowledge-intensive services
Financial services(n = 72)
Innovation-driven services
Telecommuni-cations, media, technology(n = 102)
Labor-intensive services
Advanced manufacturing(n = 115)
Retail trade(n = 81)
Resource-intensive goods
Energy and materials(n = 41)
6.8
4.3 3.7
10.2
7.9
4.8 5.9
4.9 4.9
2.8
1.6
3.0 2.3
3.1 3.5
5.1
3.7
6.2
4.5
7.4
0.5 1.2
2.3 2.1 1.9
21Getting tangible about intangibles: The future of growth and productivity?

Top growers not only invest more in intangibles but also deploy them in ways that develop new capabilitiesMerely investing in intangibles is not sufficient to drive growth. Companies should think about how those intangibles are deployed and used to develop capabilities that create a competitive advantage. Consider, for instance, an investment in brand capital. In itself, it does not guarantee uptake of brand equity; a company needs to consider whether it is engaging with clients in a personalized and relevant way and whether it is reaching customers through the right channels. A useful parallel is the burst of ICT spending in the early 2000s. In the United States, productivity grew rapidly, from 1.5 percent a year in 1970–1995 to 2.5 percent in 1995–2005. The productivity surge was possible because of widespread investment in, and adoption of, ICT that was accompanied by a transformation in the way companies organized functions and tasks, how their workers used technology, and how they operated, including across their supply chains.
The combination of high investment and effective deployment is the major differentiator between top growers and low growers. All companies understand that data and analytics are not just buzzwords, but capabilities that need to be mastered to survive and thrive in highly competitive markets. They know, too, that talent is not simply an input but a necessary investment that, together with creativity and audacity, enables companies to deliver on innovation. There appears to be widespread acknowledgement that companies’ role is not simply to create profit for stakeholders but to benefit society. But top growers take the deployment of intangible capital to the next level and display a detailed understanding of how intangibles can be used to develop the capabilities that are most likely to deliver on growth. Most companies agree that more investment in intangibles is key, but the survey asked what else can be done to fully reap the benefits of investment. Asked to be precise about what delivers disproportionate returns, respondents cite specific use cases, rigorous processes, data-driven decision making, and, broadly, using intangibles investment to embed data, talent, innovation, and purpose in day-to-day operations (Exhibit 14).
Looking at the survey results in more detail, there is considerable agreement among top and low growers across sectors that intangible capabilities are key to delivering growth and competitiveness. In the survey, about 24 percent of both top and low growers strongly agreed that digital and analytics capital is crucial for building a sustainable competitive advantage, and this finding holds across sectors—from telecommunications, media, and technology, where data have been a valuable asset for building ecosystems, to advanced manufacturing as more players digitize their supply chains. About 30 percent of survey respondents, among both top and low growers, strongly agreed that brand capital is a winning value proposition when combined with a clear purpose and mission statement. In the case of innovation capital, about 27 percent of top growers and approximately 23 percent of low growers strongly agreed with the statement that creativity and audacity and taking into account the voice of the customer are central to mastering this category of intangibles investment.
In the survey, human and relational capital has two subcategories: organizational and managerial capital, and ecosystems and networks. Both exhibit considerable common ground between top growers and low growers. In the case of organizational and managerial capital, both top and low growers stress the importance of a strategy and an environment that enables them to attract talent and have in place a robust talent strategy to sustain critical capabilities. On ecosystems and networks, 23 percent of both categories of companies strongly agree that growth strategy and vision translated into a clear road map with owners is important, and about 30 percent of top and low growers concur strongly with the need to have a clear purpose and mission statement.
Looking through a different lens—the type of intangible asset—a clear picture of higher growth driven by effective deployment and use of intangibles emerges (Exhibit 15).
22 McKinsey Global Institute
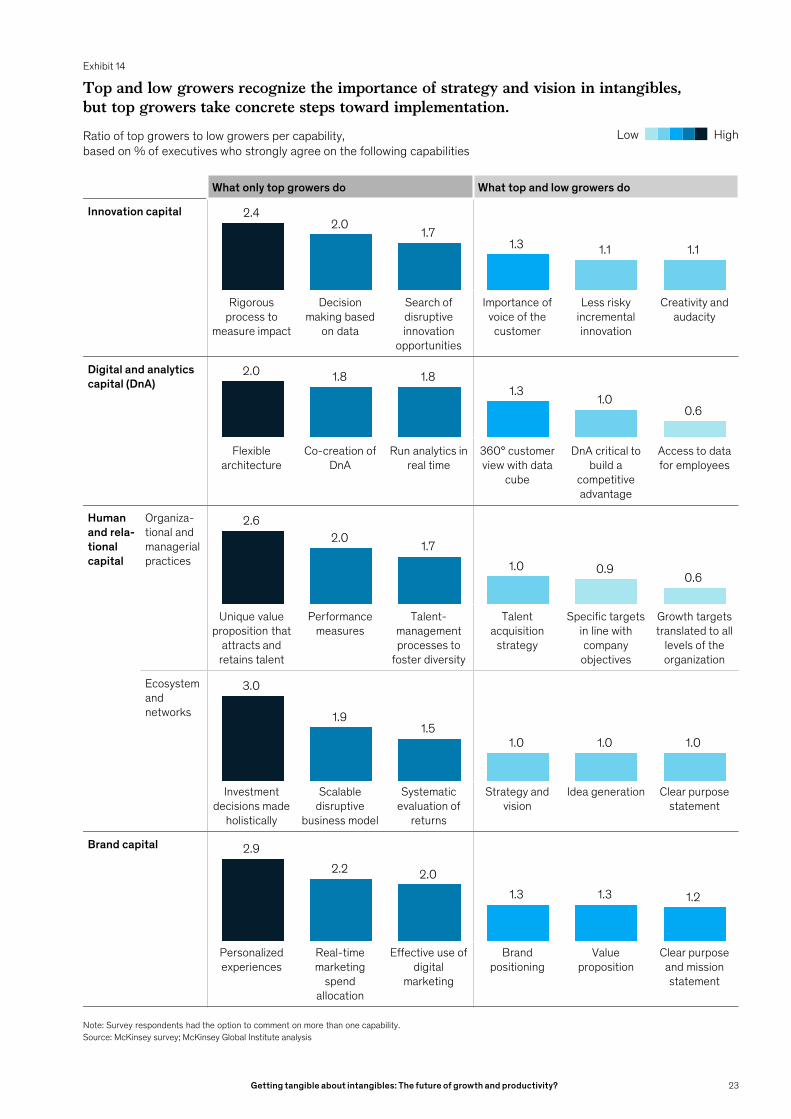
Exhibit 14
What only top growers do What top and low growers do
Innovation capital
Rigorous process to
measure impact
Decision making based
on data
Search of disruptive innovation
opportunities
Importance of voice of the customer
Less risky incremental innovation
Creativity and audacity
Digital and analytics capital (DnA)
Flexible architecture
Co-creation of DnA
Run analytics in real time
360° customer view with data
cube
DnA critical to build a
competitive advantage
Access to data for employees
Human and rela-tionalcapital
Organiza-tional and managerial practices
Unique value proposition that
attracts and retains talent
Performance measures
Talent-management processes to
foster diversity
Talent acquisition
strategy
Specific targets in line with company objectives
Growth targets translated to all
levels of the organization
Ecosystem and networks
Investment decisions made
holistically
Scalable disruptive
business model
Systematic evaluation of
returns
Strategy and vision
Idea generation Clear purpose statement
Brand capital
Personalized experiences
Real-time marketing
spend allocation
Effective use of digital
marketing
Brand positioning
Value proposition
Clear purpose and mission statement
Top and low growers recognize the importance of strategy and vision in intangibles, but top growers take concrete steps toward implementation.
Source: McKinsey survey; McKinsey Global Institute analysis
Ratio of top growers to low growers per capability, based on % of executives who strongly agree on the following capabilities
HighLow
2.4 2.0
1.7 1.3 1.1 1.1
2.0 1.8 1.8 1.3
1.0 0.6
2.6 2.0
1.7 1.0 0.9
0.6
3.0
1.9 1.5
1.0 1.0 1.0
2.9 2.2 2.0
1.3 1.3 1.2
Note: Survey respondents had the option to comment on more than one capability.
23Getting tangible about intangibles: The future of growth and productivity?
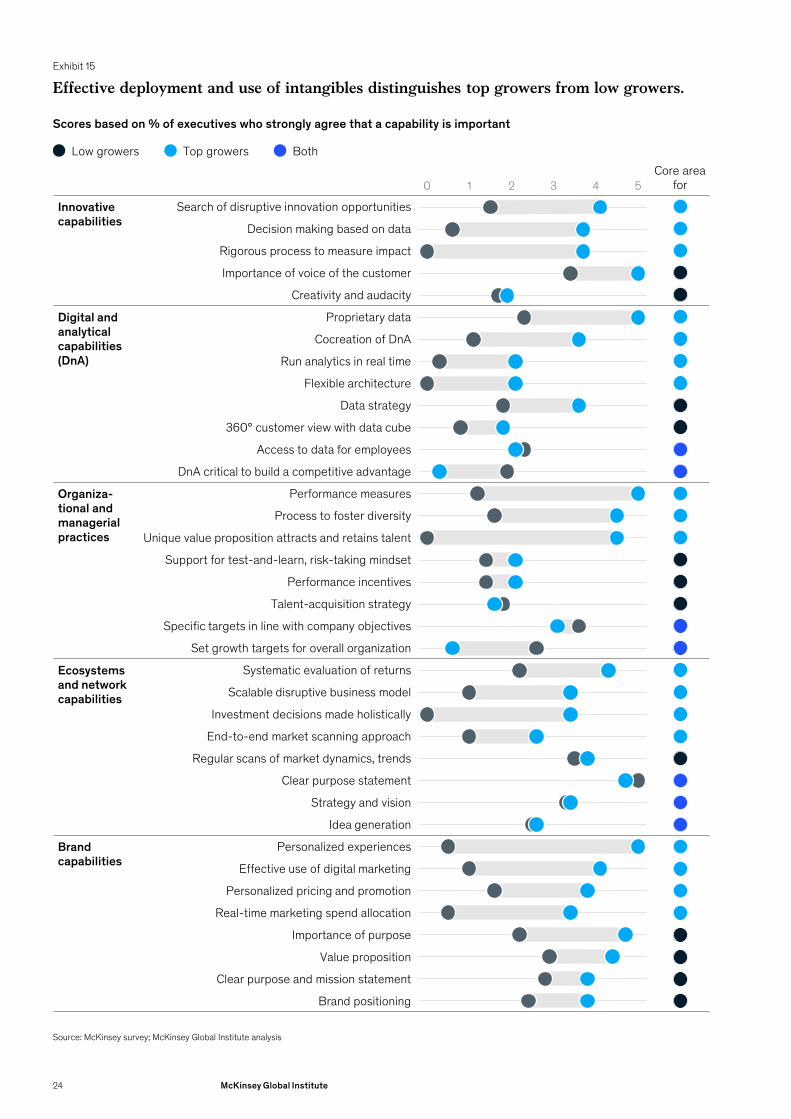
Exhibit 15
410 2 3 5
Source: McKinsey survey; McKinsey Global Institute analysis
Effective deployment and use of intangibles distinguishes top growers from low growers.
Scores based on % of executives who strongly agree that a capability is important
Top growersLow growers BothCore area
for
Innovative capabilities
Search of disruptive innovation opportunities
Decision making based on data
Rigorous process to measure impact
Importance of voice of the customer
Creativity and audacity
Digital and analytical capabilities (DnA)
Proprietary data
Cocreation of DnA
Run analytics in real time
Flexible architecture
Data strategy
360° customer view with data cube
Access to data for employees
DnA critical to build a competitive advantage
Organiza-tional and managerial practices
Performance measures
Process to foster diversity
Unique value proposition attracts and retains talent
Support for test-and-learn, risk-taking mindset
Performance incentives
Talent-acquisition strategy
Specific targets in line with company objectives
Set growth targets for overall organization
Ecosystems and network capabilities
Systematic evaluation of returns
Scalable disruptive business model
Investment decisions made holistically
End-to-end market scanning approach
Regular scans of market dynamics, trends
Clear purpose statement
Strategy and vision
Idea generation
Brand capabilities
Personalized experiences
Effective use of digital marketing
Personalized pricing and promotion
Real-time marketing spend allocation
Importance of purpose
Value proposition
Clear purpose and mission statement
Brand positioning
24 McKinsey Global Institute
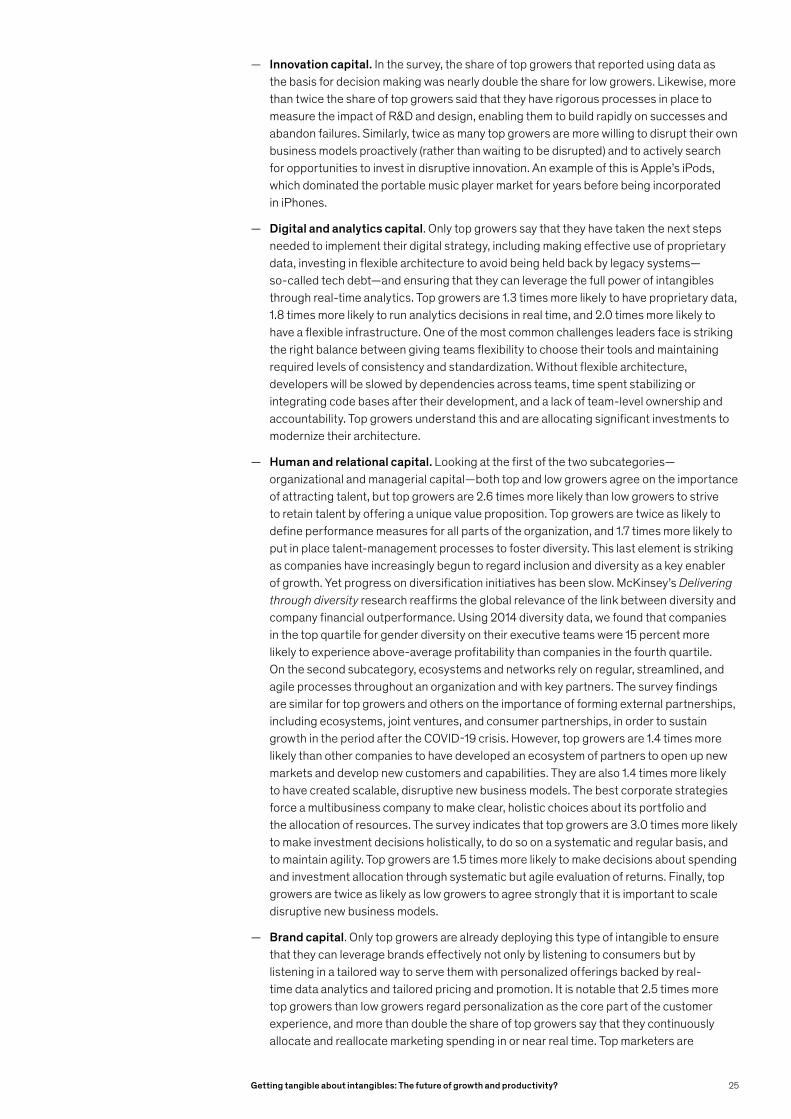
— Innovation capital. In the survey, the share of top growers that reported using data as the basis for decision making was nearly double the share for low growers. Likewise, more than twice the share of top growers said that they have rigorous processes in place to measure the impact of R&D and design, enabling them to build rapidly on successes and abandon failures. Similarly, twice as many top growers are more willing to disrupt their own business models proactively (rather than waiting to be disrupted) and to actively search for opportunities to invest in disruptive innovation. An example of this is Apple’s iPods, which dominated the portable music player market for years before being incorporated in iPhones.
— Digital and analytics capital. Only top growers say that they have taken the next steps needed to implement their digital strategy, including making effective use of proprietary data, investing in flexible architecture to avoid being held back by legacy systems—so-called tech debt—and ensuring that they can leverage the full power of intangibles through real-time analytics. Top growers are 1.3 times more likely to have proprietary data, 1.8 times more likely to run analytics decisions in real time, and 2.0 times more likely to have a flexible infrastructure. One of the most common challenges leaders face is striking the right balance between giving teams flexibility to choose their tools and maintaining required levels of consistency and standardization. Without flexible architecture, developers will be slowed by dependencies across teams, time spent stabilizing or integrating code bases after their development, and a lack of team-level ownership and accountability. Top growers understand this and are allocating significant investments to modernize their architecture.
— Human and relational capital. Looking at the first of the two subcategories—organizational and managerial capital—both top and low growers agree on the importance of attracting talent, but top growers are 2.6 times more likely than low growers to strive to retain talent by offering a unique value proposition. Top growers are twice as likely to define performance measures for all parts of the organization, and 1.7 times more likely to put in place talent-management processes to foster diversity. This last element is striking as companies have increasingly begun to regard inclusion and diversity as a key enabler of growth. Yet progress on diversification initiatives has been slow. McKinsey’s Delivering through diversity research reaffirms the global relevance of the link between diversity and company financial outperformance. Using 2014 diversity data, we found that companies in the top quartile for gender diversity on their executive teams were 15 percent more likely to experience above-average profitability than companies in the fourth quartile. On the second subcategory, ecosystems and networks rely on regular, streamlined, and agile processes throughout an organization and with key partners. The survey findings are similar for top growers and others on the importance of forming external partnerships, including ecosystems, joint ventures, and consumer partnerships, in order to sustain growth in the period after the COVID‑19 crisis. However, top growers are 1.4 times more likely than other companies to have developed an ecosystem of partners to open up new markets and develop new customers and capabilities. They are also 1.4 times more likely to have created scalable, disruptive new business models. The best corporate strategies force a multibusiness company to make clear, holistic choices about its portfolio and the allocation of resources. The survey indicates that top growers are 3.0 times more likely to make investment decisions holistically, to do so on a systematic and regular basis, and to maintain agility. Top growers are 1.5 times more likely to make decisions about spending and investment allocation through systematic but agile evaluation of returns. Finally, top growers are twice as likely as low growers to agree strongly that it is important to scale disruptive new business models.
— Brand capital. Only top growers are already deploying this type of intangible to ensure that they can leverage brands effectively not only by listening to consumers but by listening in a tailored way to serve them with personalized offerings backed by real-time data analytics and tailored pricing and promotion. It is notable that 2.5 times more top growers than low growers regard personalization as the core part of the customer experience, and more than double the share of top growers say that they continuously allocate and reallocate marketing spending in or near real time. Top marketers are
25Getting tangible about intangibles: The future of growth and productivity?

developing systems that can pool and analyze structured and unstructured data, algorithms that can identify behavioral patterns and customer propensity, and analysis capabilities to feed that information into dashboards. Their customer data platforms can connect a single customer across devices, cookies, and ad networks and can enable real-time campaign execution across touchpoints and channels. In short, top growers are using their digital and analytics capabilities to market their brand capital.
It is important to appreciate that the experience thus far of top growers and the findings in this paper offer a current picture. However, deploying intangibles is a moving target. It is already clear that success comes from investing in intangibles, but arguably less well appreciated is that deploying these investments is not a static process but a dynamic one. As businesses invest, they should continually assess not only what is key to success today but what areas they may need to prioritize for growth in the future. Continuous reexamination of the types of intangibles that are most likely to deliver on competitiveness and growth, that can be scaled, and that are most likely to deliver synergies that may create value in other areas of the learning economy will require a high level of visibility. Companies should consider setting up a control tower that monitors the skills the organization needs, what IP will deliver the next slice of competitive advantage, and what area innovation capital should focus on.
Huge value is at stake, and executives and policy makers should ask themselves what it will take to realize the intangibles opportunity Huge additional value could be created by investing in intangibles and deploying them effectively. As a thought exercise, consider the potential value that could be created if 10 percent more companies were to attain the share of intangibles investment, and the GVA growth, of top growers. This could produce an additional $1 trillion in GVA or a 2.7 percent increase across sectors in OECD economies. If more companies could capture more of the productivity- and growth-driving power of intangibles, these assets could play a major role in the bounce-back of companies and economies from the COVID‑19 crisis.
As the correlation between investment in, and deployment of, intangibles and GVA growth becomes ever clearer, executives—and governments—searching for sources of growth should arguably pay more attention to the full range of these types of assets. The formula that top growers have apparently hit upon may help other businesses understand the best way to invest in intangibles and deploy them, and help policy makers to put in place the right kinds of enabling infrastructure.
For companies, execution is key. Top growers not only invest 2.6 times more in intangibles than low growers and invest in the four major types of intangible capital, they also deploy them effectively with a focus on embedding intangibles in day-to-day business operations to achieve returns. Low growers should consider investing in the following categories:
— Innovation capital. Ideas and creativity matter, but rigorous processes and decision making based on data are necessary to ensure the effective implementation of creative and disruptive ideas.
— Digital and analytics capital. Having a flexible technology architecture is a must in order to rapidly process proprietary or external data and deliver real-time analytics. These capabilities unlock other intangible capital benefits and create synergies between them.
— Human and relational capital. Top growers not only attract but also retain talent by offering an unrivaled environment and a unique value proposition. To bring their strategy to the next level, they master process making holistically and build scalable business models that enhance their leadership position across markets.
— Brand capital. Digital marketing skills are not sufficient to achieve outstanding performance. High performers distinguish themselves by integrating personalized experiences into customer journeys, reallocating their marketing spend in real time, and using data and analytics capabilities.
26 McKinsey Global Institute

Mindset matters. Investing in intangibles is different from investing in tangibles. Take a supermarket as an example. Investing in a new store is fairly straightforward for a retailer, with relatively certain prospects for sales. However, the sales boost from investing in, say, a real-time promotion platform is less certain. In the worst-case scenario, the property may be resold, but an investment in software may not be recovered. This illustrates why investing in intangibles requires a mindset shift toward the test-and-learn, risk-taking approach that is more typical of top growers than low growers. In the survey, 70 percent of top growers agreed with the statement “in order to achieve above market growth, you need to pivot to a mostly test-and-learn, agile culture,” compared with 60 percent of low growers. Similarly, about 60 percent of top growers versus about 50 percent of low growers agreed that it was important to “cultivate an environment to take risks, test and learn, and embrace failures.” That difference in mindset has led to higher investment. Top growers that strongly agree with these statements invest 1.2 times more in intangibles than those that don’t agree. Investing in intangibles is not about their availability but instead is an active choice that can lead to superior growth performance.
As the intangible, digitized economy spreads, the imperative to reskill—within companies, and more broadly in society—becomes even more urgent. Digitization, automation, and the deployment of intangibles appears to have accelerated as leading companies responded to the pressures of the COVID‑19 pandemic. Recent MGI research found that some firms—notably large firms that had already outperformed others before the pandemic—shifted rapidly to online channels and automated production tasks.35 Companies digitized many activities 20 to 25 times faster than they had previously thought possible. A December 2020 McKinsey Global Economic Conditions survey of executives found that about 75 percent of respondents in North America and Europe said they expected investment in new technologies, including automation, to accelerate in 2020–24, up from 55 percent who said they increased such investment in 2014–19. This could put more pressure on low-skill workers who are disproportionately susceptible to displacement by automation. Because of the pandemic, MGI estimates that in the United States alone an additional 5 percent of workers could be displaced due to automation by 2030, on top of the 22 percent forecast before the pandemic. That corresponds to an additional eight million workers affected by automation. The estimated number of additional displaced workers due to COVID‑19 is between 500,000 and one million each for France, Germany, and Spain.36 These millions of displaced workers, coupled with the risk of high-performing firms pulling even further ahead, could be a recipe for rising inequality between the high- and low-skilled. Significant retraining programs are needed to help support incomes and mitigate widening gaps between workers.
The shift from tangible to intangible assets increases the need for knowledge infrastructure. Policy makers will need to focus on facilitating knowledge infrastructure, including education, as well as communications technology including the internet, urban planning, and public science spending. Increasingly important will be digital infrastructure to store and manage data, the technology needed to support high-speed connectivity to transport data, and powerful high-performance computers to process data. This infrastructure will fully unlock the value of big data and foster scientific and technological innovation that enables firms to achieve their digital and innovation objectives. Because intangibles generate spillovers, a cluster-based approach to developing knowledge infrastructure may be an effective way to enable synergies. It is notable that the rise of intangibles does not mean that physical infrastructure is obsolete. The skilled people who work in this sphere and whose talent is required to unlock its potential still need places to live, high-quality transportation infrastructure, hospitals, and schools, for instance. And, as in any business cluster, people need to be able to network and interact with one another; that means well-run cities.
How the intangible economy develops will also depend on the institutional infrastructure, including effective IP law that strikes the right balance between protecting firms that have invested heavily in their IP and ensuring that this protection is not so broad or overly strong
35 Will productivity and growth return after the COVID‑19 crisis? McKinsey Global Institute, March 2021, on McKinsey.com. 36 The future of work after COVID‑19, McKinsey Global Institute, February 2021, on McKinsey.com.
27Getting tangible about intangibles: The future of growth and productivity?

that the synergies, scale, and competition that deliver growth are constricted. Another key requirement needed to make the most of this opportunity is ensuring effective coordination of large intangibles projects that may involve many investors and firms over long time frames.
The evidence is stacking up in an age increasingly driven by innovation and knowledge that firms and sectors that invest most heavily in intangibles are reinforcing and deepening their competitive advantage and achieving the highest rates of growth in gross value added. The full potential of these game-changing assets will not be realized unless companies are smart about how they deploy them to create synergies and scale and to enhance a range of capabilities that can deliver on growth. This paper has focused on an exploration of the link between investment in intangible assets and economic growth and, digging deeper, on which corporate approaches are already proving to be most successful for optimizing this investment. The role of intangibles in the growing knowledge economy is a multifaceted, complex topic that requires the attention not only of executives but also of policy makers if firms and economies are to make the most of them.
28 McKinsey Global Institute
Technical appendix
This appendix provides details on the data sources and methodology used in this research in the following sections:
1. Data sources
2. Sector definitions
3. Determining investments in intangibles
4. Determining investments in different intangible categories
5. Determining top growers and low growers
6. Analyzing capabilities
1. Data sourcesFor this analysis, we used the following data sources.
— INTAN-Invest database. Use of this database helped us to perform analyses on a macro level, that is, on sectors and countries.
— Proprietary survey. The survey was conducted in March 2021 in 16 countries in three regions covering 21 sectors. Of the 861 respondents, nearly 80 percent were C-suite executives. Of the companies represented, two-thirds had revenue of $500 million or more, and just over half had revenue of $1 billion or more. The main analyses were performed for the most important sectors by size of GVA, and we ensured that these sectors were represented in the survey. Of the 861 respondents, 20 percent were in advanced manufacturing; 16 percent in telecommunications, media, and technology; 14 percent in retail trade; 13 percent in financial services; and 6 percent in energy and utilities. For our analyses, we used the responses of 591 of those surveyed, eliminating outliers who reported extraordinarily high investment in intangibles or responded “I don’t know” to more than two questions.
— The survey results also enabled us to undertake analyses of approaches to intangibles at the firm level.
— Additional database. For data on gross GVA, we used statistics from the EU KLEMS database.
2. Sector definitionsThe definitions of sectors used in this research differ somewhat from those in the INTAN-Invest database. In the case of financial services, this research does not include insurance, as INTAN‑Invest does. In telecommunications, media, and technology, the research includes high tech, media, entertainment, and telecommunications; INTAN‑Invest includes information, communication, entertainment, and recreation. In the case of retail trade, the research includes retail only, but INTAN‑Invest adds wholesale and vehicle repair. The definition of advanced industries is much broader than that of INTAN‑Invest, which includes only manufacturing; in this research, advanced industries includes advanced electronics, automotive and assembly, and aerospace and defense. INTAN‑Invest’s definition of energy and materials includes only utilities and mining; this research includes electric power and natural gas, metals and mining, and oil and gas.
29Getting tangible about intangibles: The future of growth and productivity?
3. Determining investments in intangibles The INTAN‑Invest database (intaninvest.net) is a harmonized (open access) database on macroeconomic intangibles in a selection of countries, which complements the work of the INNODRIVE and COINVEST projects. Updating of the database is undertaken through the voluntary cooperation of academic project partners.37
In the scope of this analysis were Austria, Denmark, Finland, France, Germany, Italy, the Netherlands, Spain, Sweden, the United Kingdom, and the United States. We used the INTAN‑Invest database for 1995 to 2015. For 2016 to 2019, we extrapolated data based on the average growth rate between 2010 and 2015 for each sector and country. We supplemented the INTAN‑Invest data with gross value added data from EU KLEMS. To equalize the purchasing power of different currencies, we converted all absolute data into 2010 dollars at purchasing power parity.
In the survey, we asked executives how much their organization invested in different predefined intangible categories and summed these findings to give us the overall level of investment in intangibles, which we analyzed as a percentage of revenue.
4. Determining investments in different intangible categoriesWe analyzed four types of intangibles: innovation capital, digital and analytics capital, human and relational capital, and brand capital. To calculate levels of investment, we used the following intangible categories from INTAN‑Invest (see Box A1, “INTAN‑Invest intangibles categories”).
— For innovation capital, we considered R&D, design, entertainment and artistic originals, and mineral exploration as well as new product development in the finance industry categories.
— For digital and analytics capital, we considered the computerized software and databases categories.
— For human and relational capital, we considered the organizational and managerial capital and training categories.
— For brand capital, we considered the brand category.
The proprietary survey asked executives how much their companies invest in:
— Innovation, for example, activities related to R&D and developing trademarks, copyrights, licenses, patents, designs, and artistic originals.
— Digital and analytics, for example, activities related to development and maintenance of digital platforms, analytics models and algorithms, data and databases, proprietary software, and spending on third-party software.
— Organizational and managerial capital, for example, activities related to developing and improving organization reputation, and workforce quality, including training and skills, and management process and practices.
— Ecosystems and networks, for example, activities related to developing and improving privileged relationships, partnerships, and networks, and to assessing and developing geographic footprints.
— Brand, for example, activities related to developing and improving brand equity, customer insights, customer base, customer loyalty, and content.
Investments in different intangible categories were systematically analyzed as percentages of revenue.
37 For the underlying assumptions for calculating these data and the corresponding challenges, see Carol Corrado, Jonathan Haskel, and Cecilia Jona-Lasinio, Intangible capital and growth in advanced economies: Measurement methods and comparative results, Institute of Labor Economics (IZA), discussion paper number 6733, July 2012.
30 McKinsey Global Institute

Box A1.
1 Service Annual Survey, US Census Bureau, census.gov.
INTAN-Invest intangibles categories
The INTAN‑Invest database includes the following detailed definitions of the four categories:
Innovation capital — R&D. This is mainly R&D in
the manufacturing, software publishing, and telecom industries. The US Census collects data on behalf of the National Science Foundation. Industrial R&D data are available from the early 1950s and cover work in the physical sciences, the biological sciences, and engineering and computer science (excluding geophysical, geological, artificial intelligence, and expert systems research).
— Design. This includes new architectural and engineering designs, estimated as half of industry purchased services; revenues of the industry come from the Service Annual Survey (SAS).1
— Entertainment and artistic originals. This is mainly R&D in information-sector industries (excluding software publishing). Broad statistical information is not available, and therefore this subcategory is proxied by development costs in the motion picture industry. Development costs in the radio and television, sound recording, and book publishing industries are crudely estimated to be double the new product development costs for motion pictures. No estimate for the arts is included.
— Mineral exploration. This is mainly R&D in mining industries. Data for mineral exploration come from
the Census of Mineral Industries and National Income and Product Accounts. Other geophysical and geological exploration R&D in mining industries is estimated from census data.
— New product development in the finance industry. This is mainly R&D in finance and other service industries. No broad statistical information is available, and therefore the proxy of new product development costs in financial services industries is used, crudely estimated as 20 percent of intermediate purchases. New architectural and engineering designs are estimated as half of industry purchased services (revenue of the industry as reported in the SAS). R&D in the social sciences and humanities is estimated as twice industry purchased services (revenue as reported in the SAS).
Digital and analytics capitalThis category covers computerized software and databases. Computer software covers expenses of software developed for a firm’s own use, calculated based on National Income and Product Accounts data that include three components: own use, purchased, and custom software. Computer databases for own use likely is captured in National Income and Product Accounts software measures; data from the SAS suggest that the purchased component is small.
Human and relational capital — Organizational capital. This
includes capital associated with
organizational structure such as the costs of organizational change and development, and expenses associated with company formation. No broad statistical information and no clear consensus on scope are available. Purchased “organizational” or “structural” capital are estimated using SAS data on the revenue of the management consulting industry. The own-account component is estimated as the value of executive time using US Bureau of Labor Statistics data on employment and wages in executive occupations.
— Training. This includes firm-specific human capital, including the costs of developing workforce skills related to, for instance, on-the-job training and tuition payments for job-related education. The Bureau of Labor Statistics conducted broad surveys of employer-provided training in 1994 and 1995. Direct firm expenses such as in-house trainers, outside trainers, tuition reimbursement, and outside training funds were included, as were wage and salary costs of employee time in formal and informal training.
Brand capital This category consists of brands, namely advertising expenditures and market research for the development of brands and trademarks; purchases of advertising services; and advertising expenditures. Outlays on market research are estimated as twice industry purchased services (revenue of the market and consumer research industry as reported in the SAS).
31Getting tangible about intangibles: The future of growth and productivity?

The proprietary survey asked executives how much their companies invest in:
— Innovation, for example, activities related to R&D and developing trademarks, copyrights, licenses, patents, designs, and artistic originals.
— Digital and analytics, for example, activities related to development and maintenance of digital platforms, analytics models and algorithms, data and databases, proprietary software, and spending on third-party software.
— Organizational and managerial capital, for example, activities related to developing and improving organization reputation, and workforce quality, including training and skills, and management process and practices.
— Ecosystems and networks, for example, activities related to developing and improving privileged relationships, partnerships, and networks, and to assessing and developing geographic footprints.
— Brand, for example, activities related to developing and improving brand equity, customer insights, customer base, customer loyalty, and content.
Investments in different intangible categories were systematically analyzed as percentages of revenue.
5. Determining top growers and low growers Using the survey results, we used the following definitions for each sector:
— Top growers were defined as the top 25 percent of companies in GVA growth in 2018–19.
— Low growers were defined as the bottom 50 percent of companies in GVA growth in 2018–19.38
Steady growers, which we do not highlight in the paper, are companies in the third quartile in GVA growth in 2018–19.
6. Analyzing capabilitiesIn the McKinsey survey, executives responded to a range of statements on each type of capability. For each capability, we selected top statements based on the percentage of respondents strongly agreeing with the statement among top growers and low growers (on a six-point scale). Based on these percentage shares of strong agreement, a score of zero to five was given to each statement in four groups of capabilities by type of intangible capital: innovation capital, digital and analytics capital, human and relational capital, and brand capital.
38 New McKinsey Global Institute research finds that between the periods 1994–96 and 2016–18, investment in intangible assets tripled while investment in tangible assets dropped by half as a proportion of revenue. This research takes a narrower view of corporate activity than this paper does, focusing only on about 5,000 public and private companies in the OECD with annual revenue of $1 billion or more. See Companies in the 21st century: A new look at how corporations impact the economy and households, McKinsey Global Institute, June 2021, on McKinsey.com.
32 McKinsey Global Institute
Acknowledgments
This paper is a collaboration between the McKinsey Global Institute (MGI) and McKinsey & Company’s marketing and sales, and digital and analytics teams.
This project benefited enormously from close collaboration with Jonathan Haskel, professor of economics at Imperial College Business School, and Stian Westlake, chief executive at the Royal Statistical Society, the coauthors of Capitalism without capital: The rise of the intangible economy (Princeton University Press. 2017). Special thanks go to Tera Allas, McKinsey director of research and economics in London, for her invaluable input.
The research was led by Eric Hazan, a McKinsey senior partner in Paris and a member of the MGI Council; Sven Smit, a McKinsey senior partner in Amsterdam and co-chair of MGI; Jonathan Woetzel, a McKinsey senior partner and a director of MGI in Shanghai and Los Angeles; Biljana Cvetanovski, a McKinsey partner in London; Mekala Krishnan, an MGI partner in Boston; Brian Gregg, a McKinsey senior partner in San Francisco; Jesko Perrey, a McKinsey senior partner in Düsseldorf; and Klemens Hjartar, a McKinsey senior partner in Copenhagen. The project team comprised Moira Borens, Cherry Chen, Phoebe FY Chen, Isabel Cordoba, Guillaume Dagorret, Valerie Ford, Armine Gstrein Hassanaly, Claire Gu, Orsi Jojart, Diana Khramina, Rebeca Kung, Tancrede Peronnet, Fleur Porter, Arushi Singh, Maria Sliwinska, Ana Rita Sousa, Zsofia Sveiczer, Marija Vukojevic, Justus Winkelmann, and Nils Wittman. We are grateful to James Manyika, a McKinsey senior partner in San Francisco and co-chair of MGI, for his guidance, and Kevin Russell, an MGI fellow in Charlotte, who collaborated with us on MGI’s work on 21st-century companies.
From MGI, we would like to thank Janet Bush, senior editor, who edited and produced this paper; Nienke Beuwer, EMEA director of communications; Vasudha Gupta, editorial production manager; Peter Gumbel, editorial director; Stephanie Strom, senior editor; Marisa Carder and Patrick White, design specialists; Lauren Meling, digital editor; Tim Beacom, research specialist; and Dennis Alexander of the MGI communication team. From McKinsey’s marketing and sales team, we thank Julie F. Hayes, Mianne Ortega, Christina Sheffield, Eric Sherman, Cindy Van Horne, and Kinga Young. We are also grateful to the many McKinsey colleagues who contributed their industry expertise and perspectives to this research: Kabir Ahuja, Michael Betz, Marco Catena, Joy Chen, Dianne Esber, Harald Fanderi, Lars Fiedler, Rock Khanna, Dieter Kiewell, Anna Koivuniemi, Karin Loeffler, Duncan Miller, Peter Saffert, Christina Sheffield, Dennis Spillecke, and Michael Viertler.
33Getting tangible about intangibles: The future of growth and productivity?

Related MGI and McKinsey Research
Superstars: The dynamics of firms, sectors, and cities leading the global economy (October 2018) This discussion paper assesses the extent to which a superstar effect can be observed in the global economy in three arenas—firms, sectors, and cities—and inspects the dynamics, including churn and changing characteristics, in each of these arenas.
Risk, resilience, and rebalancing in global value chains (August 2020) This report examines the potential risks in intricate production networks designed for efficiency, cost, and proximity to markets and looks at advances in technology that offer companies tools that preserve efficiency while enhancing resilience.
Tackling Europe’s gap in digital and AI (February 2019) This discussion paper analyzes what Europe could do to catch up with countries such as the United States and emerging leaders like China. The potential is quite large, amounting to trillions in additional GDP for Europe, and the continent already has more professional developers than the United States.
How Asia can boost growth through technological leapfrogging (December 2020) This discussion paper describes growth in major technological indicators, explores the characteristics of growth in technological capabilities and identifies opportunities where Asia could leapfrog ahead in capitalizing on technological innovation.
Will productivity and growth return after the COVID-19 crisis? (March 2021)This report examines the bold and innovative steps companies took to respond to the COVID‑19 pandemic and how spreading such rapid innovation more broadly could produce significant gains in productivity and economic growth.
Connected world: An evolution in connectivity beyond the 5G revolution (February 2020) This discussion paper takes a look beyond the connectivity being enabled by 5G to examine a broad range of connective technologies from fiber and satellites to Wi-Fi and short-range tools and how it could be deployed in healthcare, mobility, manufacturing, and retail to deliver economic benefits.
www.mckinsey.com/mgiDownload and listen to MGI podcasts on iTunes or at www.mckinsey.com/mgi/publications/multimedia/

McKinsey Global Institute June 2021 Copyright © McKinsey & Company Designed by the McKinsey Global Institute
www.mckinsey.com/mgi
@McKinsey_MGI @McKinseyGlobalInstitute @McKinseyGlobalInstitute
Subscribe to MGI’s podcast, Forward Thinking: mck.co/forwardthinking