
Getting Started with Visual Basic in Excel · Another Introduction to VBA programming. ... This is...
15
TIM-125/225: MOT II Supply Chain Management Getting Started with Visual Basic in Excel Prepared by: Rany Polany (2012) & Daniel Core (2009) UCSC, Baskin School of Engineering Table of Contents Visual Basic Related Questions ............................................................. 1 1 Where can I find useful Visual Basic tutorials? .............................................................. 1 2 How do I open the Visual Basic Editor in Excel? ............................................................... 1 3 How to I program in the Visual Basic Editor .................................................................. 1 4 How do I reference a cell in a workbook? ....................................................................... 2 5 How do I link a cell between two different Worksheets? ............................................... 2 6 How do I use Solver to perform an optimization? .......................................................... 3 Examples of Software from Previous Years ........................................ 4 1. Example: Simple High-level GUI Showing Modules Available to the User ................. 4 2. Example: Intermediate Demand Forecasting GUI Showing Inputs By the User ........ 5 3. Example: Output: Demand Forecasting .......................................................................... 6 4. Example: Alternative Output for Demand Forecasting ................................................. 7 5. Example: Advanced Main Level GUI .............................................................................. 8 6. Example: Advanced Data Entry Input for User ........................................................... 11 7. Example: Advanced Chart Output ................................................................................ 12 Additional Web References: ................................................................ 13
Transcript of Getting Started with Visual Basic in Excel · Another Introduction to VBA programming. ... This is...
TIM-125/225: MOT II Supply Chain Management
Getting Started with Visual Basic in Excel
Prepared by: Rany Polany (2012) & Daniel Core (2009)
UCSC, Baskin School of Engineering
Table of Contents
Visual Basic Related Questions ............................................................. 1
1 Where can I find useful Visual Basic tutorials? .............................................................. 1
2 How do I open the Visual Basic Editor in Excel? ............................................................... 1
3 How to I program in the Visual Basic Editor .................................................................. 1
4 How do I reference a cell in a workbook? ....................................................................... 2
5 How do I link a cell between two different Worksheets? ............................................... 2
6 How do I use Solver to perform an optimization? .......................................................... 3
Examples of Software from Previous Years ........................................ 4
1. Example: Simple High-level GUI Showing Modules Available to the User ................. 4
2. Example: Intermediate Demand Forecasting GUI Showing Inputs By the User ........ 5
3. Example: Output: Demand Forecasting .......................................................................... 6
4. Example: Alternative Output for Demand Forecasting ................................................. 7
5. Example: Advanced Main Level GUI .............................................................................. 8
6. Example: Advanced Data Entry Input for User ........................................................... 11
7. Example: Advanced Chart Output ................................................................................ 12
Additional Web References: ................................................................ 13
TIM-125/225: MOT II Supply Chain Management
Getting Started with Visual Basic in Excel
Page 1
Visual Basic Related Questions
1 Where can I find useful Visual Basic tutorials?
The tutorial below provide an elementary entry point, complete with pictures to the world of
Visual Basic. They demonstrate how macros are made of Subs, which are subroutines in the
program. If you are familiar with Java or C, this is similar to a Method.
Tutorial 1: Excel VBA Basic Tutorial 1
http://www.anthony-vba.kefra.com/vba/vbabasic1.htm
A very basic introduction that provides a good overview to using Visual Basic in Excel.
Tutorial 2: Programming In Excel VBA - An Introduction
http://www.jlathamsite.com/Teach/VBA/ProgrammingInExcelVBA_AnIntroduction.pdf
Another Introduction to VBA programming.
2 How do I open the Visual Basic Editor in Excel?
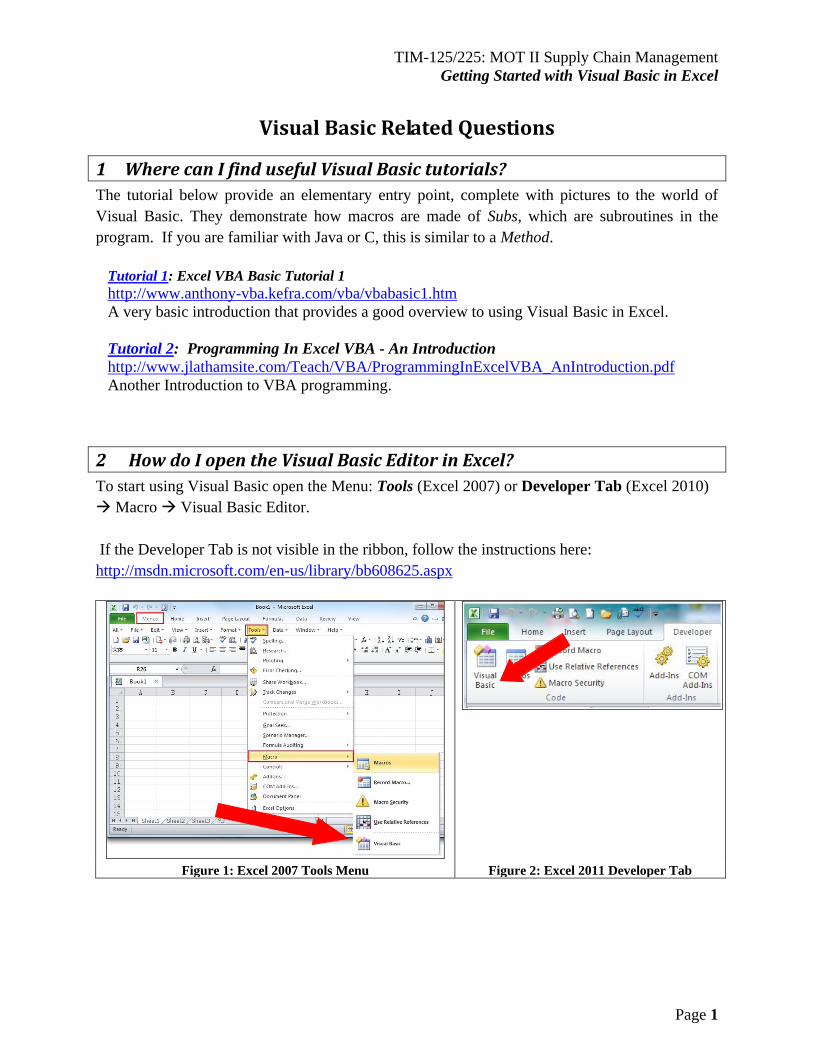
To start using Visual Basic open the Menu: Tools (Excel 2007) or Developer Tab (Excel 2010)
Macro Visual Basic Editor.
If the Developer Tab is not visible in the ribbon, follow the instructions here:
http://msdn.microsoft.com/en-us/library/bb608625.aspx
Figure 1: Excel 2007 Tools Menu Figure 2: Excel 2011 Developer Tab
TIM-125/225: MOT II Supply Chain Management
Getting Started with Visual Basic in Excel
Page 1
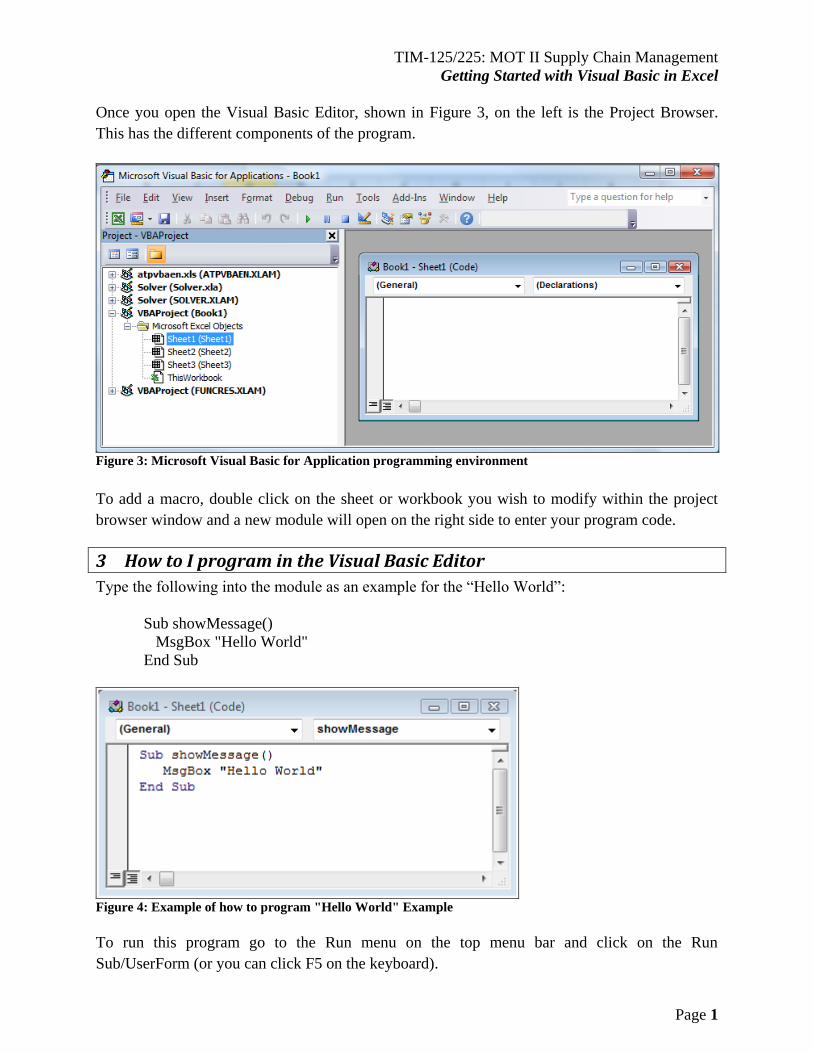
Once you open the Visual Basic Editor, shown in Figure 3, on the left is the Project Browser.
This has the different components of the program.
Figure 3: Microsoft Visual Basic for Application programming environment
To add a macro, double click on the sheet or workbook you wish to modify within the project
browser window and a new module will open on the right side to enter your program code.
3 How to I program in the Visual Basic Editor
Type the following into the module as an example for the “Hello World”:
Sub showMessage()
MsgBox "Hello World"
End Sub
Figure 4: Example of how to program "Hello World" Example
To run this program go to the Run menu on the top menu bar and click on the Run
Sub/UserForm (or you can click F5 on the keyboard).
TIM-125/225: MOT II Supply Chain Management
Getting Started with Visual Basic in Excel
Page 2
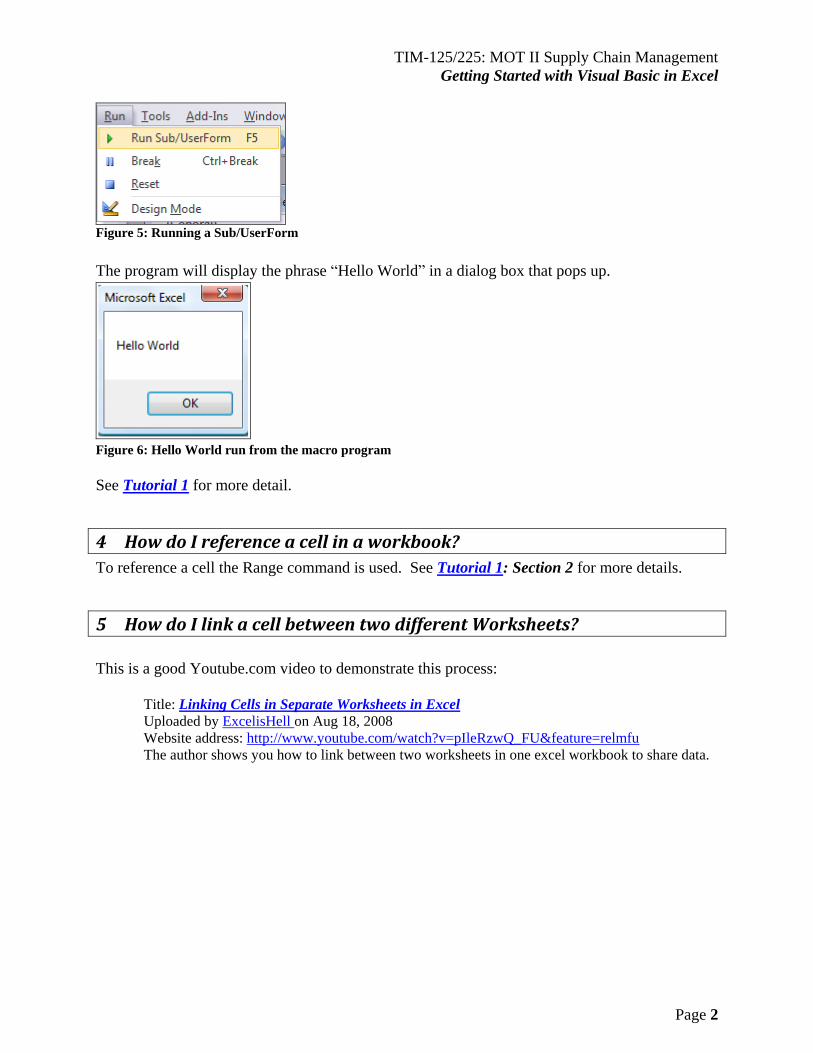
Figure 5: Running a Sub/UserForm
The program will display the phrase “Hello World” in a dialog box that pops up.
Figure 6: Hello World run from the macro program
See Tutorial 1 for more detail.
4 How do I reference a cell in a workbook?
To reference a cell the Range command is used. See Tutorial 1: Section 2 for more details.
5 How do I link a cell between two different Worksheets?
This is a good Youtube.com video to demonstrate this process:
Title: Linking Cells in Separate Worksheets in Excel
Uploaded by ExcelisHell on Aug 18, 2008
Website address: http://www.youtube.com/watch?v=pIleRzwQ_FU&feature=relmfu
The author shows you how to link between two worksheets in one excel workbook to share data.
TIM-125/225: MOT II Supply Chain Management
Getting Started with Visual Basic in Excel
Page 3
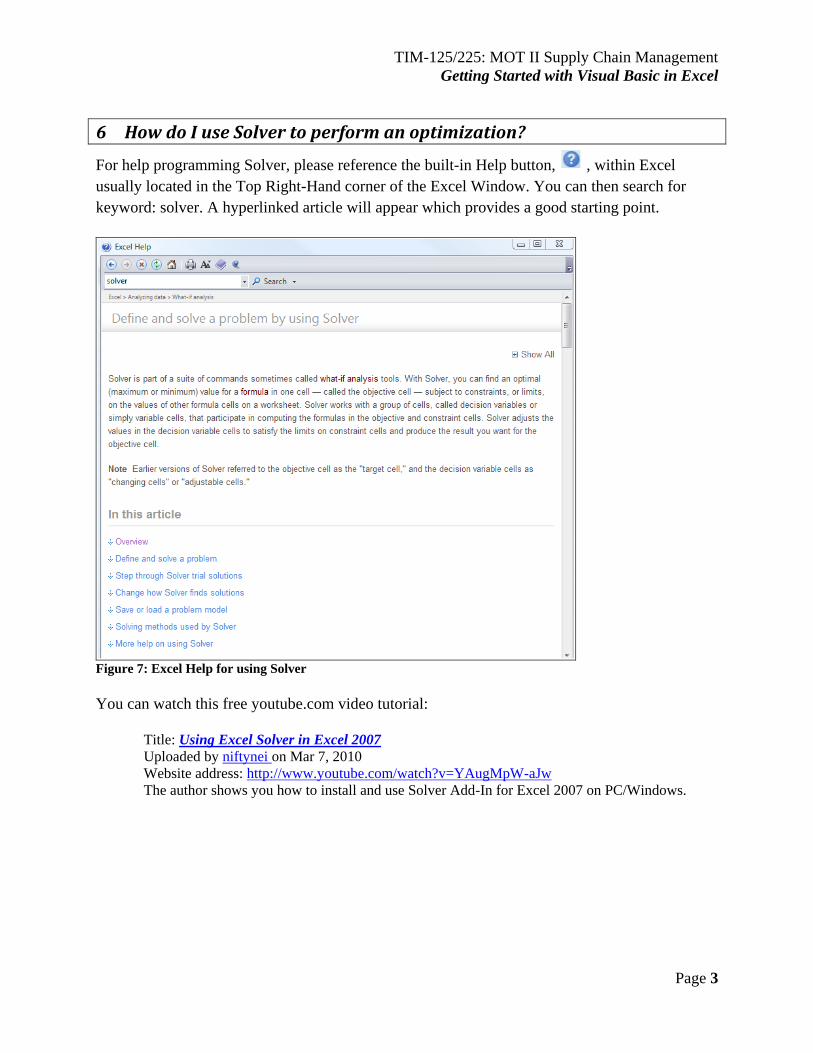
6 How do I use Solver to perform an optimization?
For help programming Solver, please reference the built-in Help button, , within Excel
usually located in the Top Right-Hand corner of the Excel Window. You can then search for
keyword: solver. A hyperlinked article will appear which provides a good starting point.
Figure 7: Excel Help for using Solver
You can watch this free youtube.com video tutorial:
Title: Using Excel Solver in Excel 2007
Uploaded by niftynei on Mar 7, 2010
Website address: http://www.youtube.com/watch?v=YAugMpW-aJw
The author shows you how to install and use Solver Add-In for Excel 2007 on PC/Windows.
TIM-125/225: MOT II Supply Chain Management
Getting Started with Visual Basic in Excel
Page 4
Examples of Software from Previous Years
Here are sample screenshots from SCM software that was created in previous years.
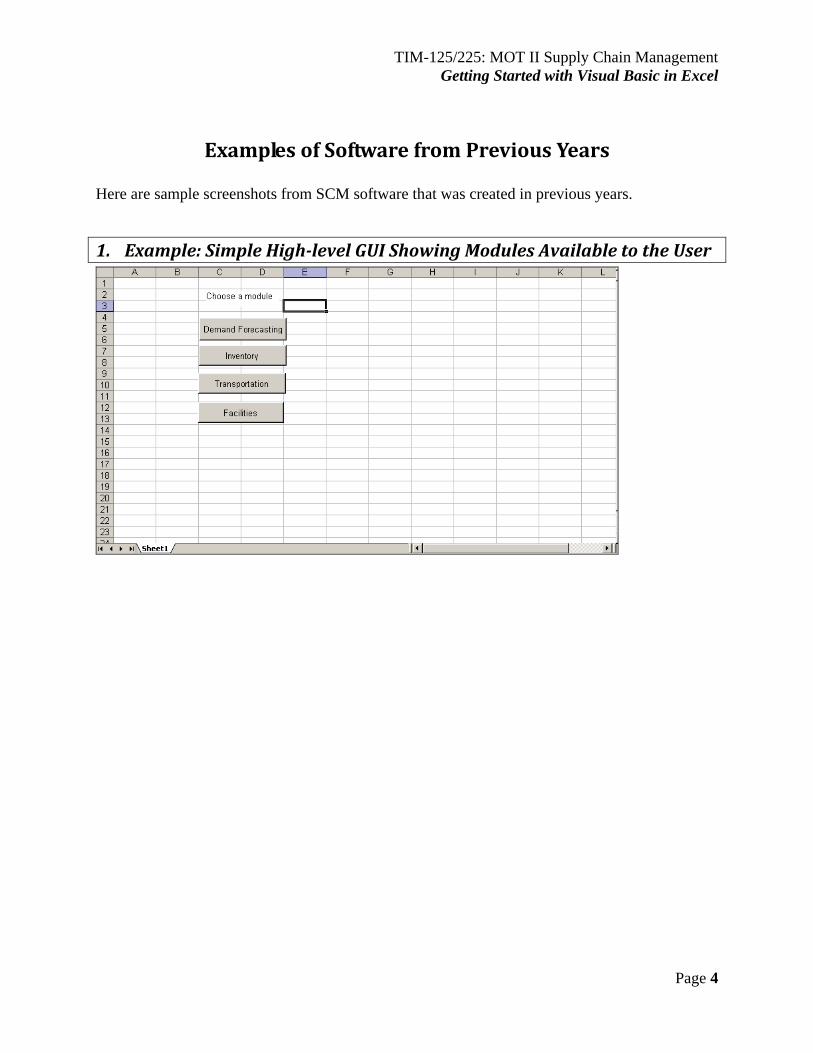
1. Example: Simple High-level GUI Showing Modules Available to the User
TIM-125/225: MOT II Supply Chain Management
Getting Started with Visual Basic in Excel
Page 5
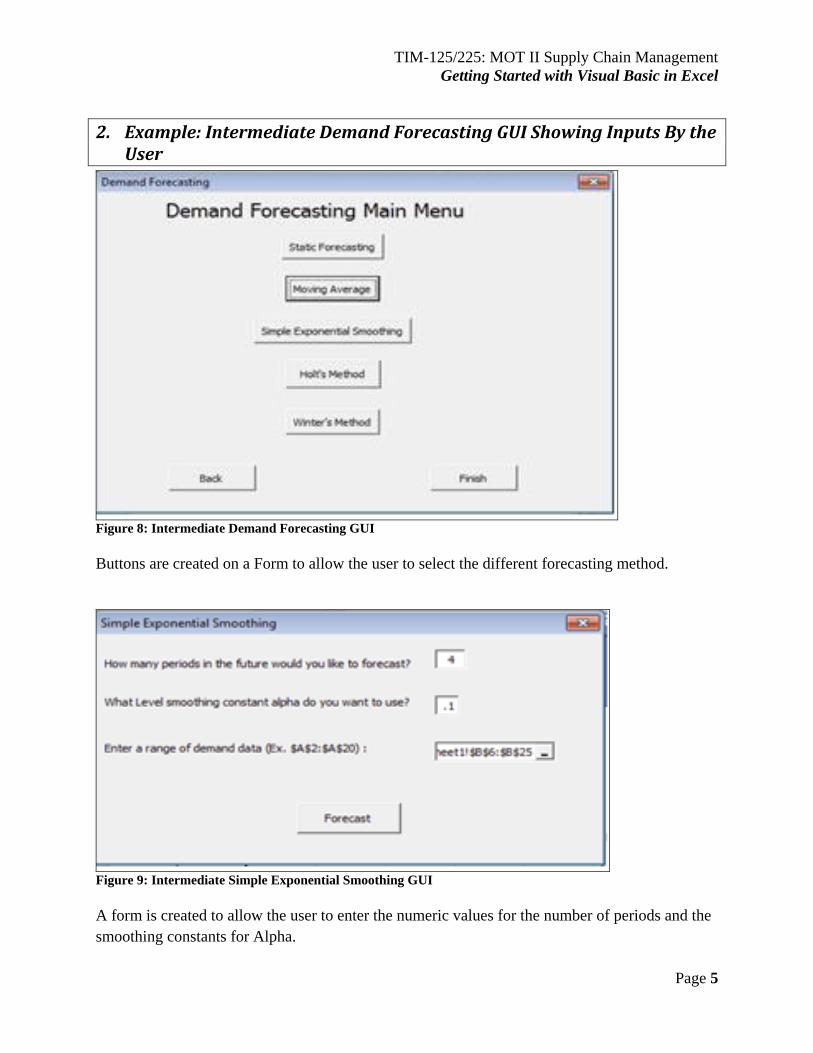
2. Example: Intermediate Demand Forecasting GUI Showing Inputs By the User
Figure 8: Intermediate Demand Forecasting GUI
Buttons are created on a Form to allow the user to select the different forecasting method.
Figure 9: Intermediate Simple Exponential Smoothing GUI
A form is created to allow the user to enter the numeric values for the number of periods and the
smoothing constants for Alpha.
TIM-125/225: MOT II Supply Chain Management
Getting Started with Visual Basic in Excel
Page 6
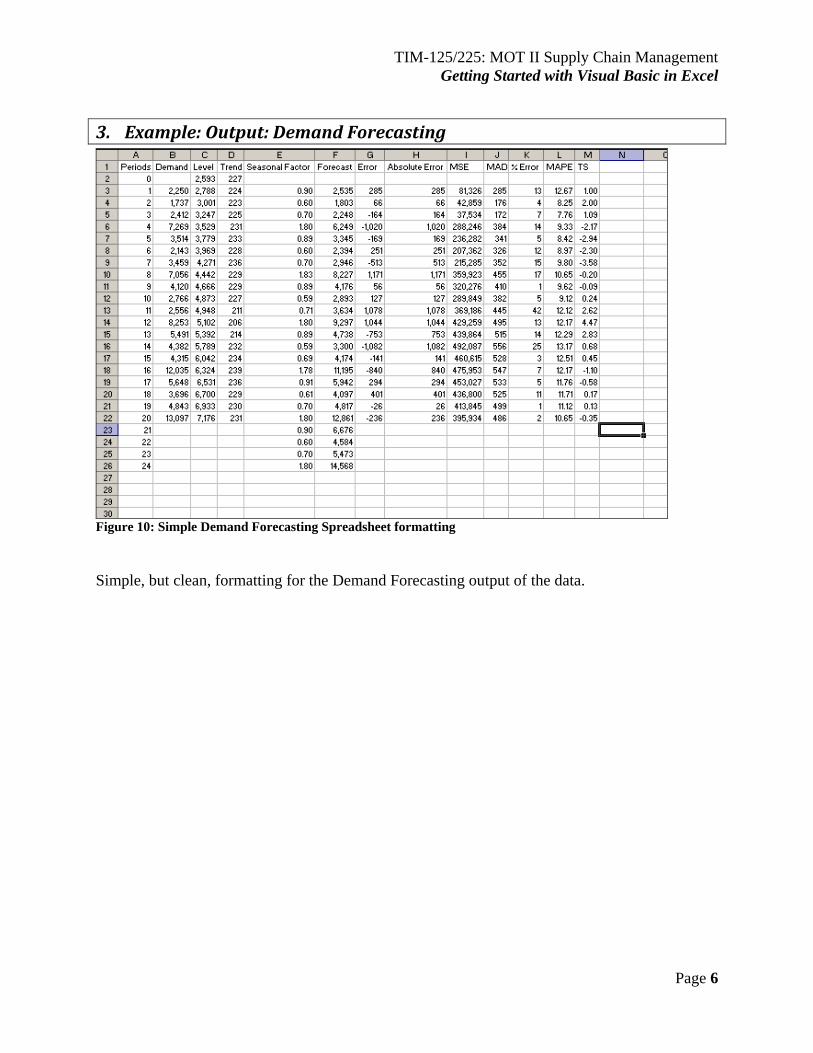
3. Example: Output: Demand Forecasting
Figure 10: Simple Demand Forecasting Spreadsheet formatting
Simple, but clean, formatting for the Demand Forecasting output of the data.
TIM-125/225: MOT II Supply Chain Management
Getting Started with Visual Basic in Excel
Page 7
4. Example: Alternative Output for Demand Forecasting
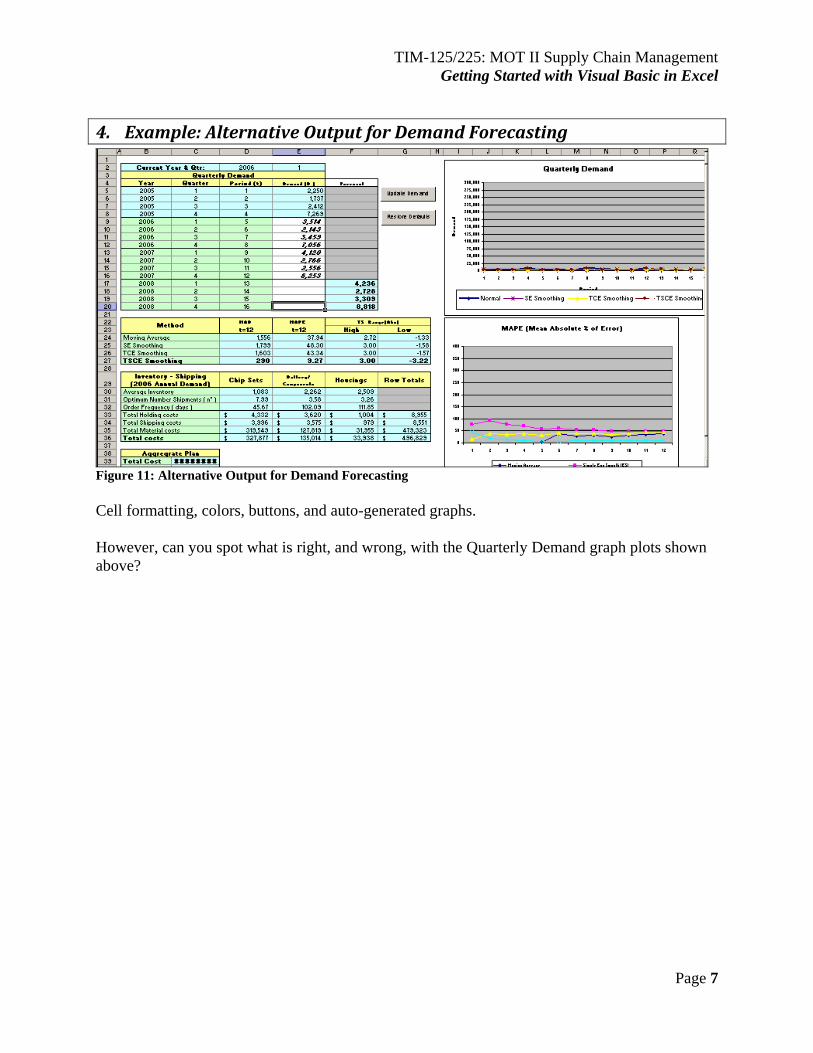
Figure 11: Alternative Output for Demand Forecasting
Cell formatting, colors, buttons, and auto-generated graphs.
However, can you spot what is right, and wrong, with the Quarterly Demand graph plots shown
above?
TIM-125/225: MOT II Supply Chain Management
Getting Started with Visual Basic in Excel
Page 8
5. Example: Advanced Main Level GUI
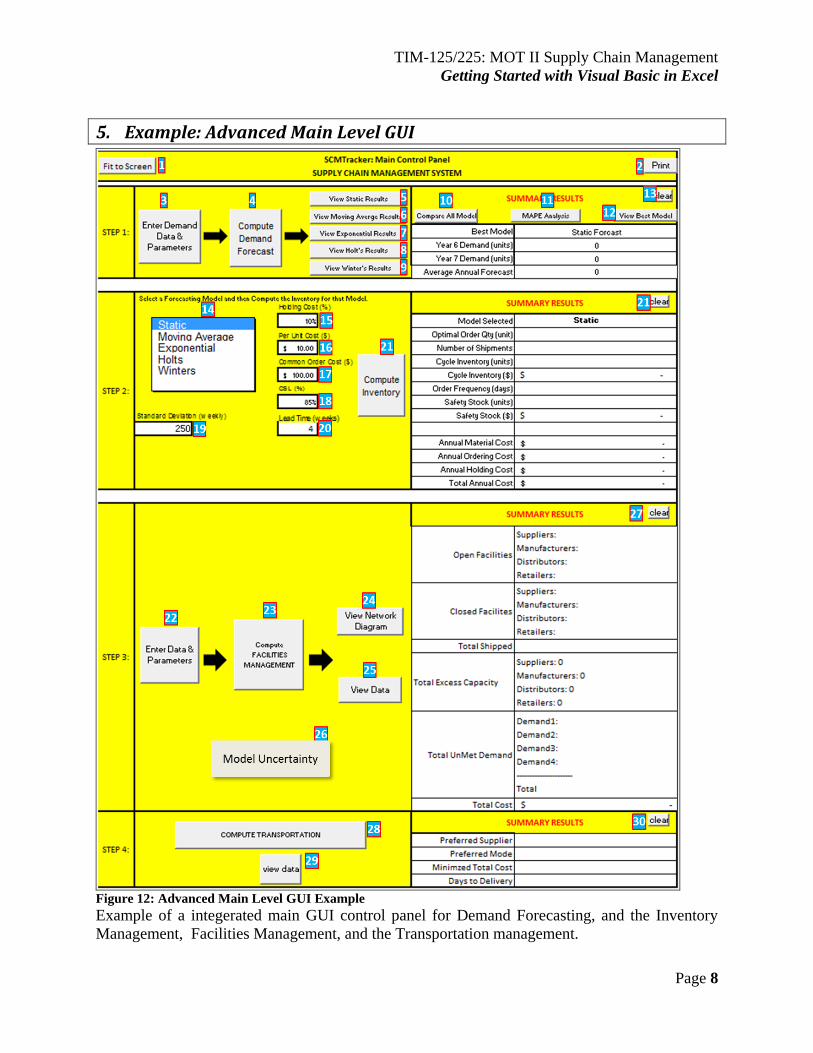
Figure 12: Advanced Main Level GUI Example
Example of a integerated main GUI control panel for Demand Forecasting, and the Inventory
Management, Facilities Management, and the Transportation management.
TIM-125/225: MOT II Supply Chain Management
Getting Started with Visual Basic in Excel
Page 9
BUTTON [1]: Upon Button click, the screen auto fits to the current maximize screen size.
BUTTON [2]: Upon Button Click, this button will print the entire Current Worksheet containing the results of the
STEP 1, 2, 3 and 4.
BUTTON [3]: Upon Button click, a screen will open to allow the user to enter 24 months of Monthly Demand Data
and the parameters of the Forecasting coefficients.
BUTTON [4]: Upon Button Click, the software will perform calculations based on the program code written. The
results will be displayed in the Summary Results to the right with the Best Model determined by the Month 24
MAPE. The resulting demand will be displayed for the best model presented.
BUTTON [5]: Upon Button Click, this group of buttons will open and display the actual Excel Worksheets for each
of the: Static. Each open sheet will also have an option to the return back to the MAIN or PRINT the selected sheet.
BUTTON [6]: Upon Button Click, this group of buttons will open and display the actual Excel Worksheets for each
of: Moving Average. Each open sheet will also have an option to the return back to the MAIN or PRINT.
BUTTON [7]: Upon Button Click, this group of buttons will open and display the actual Excel Worksheets for each
of the: Exponential. Each open sheet will also have an option to the return back to the MAIN or PRINT..
BUTTON [8]: Upon Button Click, this group of buttons will open and display the actual Excel Worksheets for each
of the: Holt. Each open sheet will also have an option to the return back to the MAIN or PRINT.
BUTTON [9]: Upon Button Click, this group of buttons will open and display the actual Excel Worksheets for each
of: Winter’s. Each open sheet will also have an option to the return back to the MAIN or PRINT.
BUTTON [10]: Upon Button Click, this button will open the MS Excel worksheet that displays a complete
summary of all the Forecasting techniques in one a page summary. On this opened sheet are available the option to
the return back to the MAIN or PRINT.
BUTTON [11]: Upon Button Click, this button will open the MS Excel worksheet that displays a complete
summary of all the Forecasting techniques in one a page summary.
BUTTON [12]: Upon Button Click, this button will open the MS Excel worksheet that has been determined to be
the Optimal (Best) based on the lowest MAPE comparison.
BUTTON [13]: Upon Button Click, this button will clear the current data in the Demand Summary Results
BUTTON [14]: This is a ListBox selector. Upon Click on each list item, the Model Selected will be updated in the
Summary Results: Model Selected cell. Though the Best Model has been calculated (STEP 1), this feature gives the
user the ability to choose different Forecasting methods and experiment with the Inventory Management results.
BUTTON [19]: This is a data entry cell for whole numbers. The data entry should be for the Standard Deviation of
the Weekly Demand. It is used to calculate the Safety Stock Inventory. Hit enter after typing in the value.
BUTTON [15]: This is a data entry cell for whole numbers in percentage format. The data entry should be the
Holding Cost in terms of a percentage value. Hit enter after typing in the value.
BUTTON [16]: This is a data entry cell for the Per Unit Cost in dollars. Enter a dollar value. Hit enter after typing in
the value.
BUTTON [17]: This is a data entry cell for the Common Order Cost ($) for each order. Enter a dollar value. Hit
enter after typing in the value.
BUTTON [18]: This is a data entry cell for the CSL (%). Enter a percentage to represented the service level needed.
Hit enter after typing in the value.
BUTTON [19]: This is a data entry cell for the Lead Time (weeks) Enter a whole number value. Hit enter after
typing in the value.
TIM-125/225: MOT II Supply Chain Management
Getting Started with Visual Basic in Excel
Page 10
BUTTON [20]: Upon Button Click, this button will compute all the variables based on the selected Forecasting
method for the Inventory Management and display the results in the Summary table. To change the results, change a
variable or choose a different an alternative forecasting method and click on Compute Inventory again.
BUTTON [21]: Upon Button Click, this button will clear the entire of Inventory Summary results
BUTTON [22]: Upon Button Click, this button will navigate to another worksheet to enter all the data and
parameters needed for the Facilities Design computations.
BUTTON [23]: Upon Button Click, this button will automate the computation of Facilities design utilizing Solver
Program for the optimization and will update the screen draw of the network.
BUTTON [24]: Upon Button Click, will open the with automatically generate a Network Design figure.
BUTTON [25]: Upon Button Click, this button will open the worksheet with the data results for the entire
optimization of the Facilities design..
BUTTON [26]: Upon Button Click, will launch Risk Solver Platform for Monte Carlo Simulation analysis
BUTTON [27]: Upon Button Click, this button will clear the entire of Facilities Summary results
BUTTON [28]: Upon Button Click, this button will compute optimal Transportation results.
BUTTON [29]: Upon Button Click, open the Transportation management
BUTTON [30]: Upon Button Click, this button will clear the Transportation Management results.
TIM-125/225: MOT II Supply Chain Management
Getting Started with Visual Basic in Excel
Page 11
6. Example: Advanced Data Entry Input for User
Year
Period
(Quarter) Demand
D1 EXPONENTIAL COFFIECIENTS
1 2350 alpha 0.10 10
2 1837
3 2512
4 7369 alpha 0.10 10
5 3614 beta 0.10 10
6 2243
7 3559
8 7156 alpha 0.10 10
9 4020 beta 0.10 10
10 2866 gamma 0.10 10
11 2656
12 8353
13 5591
14 4482
15 4415 1. Enter Monthly Demand (units)
16 12135
17 5748
18 3796
19 4943
20 13197
total 102842
average 5142.1
min 13197
max 1837
5
DEMAND ENTRY FORM AND PARAMETERS CONFIGURATION
HOLTS COEFFICIENTS
WINTERS COEFFICIENTS
3. Once complete, click Main button to return to Main window
1
2
3
4
2. Enter Coefficients for Adaptive Models (between 0 and 1)
INSTRUCTIONS:
0.00
20.00
40.00
60.00
80.00
100.00
120.00
140.00
160.00
MA
PE(
t)
Period (t)
Plot of the MAPEt (5-Year)
Holts Static Winters
Moving Average Exponential
0
2000
4000
6000
8000
10000
12000
14000
0 10 20 30
De
man
d (Q
ty)
Period (Qtrs)
Demand: Moving Average 5 Year Plot with 2 Year Forecast
Actual Demand Forecasted (Moving Average) Demand
0
2000
4000
6000
8000
10000
12000
14000
0 5 10 15 20 25 30
De
man
d (Q
ty)
Period (Qtrs)
Demand: Exponential Smoothing5 Year Plot with 2 Year Forecast
Actual Demand Forecasted (Exponential) Demand
0
2000
4000
6000
8000
10000
12000
14000
16000
18000
0 10 20 30
De
man
d (Q
ty)
Period (Qtrs)
Demand: Static Forecast 5 Year Plot with 2 Year Forecast
Actual Demand Forecasted (Static) Demand
0
2000
4000
6000
8000
10000
12000
14000
0 5 10 15 20 25 30
De
man
d (
Qty
)
Period (Qtrs)
Demand: Holt's Method5 Year Plot with 2 Year Forecast
Actual Demand Forecasted (Holt's Method) Demand
0
2000
4000
6000
8000
10000
12000
14000
16000
0 5 10 15 20 25 30
De
ma
nd
(Q
ty)
Period (Qtrs)
Demand: Winter's Method5 Year Plot with 2 Year Forecast
Actual Demand Forecasted Demand (Winters Method)
Clear Data
Static Forecast Chart
MA Forecast Chart
Holt's Forecast Graph
Winter's Forecast Graph
Exponential Forecast Chart
Demand Comparison Summary
Clear DataClear DataClear Data
MAIN
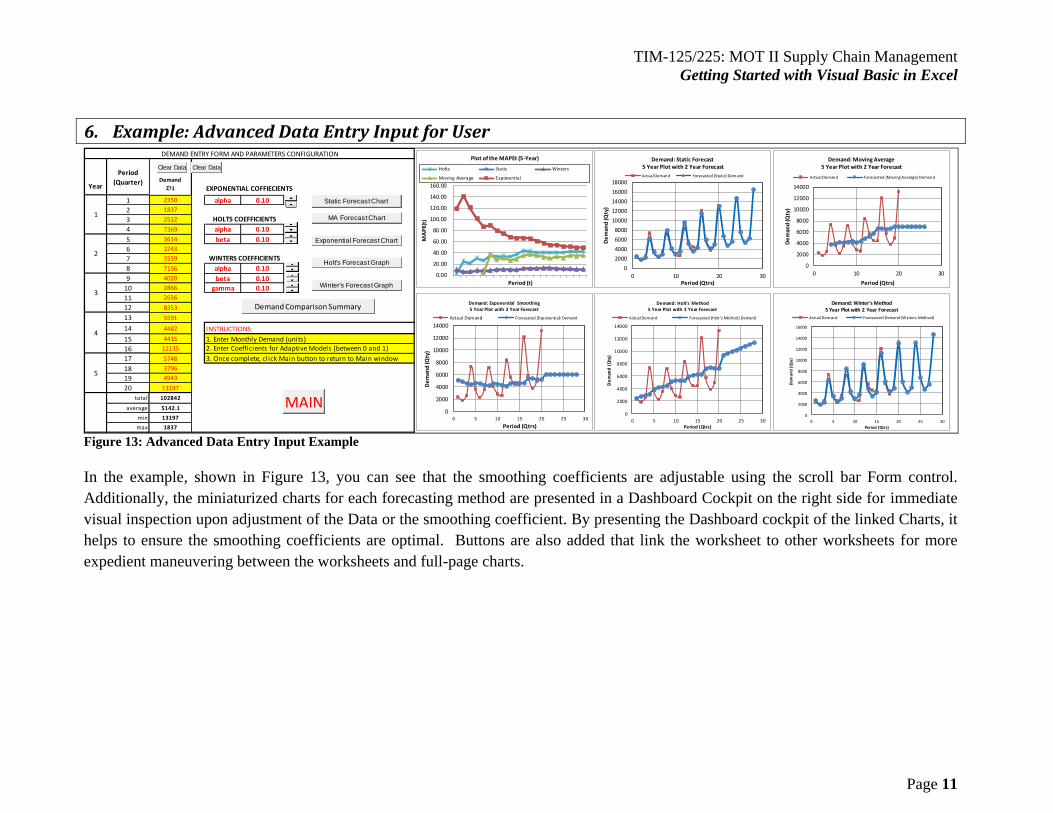
Figure 13: Advanced Data Entry Input Example
In the example, shown in Figure 13, you can see that the smoothing coefficients are adjustable using the scroll bar Form control.
Additionally, the miniaturized charts for each forecasting method are presented in a Dashboard Cockpit on the right side for immediate
visual inspection upon adjustment of the Data or the smoothing coefficient. By presenting the Dashboard cockpit of the linked Charts, it
helps to ensure the smoothing coefficients are optimal. Buttons are also added that link the worksheet to other worksheets for more
expedient maneuvering between the worksheets and full-page charts.
TIM-125/225: MOT II Supply Chain Management
Getting Started with Visual Basic in Excel
Page 12
7. Example: Advanced Chart Output
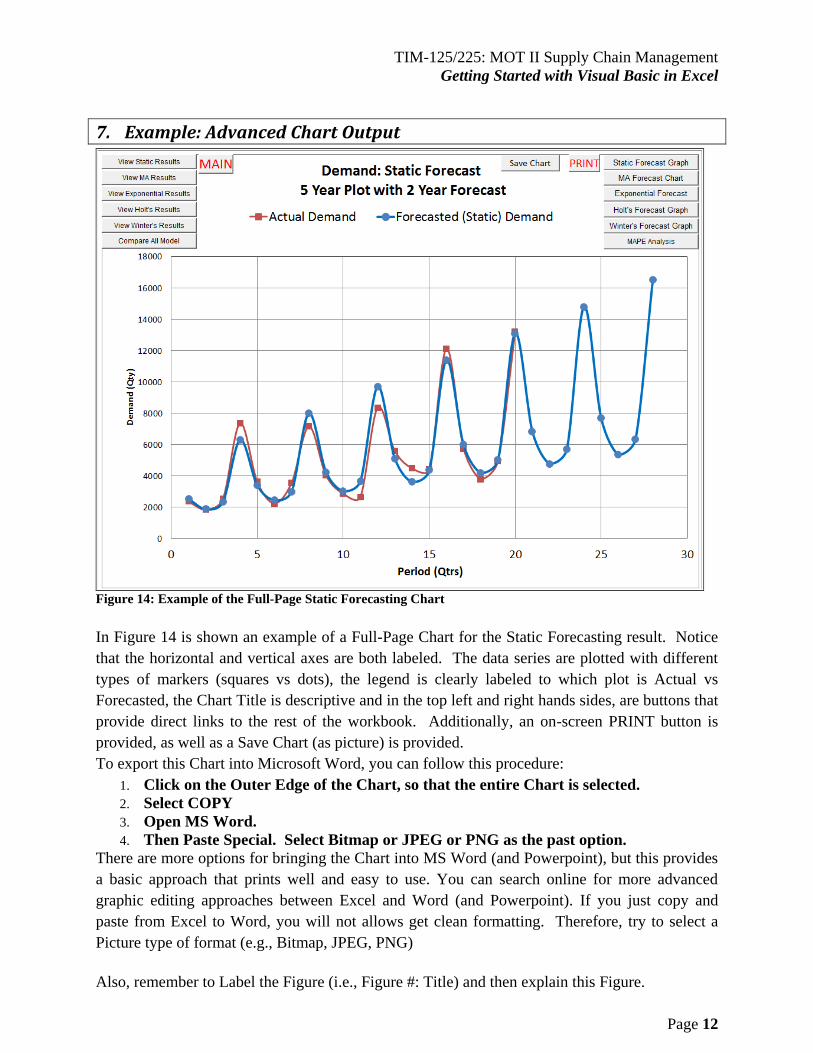
Figure 14: Example of the Full-Page Static Forecasting Chart
In Figure 14 is shown an example of a Full-Page Chart for the Static Forecasting result. Notice
that the horizontal and vertical axes are both labeled. The data series are plotted with different
types of markers (squares vs dots), the legend is clearly labeled to which plot is Actual vs
Forecasted, the Chart Title is descriptive and in the top left and right hands sides, are buttons that
provide direct links to the rest of the workbook. Additionally, an on-screen PRINT button is
provided, as well as a Save Chart (as picture) is provided.
To export this Chart into Microsoft Word, you can follow this procedure:
1. Click on the Outer Edge of the Chart, so that the entire Chart is selected.
2. Select COPY
3. Open MS Word.
4. Then Paste Special. Select Bitmap or JPEG or PNG as the past option.
There are more options for bringing the Chart into MS Word (and Powerpoint), but this provides
a basic approach that prints well and easy to use. You can search online for more advanced
graphic editing approaches between Excel and Word (and Powerpoint). If you just copy and
paste from Excel to Word, you will not allows get clean formatting. Therefore, try to select a
Picture type of format (e.g., Bitmap, JPEG, PNG)
Also, remember to Label the Figure (i.e., Figure #: Title) and then explain this Figure.
TIM-125/225: MOT II Supply Chain Management
Getting Started with Visual Basic in Excel
Page 13
Additional Web References:
http://excelsemipro.com/2010/11/excel-2011-ribbon-screen-shots/
http://www.youtube.com/watch?v=8DjUCUY9xOg
http://www.sjsu.edu/depts/geography/resource/swdocs/xl-guide/edit/celref.htm
http://peltiertech.com/Excel/SolverVBA.html


![Skaffold - storage.googleapis.com · [getting-started getting-started] Hello world! [getting-started getting-started] Hello world! [getting-started getting-started] Hello world! 5.](https://static.fdocuments.in/doc/165x107/5ec939f2a76a033f091c5ac7/skaffold-getting-started-getting-started-hello-world-getting-started-getting-started.jpg)


